Impact Factor
- Issue 13; 2026
- Issue 12; 2026
- Issue 11; 2026
- Issue 10; 2026
- Issue 9; 2026
- Volume 16; 2026
- Advance Articles
- Past Issues
- Cover Images
- Cover Suggestion
- Index & Coverage
- Special Issues
Introduction
Materials and Methods
Results
Discussion
Abbreviations
Acknowledgements
Supplementary Material
References
International Journal of Biological Sciences
International Journal of Medical Sciences
 Global reach, higher impact

Theranostics 2017; 7(16):3889-3900. doi:10.7150/thno.20041 This issue Cite
Research Paper
Overexpression of miR-194 Reverses HMGA2-driven Signatures in Colorectal Cancer
Hsin-Yi Chang1, 2*, Shu-Ping Ye1*, Shiow-Lin Pan1, Tzu-Ting Kuo1, Bia Chia Liu1, Yi-Lin Chen1, Tsui-Chin Huang1 ![]()
1. The Ph.D. Program for Cancer Biology and Drug Discovery, College of Medical Science and Technology, Taipei Medical University, Taipei, Taiwan;
2. Graduate School of Pharmaceutical Sciences, Kyoto University, Japan.
* These authors contributed equally to this work.
Received 2017-3-12; Accepted 2017-7-24; Published 2017-9-5
Abstract

Colorectal cancer (CRC) is one of the leading causes of cancer death worldwide with increasing incidence and mortality in developed countries. Oncogenes and microRNAs regulate key signaling pathways in CRC and are known to be deregulated. Oncogenic transcriptional regulator high-mobility group AT-hook 2 (HMGA2) participates in the transformation of several cancers including CRC and exhibits strong correlation with poor prognosis and distal metastasis. Evidence of HMGA2 and its co-regulated miRs contributing to tumor progression remains to be clarified.
Methods: We performed gene-set enrichment analysis on the expression profiles of 70 CRC patients and revealed HMGA2 correlated genes that are targeted by several miRs including miR-194. To eliminate the oncogenic effects in HMGA2-driven CRC, we re-expressed miR-194 and found that miR-194 functions as a tumor suppressor by reducing cell proliferation and tumor growth in vitro and in vivo.
Results: As a direct upstream inhibitory regulator of miR-194, overexpression of HMGA2 reduced miR-194 expression and biological activity, whereas re-expressing miR-194 in cells with high levels of HMGA2 impaired the effects of HMGA2, compromising cell survival, the epithelial-mesenchymal transition process, and drug resistance.
Conclusion: Our findings demonstrate that novel molecular correlations can be discovered by revisiting transcriptome profiles. We uncover that miR-194 is as important as HMGA2, and both coordinately regulate the oncogenesis of CRC with inverted behaviors, revealing alternative molecular therapeutics for CRC patients with high HMGA2 expression.
Keywords: HMGA2, miR-194, gene-set enrichment analysis, colorectal cancer, drug resistance.
Introduction
Cancer is the major cause of death, and colorectal cancer (CRC) is one of the leading causes of cancer death worldwide [1]. Statistical analysis shows that both incidence and mortality of CRC are higher in developed countries than in developing countries, suggesting that not only genetic but also environmental factors play critical roles during the tumorigenesis of CRC [2]. Dysregulation of multiple molecular markers including APC, KRAS, PIK3CA, TP53, and SMAD4 have been proposed to contribute to CRC development and aggressiveness [3].
MicroRNA (miRNA) is a family of conserved, small RNA (18-25 nucleotides in length) that can posttranscriptionally regulate target gene expression through mRNA degradation or translational repression [4]. Several miRNAs have been revealed to be dysregulated in CRC patients, and the biological importance of miRNAs in CRC development including genesis, progression, and response to chemotherapy has been highlighted in many studies [5]. Aberrations of miRs involved in CRC tumorigenesis include overexpression of miR-21 and miR17-92 cluster, and downregulation of miR-145, miR-143, miR-181, let-7, miR-34, miR-9, miR-31, miR-182, and the miR-200 family [6-10]. These studies have shown that proteins involved in CRC-related signaling pathways, such as Wnt/β-catenin, PI3K/Akt, KRAS activation, p53 inactivation, and epithelial-mesenchymal transition (EMT) are affected by miRNA regulation, suggesting a high correlation between miR deregulation and CRC development.
High-mobility group AT-hook 2 (HMGA2), a transcriptional regulating factor, contains three basic DNA-binding domains (AT-hooks) that bind to adenine-thymine (AT)-rich regions of DNA. HMGA2 alters the DNA structure and promotes accessibility of transcription factors to their targeting regions, both in activation and repression. Expression of HMGA2 is only detected in early development stages and has been documented to modulate adipogenesis, control mesenchymal differentiation, and induce benign mesenchymal tumors [11, 12]. Recent studies demonstrate that HMGA2 is critical for the transformation of several cancers, including colorectal cancer [13]. However, the detailed molecular mechanism of how HMGA2 functions remains limited, especially in the regulation of miRs contributing to oncogenesis and the onset of metastasis. In the present study, we uncover several HMGA2-correlated miRs and demonstrate that HMGA2-downregulated miR-194 is a tumor suppressor miR that limits cell proliferation and migration and promotes anticancer drug sensitivity in CRC.
Materials and Methods
Gene set enrichment analysis (GSEA)
To identify HMGA2-correlated miR regulations, we applied GSEA [14] according to HMGA2 expression for revealing miR target gene signatures. Data sets were obtained from Gene Expression Omnibus (GSE9348 [15]) and ranked based on mean expression level of HMGA2 probes. Correlation of HMGA2 and the miR target gene set was considered significant based on a false discovery rate (FDR) of < 0.25 as suggested in [14]. The normalized enrichment score (NES) is reported in Table S1.
Cell culture and drug treatment
HCT116 and DLD1 cells were obtained from the American Type Culture Collection (ATCC) and maintained as ATCC suggested. Oxaliplatin (Cayman Chemicals, Ann Arbor, MI, USA), irinotecan (Cayman Chemicals, Ann Arbor, MI, USA), and 5-fluorouracil (Sigma Aldrich) were prepared in DMSO as stocks and diluted in medium to a final concentration as indicated in the figures, with a final DMSO concentration of 0.1%. 2000 cells were seeded onto 96-well plates overnight and treated with drugs for 72 h. Cell viability was determined by colorimetric MTS assay (CellTiter 96 Aqueous One Solution cell proliferation assay; Promega, Madison, WI, USA) at 490 nm with an Epoch Microplate Spectrophotometer (BioTek Instruments, Winooski, VT, USA).
Stable expression of miRNA
Human miR-194 (has-miR-194) was constructed into a pmR-ZsGreen1 miRNA expression vector (Clontech, Mountain View, CA, USA) using 5'- ATCTCGAGCAGCGTTTCAAATCTACCAGTCC-3' and 5'- CTCGGATCCTGGATCTTTTTGGTGTTACAAAACT -3'. pmR-ZsGreen1-miR194 or control vectors were transiently transfected into HCT116 cells using lipofectamine 3000 (Invitrogen, Carlsbad, CA, USA). Stable clones were selected using 0.5 mg/mL G418 (BioShop Canada, Burlington, ON, Canada) for two weeks, and the expression of miR-194 was confirmed by qPCR as described below.
Overexpression of HMGA2
To overexpress HMGA2, 2.5 µg pCMV6-HMGA2-AC-GFP or empty control vectors (gifts from Dr. Pei-Ming Yang, Taipei Medical University) were transfected into 2.5 x 10⁵ DLD1 cells on 6-well plates with lipofectamine 3000 (Invitrogen) and the expression level was confirmed at the mRNA and protein levels.
Transient and stable gene silencing
To knock down HMGA2, 30 nM specific siRNA targeting HMGA2 (5'- CGCCAACGUUCGAUUUCUATT-3', GenePharma, Shanghai, China) or scramble control were transfected into HCT116 cells using lipofectamine 3000 for 48 h and the expression level of HMGA2 was verified by qPCR.
To silence expression of VAPA, lentiviral shRNA (National RNAi Core Facility of Academia Sinica, Taipei, Taiwan) was used to infect HCT116 cells. Briefly, pseudovirions were produced from pseudovirion-packaging 293T cells co-transfected with pCMVΔR8.91, pMD.G, and pLKO.1-shVAPA (TRCN0000293261, 5'-GCGAAATCCATCGGATAGAAA-3' or TRCN0000293262, 5'-TTTGTGTGTACAGCGTCATAT-3') or negative control (NC) pLKO.shLacZ (TRCN0000231685, 5'-GTTCCGTCATAGCGA-3') using jetPRIME reagent (Polyplus-Transfection Inc., New York, NY, USA). 5 x 10⁴ HCT116 cells were seeded in 24-well plates and infected with 0.3 mL 293T cell-packaged pseudovirion by centrifugation at 2500 rpm for 30 min and filtered through a 0.45 µm PVDF membrane (Millipore, Billerica, MA). The infected cells were subsequently cultivated in fresh Dulbecco's Modified Eagle Medium with 10% fetal bovine serum and selected with 1 µg/mL puromycin for two weeks. Expression of VAPA was confirmed at the mRNA and protein levels.
Real-time qPCR
Cells were harvested using TRIzol (Life Technologies, Inc., Rockville, MD, USA) and total RNA was extracted according to the user manual. RNA quality and quantity were confirmed by the integrity of 18S/28S rRNA ratio using an Epoch Microplate Spectrophotometer (BioTek Instruments). mRNA was reverse transcribed into cDNA by RevertAid™ H Minus First Strand cDNA Synthesis Kit (Fermentas), and miRNA was adenylated and reverse transcribed into cDNA using Mir-X miRNA first-strand synthesis and SYBR qRT-PCR kit (Takara Bio Inc., Otsu, Japan). Primers were designed for detecting specific gene expression as listed in Table S2. Ct values of gene expression and miR-194 level were normalized to GAPDH and RNU44, respectively. Data is shown as the standard deviation (SD) of the mean from three independent experiments.
Western blot analysis
Cells were harvested and lysed in RIPA buffer (Bioman Scientific Co., Ltd., New Taipei City, Taiwan) containing the 1 X Halt Protease and Phosphatase Inhibitor Cocktail (Thermo Fisher, Waltham, MA). Protein concentration was determined using the T-Pro BCA Protein Assay Kit (T-Pro biotechnology, Taipei, Taiwan). Protein samples were separated by SDS-PAGE, transferred onto PVDF membranes (Millipore) and blocked with Block PRO blocking buffer (Visual Protein Biotechnology Corporation, Taipei, Taiwan). Blot was incubated with primary antibody followed by incubation of horseradish peroxidase conjugated secondary antibodies. Protein level was determined by enhanced chemiluminescence (Advansta, Menlo Park, CA, USA) detection. Antibodies probing HMGA2 (GeneTex Inc., San Antonio, TX), E-cadherin (CST Inc., Danvers, MA, USA), Lin-28A (CST Inc.), Twist1/2 (CST Inc.), β-CATENIN (CST Inc.), VIMENTIN (CST Inc.), SNAIL (CST Inc.), VAPA (GeneTex Inc., San Antonio, TX), and β-ACTIN (Millipore) were used.
Immunofluorescence analysis
Cells were grown on cover slips, washed with phosphate-buffered saline (PBS), fixed in 4% paraformaldehyde in PBS for 15 min at room temperature, washed twice with PBS, and then permeabilized with 0.25% Triton X-100 in PBS for 10 min. Cells were subsequently incubated with the blocking reagent (10% bovine serum albumin in PBS) for 30 min at room temperature. Cells were then incubated overnight at 4°C with anti- β-CATENIN (CST Inc.), followed by Alexa-594 conjugated anti-mouse IgG or rhodamine-phalloidin at room temperature for 30 min, and mounted with the ProLong Gold antifade reagent with DAPI (Life technologies). Fluorescence signals and bright-field images were captured using an inverted fluorescence microscope with an objective (HCX FL PLAN 100 X 1.25 Oil, Leica) and Q-Capture Pro 7 Image and Analysis Software (Media Cybernetics, Bethesda, MD, USA).
Subcutaneous xenograft tumor model
Athymic nu/nu female mice (BALB/cAnN.Cg-Foxn1nu/CrlNarl), 4-5 weeks of age, were obtained from the National Laboratory Animal Center (Hsinchu, Taiwan) after obtaining appropriate institutional review board permission and were maintained in pathogen free conditions. The animal protocol was approved by the Institutional Animal Care and Use Committee of the Taipei Medical University (LAC-2013-0139). The animals were subcutaneously implanted with 1 x 10⁷ HCT116 cells (stably expressing ZsGreen1-miR-194 or ZsGreen1) in 0.1 mL PBS and 0.1 mL Growth Factor Reduced Matrigel Matrix (BD Bioscience, Bedford, MA, USA). The tumor size was measured for 3 weeks every 3 days by a caliper and the volume was calculated according to the formula: (length x width2)/2. Tumor samples were resected, fixed with formalin, embedded in paraffin for immunohistochemistry analysis and stained with hematoxylin and eosin (H&E staining) followed by microscopic evaluation.
Colony formation assay
Cells were seeded onto six-well plates at a concentration of 500 cells per well. Cells were cultured for 10 days with medium refreshed every three days until colonies formed. The colonies were fixed in methanol and stained with 1:10 Giemsa (Sigma-Aldrich). Colonies with a diameter greater than 100 μm were counted using ImageJ Software.
Luciferase Reporter Assays
For accessing VAPA as a miR-194 target, VAPA 3'UTR was cloned into pMIR-REPORT vector (Ambion, Austin, TX, USA) with restriction enzymes SpeI and MluI using primers 5'-ACTAGTGAAGCATGCAGAGTGCTG-3' and 5'-ACGCGTACTTTGCAAAACTTTATTTTG-3'. Luciferase reporter fused with 3'UTR of VAPA was applied to verify the inhibitory effect of miR-194. Cells stably overexpressing HCT116ZsGreen1-miR194 were seeded onto 24-well plates and transfected with 30 nM miR-194 inhibitor or NC on the following day for 24 h. Subsequently, cells were co-transfected with 200 ng pMIR-REPORT-VAPA-3'UTR and 200 ng pMIR-reporter β-gal control plasmid (Ambion, Austin, TX, USA) for 24 h. Luciferase and β-galactosidase activity were quantified using luciferase and β-galactosidase dual reporter assays according to the manual instructions (Applied Biosystems). The level of luciferase activity was measured with an Epoch microplate spectrophotometer (BioTek Instruments, Inc., Winooski, VT, USA) and normalized to that of transfection control β-galactosidase luciferase.
Statistical analysis
All experiments were performed at least three times independently. Data is expressed as mean ± SD. Unpaired two-tailed t tests were used for the comparison of two groups and P-values < 0.05 were considered significant.
Results
Correlation analysis of gene expression reveals HMGA2-associated tumor suppressor miRs
To understand the correlation between HMGA2 and miRs, we performed gene set enrichment analysis (GSEA) [14] according to HMGA2 gene expression by analyzing gene expression profiles from 70 CRC patients. The distribution of HMGA2 correlated genes is shown in Figure S1. 371 genes were positively correlated with HMGA2 (Pearson correlation coefficient (PCC) ≥ 0.4) and were functionally enriched in pathways involved in human cancer (hsa05200, adj. P-value = 0.01875) and embryonic morphogenesis (GO:0048598, adj. P-value = 0.003409). Additionally, we overexpressed HMGA2 in the low HMGA2-expressing CRC cell line DLD1 and confirmed that HMGA2 promotes colony forming ability (Figure S2), suggesting that HMGA2 plays an oncogenic role in CRC development. Targets of several miRNAs showed marked correlation in expression levels with HGMA2 (Table S1), implying that HMGA2-mediated transcriptional regulations or miR regulated HMGA2 expression might occur. Additionally, most of the enriched genes with positive correlation to HMGA2 expression were targeted by tumor suppressor (TS) miRs, with five out of the top 22 enriched miRs (NES > 1.85) targeting HMGA2. Here, we reveal a possible oncogenic role of HMGA2 that suppresses TS miRNAs and reactivates their target genes.
HMGA2 and miR-194 is negatively expressed in CRC
To evaluate the regulatory route between miRs and HMGA2 expression, we focused on miR-194-5p, an miR demonstrating both oncogenic and tumor suppressing activities in cancers [16]. The observed positive correlation between HMGA2 and target genes of miR-194-5p (Figure 1), implies a negative correlation in expression between HMGA2 and miR-194. Therefore, we investigated whether the expression levels of HMGA2 and miR-194 are correlated. Among CRC cell lines in the CellMiner database and in our lab, we found that the expression levels of HMGA2 and miR-194 are negatively correlated (Figure 1I and S3, PCC = -0.85 and -0.82, respectively), showing that the correlation we observed in gene expression between HMGA2 and miR-194 targets also applies to the level of miR-194.
Bioinformatics analysis on gene expression profiles revealed HMGA2 expression is correlated with miR-194 target genes. (A) GSEA of correlation between miR-194 target genes and HMGA2 correlated genes. (B) Heatmap shows the top miR-194-regulated genes with positive enrichment in HMGA2 highly expressed samples. To unveil the relationship between miR-194 and HMGA2, low HMGA2 expressing DLD-1 cells (C and D) were utilized for HMGA2 overexpression, and high HMGA2 expressing HCT116 cells (E to H) were used for HMGA2 knockdown or miR-194 overexpression. The expression levels of HMGA2 and miR-194 were confirmed (C, E, and G), and the corresponding levels of miR-194 and HMGA2 were determined (D, F, and H). *P-value < 0.05; **P-value < 0.01; ***P-value < 0.001. (I) Correlation between HMGA2 and miR-194 expression in CRC cell lines in CellMiner database. (J) Chromatin immunoprecipitation was performed to examine the HMGA2 bound DNA sequences. Primers amplifying sequences of miR-194-1 and miR-194-2 promoters were utilized to inspect whether HMGA2 directly regulates miR-194 expression. Input DNA and immunoprecipitation from IgG isotype were used as positive and negative controls, respectively.
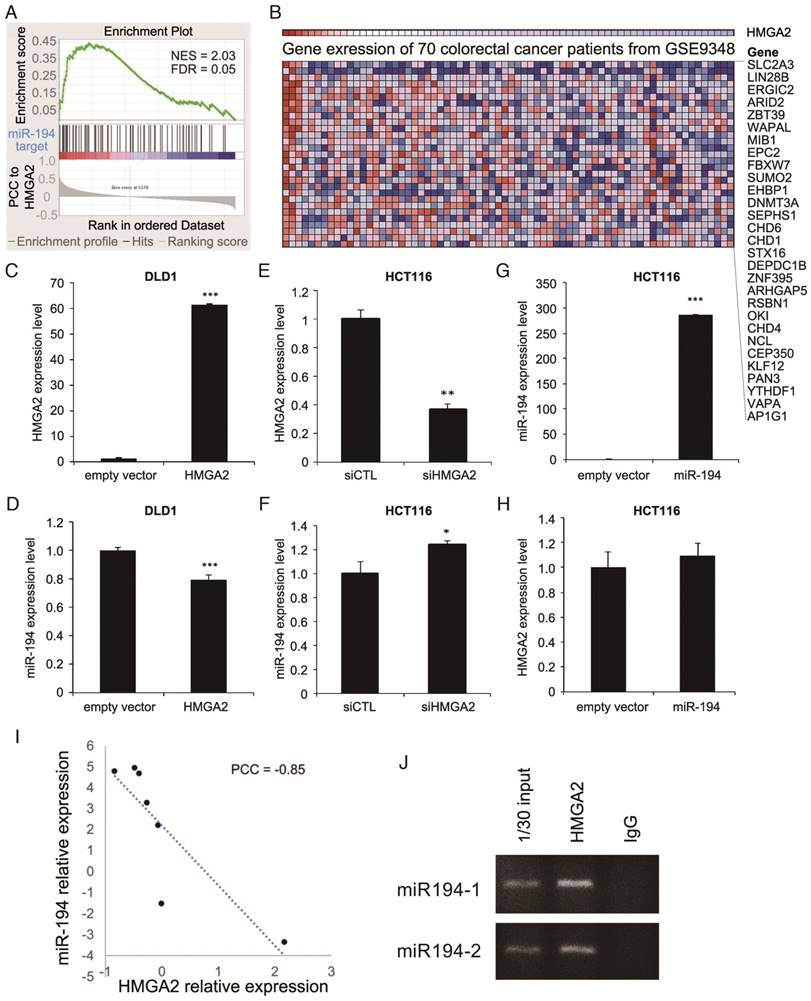
HMGA2 negatively regulates miR-194 expression in CRC cells
Next, we wanted to know how the correlated expression of HMGA2 and miR-194 is regulated. To determine whether the negative correlation between HMGA2 and miR-194 is caused by HMGA2 as an upstream effector to regulate miR-194 expression or as a downstream target of miR-194, we manipulated the levels of HMGA2 or miR-194 in CRC cells. Ectopic HMGA2 was introduced in low HMGA2-expressing DLD1 (Figure 1C), while HMGA2 knockdown (Figure 1E) and miR-194 overexpression (Figure 1G) were performed in HCT116 cells where HMGA2 expression is relatively high and miR-194 is low. We revealed that HMGA2 negatively regulated miR-194 expression (Figure 1D and 1F), but was not affected by the level of miR-194 (Figure 1H), indicating that HMGA2 might be an upstream regulator of miR-194. To verify whether HMGA2 directly regulates miR-194 expression, we performed chromatin immunoprecipitation of HMGA2 and examined whether it binds to miR-194 promoters. There are two miR-194 genomic loci, miR-194-1 and miR-194-2, transcribing miR-194. We designed primers for detecting the promoter regions located upstream of conventional transcriptional starting sites of miR-194-1 and miR-194-2 (Table S2). We demonstrated that HMGA2 binds to the upstream promoters of both miR-194 loci (Figure 1J), suggesting direct physical regulation of HMGA2 on miR-194 expression.
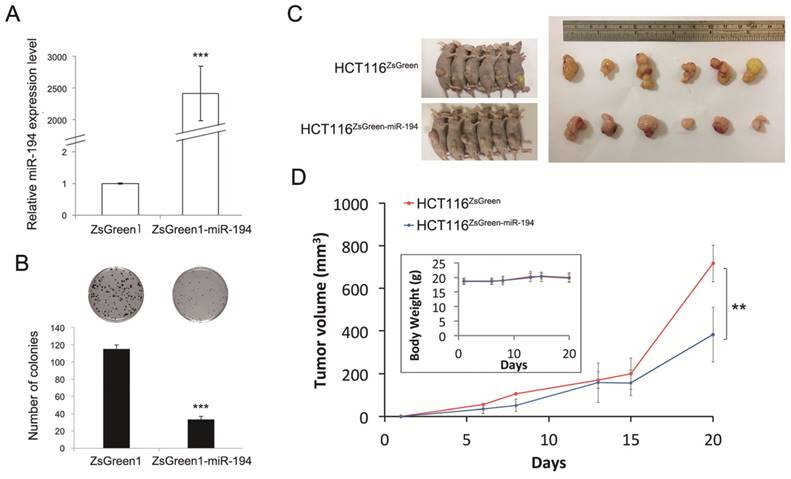
miR-194 reduces cell growth in vitro and in vivo
miR-194 was reported as a tumor suppressor gene as well as an onco-miR in various cancers [16-20]. To understand the function of miR-194 in CRC, we next investigated the effects of miR-194 on cell proliferation. We first generated ZsGreen1-miR-194 and ZsGreen1 overexpressing HCT116 stable clones (Figure 2A), and we found that overexpression of miR-194 significantly reduced the colony forming ability (Figure 2B, P-value < 0.001) and tumor growth (Figure 2C, P-value < 0.01) without affecting the body weight of the mice (upper-left panel in Figure 2D). Taken together, we suggest that miR-194 plays a role as tumor suppressor in CRC.
Effects of miR-194 in vitro and in vivo models using stable HCT116 cells transfected with pmR-ZsGreen1 or pmR-ZsGreen-miR-194. (A) Relative expression level of miR-194 was determined by qPCR and normalized to RUN44 and ZsGreen1 control. (B) Visible cell colonies were formed, fixed by methanol, stained with Giemsa, and counted from three replicates. (C) Nude mice were subcutaneously injected with HCT116 cells with stably expressing ZsGreen1 or ZsGreen1-miR-194. (D) Tumor growth was measured for 20 days. Data is shown as mean ± SD (n = 6), **P-value < 0.01, ***P-value < 0.001 by Student's t-test.
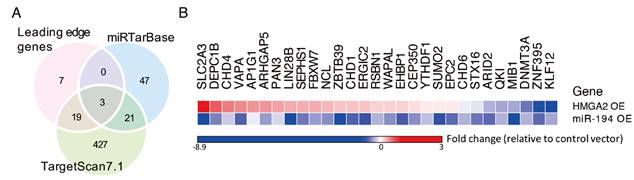
Several potential targets of miR-194 are regulated in CRC cells
By GSEA, gene expression profiles from CRC patients were ranked according to their correlation to the HMGA2 level, and an enrichment score for each miR target gene set was calculated (Table S1). We showed that miR-101, miR-194, and miR-499 were the top 3 enriched miRs with significant normalized enrichment scores (FDR < 0.25). Among 93 predicted miR-194 targets, 29 genes positively correlated to HMGA2 level as the leading edge genes from GSEA for miR-194 targets (Figure 1B). To provide confidence that those 29 genes are miR-194 targets, we compared them to the target lists from two miR target databases, TargetScan and miRTarBase (Figure 3A). DNMT3A, EPC2 and ARID2 were the overlapping genes in three groups. 19 genes were also documented in TargetScan, and seven genes were only recorded in MSigDB of GSEA. To confirm whether these genes are targets of miR-194, we measured their mRNA levels in miR-194 or upstream regulator HMGA2 transfected HCT116 cells (Figure 3B). We demonstrated that out of 29 leading edge genes, 21 genes exhibited negative expression trends in HMGA2 and miR-194 overexpressing cells, showing the reliability of HMGA2-miR-194 regulation.
Several potent miR-194 targets were negatively regulated by miR-194 overexpression. (A) Venn diagram shows overlap of miR-194 targets from GSEA leading genes and two miR-target databases, miRTarBase and TargetScan7.1. To investigate the inhibitory effects of miR-194 and upstream regulator HMGA2, cells were transfected with miR-194 or HMGA2 expressing vector transiently. The relative gene expression of leading edge genes was measured and normalized to GAPDH level and empty vector control. Data was expressed in fold change with upregulation and downregulation in red and blue, respectively.
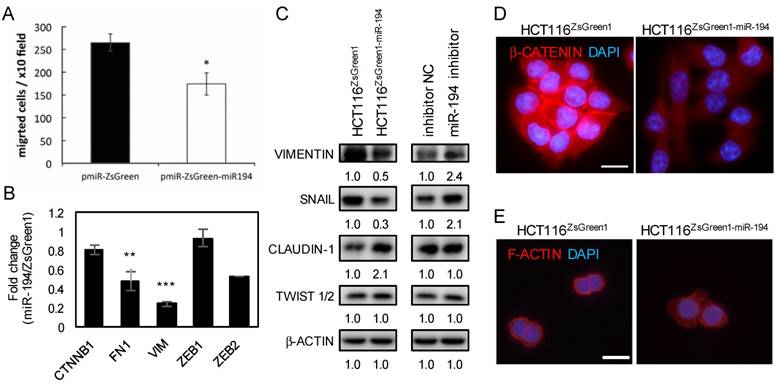
miR-194 diminishes cell migratory ability and reduces EMT
While overexpressing miR-194, we noticed that the cells exhibited an epithelium-like and well-spread morphology. The nuclear-cytoplasmic ratio (N/C ratio) usually accounts for the index of cell maturity, and an increased N/C ratio is common in malignant cells. To visualize the N/C distribution in miR-194-overexpressing cells, we stained F-actin and nuclei and demonstrated a decreased N/C ratio by increased proportion of cytoplasm (Figure 4E). To further confirm the tumor suppressor role of miR-194 in metastasis, we assessed the cell migratory ability of miR-194-overexpressing cells and showed that the cell mobility was reduced (Figure 4A and S4A). Since HMGA2 regulates mesenchymal differentiation during development, we sought to inspect whether the HMGA2-suppressed miR-194 was involved in EMT. By measuring mesenchymeal and epithelial markers, we found that miR-194 overexpression markedly diminished the Twist1/2 level and boosted E-cadherin expression (Figure S5B), showing that miR-194 overexpression is involved in EMT inhibition in CRC. Furthermore, expression of E-cadherin was restored by miR-194 inhibitor (Figure 4D), implying that miR-194 is an upstream regulator for EMT and cell migration.
miR-194 abolished cell migratory activity. The effect of stable transfection of miR-194 in HCT116 cells was investigated. (A) HCT116ZsGreen and HCT116ZsGreen-miR-194 cells were seeded into transwell culture plates. The migrated cells were stained and calculated from ten randomly selected fields per well. Three independent wells were averaged and shown with SD. * P < 0.05. (B) The effect of stable transfection of miR-194 on EMT markers was measured at the mRNA level. Data was normalized to the expression level of GAPDH and compared to HCT116ZsGreen using the ddCt method. (C) The effect of stable transfection of miR-194 on EMT markers was measured at the protein level. β-Actin was used as an internal control. (D) β-CATENIN (red) or (E) F-actin (Rhodamine phalloidin, red) and nucleus (DAPI, blue) were monitored by fluorescence microscopy. Bar indicates 100 μm.
miR-194-downregulated VAPA expression is recovered by miR-194 inhibition
VAPA, an endoplasmic reticulum (ER) membrane protein, regulates R-RAS signaling, downstream AKT phosphorylation, and β1-integrin activity when recruited to plasma membrane by OSBP-related protein 3 [21]. Due to the negative correlation between miR-194 and VAPA in CRC cells (Figure 5A, 5B and S6) and the complimentary sequences between VAPA 3'UTR and miR-194 (Figure 5G), we inferred that VAPA might be regulated by miR-194. To confirm this, we transfected miR-194 inhibitor into two cell lines, a subline of HCT116 with stable overexpression of miR-194 (Figure 5C) and SW620 with high expression of endogenous miR-194 (Figure 5B and S7A). Using miR-194 inhibitor, we observed that VAPA was restored in both cells at the level of mRNA (Figure 5D and S7B) and protein both transiently (Figure 5E) and stably (Figure 5F), suggesting that VAPA might be a direct target of miR-194.
VAPA is a target of miR-194. Expression levels of (A) VAPA and (B) miR-194 in CRC cells were obtained from CellMiner. Expression of (C) miR-194, (D) VAPA mRNA, and (F) VAPA protein in miR-194 inhibitor transfected HCT116ZsGreen-miR-194 cells were measured and compared with those of scramble NC. Protein level of VAPA was assessed in mock control, ZsGreen, and ZsGreen-miR-194 (E) transiently and (F) stably transfected HCT116 cells. (G) The nucleotide sequence complement to nt 2-12 of miR-194 in the 3' UTR of VAPA and deletion sites targeted by the miR-194 seed region. (H) Different doses of luciferase reporters containing 3'UTR of the VAPA gene (pMIR-Luc-VAPA 3'UTR) balanced with control vector and internal control β-galactosidase reporter were used, cotransfected with pmR-ZsGreen1-miR-194 into HCT116 cells (Black bars). Comparison of the miR-194 targeting efficacy on wild type VAPA 3'UTR and 3'UTR deleted miR-194 targeted sequence (White bars). Dual-light reporter assay was performed and compared with cells transfected with control pMIR. Analysis of variance (ANOVA) test was performed to analyze the differences among groups. (I) Schematic representation of mechanism for miR-194 inhibition of luciferase activity through targeting VAPA 3'UTR. (J) VAPA mRNA levels of shRNA knockdown of VAPA in HCT116 cells. shRNA targeting lacZ (shlacZ) was used as a non-targeting shRNA NC. (K) Colony forming ability of VAPA shRNA knockdown cells compared to shlacZ control. * P < 0.05; *** P < 0.001.
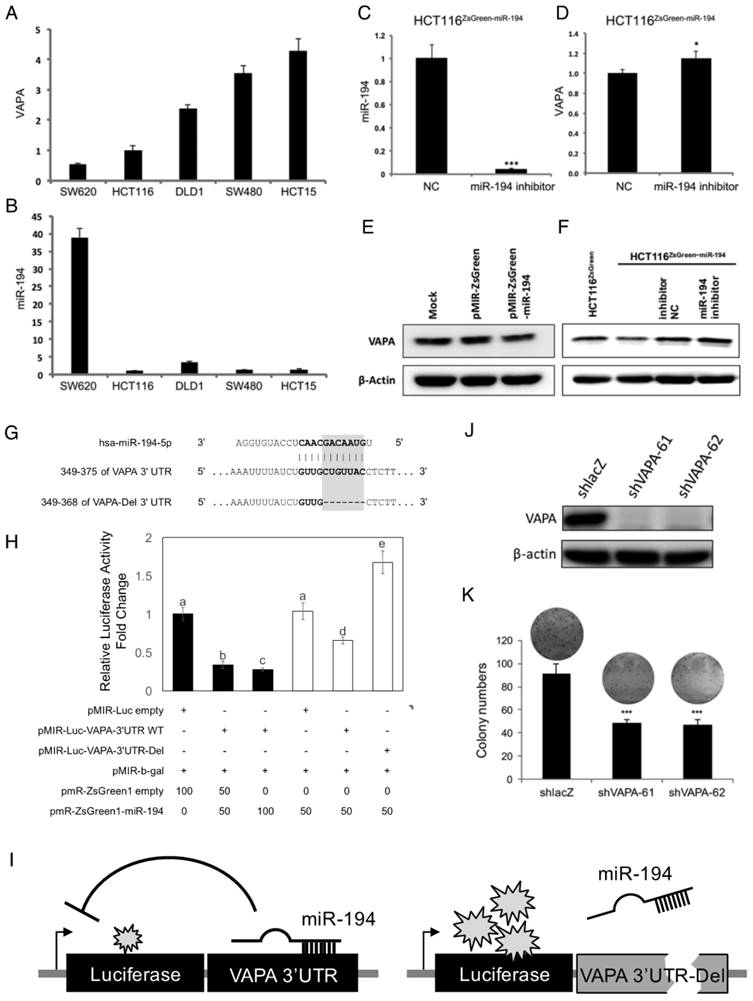
VAPA is a direct target of miR-194
miR-194 regulation of VAPA and their sequence complementarity indicated the possibility of VAPA as a direct target of miR-194 (Figure 5 and S7). Therefore, we cloned the 3'UTR of the VAPA gene into the luciferase assay reporter vector and transfected together with β-galactosidase reporter and miR-194-expressing vector or empty control into HCT116 cells to validate the relationship. The normalized luciferase activity of pMIR-VAPA 3'UTR was compared with empty vector. We demonstrated that miR-194 inhibited luciferase activity by targeting VAPA 3'UTR in a dose-dependent manner (black bars in Figure 5H). Furthermore, co-transfection of miR-194 inhibitor with pMIR-VAPA 3'UTR into HCT116ZsGreen1-miR-194 cells recovered miR-194 expression and caused luciferase inhibition, confirming that the decreased activity in VAPA 3'UTR containing luciferase was due to targeting and inhibition by miR-194 (Figure S8). To further check whether VAPA is a real target of miR-194, we deleted the binding sequence predicted for miR-194 seed region according to TargetScan database (VAPA-Del 3'UTR in Figure 5G). Luciferase activity was recovered in cells transfected with VAPA-3'UTR-Del compared with wild type 3'UTR (white bars in Figure 5H).
To verify the role of VAPA in cell proliferation, we applied specific shRNAs for VAPA knockdown (Figure 5J) to avoid the broad gene inhibitions of miR-194. Knockdown of VAPA showed decreased colony formation both in number and size in comparison with control shRNA (Figure 5K), suggesting that VAPA is one target of miR-194 that impedes cell proliferation.
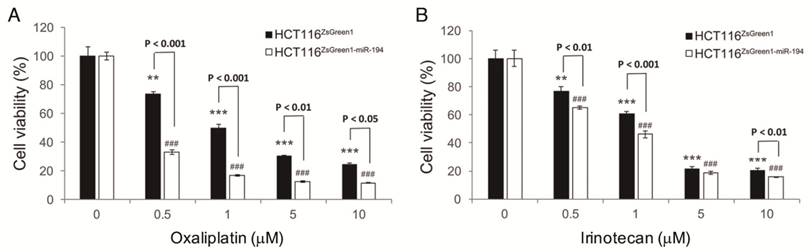
Overexpression of tumor suppressor miR-194 sensitizes CRC cells to chemotherapy
Acquired drug resistance in colorectal cancer cells is one of the current issues in treating CRC. To inspect whether miR-194 contributes to drug resistance in CRC, we measured the effects of miR-194 overexpression on the cell viability of HCT116 in response to oxaliplatin and irinotecan. We demonstrated that drug resistant HCT116 was sensitized to both drugs when miR-194 was overexpressed (Figure 6), indicating that miR-194 dysfunction in CRC might be a key regulator in establishing drug resistance.
Enforcement of miR-194 expression sensitized HCT116 to chemotherapy. Cells with stable miR-194 overexpression were subjected to (A) oxaliplatin and (B) irinotecan to measure their sensitivity. Cells were treated for 72 h and their viability was assessed by MTS assay and normalized to the absorbance of a DMSO treated control for each cell clone. ** P < 0.01 and *** P < 0.001 show the differences from vehicle control for HCT116ZsGreen1 cells, while ### P < 0.001 indicates differences from vehicle control for HCT116ZsGreen1-miR-194 cells.
Discussion
HMGA2, an architectural transcription factor belonging to the high mobility group A family, coordinates transcription factor binding to DNA. The level of HMGA2 is tightly controlled and highly expressed during early embryogenesis [22]. Dysregulations or mutations of HMGA2 involves many fundamental cellular processes and contributes to various diseases, such as malignant tumors, obesity, diabetes, and atherosclerosis [23]. Furthermore, HMGA2 is predominantly expressed in malignant epithelial tumors. Ectopic expression of HMGA2 induces EMT and is essential for tumor metastasis [13, 24]. Therefore, investigating the HMGA2 regulated pathways is pivotal for understanding the causes of tumor development.
miRNAs are a group of non-coding small RNA, 22-25 nucleotides in length. Complementary pairing of miRNA to its target genes induces transcriptional or translational inhibitions of gene products. miRNA-associated regulations are involved in broad fundamental processes as well as diseased states. It has been confirmed that HMGA2 is a direct target of tumor suppressor miRNA let-7, and deregulation of let-7 inhibition on HMGA2 contributes to tumorigenesis and metastasis [25]. Except let-7, other tumor suppressor miRNAs, such as miR-490-3p, miR-33a, miR-33b, miR-154, and miR-204, directly target HMGA2 3'UTR and reduce its effects on promoting EMT [26-30]. However, the evidence of HMGA2-regulated miRNAs is limited. An integrative analysis showed that silencing HMGA2 dysregulated the levels of numerous miRNAs in retinoblastoma, showing a potential tuning of HMGA2 associated miRNAs [31].
Recently, overexpression of HMGA2 in CRC patients has been shown to play an important role in developing metastasis and is a potential indicator for poor survivability [13, 32]. Given the functions of HMGA2 and miRNAs in distal metastasis, how these factors correlate with each other remains to be investigated. In this study, we applied GSEA of miRNA directed gene expression in CRC patients and revealed that the expression of target genes for several miRNAs is positively associated with the expression tendency of HMGA2 (Table S1). Among them, miR-196a / miR-196b, miR-490, miR-203, miR-9, and miR-186 are known miRNAs that target HMGA2. The co-occurrence of HMGA2 and genes that are targeted by these miRNAs confirmed the reliability of this analysis. On the other hand, most of the enriched miRNAs were tumor suppressor miRs, implying the oncogenic roles of these HMGA2 co-occurring genes. Whether those miRNA candidates are involved in the progression of CRC patients will be evaluated in the future, especially for particular miRNAs expressed at the invasive front of tumor tissues.
Generally, miR-194 is recognized as a tumor suppressor miR and is often inactivated in most cancers including colorectal cancer [33, 34], and serves as an inhibitor of EMT to prevent metastasis. By targeting N-cadherin (CDH2), heparin-binding epidermal growth factor-like growth factor (HBEGF), and type 1 insulin-like growth factor receptor (IGF1R), mitogen-activated protein kinase kinase kinase kinase 4 (MAP4K4), and AKT serine/threonine kinase 2 (AKT2) [17, 24, 35], miR-194 is a negative regulator in tumor progression, especially during the early onset of distal metastasis [17-19, 34]. Given that miR-194 tends to target oncogenic pathways, however, the oncogenic function of miR-194 has also been reported in promoting angiogenesis by targeting thrombospondin-1 dependent on p53 activation in colon cancer [20] and contributing to tumor progression of pancreatic ductal adenocarcinoma [16], suggesting that versatile regulations of miR-194 in the tumor should be considered. In this study, we demonstrated that miR-194 target genes display concordant expression patterns with oncogenic HMGA2 in CRC, suggesting that miR-194 plays a tumor suppression role (Figure 1 and 3). We further demonstrated that the overall effects of miR-194 overexpression inhibited cell proliferation, reduced xenograft growth, attenuated cell migration, suppressed EMT, and rendered drug resistance, which is in agreement with the tumor suppressor function of miR-194 in CRC (Figure 2, 4, 6, and S4).
The ER anchored protein VAPA regulates the stability of ER tubules connected to microtubules and other membrane systems [36] and the intracellular trafficking of proteins and lipids when interacting with oxysterol-binding protein [37]. Previous studies suggested multiple roles of VAP proteins in vesicle transport including neurotransmitter release [38], GLUT4 plasma membrane trafficking [39], as well as interaction with ER-membrane contact sites (MCSs) [36]. Overexpression of VAPA blocks the ER-to-Golgi transport of membrane proteins by impeding the lateral diffusion of cargo proteins into ER vesicles [40, 41]. In addition to Golgi, VAP proteins have been implicated in tethering different MCSs including mitochondria [42], endosome/lysosome [43], and plasma membrane of yeast homologue Scs2 [44]. Thus, dysregulation in VAP protein expression would disrupt ER distribution, MCS interactions, and protein transportation. In this study, we confirmed that VAPA is one of the miR-194 targets in CRC under the control of HMGA2 (Figure 5E to 5H, S7 and S8). Consistently, inhibition of VAPA by miR-194 or by shRNA reduced cell proliferation, indicating the positive contribution of VAPA to support cell survival (Figure 5J and 5K). In comparison, re-expression of VAPA failed to restore miR-194-reduced cell proliferation (data not shown), which might be due to sustained downregulation of other miR-194 targets that support cell growth. Thus, our finding indicates that miR-194-impaired tumor growth is partially caused by inhibition of VAPA.
What caused the inverse correlation in expression between HMGA2 and miR-194? Although we revealed that altered HMGA2 expression negatively regulates the level of miR-194 via directly binding to miR-194 promoters (Figure 1D to 1I), only about 20% expression was modulated and could not explain the relative marked difference between cells and patients. Therefore, how HMGA2 regulates miR-194 needs to be further investigated. For the inverse correlation, there is one possible scenario through the regulation of EMT inducer transforming growth factor-β (TGF-β). TGF-β, a known downstream transcriptional regulator of HMGA2, binds to its promoter and activates gene expression. Upon TGF-β triggered EMT, HMGA2 is required for downstream signaling, mainly by transactivating the TGF-β receptor and the receptor protein serine/threonine kinase (TGFβRII), which propagates the signal to SMAD3 phosphorylation, causing cells to undergo EMT [22, 32]. In parallel, TGF-β can inhibit the hepatocyte nuclear factor-1α (HNF-1α) induced transcription of miR-194-2 by competing for the binding of transcriptional hetero dimmer co-regulator HNF1β and releasing the promoter region of miR-194-2 [45]. TGF-β modulates HMGA2 and miR-194 at the same time, and as a result coordinates the functions of these two opposing regulators and leads to the promotion of EMT, consistent with our finding of the co-occurrence of HMGA2 and miR-194 target genes.
In conclusion, implementation of GSEA on co-expressed genes in clinical data demonstrated that re-expression of miR-194, which targets HMGA2 co-expressed genes in CRC, can bypass HMGA2-activated EMT and drug resistance, indicating that post-transcriptional regulations by miRs are as important as gene expression alteration in tumor development.
Abbreviations
ANOVA: analysis of variance; AT: adenine-thymine; ATCC: American Type Culture Collection; CRC: colorectal cancer; EMT: epithelial-mesenchymal transition; ER: endoplasmic reticulum; FDR: false discovery rate; GSEA: gene set enrichment analysis; H&E: hematoxylin and eosin; HMGA2: high-mobility group AT-hook 2; HNF-1α: hepatocyte nuclear factor-1α; MCS: membrane contact sites; miRNA: microRNA; NES: normalized enrichment score; N/C: nuclear-cytoplasmic; NC: negative control; PBS: phosphate-buffered saline; PCC: Pearson correlation coefficient; shlacZ: SMAD3: mothers against decapentaplegic homolog 3; shlacZ: shRNA targeting lacZ; SD: standard deviation; TGF-β: transforming growth factor-β; TS: tumor suppressor.
Acknowledgements
We thank Dr. Pei-Ming Yang (Taipei Medical University, Taiwan) for providing DLD1 stably overexpressing HMGA2-GFP or GPF, pCMV6-HMGA2-AC-GFP and pCMV6 vectors. This work is supported by the Comprehensive Cancer Center of Taipei Medical University (health and welfare surcharge of tobacco product, MOHW105-TDU-B-212-134001 and MOHW106-TDU-B-212-144001), the Ministry of Science and Technology of Taiwan (MOST105-2320-B-038-004) and Taipei Medical University (TMU105-Y05-E154).
Supplementary Material
Supplementary figures and tables.
Competing Interests
The authors have declared that no competing interest exists.
References
1. Siegel R, Naishadham D, Jemal A. Cancer statistics, 2012. CA Cancer J Clin. 2012;62:10-29
2. Torre LA, Siegel RL, Ward EM, Jemal A. Global cancer incidence and mortality rates and trends—an update. Cancer Epidemiol Biomarkers Prev. 2016;25:16-27
3. Li CJ, Zhang X, Fan GW. Updates in colorectal cancer stem cell research. J Cancer Res Ther. 2014;10:233-239
4. Bartel DP. MicroRNAs: genomics, biogenesis, mechanism, and function. Cell. 2004;116:281-97
5. Valeri N, Croce CM, Fabbri M. Pathogenetic and clinical relevance of microRNAs in colorectal cancer. Cancer Genomics Proteomics. 2009;6:195-204
6. Nakajima G, Hayashi K, Xi Y, Kudo K, Uchida K, Takasaki K. et al. Non-coding MicroRNAs hsa-let-7g and hsa-miR-181b are Associated with Chemoresponse to S-1 in Colon Cancer. Cancer Genomics Proteomics. 2006;3:317-24
7. Yamamichi N, Shimomura R, Inada K-i, Sakurai K, Haraguchi T, Ozaki Y. et al. Locked nucleic acid in situ hybridization analysis of miR-21 expression during colorectal cancer development. Clin Cancer Res. 2009;15:4009-16
8. Diosdado B, Van De Wiel M, Droste JTS, Mongera S, Postma C, Meijerink W. et al. MiR-17-92 cluster is associated with 13q gain and c-myc expression during colorectal adenoma to adenocarcinoma progression. Br J Cancer. 2009;101:707-14
9. Akao Y, Nakagawa Y, Naoe T. MicroRNA-143 and-145 in colon cancer. DNA Cell Biol. 2007;26:311-20
10. Cekaite L, Rantala JK, Bruun J, Guriby M, Ågesen TH, Danielsen SA. et al. MiR-9,-31, and-182 deregulation promote proliferation and tumor cell survival in colon cancer. Neoplasia. 2012;14:868-IN21
11. Ligon AH, Moore SD, Parisi MA, Mealiffe ME, Harris DJ, Ferguson HL. et al. Constitutional rearrangement of the architectural factor HMGA2: a novel human phenotype including overgrowth and lipomas. Am J Hum Genet. 2005;76:340-8
12. Zaidi MR, Okada Y, Chada KK. Misexpression of full-length HMGA2 induces benign mesenchymal tumors in mice. Cancer Res. 2006;66:7453-9
13. Wang X, Liu X, Li AY-J, Chen L, Lai L, Lin HH. et al. Overexpression of HMGA2 promotes metastasis and impacts survival of colorectal cancers. Clin Cancer Res. 2011;17:2570-80
14. Subramanian A, Tamayo P, Mootha VK, Mukherjee S, Ebert BL, Gillette MA. et al. Gene set enrichment analysis: a knowledge-based approach for interpreting genome-wide expression profiles. Proc Natl Acad Sci U S A. 2005;102:15545-50
15. Hong Y, Downey T, Eu KW, Koh PK, Cheah PY. A 'metastasis-prone'signature for early-stage mismatch-repair proficient sporadic colorectal cancer patients and its implications for possible therapeutics. Clin Exp Metastasis. 2010;27:83-90
16. Zhang J, Zhao C-Y, Zhang S-H, Yu D-H, Chen Y, Liu Q-H. et al. Upregulation of miR-194 contributes to tumor growth and progression in pancreatic ductal adenocarcinoma. Oncol Rep. 2014;31:1157-64
17. Meng Z, Fu X, Chen X, Zeng S, Tian Y, Jove R. et al. miR-194 is a marker of hepatic epithelial cells and suppresses metastasis of liver cancer cells in mice. Hepatology. 2010;52:2148-57
18. Dong P, Kaneuchi M, Watari H, Hamada J, Sudo S, Ju J. et al. MicroRNA-194 inhibits epithelial to mesenchymal transition of endometrial cancer cells by targeting oncogene BMI-1. Mol Cancer. 2011;10:99
19. Wu X, Liu T, Fang O, Leach L, Hu X, Luo Z. miR-194 suppresses metastasis of non-small cell lung cancer through regulating expression of BMP1 and p27kip1. Oncogene. 2014;33:1506-14
20. Sundaram P, Hultine S, Smith LM, Dews M, Fox JL, Biyashev D. et al. p53-responsive miR-194 inhibits thrombospondin-1 and promotes angiogenesis in colon cancers. Cancer Res. 2011;71:7490-501
21. Weber-Boyvat M, Kentala H, Lilja J, Vihervaara T, Hanninen R, Zhou Y. et al. OSBP-related protein 3 (ORP3) coupling with VAMP-associated protein A regulates R-Ras activity. Exp Cell Res. 2015;331:278-91
22. Thuault S, Valcourt U, Petersen M, Manfioletti G, Heldin C-H, Moustakas A. Transforming growth factor-β employs HMGA2 to elicit epithelial-mesenchymal transition. J Cell Biol. 2006;174:175-83
23. Young AR, Narita M. Oncogenic HMGA2: short or small? Genes Dev. 2007;21:1005-9
24. Han K, Zhao T, Chen X, Bian N, Yang T, Ma Q. et al. microRNA-194 suppresses osteosarcoma cell proliferation and metastasis in vitro and in vivo by targeting CDH2 and IGF1R. Int J Oncol. 2014;45:1437-49
25. Park S-M, Shell S, Radjabi AR, Schickel R, Feig C, Boyerinas B. et al. Let-7 prevents early cancer progression by suppressing expression of the embryonic gene HMGA2. Cell cycle. 2007;6:2585-90
26. Mayr C, Hemann MT, Bartel DP. Disrupting the pairing between let-7 and Hmga2 enhances oncogenic transformation. Science. 2007;315:1576-9
27. Rice SJ, Lai S-C, Wood LW, Helsley KR, Runkle EA, Winslow MM. et al. MicroRNA-33a Mediates the Regulation of High Mobility Group AT-Hook 2 Gene (HMGA2) by Thyroid Transcription Factor 1 (TTF-1/NKX2-1). J Biol Chem. 2013;288:16348-60
28. Lin Y, Liu AY, Fan C, Zheng H, Li Y, Zhang C. et al. MicroRNA-33b inhibits breast cancer metastasis by targeting HMGA2, SALL4 and Twist1. Sci Rep. 2015;5:9995
29. Zhu C, Li J, Cheng G, Zhou H, Tao L, Cai H. et al. miR-154 inhibits EMT by targeting HMGA2 in prostate cancer cells. Mol Cell Biochem. 2013;379:69-75
30. Gong M, Ma J, Li M, Zhou M, Hock JM, Yu X. MicroRNA-204 critically regulates carcinogenesis in malignant peripheral nerve sheath tumors. Neuro Oncol. 2012;14:1007-17
31. Venkatesan N, Deepa P, Vasudevan M, Khetan V, Reddy AM, Krishnakumar S. Integrated analysis of dysregulated miRNA-gene expression in HMGA2-silenced retinoblastoma cells. Bioinform Biol Insights. 2014;8:177-91
32. Morishita A, Zaidi MR, Mitoro A, Sankarasharma D, Szabolcs M, Okada Y. et al. HMGA2 is a driver of tumor metastasis. Cancer Res. 2013;73:4289-99
33. Basati G, Razavi AE, Pakzad I, Malayeri FA. Circulating levels of the miRNAs, miR-194, and miR-29b, as clinically useful biomarkers for colorectal cancer. Tumour Biol. 2016;37:1781-8
34. Chiang Y, Song Y, Wang Z, Liu Z, Gao P, Liang J. et al. microRNA-192,-194 and-215 are frequently downregulated in colorectal cancer. Exp Ther Med. 2012;3:560-6
35. Wang B, Shen Z-l, Gao Z-d, Zhao G, Wang C-y, Yang Y. et al. MiR-194, commonly repressed in colorectal cancer, suppresses tumor growth by regulating the MAP4K4/c-Jun/MDM2 signaling pathway. Cell Cycle. 2015;14:1046-58
36. Eden ER. The formation and function of ER-endosome membrane contact sites. Biochim Biophys Acta. 2016;1861:874-9
37. Wyles JP, McMaster CR, Ridgway ND. Vesicle-associated membrane protein-associated protein-A (VAP-A) interacts with the oxysterol-binding protein to modify export from the endoplasmic reticulum. J Biol Chem. 2002;277:29908-18
38. Skehel PA, Martin KC, Kandel ER, Bartsch D. A VAMP-binding protein from Aplysia required for neurotransmitter release. Science. 1995;269:1580-3
39. Foster LJ, Weir ML, Lim DY, Liu Z, Trimble WS, Klip A. A Functional Role for VAP-33 in Insulin-Stimulated GLUT4 Traffic. Traffic. 2000;1:512-21
40. Prosser DC, Tran D, Gougeon P-Y, Verly C, Ngsee JK. FFAT rescues VAPA-mediated inhibition of ER-to-Golgi transport and VAPB-mediated ER aggregation. J Cell Sci. 2008;121:3052-61
41. Peretti D, Dahan N, Shimoni E, Hirschberg K, Lev S. Coordinated lipid transfer between the endoplasmic reticulum and the Golgi complex requires the VAP proteins and is essential for Golgi-mediated transport. Mol Biol Cell. 2008;19:3871-84
42. Stoica R, De Vos KJ, Paillusson S, Mueller S, Sancho RM, Lau K-F. et al. ER-mitochondria associations are regulated by the VAPB-PTPIP51 interaction and are disrupted by ALS/FTD-associated TDP-43. Nat Commun. 2014;5:3996
43. Rocha N, Kuijl C, van der Kant R, Janssen L, Houben D, Janssen H. et al. Cholesterol sensor ORP1L contacts the ER protein VAP to control Rab7-RILP-p150Glued and late endosome positioning. J Cell Biol. 2009;185:1209-25
44. Stefan CJ, Manford AG, Baird D, Yamada-Hanff J, Mao Y, Emr SD. Osh proteins regulate phosphoinositide metabolism at ER-plasma membrane contact sites. Cell. 2011;144:389-401
45. Hino K, Tsuchiya K, Fukao T, Kiga K, Okamoto R, Kanai T. et al. Inducible expression of microRNA-194 is regulated by HNF-1α during intestinal epithelial cell differentiation. RNA. 2008;14:1433-42
Author contact
![]() Corresponding author: Dr. Tsui-Chin Huang; Phone number: 886-2-2736-1661 Ext. 7675; E-mail: tsuichinedu.tw
Corresponding author: Dr. Tsui-Chin Huang; Phone number: 886-2-2736-1661 Ext. 7675; E-mail: tsuichinedu.tw