Impact Factor
- Issue 14; 2026
- Issue 13; 2026
- Issue 12; 2026
- Issue 11; 2026
- Issue 10; 2026
- Volume 16; 2026
- Advance Articles
- Past Issues
- Cover Images
- Cover Suggestion
- Index & Coverage
- Special Issues
Introduction
Methods and Materials
Results
Discussion
Supplementary Material
Acknowledgements
References
International Journal of Biological Sciences
International Journal of Medical Sciences
 Global reach, higher impact

Theranostics 2017; 7(15):3745-3758. doi:10.7150/thno.20329 This issue Cite
Research Paper
Quantitative Three-Dimensional Dynamic Contrast-Enhanced Ultrasound Imaging: First-In-Human Pilot Study in Patients with Liver Metastases
Ahmed El Kaffas1*, Rosa Maria Silveira Sigrist1*, George Fisher2, Sunitha Bachawal1, Joy Liau1, Huaijun Wang1, Alexander Karanany1, Isabelle Durot1, Jarrett Rosenberg1, Dimitre Hristov3, Jürgen K. Willmann1 ![]()
1. Department of Radiology, Molecular Imaging Program at Stanford, School of Medicine, Stanford University, Stanford, CA
2. Department of Medicine, Division of Oncology, School of Medicine, Stanford University, Stanford, CA
3. Department of Radiation Oncology, School of Medicine, Stanford University, Stanford, CA
*These authors contributed equally to this work.
Received 2017-3-29; Accepted 2017-7-1; Published 2017-8-23
Abstract

Purpose: To perform a clinical assessment of quantitative three-dimensional (3D) dynamic contrast-enhanced ultrasound (DCE-US) feasibility and repeatability in patients with liver metastasis, and to evaluate the extent of quantitative perfusion parameter sampling errors in 2D compared to 3D DCE-US imaging.
Materials and Methods: Twenty consecutive 3D DCE-US scans of liver metastases were performed in 11 patients (45% women; mean age, 54.5 years; range, 48-60 years; 55% men; mean age, 57.6 years; range, 47-68 years). Pairs of repeated disruption-replenishment and bolus DCE-US images were acquired to determine repeatability of parameters. Disruption-replenishment was carried out by infusing 0.9 mL of microbubbles (Definity; Latheus Medical Imaging) diluted in 35.1 mL of saline over 8 min. Bolus consisted of intravenous injection of 0.2 mL microbubbles. Volumes-of-interest (VOI) and regions-or-interest (ROI) were segmented by two different readers in images to extract 3D and 2D perfusion parameters, respectively. Disruption-replenishment parameters were: relative blood volume (rBV), relative blood flow (rBF). Bolus parameters included: time-to-peak (TP), peak enhancement (PE), area-under-the-curve (AUC), and mean-transit-time (MTT).
Results: Clinical feasibility and repeatability of 3D DCE-US using both the destruction-replenishment and bolus technique was demonstrated. The repeatability of 3D measurements between pairs of repeated acquisitions was assessed with the concordance correlation coefficient (CCC), and found to be excellent for all parameters (CCC > 0.80), except for the TP (0.74) and MTT (0.30) parameters. The CCC between readers was found to be excellent (CCC > 0.80) for all parameters except for TP (0.71) and MTT (0.52). There was a large Coefficient of Variation (COV) in intra-tumor measurements for 2D parameters (0.18-0.52). Same-tumor measurements made in 3D were significantly different (P = 0.001) than measurements made in 2D; a percent difference of up to 86% was observed between measurements made in 2D compared to 3D in the same tumor.
Conclusions: 3D DCE-US imaging of liver metastases with a matrix array transducer is feasible and repeatable in the clinic. Results support 3D instead of 2D DCE US imaging to minimize sampling errors due to tumor heterogeneity.
Keywords: Ultrasound, contrast-enhanced, three-dimensional (3D), cancer
Introduction
In cancer patients undergoing chemotherapy or radiation, the current clinical standard of treatment assessment relies on changes in tumor diameter measured from anatomical images, classified according to the Response Evaluation Criteria in Solid Tumors (RECIST) 1.1 (1). However, tumor size changes can take months to manifest. Early identification of patients who are not responding to therapy would spare them from the high morbidity and costs associated with treatments, while enabling oncologists to tailor therapeutic regimens to maximize tumor response.
Functional and molecular imaging techniques, such as dynamic contrast-enhanced Magnetic Resonance Imaging (MRI), perfusion Computed Tomography (CT), and Positron Emission Tomography (PET) are being explored to assess functional or molecular therapy-induced changes of the tumor, or to assess imaging features on baseline studies that may predict response to treatment (2). While many of these techniques are promising, radiation exposure from multiple exams (CT/PET), restrictions on the use of contrast in patients with renal insufficiency (MRI/CT), limited access (MRI/PET), high cost (MRI/PET), and inability to scan at the bedside of sick patients are disadvantageous.
Ultrasound (US) is widely available, inexpensive, portable and without ionizing radiation, making it a potentially ideal tool for longitudinal imaging applications such as treatment monitoring. Ultrasound contrast agents (microbubbles) are highly echogenic, micron-sized gas bubbles, stabilized by a shell made from biodegradable materials (3-5). These can be used in patients with renal insufficiency and have significantly expanded the diagnostic potential of US for characterizing pathologies (6). In organs that are well visualized with US such as the liver, repeated imaging with dynamic contrast-enhanced (DCE) US for early treatment response assessment is practical and could become a complementary functional technique to current anatomical imaging of target lesions in the liver.
Several recent studies have investigated DCE-US in cancer treatment monitoring applications but were limited by the use of conventional two-dimensional (2D) US (7-15). Tumors are highly heterogeneous and prone to 2D sampling errors due to plane-to-plane perfusion variation (16). Consequently, imaging the exact same plane in longitudinal clinical applications is challenging and can yield biased quantitative results. The use of newly available three-dimensional (3D) DCE-US imaging techniques have been proposed to overcome sampling errors in tumors by imaging the tumor as a whole (14,17-19). Ultimately, in the context of treatment monitoring, the use of 3D overcomes the difficulties of locating the same imaging plane in longitudinal applications by instantaneously capturing volumetric images, thus, eliminating sampling errors that arise in 2D due to tumor heterogeneities. The recent introduction of contrast-mode in matrix transducers that allow capturing volumetric tissue perfusion images have further potentiated 3D DCE-US. Multiple technical characteristics of these matrix transducers, such as the temporal and axial/lateral resolutions, are still lagging conventional 2D contrast-mode imaging systems. While technical limitations may hinder the use of 3D DCE-US to characterize complexities of vascular networks, particularly in tumors, this remains an active area of research and innovation. In line with this, pre-clinical studies have already demonstrated that 3D DCE-US allows reliable assessment of early treatment response and prediction of response after anti-angiogenic therapy in human colon cancer xenograft models in mice (17,19-22). Several recent studies have examined the role of non-dynamic 3D contrast images for various clinical applications, including cancer imaging and management (23-31). However, these have thus far been limited to characterizing visual features of differently perfused regions (i.e. size of non-perfused region in tumor corresponding to necrosis) in snapshot volumes obtained at roughly the peak contrast-intensity volume following of a bolus injection, as opposed to quantitative perfusion characterization using dynamic imaging conventionally done in 2D DCE-US (32-35). To that end, the use of 3D DCE-US quantitative imaging using perfusion models to extract blood flow and volume-related parameters has not been translated to patient imaging yet (9,14).
The purpose of this study was to perform a clinical assessment of quantitative 3D DCE-US feasibility and repeatability using a matrix transducer in patients with liver metastasis, and to evaluate the extent of quantitative perfusion parameter sampling errors in 2D versus 3D DCE-US imaging.
Methods and Materials
Patient Inclusion
This HIPPA compliant prospective study was approved by the Institutional Review Board of our institution and written consent was obtained from all participating patients. This study was designed to assess feasibility and repeatability of quantitative 3D DCE-US. For this purpose, 11 adults were recruited for this clinical trial. A total 20 3D DCE-US scans were prospectively obtained from the 11 patients, seven of whom had multiple scans. Inclusion criteria were: provide written consent, willing to comply with protocol, at least 18 years of age or older, and at least one liver metastasis confirmed with MRI/CT with a diameter ranging from 1-14 cm. A clinical oncologist referred each patient after introducing the study to the patient. Patients were included irrespective of previous treatments. Exclusion criteria were: documented anaphylactic or other severe reaction to any contrast media; pregnant or lactating patients; and patients with cardiac shunts or presence of severe pulmonary hypertension. Exclusions are based on contraindication for ultrasound contrast agent. No patient was excluded due to the exclusion criteria. Of the 11 patients, 4 were scanned once, 5 patients were scanned twice on separate days and 2 patients were scanned three times on separate days for a total of 20 separate scan sessions. Five patients were women with a mean age, 54.5 years; range, 48 - 60 years; 6 patients were men with a mean age, 57.6 years; range, 47 - 68 years. Included patients had liver metastases originating from the following primary tumors: rectal adenocarcinoma (n=2); pancreatic adenocarcinoma (n=1); pancreatic neuroendocrine tumor (n=4); and colonic adenocarcinoma (n=4).
Dynamic Contrast-Enhanced Ultrasound Imaging and Contrast Agent Administration Protocol
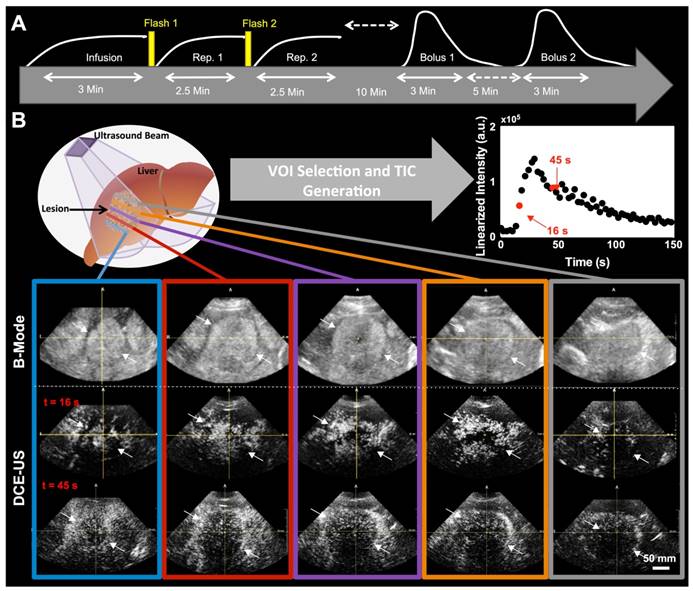
Clinical contrast microbubbles (Definity; Latheus Medical Imaging, North Billerica, MA; FDA-approved for echocardiography and administered off-label for liver imaging in this study) were used. These microbubbles are perfluorobutane lipid microspheres with a mean diameter of 1.8 µm (range, 1-10 µm) (36). Two different DCE-US methods were used to administer the contrast, each resulting in different quantified perfusion parameters obtained from the dynamic signal intensities in volumetric image sequences (Figure 1A). The first technique (henceforth, destruction-replenishment DCE-US) uses short high-power ultrasound pulses (disruptions; within diagnostic range) to momentarily burst microbubbles flowing at steady state. A time-intensity curve (TIC) of the replenishment of microbubbles within a region or volume of interest is then used to extract quantitative parameters related to blood flow or volume using a fitted model (Figure 1B and 2) (9). The advantages of disruption-replenishment is obviating the need to estimate the indicator input function, thus resulting in more quantitative perfusion parameters (37). No MRI/CT equivalent exits for this technique.
A) Overview of imaging workflow. To assess repeatability of the two 3D dynamic contrast-enhanced ultrasound (DCE-US) acquisition methods (destruction-replenishment DCE-US and bolus DCE-US), both techniques were obtained twice in the same imaging session. B) Five representative B-mode (top) and contrast mode (middle and bottom) transverse planes from bolus 3D DCE-US data sets at two time points (16 sec and 45 sec - see time-intensity-curve (TIC) in upper right corner) in a 68-year-old male with liver metastasis from colorectal cancer. Large qualitative image intensity variations at different consecutive tumor planes were observed. Each colored line represents a 2D plane (amongst hundreds) from the acquired 3D volume for this specific lesion at one of two time points. Each white arrowhead represents the same border of the lesion observed in B-mode and in the contrast-mode time points.
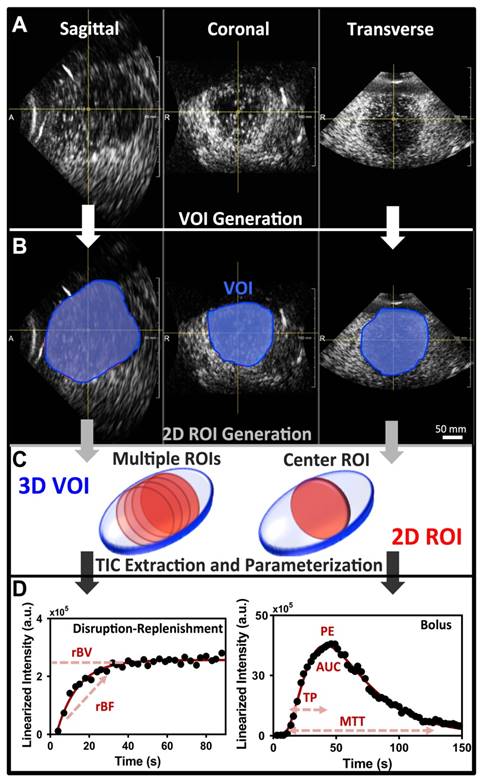
A) Representative orthogonal sagittal, transverse, and coronal views of a colorectal liver metastasis in a 68-year-old male at the wash-out phase (45 sec in TIC). B) Representative volume of interest (VOI) selected for this particular lesion; three regions-of-interest (ROI) were prescribed in the three orthogonal views and interpolated to form a VOI. C) 2D ROI extraction. The left 3D VOI (blue) illustrates location of four ROI (red) extracted for analysis of perfusion variation across lesion. The right 3D VOI (blue) illustrates the center 2D ROI (red) based on three combined adjacent ROI to increase the slice thickness. D) Representative TIC for a replenishment event with monoexponential fit (left; after disruption) and a bolus with a lognormal fit (right). The black circles are the average intensities from the VOI and the red line is the fit generated with the respective model. Each of the different perfusion parameters extracted from the two acquisition methods is presented in relation to the part of the curve it closely represents.
The second technique (henceforth, bolus DCE-US) is based on intravenous injection of a bolus, subsequently allowing visualization of the temporal behavior of the contrast-induced signal in a similar fashion to DCE-MRI/CT (9). Generally, bolus-based parameters are described as semi-quantitative due to the lack of an input function (10,14,38).
Destruction-replenishment DCE-US: Patients were infused for up to 3 min with a solution of 0.9 ml of the contrast agent mixed in 35.1 ml of saline at a constant rate of 0.08 ml/s (15) using a syringe pump (Medfusion 3500; Smiths Medical, Dublin Ohio) to reach steady state. Two disruption-replenishment sequences to assess repeatability (R1 and R2) were applied 2.5 minutes apart with the contrast agent continuously infused. For each disruption ('flash') event, 3 high-MI (flash MI of 0.77) temporal 3D frames were applied to the entire image volume, lasting for 2-3 seconds in total.
Bolus DCE-US: Bolus DCE-US acquisition was carried out ~ 10 minutes after termination of the disruption-replenishment DCE-US infusion during the same imaging session. Two bolus 3D DCE-US data sets to assess repeatability (B1 and B2) were acquired 5 minutes apart. For this purpose, a 0.2 ml bolus of the non-diluted contrast agent was administered intravenously by placing the contrast in the dead-volume of the catheter-line, and using a syringe pump to push the contrast agent into the circulation at a constant infusion rate of 0.06 ml/s, followed by a 5 ml saline chaser administered at the same rate.
During the replenishment time of destruction-replenishment DCE-US, and during the bolus phase of bolus DCE-US imaging, all patients were asked to either hold their breath for up to 30 seconds or to breathe shallow if patient was unable to hold their breath, to minimize motion artifacts. Figure 1A shows the workflow for each patient imaging session. In the initial scan sessions, only one of two acquisition methods was used to ensure that our methods are consistent and optimal before extending scan sessions to the 2 acquisition methods. In the first 4 scan sessions, only bolus DCE-US imaging was carried out; in scan sessions 5-9, only the disruption-replenishment DCE-US imaging was carried out.
System and Acquisition Parameters
All 3D DCE-US imaging exams were carried out using a clinical EPIQ7 ultrasound system coupled to a clinical X6-1 transducer (Philips Healthcare, Andover, MA). The X6-1 2D matrix transducer has 9212 elements that steer the US beam in real-time using a micro-beam former located in the transducer head with a footprint (and aperture) of 40 mm by 20 mm in the azimuth and elevation directions, respectively, and enables up to 90o by 900 wide volumes. It is designed for abdominal applications, with a frequency range of 1-6 MHz and a center frequency of 3.2 MHz (39). Using a standard calibration phantom, we estimated the transducer lateral elevation (sagittal), lateral azimuth (transverse), and axial resolutions in 3D imaging mode to range 1-3 mm, 2-4 mm and 0.5-2 mm, respectively, depending on the focus location. Imaging within 6 cm of the transducer head resulted in a better resolution than imaging within the 6-12 cm depth range where most of the lesions were.
All contrast data was acquired in volumetric (3D) contrast-specific imaging using power modulation with a low mechanical index (MI = 0.09) to allow non-destructive visualization of microbubbles. Disruption-replenishment used 3 flash volumes with an MI of 0.77.
All imaging parameters were maintained constant between all patients (Table 1), with the exception of the depth of the image and the focal zone, which were adjusted on a patient-per-patient basis to optimize lesion visualization. One radiologist or one sonographer with 6 and 13 years of ultrasound imaging experience, respectively, performed all ultrasound imaging. Liver lesions were first located in B-mode. The transducer was placed to position the metastasis as close to the center of the 3D image volume as possible using the sagittal, coronal or transverse plane views for guidance, and held steady throughout the whole examination. All data were streamed via local area network (LAN) connected via Ethernet ports and stored onto the accompanying workstation computer in the manufacturer's compressed “native” format. Data acquisition via LAN was used to overcome cine acquisition length limitations on the EPIQ7 system, which is currently limited to 10 seconds in 3D/4D mode. Each imaging session lasted approximately 40-60 minutes (Figure 1A).
System Settings and Imaging Parameters for 3D Dynamic Contrast-Enhanced Ultrasound Imaging.
| System Setting | Value |
|---|---|
| Output Power | - 25 dB |
| Frame Rate | ~ 1 Hz |
| TGC | Aligned in center |
| Dynamic Range | Full (70 dB) |
| Flash Frames | 4 |
| PRF | High |
| Persistence | Off |
| Res/Gen/Pen | Res |
| MI | 0.09 |
| Focal Zone | 40 cm |
| Flash Power | - 8 dB |
| Flash MI | 0.77 |
| Contrast Gain | -25 dB |
Quantification of 3D Dynamic Contrast-Enhanced Ultrasound Parameters and Generation of 2D Imaging Data
Image analysis of 3D DCE-US was carried-out independently by two readers in random order using previously described techniques developed in MevisLab (MevisLab, Germany) and MATLAB (Mathworks, MA, USA) (17,40,41). A volume-of-interest (VOI) was delineated in MevisLab by covering the entire liver lesion volume viewed on axial, sagittal, and coronal imaging planes. This VOI was subsequently used to generate TICs for the quantification of perfusion as described below (Figure 2A-B).
To assess the extent of quantitative parameter variations in 2D slices within 3D volumes, an analysis of four 2D ROIs evenly spread over the center region of the lesion VOI were retrospectively extracted and analyzed independently as 2D cross-sections (Figure 2C).
In addition, a comparison between quantitative measurements obtained from the VOI and an associated single center 2D ROI at the largest lesion diameter, as would be acquired with a conventional 2D transducer, was carried out. Single 2D slices obtained from the X6-1 matrix transducer have a thinner slice thickness along the elevation in comparison to conventional abdominal curved transducers (sub-millimeter; 32,33). In order to simulate a conventional 2D transducer elevation thickness (i.e. 2-4 mm), we compounded 3 consecutive 2D ROIs in the center of the lesion volume and averaged the intensity from all voxels present in the ROI across all three slices, resulting in a thicker 2D ROI slice thick (Figure 2C) (10,17,39).
Post-processing and analysis steps for DCE-US following VOI or ROI selection consisted of the following steps: (1) examination of data quality, and when necessary, discarding frames with excessive motion; (2) linearization of the US image voxel intensities in contrast-mode images using a transformation function and a decompression parameter provided by the equipment manufacturer (43); (3) extraction of TIC from the average voxel intensities in the VOI/ROI; (4) standardized monoexponential or lognormal model fitting to VOI or ROI average intensity (TIC) using standard quantitative models in Matlab (9,44). The analysis software permitted the selection of VOIs and independent ROIs around the lesion, and the application of dynamic enhancement models that could not otherwise be applied in 3D by using commercial software (Figure 2D). For bolus DCE-US, TICs were extracted for a minimum of 1.5 min following the start of contrast arrival. Lognormal curve fitting, was performed using a standard MATLAB fitting routine for the following equation:
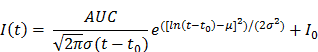
where I(t) is the signal intensity at time t, the variables µ and σ are the mean and standard deviation of the normal distribution of the logarithm of the independent variable t, respectively, and AUC is the area-under the curve of the fit distribution. I0 is the baseline intensity and t0 is the time at which the contrast enters the VOI/ROI. From this, we can obtain the mean transit time (MTT) of the contrast, the time to peak (TP) and the peak enhancement (PE) (9):

Similarly, mono-exponential curve fitting was performed with from the first frame after the disruption event for a minimum of 1.5 min for destruction-replenishment DCE-US using:

where A is the relative blood volume (rBV) and B is the regional mean flow velocity. From these, one can compute the relative blood flow (rBF) as (44):

The rBV, PE, and AUC are proportional to blood volume while the rBF, TP, and MTT are proportional to blood flow. An attempt was made to select the same VOIs and/or center ROIs between the repeated pairs of bolus and replenishment data sets for each scan session by having both images open on dual monitors for anatomical referencing and manual registration by careful visual examination.
Statistical Analysis
To validate that the contrast-signals are equivalent (i.e. that microbubbles have cleared) pre-contrast injection between the infusion and bolus 1 baselines, as well as between bolus 1 and bolus 2 baselines, equivalence tests with a margin of +/-20% were carried-out for each patient using version 0.7.2 of the "equivalence" package in R 3.3.1 (r-project.org).
To determine agreement (repeatability) between measurement occasions in pairs of repeated acquisition within a reader, and between readers within measurement occasions (inter-observer agreement), from both the disruption-replenishment and bolus DCE-US data sets, pairs of log-transformed measurements were assessed by the concordance correlation coefficient (CCC). Log-transformation was applied to make the data normally distributed for standard statistical analysis. The 95% confidence intervals (CI) was also calculated for each CCC. CCC of 0-0.20 indicated no agreement; CCC of 0.21-0.40, poor agreement; CCC of 0.41-0.60, moderate agreement; CCC of 0.61-0.80, good agreement; and CCC greater than 0.80, excellent agreement (45). This study was designed as an initial, repeatability-assessment pilot study part of a larger study to determine if 3D DCE-US can be used to monitor treatment response in patients with liver metastasis. The study was a necessary prerequisite to demonstrate feasibility and repeatability of quantified parameters before moving forward with the larger longitudinal treatment assessment study. It was determined that a sample size of eleven subjects have 90% power at one-sided 5% error to detect a CCC as high as 0.80.
To show slice-to-slice variability in retrospective 2D analysis, the coefficient of variation (COV) was calculated as the ratio between the standard deviation and the mean value of imaging signals from all four evenly separated consecutive 2D ROIs obtained from the 3D VOI for each tumor. An average percent difference with standard error was also computed between the 3D and 2D measurements from the central plane, as well as the smallest (min) and the largest (max) measurement amongst all four ROIs across the tumor. The extent of possible error was investigated if mismatched 2D planes were selected in repeated pairs of imaging to simulate sampling errors that could arise in longitudinal imaging. This was carried out by computing the percent difference for the 16 possible permutations (i.e. 4 for bolus 1 and 4 for bolus 2) resulting from four paired 2D planes in repeated pairs of images. Results are summarized as percent difference median and 95% discrepancy range for each parameter. The percent difference between center slice 2D measurements and 3D volume measurements was computed; differences were tested for statistical significance using a paired Wilcoxon test in order to assess whether 2D measurements match 3D measurements. All statistical analyses were performed using Stata Release 14.1 (StataCorp LP, College Station, TX), or as indicated. Statistical significance was fulfilled at P < 0.05.
Results
Feasibility of 3D DCE-US in Patients with Liver Metastasis
Both disruption-replenishment and bolus contrast administration and acquisitions within the same scan session were well tolerated by all patients without any change in clinical symptoms. Multiple representative 2D Bmode images from a liver lesion 3D volume along with associated contrast images at different time points following bolus (16 and 45 sec.) are shown in figure 1B. A 3D maximum intensity projection of the contrast signal during the wash in is shown in supplementary figure 1. For each patient, the baseline image intensities within the VOI (pre-contrast-injection) between the infusion and bolus 1, as well as between bolus 1 and bolus 2, were equivalent (all p-values < 0.025).
Repeatability of 3D DCE-US Parameters
Overall, there was good to excellent repeatability for all 3D DCE-US parameters between acquisition pairs and between two different readers:
Disruption-replenishment: Both rBV and rBF parameters were highly repeatable between acquisition pairs with CCCs of 0.97 (0.94, 0.99) and 0.95 (0.90, 0.98), respectively (Figure 3). Both rBV and rBF parameters were highly repeatable in measurements between the two readers with CCCs of 0.80 (0.61, 0.91) and 0.82 (0.65, 0.92), respectively (Figure 3).
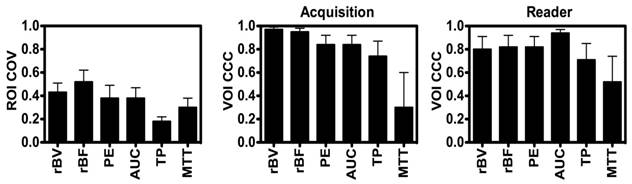
Average Intra-volume Coefficient of Variance (COV; left) of four 2D (ROI and Concordance Correlation Coefficient (CCC) of VOI obtained in repeated acquisition pairs (middle) and between the two readers (right) of VOI. Results demonstrate good reproducibility of 3D-extracted parameters between acquisition pairs and readers, and high coefficient of variation of each of the parameters.
Bolus DCE-US: PE (CCC=0.84; 0.68, 0.92) and AUC (CCC=0.84; 0.68, 0.92) were highly repeatable with TP and MTT parameters showing lower CCC values of 0.74 (0.52, 0.87) and 0.30 (0.00, 0.60), respectively (Figure 3). PE (CCC=0.82; 0.66, 0.91) and AUC (CCC=0.94; 0.88, 0.97) were highly repeatable in measurements between the two readers, while TP and MTT parameters showed lower CCC values of 0.71 (0.49, 0.85) and 0.52 (0.20, 0.74), respectively (Figure 3).
Intra-Tumor Variations in 2D DCE-US Parameters
Large intra-volume variations in perfusion parameters measured from four 2D ROIs within the center of each VOI were observed for individual disruption-replenishment and bolus parameters, across most scan sessions (Figure 3). The rBV, rBF, PE, AUC and MTT, parameters obtained from the four 2D imaging planes showed substantial spatial heterogeneity of tumor perfusion shown as high COV values (Figure 3 and 5). The disruption-replenishment DCE-US parameters rBV and rBF had COV of 0.43 (0.35, 0.51) and 0.52 (0.41, 0.62), respectively. The bolus DCE-US parameters PE, AUC, TP and MTT had a COV of 0.38 (0.28, 0.49), 0.38 (0.29, 0.47), 0.18 (0.14, 0.22) and 0.30 (0.22, 0.38), respectively. The percent differences between 3D measurement and the smallest (min) or largest (max) measurement from the four 2D measurements in the same volume were also high for both DCE-US imaging methods (Figure 4 and 6). Disruption-replenishment parameters differed by up to 89%, while bolus parameters differed by as much as 91%. The median and 95% discrepancies of percent difference distributions from all permutations of the four 2D planes selected over repeated pairs of imaging were overall large: rBV -15% (-95%, 500%); rBF 13% (-86%, 814%); PE 16% (-70%, 487%); AUC -8% (-74%, 584%); TP -4% (-52%, 79%); MTT -15% (-87%, 351%).
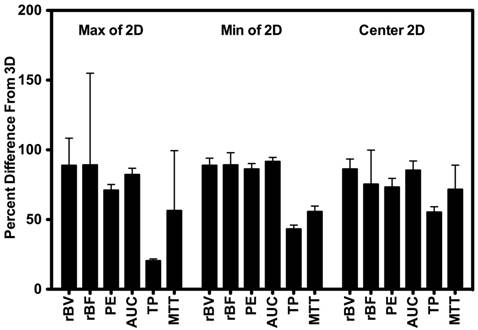
Percent difference between 3D measurements and the smallest value (min), largest value (max), and center slice from intra-volume 2D ROI. Results demonstrate large percent differences between measurements made in 2D vs. measurements made in 3D.
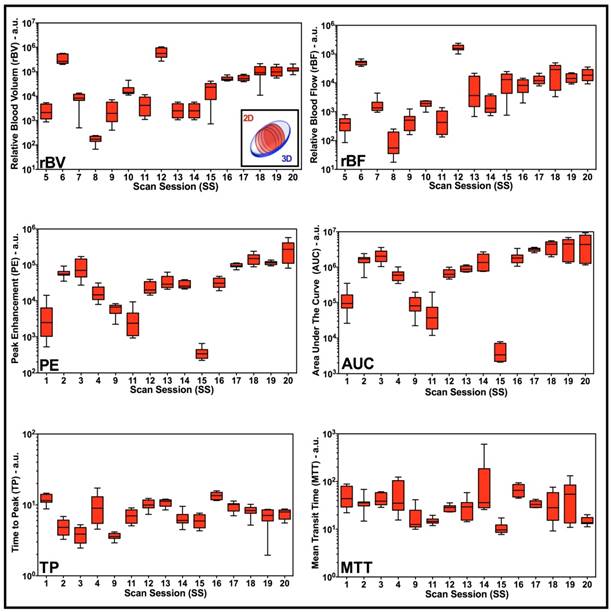
Box-and-whisker plots of disruption-replenishment and bolus DCE-US parameters from multiple intra-volume 2D measurements demonstrate spatial perfusion heterogeneity for all scan sessions. Four intra-volume 2D ROI were segmented from volumetric data sets and logarithmically transformed perfusion parameters (rBV, rBF, PE, AUC, TP, and MTT) were plotted for each scan session individually. Each box in the plot represents the 25th and 75th quartiles, the line inside each box identifies the median, and the whiskers indicate the 5th and 95th percentile of perfusion parameter measurements.
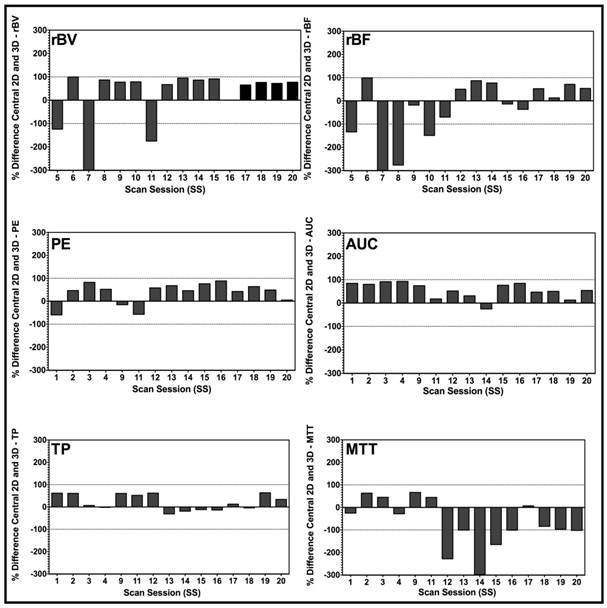
Bar charts of percent differences between central 2D plane and corresponding 3D VOI for disruption-replenishment and bolus DCE-US demonstrating the extent of mismatch between measurements made in 2D, and those made in 3D. Bars exhibit the percent difference of the designated perfusion parameter for each individual scan session. Overall, graphs suggest a large percent difference between conventional 2D and a 3D DCE-US perfusion parameter, prompting potential over-estimated or under-estimation of quantitative DCE-US parameters when measurements are made in 2D.
Differences between 2D and 3D DCE-US Parameters
Overall, 2D measurements were significantly different (P = 0.001) from 3D measurements and, thus, not representative of volumetric perfusion parameters. Specifically, there was a mismatch between 2D compared to 3D imaging for the rBV (P = 0.004); rBF (P = 0.09); PE (P < 0.001), AUC (P < 0.001), TP (P = 0.016); and MTT (P = 0.05).
Scan session-specific percent differences between 2D and 3D DCE-US parameters are shown in Figure 4 High percent differences between 3D and corresponding 2D measurements were observed for all parameters from both disruption-replenishment and bolus DCE-US, ranging between 55.24±8.24% (TP) to 86.17±8.42% (rBV) (Figure 4 and 6).
Discussion
Our results suggest good clinical feasibility and repeatability of quantitative 3D DCE-US perfusion parameters from both the destruction-replenishment and bolus DCE-US techniques. Quantified DCE-US parameters from 3D data sets were highly repeatable with a CCC > 0.80, except for the TP and MTT parameters. Our study also confirmed large intra-volume heterogeneities in quantitative perfusion parameters, and that measurement from a single center 2D plane is not representative of those obtained in 3D.
DCE-US has received notable attention in recent years for clinical indications such as early response assessment in cancer patients undergoing anti-angiogenic treatment due to its inherent advantages over other imaging modalities that could diminish healthcare costs and increase treatment efficacy. A study of 42 patients with hepatocellular carcinoma (HCC) reported decreases in lesion perfusion within 3 days of receiving the anti-angiogenic agent Bevacizumab using bolus DCE-US, and suggested good correlation between tumor response (assessed via progression free and overall survival) and the TP and AUC quantitative parameters (46). Similarly, another study found that the ratio of bolus DCE-US parameters obtained at baseline and 15 days following the start of Sunitinib treatment in patients with metastatic renal carcinoma were correlated with treatment response, and that the TP parameter was significantly associated with disease-free survival and overall survival (47). More recently, a twenty-patient study reported promising results on the use of 2D DCE-US in assessing early HCC response to yet another anti-angiogenic agent Axitinib, but concluded that a larger trial is needed to fully assess the potential of this modality for treatment monitoring (48). In contrast, a study in 17 patients with metastatic renal cell carcinoma treated with Sunitinib suggested poor correlation of bolus and disruption-replenishment DCE-US parameters with progression free survival, and concluded that DCE-US parameters for both acquisition techniques could not be used to predict long-term assessment of best response by using RECIST (15). The study also found that the replenishment curve at different 2D planes varied extensively when imaging with 2D disruption-replenishment DCE-US with COVs of up to 41% in quantified parameters, in line with COVs found in our current study. These variations in those 17 patients with renal cell carcinoma were hypothesized to be a reason for the lack of correlation between bolus and disruption-replenishment DCE-US parameters and treatment response in that study. A recent preclinical study using 14 subcutaneous breast cancer tumors in mice provided supporting evidence that small deviations (mm) in transducer position results in quantitative errors of up to 40.3% (49). This was further supported by another study reporting on large plane-to-plane variations of parametric perfusion maps of up to 22% in healthy rat kidneys (50). Attempts to measure the contrast intensity over multiple 2D regions of interest (ROIs) from reconstructed breast lesion volumes obtained with a mechanically swept transducer found a significantly different PE in the central core vs. periphery of benign breast lesions (1.71 ± 0.96 vs. 1.13 ± 0.79 dB, respectively). However, malignant breast lesions were found to be more homogeneously perfused in 3D (1.66 ± 1.39 central vs. 1.24 ± 1.14 dB periphery), thus suggesting that either different tumors (i.e. benign vs. malignant) will be more prone to sampling errors in longitudinal imaging applications, or that the slice thickness of mechanically swept linear arrays used for volumetric imaging is too thick to detect variations in samples in 3D in some tumors (26,51). Collectively, these studies support the use of 3D US as a solution to sampling errors in relevant cancer sites, and as a mean to ultimately improve correlations to treatment response. Selecting the same tumor plane on a patient-by-patient basis over time during longitudinal imaging applications (i.e. treatment monitoring) is difficult especially as tumor progress or vascular networks are remodeled due to treatment, thus potentiating erroneous results due to sampling errors. In contrast, selecting the whole tumor is more feasible at each scan session when carried out with a volumetric imaging system. This relieves radiologists/sonographers from having to find the same imaging plane as long as the whole of the tumor volume can be captured on each day during longitudinal imaging. In addition, volumetric imaging enables capture of multiple planes simultaneously, omitting the need for multiple bolus injections when multiple planes need to be imaged, or transducer repositioning to capture multiple disruption-replenishment events, thus significantly reducing scan time.
A recent study demonstrated the feasibility and repeatability of 3D DCE-US to monitor acute treatment response in a pre-clinical colon cancer model treated with Bevacizumab (17,19). Results noted good to excellent 3D DCE-US parameter repeatability (intra-class correlation coefficient of 0.73-0.86) using a Philips iU22 system coupled to an X6-1 transducer. High 2D intra-volume plane-to-plane variability was also reported leading to over and under-estimation of treatment effects of up to 125-fold to 170-fold in comparison to 3D DCE US imaging. Furthermore, another study recently demonstrated that 3D DCE-US could differentiate between early (within 24 hours) responders and non-responders in a pre-clinical model of colorectal cancer, with significant decreases in bolus-based perfusion parameters of up to 50% within 24 hours (22).
In the current study, we have translated these experiments to a pilot clinical trial in patients with liver metastases. An X6-1 transducer was used along with the latest generation clinical US imaging system (EPIQ7). The use of matrix transducers in clinical contrast-enhanced ultrasound to examine volumes of perfusion have been carried-out to date for non-dynamic analysis, and have been mainly restricted to qualitative observations or morphological measurements of regions with different perfusion characteristics based on static images from an acquisition sequence (32-35). Our study is the first to examine quantified perfusion parameters from in-human 3D DCE-US data sets extracted from established fitting models, using two different acquisition techniques that yield different parameters related to blood flow or blood volume.
We tested for repeatability of 3D-extracted DCE-US parameters between measurement occasions in pairs of repeated acquisition within a reader, and between readers within measurement occasions, from both the disruption-replenishment and bolus DCE-US data sets, and found most to be excellent, with the exception of the bolus TP and MTT parameters. The rBV parameter was the most repeatable between acquisition pairs, closely followed by the rBF parameter, suggesting that the disruption-replenishment method may be a more robust imaging approach. In general, bolus DCE-US parameters are considered to be semi-quantitative because of the lack of an input function (44), and can be susceptible to microbubble handling, needle size and the injection rate (52,53). In order to minimize quantitative errors in bolus DCE-US imaging in our study, an injection pump was used in all patients to ensure the same contrast agent injection rate (54).
We also investigated the variability of 2D parameters by selecting four 2D ROIs per tumor volume. This was performed to determine the extent of quantitative errors if mismatched planes were selected in longitudinal imaging applications. Overall, high variability (COV of up to 54% for some parameters) of quantitative perfusion parameters was observed over intra-volume ROIs, confirming that tumor perfusion is highly heterogeneous. Finally, we also investigated the extent of possible error if mismatched 2D planes were selected in repeated pairs of imaging and found large 95% discrepancy intervals, reinforcing the notion that if mismatched planes were selected in longitudinal imaging applications, that quantitative parameters would be at high risk of sampling errors due to high perfusion heterogeneity of tumors. In addition, the use of disruption-replenishment acquisitions allows imaging multiple volumes in 3D by relocating the transducer for multiple disruption events during the course of infusion, thus enabling imaging several metastatic lesions for a more complete characterization of treatment response.
In this study, the disruption-replenishment parameters were found to be highly repeatable (CCC > 0.95 between acquisition pairs within a reader), while only two of the bolus parameters related to blood volume were highly repeatable (CCC > 0.80 between acquisition pairs within a reader). These same disruption-replenishment and bolus parameters were also found to be repeatable when measured with different readers. The TP and MTT bolus parameters had a CCC < 0.8 between acquisition pairs and between readers. We also observed that the repeatable parameters (rBV, rBF, PE and AUC) were the most sensitive to tumor perfusion heterogeneities, resulting in the largest COV. Bolus imaging is generally considered to be semi-quantitative due to the lack of an input function, and can be significantly affected by the injection rate if performed manually by a hand injection. Here, we used a syringe pump to control the injection rate of the bolus and reduce potential errors. While good CCCs were noted for the PE and AUC, further optimization of injection parameters (dosing and injection rate) may be needed to improve the repeatability of the TP and MTT parameter. In contrast, disruption-replenishment parameters are considered to be more quantitative than bolus parameters due to the availability of an input-function (negative bolus). In fact, these have been demonstrated to correlate substantially with histological assessment of tumor vasculature density in a prior preclinical study (42). In the same study, bolus parameters were minimally correlated to vascular densities. Overall, while bolus imaging may be simpler to perform in the clinic, disruption-replenishment imaging holds several major advantages which include: the ability to image several lesions or planes (in 2D) by moving the transducer to acquire multiple disruption events; the replenishment events needed for analysis are shorter and, thus, can often be acquired in full while the patient is holding his breath; and disruption-replenishment events are more quantitative and better correlated to tissue histology.
We acknowledge the following limitations of our study. First, the current frame rate in 3D contrast-mode is substantially lower than in 2D contrast-mode. This can, in certain cases, affect the performance of fitting models used to obtain quantitative information, and tempers with one of the foremost advantages of US over other imaging modalities; its temporal resolution. This not only affects quantitative characterization of complex vascular networks, but it also affects the resolution at which temporal parameters such as the TP or MTT are being measured, thus potentially affecting their quality and repeatability. Although the frame rate is still good in comparison to most current DCE-MRI and DCE-CT methods, hemodynamic quantification would be superior if manufacturers improved on temporal resolution in 3D contrast-mode to match that of 2D contrast-mode. Nonetheless, this is currently limited by existing beamforming technology as well as the rate of data transfer from the transducer to the ultrasound system, and thus remains a trade-off between dimensions of the volume imaged (width, depth, beam angle) and spatial resolution against temporal resolution. Second, while motion correction of 3D B-mode would likely yield superior results than correcting motion in 2D as currently done on most commercial US analysis packages where out-of-plane motion is a limitation, the current EPIQ7 system does not permit acquisition of B-mode images in parallel (i.e. side-by-side) to volumetric contrast-mode data. This is a major challenge to applying motion correction as dynamic contrast images change significantly frame-to-frame, thus making it difficult for currently available US motion correction algorithms to identify features for registration over time. Unless the manufacturer is able to engineer a solution (i.e., by providing B-mode images simultaneously to contrast images), then new algorithms would need to be developed that would account for significant changes in images from frame-to-frame in contrast mode. In this study, we attempted to minimize motion artifacts by asking patients to hold their breath for up to 30 seconds when possible immediately after bolus injection or with a disruption event. Third, the sensitivity of DCE-US parameters to differing vascular networks, hemodynamics and/or subtle changes in vascular architecture (i.e., remodeling/normalization) has yet to be assessed. Understanding this could open the door to imaging a broader range of vascular targeting therapeutic strategies or detecting subtle responses in patients earlier (within hours/days) as some treatments have been reported to act rapidly (within hours) (55,56). Fourth, while tracer models have already been developed to extract perfusion and vascular architecture information in 2D DCE-US techniques, which can be used to characterize lesions for predicting treatment response (37), these will require proper translation to 3D data sets and validation before they can be used for full clinical applications. Thus, the models used to quantify 3D DCE-US in this study, which were originally developed for 2D DCE-US, may result in quantification errors given differences between the beam shape, slice thickness and image volume between the two methods. Fifth, while the footprint of the X6-1 transducer is comparable to a typically used liver imaging transducer such as the C5-2 (Philips Healthcare, Andover, MA; 60mm x 14mm footprint), the beam forming and slice thickness are very different on both of these transducers. Perfusion modeling in 2D is affected by the slice thickness (57); current analysis of 2D ROI extracted from the VOI could inherently be losing information due to unconventionally low frame rates obtained using a matrix transducer. Thus, future studies should directly compare quantified perfusion parameters from both transducers obtained independently, with the aim of developing adequate 3D models. Sixth, in this work, we have evaluated the repeatability within a scan session using identical conditions for repeated pairs of acquisitions. Future work should aim to also evaluate the reproducibility of measurements under altered conditions of normal use (58). Finally, while our study size was powered appropriate for this first proof of principle investigation, additional studies with a greater number of patients are warranted to assess whether 3D imaging is advantageous over 2D imaging for monitoring early treatment effects in patients.
In summary, our results suggest that 3D DCE-US is feasible and highly repeatable for six out of seven assessed perfusion parameters in patients with liver metastases, yielding quantitative values that approximate volumetric perfusion and minimize sampling errors caused by heterogeneous tumor perfusion. Compared to 2D imaging, volumetric imaging eliminates the need of finding the same original scan plane longitudinally, because whole tumor volumes, as opposed to a single plane within the lesion volume are captured. This has the potential to minimize quantitative inaccuracies arising from sampling errors.
Supplementary Material
Supplementary figure 1.
Acknowledgements
We thank Vijay Shamdasani, PhD (Philips Healthcare, Bothell, Wash), for providing the clinical US system and transducer.
Funding support
This project was supported by NIH R01CA195443-01 (JKW/DH) and a seed grant from Philips Healthcare.
Competing Interests
The authors have declared that no competing interest exists.
References
1. Padhani AR, Ollivier L. The RECIST criteria: implications for diagnostic radiologists. Br J Radiol. British Institute of Radiology. 2001;74(887):983-986
2. Sadeghi-Naini A, Falou O, Hudson JM. et al. Imaging innovations for cancer therapy response monitoring. Imaging Med. Future Medicine Ltd London, UK. 2012;4(3):311-327
3. Dijkmans P a, Juffermans LJM, Musters RJP. et al. Microbubbles and ultrasound: from diagnosis to therapy. Eur J Echocardiogr. 2004;5(4):245-256
4. Stride E. Physical principles of microbubbles for ultrasound imaging and therapy. Cerebrovasc Dis. 2009;27(suppl 2):1-13
5. William D. O'Brien. Ultrasound—biophysics mechanisms. Prog Biophys Mol Biol 2007. 2007;93(1-3):212-255
6. Tang M-X, Mulvana H, Gauthier T. et al. Quantitative contrast-enhanced ultrasound imaging: a review of sources of variability. Interface Focus. 2011;1(4):520-539
7. Hoyt K, Warram JM, Umphrey H. et al. Determination of breast cancer response to bevacizumab therapy using contrast-enhanced ultrasound and artificial neural networks. Ultrasound Med. 2010;29(4):577-585
8. Paprottka PM, Cyran CC, Zengel P. et al. Non-invasive contrast enhanced ultrasound for quantitative assessment of tumor microcirculation. Contrast mixed mode examination vs. only contrast enhanced ultrasound examination. Clin Hemorheol Microcirc. 2010;46(2-3):149-158
9. Strouthos C, Lampaskis M, Sboros V, McNeilly A, Averkiou M. Indicator dilution models for the quantification of microvascular blood flow with bolus administration of ultrasound contrast agents. IEEE Trans Ultrason Ferroelectr Freq Control. IEEE. 2010;57(6):1296-1310
10. Hudson JM, Karshafian R, Burns PN. Quantification of Flow Using Ultrasound and Microbubbles: A Disruption Replenishment Model Based on Physical Principles. Ultrasound Med Biol. 2009;35(12):2007-2020
11. Quaia E. Assessment of tissue perfusion by contrast-enhanced ultrasound. Eur Radiol. 2011;21(3):604-615
12. Pysz M a, Foygel K, Panje CM, Needles A, Tian L, Willmann JK. Assessment and monitoring tumor vascularity with contrast-enhanced ultrasound maximum intensity persistence imaging. Invest Radiol. 2011;46(3):187-195
13. Hwang M, Hariri G, Lyshchik A, Hallahan DE, Fleischer AC. Correlation of quantified contrast-enhanced sonography with in vivo tumor response. Ultrasound Med. 2010;29(4):597-607
14. Hudson JM, Williams R, Tremblay-Darveau C. et al. Dynamic contrast enhanced ultrasound for therapy monitoring. Eur J Radiol. 2015;84(9):1650-1657
15. Williams R, Hudson JM, Lloyd B a. et al. Dynamic Microbubble Contrast-enhanced US to Measure Tumor Response to Targeted Therapy: A Proposed Clinical Protocol with Results from Renal Cell Carcinoma Patients Receiving Antiangiogenic Therapy. Radiology. 2011;260(2):581-590
16. Nagy JA, Chang S-H, Shih S-C, Dvorak AM, Dvorak HF. Heterogeneity of the tumor vasculature. Semin Thromb Hemost. NIH Public Access. 2010;36(3):321-331
17. Wang H, Hristov D, Qin J, Tian L, Willmann JK. Three-dimensional Dynamic Contrast-enhanced US Imaging for Early Antiangiogenic Treatment Assessment in a Mouse Colon Cancer Model. Radiology. 2015;277(2):424-434
18. Wang H, Osamu F, Tian L, Hristov D, Willmann JK. Three-Dimensional Ultrasound Molecular Imaging of Angiogenesis in Colon Cancer Using a Clinical Matrix Array Ultrasound Transducer. Invest Radiol. 2015;50(5):322-329
19. Wang H, Lutz AM, Hristov D, Tian L, Willmann JK. Intra-animal Comparison between Three-dimensional Molecularly Targeted US and Three-dimensional Dynamic Contrast-enhanced US for Early Antiangiogenic Treatment Assessment in Colon Cancer. Radiology. Radiological Society of North America. 2016 radiol.2016160032
20. Wang H, Kaneko OF, Tian L, Hristov D, Willmann JK. Three-dimensional ultrasound molecular imaging of angiogenesis in colon cancer using a clinical matrix array ultrasound transducer. Invest Radiol. 2015;50(5):322-329
21. Zhou J, Wang H, Zhang H. et al. VEGFR2-Targeted Three-Dimensional Ultrasound Imaging Can Predict Responses to Antiangiogenic Therapy in Preclinical Models of Colon Cancer. Cancer Res. 2016;76(14):4081-4089
22. Zhou J, Zhang H, Wang H. et al. Early Prediction of Tumor Response to Bevacizumab Treatment in Murine Colon Cancer Models using Three-Dimensional Dynamic Contrast-Enhanced Ultrasound Imaging. Angiogenesis. 2017 in press. doi 10.1007/s10456-017-9566-5
23. Wang Y, Jing X, Ding J. Clinical value of dynamic 3-dimensional contrast-enhanced ultrasound imaging for the assessment of hepatocellular carcinoma ablation. Clin Imaging. 2016;40(3):402-406
24. Arlt F, Chalopin C, Müns A, Meixensberger J, Lindner D. Intraoperative 3D contrast-enhanced ultrasound (CEUS): a prospective study of 50 patients with brain tumours. Acta Neurochir (Wien). Springer Vienna. 2016;158(4):685-694
25. Dong F, Xu J, Du D. et al. 3D analysis is superior to 2D analysis for contrast-enhanced ultrasound in revealing vascularity in focal liver lesions - A retrospective analysis of 83 cases. Ultrasonics. 2016;70:221-226
26. Sridharan A, Eisenbrey JR, Machado P. et al. Quantitative Analysis of Vascular Heterogeneity in Breast Lesions Using Contrast-Enhanced 3-D Harmonic and Subharmonic Ultrasound Imaging HHS Public Access. IEEE Trans Ultrason Ferroelectr Freq Control. 2015;62(3):502-510
27. Acar P, Battle L, Dulac Y. et al. Real-time three-dimensional foetal echocardiography using a new transabdominal xMATRIX array transducer. Arch Cardiovasc Dis. 2014;107(1):4-9
28. Gargiulo M, Gallitto E, Serra C. et al. Could Four-dimensional Contrast-enhanced Ultrasound Replace Computed Tomography Angiography During Follow up of Fenestrated Endografts? Results of a Preliminary Experience. Eur J Vasc Endovasc Surg. 2014;48:536-542
29. Li Q-Y, Tang J, He E-H. et al. Clinical utility of three-dimensional contrast-enhanced ultrasound in the differentiation between noninvasive and invasive neoplasms of urinary bladder. Eur J Radiol. 2012;81:2936-2942
30. Prevost R, Mory B, Corréas J-M, Cohen LD, Ardon R. Kidney detection and real-time segmentation in 3D contrast-enhanced ultrasound images Kid- ney detection and real-time segmentation in 3D contrast-enhanced ultrasound images. Alejan- dro Frangi. IEEE. 2012:1559-1562
31. Hotta N, Masuko K. Usefulness of new live 3D ultrasound probe during radiofrequency ablation in a case of hepatocellular carcinoma. Open Journal of Gastroenterology. 2012;2012:15-17
32. Xu H-X, Lu M-D, Xie X-H. et al. Treatment response evaluation with three-dimensional contrast-enhanced ultrasound for liver cancer after local therapies. Eur J Radiol. 2010;76(1):81-88
33. Luo W, Numata K, Morimoto M. et al. Clinical utility of contrast-enhanced three-dimensional ultrasound imaging with Sonazoid: Findings on hepatocellular carcinoma lesions. Eur J Radiol. 2009;72(3):425-431
34. Xu H-X, Lu M-D, Xie X-H. et al. Three-dimensional contrast-enhanced ultrasound of the liver: Experience of 92 cases. Ultrasonics. 2009;49(3):377-385
35. Kazushi Numata Manabu Morimoto Akito Nozaki Michio Ueda Masaaki Kondo Satoshi Morita Katsuaki Tanaka. Differentiation of focal liver lesions using three-dimensional ultrasonography: Retrospective and prospective studies. World J Gastroenterol. 2010;17(1):47-57
36. Tu J, Swalwell JE, Giraud D, Cui W, Chen W, Matula TJ. Microbubble sizing and shell characterization using flow cytometry. IEEE Trans Ultrason Ferroelectr Freq Control. IEEE. 2011;58(5):955-963
37. Hudson JM, Leung K, Burns PN. The Lognormal Perfusion Model for Disruption Replenishment Measurements of Blood Flow: In Vivo Validation. Ultrasound Med Biol. 2011;37(10):1571-1578
38. Needles A, Arditi M, Rognin NG. et al. Nonlinear contrast imaging with an array-based micro-ultrasound system. Ultrasound Med Biol. 2010;36(12):2097-2106
39. Freeman S, Jago J, Davidsen R, Anderson M, Robinson A. Third generation xMATRIX technology for abdominal and obstetrical imaging: Philips X6-1 xMatrix Transducer (White Paper). 2012: 1-10.
40. Zhou J, Zhang H, Wang H. et al. Prediction of Early Response to Bevacizumab Treatment in Murine Colon Cancer Models using Three-Dimensional Dynamic Contrast-Enhanced Ultrasound Imaging. Submitt to Radiol. 2017
41. Wang H, Lutz AM, Hristov D, Tian L, Willmann JK. Intra-Animal Comparison between Three-dimensional Molecularly Targeted US and Three-dimensional Dynamic Contrast-enhanced US for Early Antiangiogenic Treatment Assessment in Colon Cancer. Radiology. 2017;282(2):443-452
42. Wang H, Hristov D, Qin J, Tian L, Willmann JK. Three-dimensional Dynamic Contrast-enhanced US Imaging for Early Antiangiogenic Treatment Assessment in a Mouse Colon Cancer Model. Radiology. 2015;277(2):142824
43. Payen T, Coron A, Lamuraglia M. et al. Echo-power estimation from log-compressed video data in dynamic contrast-enhanced ultrasound imaging. Ultrasound Med Biol. 2013;39(10):1826-1837
44. Wei K, Jayaweera a R, Firoozan S, Linka a, Skyba DM, Kaul S. Quantification of myocardial blood flow with ultrasound-induced destruction of microbubbles administered as a constant venous infusion. Circulation. 1998;97(5):473-483
45. Faria JRC de, Aarão AR, Jimenez LMZ, Silva OH, Avelleira JCR. Inter-rater concordance study of the PASI (Psoriasis Area and Severity Index). An Bras Dermatol. 2010;85(5):625-629
46. Lassau N, Koscielny S, Chami L. et al. Advanced hepatocellular carcinoma: early evaluation of response to bevacizumab therapy at dynamic contrast-enhanced US with quantification-preliminary results. Radiology. Radiological Society of North America, Inc. 2011;258(1):291-300
47. Lassau N, Koscielny S, Albiges L. et al. Metastatic renal cell carcinoma treated with sunitinib: early evaluation of treatment response using dynamic contrast-enhanced ultrasonography. Clin Cancer Res. 2010;16(4):1216-1225
48. Lo GM, Al Zahrani H, Jang HJ. et al. Detection of Early Tumor Response to Axitinib in Advanced Hepatocellular Carcinoma by Dynamic Contrast Enhanced Ultrasound. Ultrasound Med Biol. 2016:1-9
49. Hoyt K, Sorace A, Saini R. Quantitative mapping of tumor vascularity using volumetric contrast-enhanced ultrasound. Invest Radiol. 2012;47(3):167-174
50. Feingold S, Gessner R, Guracar IM, Dayton PA. Quantitative volumetric perfusion mapping of the microvasculature using contrast ultrasound. Invest Radiol. NIH Public Access. 2010;45(10):669-674
51. Sridharan A, Eisenbrey JR, Liu JB. et al. Perfusion estimation using contrast-enhanced 3-dimensional subharmonic ultrasound imaging: an in vivo study. Invest Radiol. 2013;48(9):654-660
52. Eisenbrey JR, Daecher A, Kramer MR, Forsberg F. Effects of Needle and Catheter Size on Commercially Available Ultrasound Contrast Agents. J Ultrasound Med. 2015;34(11):1961-1968
53. Sun C, Panagakou I, Sboros V. et al. Influence of temperature, needle gauge and injection rate on the size distribution, concentration and acoustic responses of ultrasound contrast agents at high frequency. Ultrasonics. 2016;70:84-91
54. Averkiou M, Keravnou CP, Izamis ML, Leen E. Evaluation of Perfusion Quantification Methods with Ultrasound Contrast Agents in a Machine-Perfused Pig Liver. Ultraschall Med. © Georg Thieme Verlag KG. 2016 Epub ahead of print
55. Jain RK. Normalizing Tumor Microenvironment to Treat Cancer: Bench to Bedside to Biomarkers. J Clin Oncol. 2013;31(17):2205-2218
56. El Kaffas A, Giles A, Czarnota GJ. Dose-dependent response of tumor vasculature to radiation therapy in combination with Sunitinib depicted by three-dimensional high-frequency power Doppler ultrasound. Angiogenesis. 2013;16(2):443-454
57. Hudson JM. Quantification of blood flow using ultrasound contrast agents. John Monte Hudson. 2011:178
58. Ryan TP. Modern Engineering Statistics. New York, NY: Wiley. 2007
Author contact
![]() Corresponding author: Jürgen K. Willmann, M.D., Department of Radiology, Molecular Imaging Program at Stanford School of Medicine, Stanford University, 300 Pasteur Drive, Room H1307, Stanford, CA 94305-5621; P: 650-723-5424; Fax: 650-723-1909; Email: willmannedu
Corresponding author: Jürgen K. Willmann, M.D., Department of Radiology, Molecular Imaging Program at Stanford School of Medicine, Stanford University, 300 Pasteur Drive, Room H1307, Stanford, CA 94305-5621; P: 650-723-5424; Fax: 650-723-1909; Email: willmannedu