Impact Factor
- Issue 14; 2026
- Issue 13; 2026
- Issue 12; 2026
- Issue 11; 2026
- Issue 10; 2026
- Volume 16; 2026
- Advance Articles
- Past Issues
- Cover Images
- Cover Suggestion
- Index & Coverage
- Special Issues
Introduction
Materials and Methods
Results
Discussion
Supplementary Material
Acknowledgements
References
International Journal of Biological Sciences
International Journal of Medical Sciences
 Global reach, higher impact

Theranostics 2017; 7(11):2794-2805. doi:10.7150/thno.19378 This issue Cite
Research Paper
Visualizing Nerve Injury in a Neuropathic Pain Model with [18F]FTC-146 PET/MRI
Bin Shen1†, Deepak Behera1†, Michelle L. James1†, Samantha T. Reyes1, Lauren Andrews1, Peter W. Cipriano1, Michael Klukinov2, Amanda Brosius Lutz3, Timur Mavlyutov4, Jarrett Rosenberg 1, Arnold E. Ruoho4, Christopher R. McCurdy5, Sanjiv S. Gambhir1, 6, David C. Yeomans2, Sandip Biswal1 ![]() , Frederick T. Chin1
, Frederick T. Chin1 ![]()
1. Department of Radiology, Stanford University School of Medicine, Stanford, CA 94305, USA;
2. Department of Anesthesiology, Perioperative and Pain Medicine, Stanford University School of Medicine, Stanford, CA 94305, USA;
3. Department of Developmental Biology, Stanford University School of Medicine, Stanford, CA 94305, USA;
4. Department of Neuroscience, University of Wisconsin, Madison, WI 53726, USA;
5. Department of Medicinal Chemistry, College of Pharmacy, University of Florida, Gainesville, FL, 32610, USA;
6. Departments of Bioengineering and Materials Sciences & Engineering, Stanford University, Stanford, CA 94305, USA.
† Authors contributed equally
Received 2017-1-28; Accepted 2017-3-31; Published 2017-7-8
Abstract

The ability to locate nerve injury and ensuing neuroinflammation would have tremendous clinical value for improving both the diagnosis and subsequent management of patients suffering from pain, weakness, and other neurologic phenomena associated with peripheral nerve injury. Although several non-invasive techniques exist for assessing the clinical manifestations and morphological aspects of nerve injury, they often fail to provide accurate diagnoses due to limited specificity and/or sensitivity. Herein, we describe a new imaging strategy for visualizing a molecular biomarker of nerve injury/neuroinflammation, i.e., the sigma-1 receptor (S1R), in a rat model of nerve injury and neuropathic pain. The two-fold higher increase of S1Rs was shown in the injured compared to the uninjured nerve by Western blotting analyses. With our novel S1R-selective radioligand, [18F]FTC-146 (6-(3-[18F]fluoropropyl)-3-(2-(azepan-1-yl)ethyl)benzo[d]thiazol-2(3H)-one), and positron emission tomography-magnetic resonance imaging (PET/MRI), we could accurately locate the site of nerve injury created in the rat model. We verified the accuracy of this technique by ex vivo autoradiography and immunostaining, which demonstrated a strong correlation between accumulation of [18F]FTC-146 and S1R staining. Finally, pain relief could also be achieved by blocking S1Rs in the neuroma with local administration of non-radioactive [19F]FTC-146. In summary, [18F]FTC-146 S1R PET/MR imaging has the potential to impact how we diagnose, manage and treat patients with nerve injury, and thus warrants further investigation.
Introduction
Peripheral nerve injury, because of trauma, surgery, inflammation or other causes, is a major clinical problem. This type of nerve injury is often associated with chronic pain, weakness, and other sensorimotor disabilities. Current clinical imaging methods used to evaluate chronic pain [e.g., computed tomography (CT), ultrasound imaging (US), and magnetic resonance imaging (MRI)] are focused on imaging anatomic alterations, which do not necessarily reflect the origin of chronic pain [1]. New functional or molecular imaging strategies targeting molecular biomarkers associated with nerve injury/neuroinflammation are needed to overcome the current imaging challenges for locating these injury sites and identifying the source of pain generation in peripheral nerves. A potential biomarker associated with nerve injury and neuroinflammation is the sigma-1 receptor (S1R). This receptor was initially believed to be a subtype of the opioid receptor family [2] but is now known to be a distinct class of receptors with unique biological functions [3, 4]. More specifically, S1Rs can modulate various ion channels and receptors, including potassium channels, calcium channels, dopamine and gamma-amino butyric acid (GABA) receptors [5-8]. This significantly impacts neural excitability and transmission by affecting the release of several neurotransmitters, including serotonin, dopamine, noradrenaline, glutamate, and GABA. Spinal S1R activation can also create mechanical and thermal hypersensitivity [9] and increased N-methyl-D-Aspartate (NMDA) receptor-induced pain [10].
S1Rs appear to play an active role in pain modulation, both centrally and peripherally. In mice genetically modified not to express S1Rs (i.e., S1R knockout mice), the absence of S1R is associated with a decreased response to painful conditions in various pain models, including the partial sciatic nerve ligation and chemotherapy-induced neuropathic pain models [11-15]. Nieto et al. reported that activation of the S1R is necessary for the development of paclitaxel-induced peripheral nerve damage and neuropathic pain. Moreover, paclitaxel-induced neuropathic pain is inhibited by the S1R antagonist in wild type mice or is not detected in S1R KO mice [16]. In addition, S1Rs are also involved in “memorizing” pain (by synaptic plasticity and central sensitization), which is responsible for the chronic and self-perpetuating nature of certain pain conditions [13, 14]. Thus, it is not surprising that S1R antagonists are rapidly becoming candidates as next generation analgesics [17].
In this study, a series of experiments (Figure 1A) were designed to test the feasibility of employing a S1R-selective radioligand, as an in vivo PET-biomarker of nerve injury/neuropathic pain. We recently developed [18F]FTC-146 as a new S1R-selective PET probe candidate (S1R Ki = 2.5x10⁻³ nM; S2R Ki = 3.6x10² nM), and demonstrated its specificity and selectivity for imaging S1Rs in mice, rats, and monkeys [18-20]. Herein, we evaluated [18F]FTC-146 as a strategy for imaging S1Rs in a rat model of nerve injury via PET/MRI. The results described here could support the translation of this PET agent [21] to identify peripheral pain generators in patients suffering from neuropathic pain.
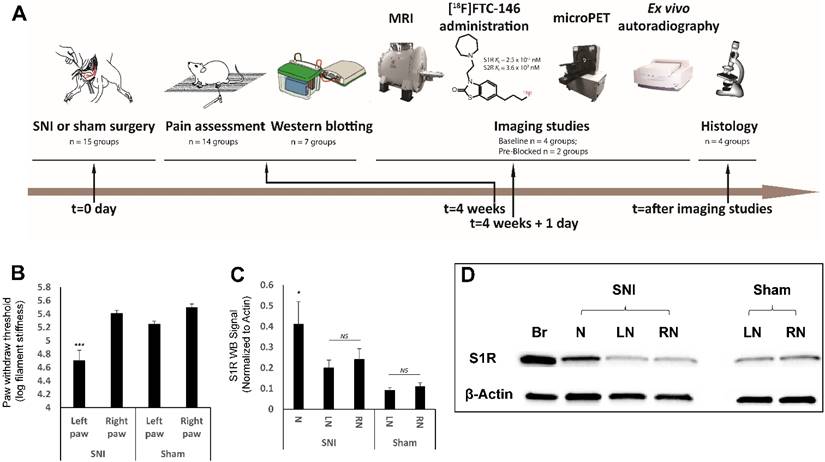
Experimental design and timeline, behavioral pain measurement and S1R western blotting. (A) Our studies involved three type of rats; spared nerve injury (SNI), sham, and control. The SNI rats underwent axotomy and ligation of the tibial and common peroneal nerves, with cautious sparing of the sural nerve; the sham rats underwent a surgery similar to SNI rats but without nerve injury; and the controls were left as naive rats (i.e., no surgery was performed). Both SNI and sham operations were performed at t = 0 day followed by pain assessment (von Frey tests) four weeks post-surgery. In the groups for the S1R western blotting experiment, the sciatic nerves were excised from rats, and neuroma was separated from the injured nerve, S1R was extracted from those sample for western blotting analysis. In the other groups, each rat underwent magnetic resonance imaging (MRI) of the thigh region (containing sciatic nerve), followed by injection of the radiotracer ([18F]FTC-146), and subsequent positron emission tomography (PET) imaging. Immediately after PET scanning, both sciatic nerves (left and right) from each rat in each group were harvested and used for either whole nerve autoradiography or sectioned nerve autoradiography and histology. (B) Mechanical allodynia, as evidenced by a reduction in the pressure leading to the withdrawal of paw, was assessed in SNI and sham groups via standard von Frey testing. Average paw withdrawal thresholds are depicted for left and right paws of rats in each group. (C) S1R western blotting results showed S1R expression was significantly elevated at neuroma site in the injured nerve. (D) Representative S1R western blotting image (Br = brain; N = Neuroma; LN = Left Nerve; RN = Right Nerve). Error bars represent standard error of the mean value. ***p<0.005, *p<0.05
Materials and Methods
Animal model of neuropathic pain
Animal experiments were approved by Stanford IACUC. Animals had access to food and water ad libitum and were kept under a 12 h light/dark cycle. Experiments were carried out using adult male Sprague-Dawley rats weighing 200-250 g. Surgery details are described in the Supplementary Information.
Study design
This study was designed to primarily investigate whether [18F]FTC-146 (a S1R radiotracer) can detect nerve injury in a rat model of neuropathic pain. We intentionally set out to use only the number of rats required to perform accurate statistical analyses while minimizing the overall numbers of rats needing to undergo surgery with pain catalog E. Due to radiotracer decay; we could only perform 3 dynamic PET scans followed by MRI (on 3 separate rats) per day. Therefore, we needed multiple imaging days to obtain a sufficiently high sample size in each rat group (i.e., SNI, sham, and control groups). See Table S1 in the Supplementary for details about how each group of rats was imaged and/or assessed via immunohistochemistry/western blotting. We also performed pilot studies to examine the importance of S1Rs in the generation of neuropathic pain in the SNI rat model. As part of these studies, we created additional SNI models (n = 6) and assessed pain response after treating these rats via ultrasound-guided imaging at the site of the neuroma with a pharmacological dose of S1R antagonist [19F]FTC-146 (n = 3) or saline (n = 3).
Assessment of pain (allodynia)
Development of allodynia in the animals was evaluated using the von Frey test, which assessed mechanical allodynia using thin nylon filaments. The test was performed before surgery (baseline) and on the day before imaging. Sensitivity to mechanical stimulation was measured by recording the paw withdrawal response to serially increasing filament stiffness (Supplementary Information).
Western blotting
Primary antibody - anti-S1R rabbit polyclonal antibody (1:250, Invitrogen, catalog number 42-3300, polyclonal affinity-purified antibody raised against a synthetic peptide derived from the C-terminus region of the rat S1R) and secondary antibody - horseradish peroxidase-conjugated goat anti-rabbit antibody (1:3000, Bio-Rad, catalog number 170-6515) were used in a standard Western blotting protocol. The bands obtained were quantified using Bio-Rad Image Lab software, and β-actin was used to normalize the protein loading. The normalized values (to β-actin) of uninjured nerves and neuromas were used for the statistical analysis. More details are described in the Supplementary Information.
Radiosynthesis of [18F]FTC-146
[18F]FTC-146 was synthesized via aliphatic nucleophilic substitution (18F/Tosylate exchange) using TRACERlab FX-FN (GE Healthcare, Supplementary, Figure S1) [19, 21], details are described in the Supplementary Information.
PET/MR imaging
All animals were anesthetized with humidified, oxygen-enriched 2-3% isoflurane (inhalation). The animal was secured in a transportable holder with fixed firm padding to eliminate motion between PET and MRI scans while allowing it to breathe 2-3% isoflurane via a nose cone fixed to the animal holder. Fiducial markers made with a diluted [18F]FTC-146 solution (30 µCi/mL) in longitudinal plastic tubes placed across the bottom of the animal holder were utilized for assistance in PET and MRI image co-registration. The animals underwent sequential PET (microPET R4; Siemens Medical Solutions) and MRI (a self-shielded 30-cm-bore 7-T magnet [Varian] with a 9-cm-bore gradient insert [Resonance Research Inc.] using EXCITE2 electronics and the supporting LX11 platform [GE Healthcare]) using dedicated small animal imaging instruments. For PET imaging, 1000 µCi (37 MBq) [18F]FTC-146 was injected via tail vein, and a 10 min static scan of the thighs was obtained 30 min post-injection. For MRI, T1 Fast Spin Echo images (TR 800 ms; TE 7.7 ms; slice thickness 1 mm; in-plane resolution 234 µm2) were obtained of the rat thighs. Haloperidol (1.6 mg/kg), a widely used S1R blocker, was given intravenously 30 min prior to tracer administration for the blocking studies.
Image analysis
PET and MR images were co-registered using Inveon Research Workplace (IRW) image analysis software (Siemens Healthcare). MR images were used to define the anatomic location of the sciatic nerves and regions of interest (ROIs) were drawn around the injured nerves, proximal to the site of injury, on 5 consecutive transaxial slices covering the neuroma. For uninjured nerves, 2D ROIs were similarly drawn around the corresponding location on 5 slices. Radioactivity counts were then recorded from within the ROIs in the fused PET/MR images. The maximum signals from the ROIs drawn for each nerve were averaged and then normalized to the average signal from adjacent muscle. Since muscle tissue expresses low level S1Rs, it represents non-specific background tracer uptake, which we expect to be very low, and can be used as an internal control to normalize any variability in tracer dose delivery. No attempt was made to compensate for any partial volume effect.
Ex vivo autoradiography
After PET/MR scanning had been completed, tissue containing sciatic nerve and adjacent muscle was rapidly harvested from both hind limbs of rats from each group. For whole nerve autoradiography, the nerves were exposed to a phosphor screen (medium MultiSensitive Phosphor Screen; PerkinElmer) for 12 h. The screen was imaged using a Typhoon 9410 Variable Mode Imager (Amersham Biosciences), and resulting images were analyzed by ImageJ (Image Processing and Analysis in Java, version 1.46; http://imagej.nih.gov/ij/index.html). For nerve/muscle sections, tissue blocks were quickly frozen in optimal cutting temperature (O.C.T.) compound (Tissue-Tek, Sakura, USA) and 6 μm-thick sections were cut using a cryostat microtome HM500 (Microm) and mounted on microscope slides (Fisherbrand Superfrost® Plus Microscope Slides). The mounted sections were air-dried for 10 min and then exposed to 18F-sensitive storage phosphor screens (Perkin Elmer) for 12 h. The image plates were scanned with a Typhoon 9410 Variable Mode Imager (Amersham Biosciences), and resulting images were analyzed by ImageJ.
Immunohistochemistry
Rat sciatic nerve sections (6 µm) were incubated in TBST (1% Triton X-100) containing 10% normal goat serum (NGS, Vector Laboratories) for 1 h to block unspecific staining and permeabilize tissue. Following this, sections were incubated with S1R primary antibody (rabbit polyclonal, affinity purified, anti-S1R antibody) [22, 23] 1:200 in TBST (0.1% Triton X-100) containing 5% NGS for 24 h. Sections were then probed with affinity purified biotinylated goat anti-rabbit secondary antibody 1:400 (Vector Laboratories, catalog number BA-1000) in TBST (0.1% Triton X-100) containing 5% NGS for 1 h at room temperature. To verify the specificity of this anti-S1R primary antibody in our own hands, we stained S1R positive control tissue (i.e., wild-type mouse brain - which is known to contain a significant level of S1Rs) and negative control tissue (i.e., S1R-knockout mouse brain). We observed intense cytoplasmic and membrane staining of cell bodies in wild-type mouse brain and no detectable staining of S1R-knockout brain tissue (Supplementary Figure S2) - thus confirming the specificity of this anti-S1R antibody. Specificity of secondary antibody was confirmed by the lack of signal in slides stained with secondary-only (i.e., no primary antibody) - see Supplementary Figure S3.
Stained slides were scanned with a NanoZoomer 2.0-HT Slide Scanner (Hamamatsu) and representative 1×, 20×, and 40× images were saved as TIF files using NDP.view2 U12388-01. For assessment of S1R staining in both injured and uninjured rat nerves, one 40× field containing the neuroma or normal nerve was analyzed per section (n = 4 rats per group). Values for each field within a given rat were averaged to yield one value per rat. Percent area occupied by S1R staining was determined using ImageProPlus thresholding software (Media Cybernetics). Pixel intensity of S1R staining from the same fields was measured by optical densitometry (OD) using UN-SCAN-IT gel 6.1 software (Segment Analysis function).
Immunofluorescence
Double immunofluorescent staining of S1R and Schwann cells was performed using rat sciatic nerve (specific details are described in Supplementary). Briefly, we used rabbit polyclonal, affinity purified, anti-S1R antibody (1:100), and mouse monoclonal anti-S100β antibody (1:100, Sigma Aldrich, catalog number S2532), along with secondary antibodies 1:1000 (Alexa 488-conjugated goat anti-mouse IgG and Alexa 594-conjugated goat anti-rabbit IgG purchased from Jackson ImmunoResearch). Sections were visualized with Olympus IX89 microscope using 10×, 20×, and 40× objectives. To verify the specificity of anti-S1R and anti-S100β primary antibody, we performed immunofluorescent staining of injured and uninjured sciatic nerves using anti-S100β, anti-S1R, and/or isotype control antibody (Supplementary Figure S4). The characteristic S1R and S100β staining observed in both nerves, and the lack of staining seen with isotype control antibody suggest that our anti-S1R and the anti-S100β antibody is likely specific.
Treatment of neuroma under ultrasound guidance
A von Frey test was performed on rats 4 weeks after SNI surgery, then 50 µL of a prepared [19F]FTC-146 solution (7.2 mg/ml in saline) was injected at the neuroma site under real-time ultrasound-guided imaging (VisualSonics Vevo 220). 24 h3 after treatment, another von Frey test was done to assess pain response. Surgery details are described in the Supplementary Information.
Statistics
Statistical analysis was done using GraphPad Prism (version 6). One-way between subjects Analysis of Variance (ANOVA) was performed to compare multiple means of normalized PET signals and autoradiography signals, followed by Sidak's multiple comparisons test if significance was achieved. α = 0.05 was considered significant. All values in the text represent mean ± standard deviation. Error bars in figures represent standard errors of means. Mean PET signals were tested for linear correlation. Two-tailed paired t-tests were used to compare % area occupied by S1R staining and S1R staining intensity between the injured and uninjured nerves. Pearson's product-moment correlation coefficient was computed to assess the relationship between S1R immunostaining and PET signals. For S1R western blotting analysis a Wilcoxon test was performed to compare the S1R level in neuroma and uninjured nerve. In the pain relief experiment, 2-tailed paired t-tests were performed to compare between von Frey results at baseline and 24 h within the [19F]FTC-146 as well as saline treated rats. Unpaired t-tests were performed to compare results between [19F]FTC-146 and saline treated rats at each time point.
Results
Assessment of pain
We used a well-established rat model of neuropathic pain and nerve injury, known as the spared nerve injury (SNI) model [24], whereby we severed the tibial and common peroneal branches but carefully spared the sural branch of the left sciatic nerve. Four weeks after this surgical procedure we tested for pain behavioral responses; von Frey assays were performed to confirm the development of pain in SNI rats and lack of pain in sham-operated rats (surgical wound but no nerve injury) and control rats (no surgical wound and no nerve injury) (Figure 1A).
Von Frey tests indicated the development of allodynia (pain produced by an otherwise non-painful stimulus) in the left hind paws of SNI rats. In the group of rats for western blotting analyses, the SNI rats exhibited decreased paw withdrawal thresholds, indicating pain at the injured nerve in left hind limb (in log filament stiffness units, 4.71 ± 0.15; n = 7) relative to levels observed for the uninjured right nerve of SNI rats (5.41 ± 0.04; n = 7; p<0.005) and the nerves of sham-operated rats (left nerve: 5.25 ± 0.04; n = 7; p<0.005 and right nerve: 5.50 ± 0.05; n = 7; p<0.005) (Figure 1B). In the group of rats for PET imaging studies, von Frey values showed 4.92 ± 0.07 (n = 7) in the injured left nerve compared to the uninjured right nerve of SNI rats (5.85 ± 0.15; n = 7; p<0.0001), the nerves of sham-operated rats (left nerve: 5.86 ± 0.15; n = 7; p<0.0001 and right nerve: 5.72 ± 0.27; n = 7; p<0.0001), and the nerves of control rats (left nerve: 5.76 ± 0.16; n = 7; p<0.0001 and right nerve: 5.77 ± 0.17; n = 7; p<0.0001) (Figure 2D).
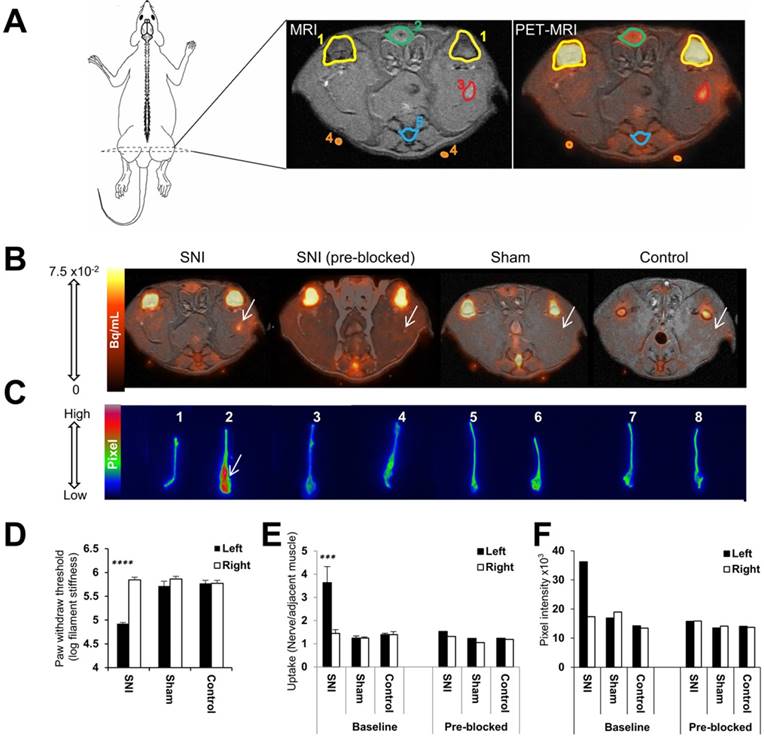
Visualization and quantitation of [18F]FTC-146 accumulation in rats with and without nerve injury via PET/MRI and ex vivo autoradiography. (A) Diagram of a rat depicting the location of the PET/MR image slices. A labeled version of the MR and PET/MR fused image slice is shown, whereby 1 = knee joint, 2 = penile urethra, 3 = site of nerve injury (i.e., neuroma), 4 = fiducial, and 5 = vein and tail. (B) Representative axial PET/MR images through the thighs of SNI, SNI (pre-blocked), sham, and control rats. The White arrow points to [18F]FTC-146 accumulation in the injured left nerve of SNI rat. (C) Ex vivo autoradiography of representative excised whole sciatic nerves from SNI, SNI (pre-blocked), sham, and control rats. Nerve 1 is the right (uninjured) whereas nerve 2 is the left (injured) sciatic nerve from a representative SNI rat; nerves 3 and 4 are the right (uninjured) and left (injured) sciatic nerves from a SNI rat - however this rat was pre-treated with a haloperidol prior to radiotracer administration, thus serving to block accumulation of [18F]FTC-146; nerves 5 and 6 are the right and left sciatic nerves from a sham-operated rat (sham surgery was performed on left side of the rat without causing nerve injury); nerves 7 and 8 are the right and left sciatic nerves from a control rat. White arrow points to the neuroma of the left injured nerve of a SNI rat. (D) Pain assessment of rat groups for PET/MRI and autoradiography images by von Frey tests. (E) The average normalized maximum signal in left and right sciatic nerves from rats in each group as determined via PET/MRI (n = 4). (F) Signal intensity in left and right sciatic nerves from rats in each group as determined via ex vivo autoradiography of whole nerves (n = 2). Error bars represent standard error of the mean value. ****p<0.0005, ***p<0.005.
Western blotting analysis of S1R levels in nerve injury
Analysis of S1R western blotting data revealed a significant increase in S1R protein expression in neuroma (0.41 ± 0.29; n = 7) versus the segment of the peripheral nerve proximal to the neuroma (0.20 ± 0.10; n = 7; p < 0.05) and the contralateral uninjured nerve (0.24 ± 0.14; n = 7; p < 0.05) in SNI rats, but no significant difference was shown between the S1R protein level in left and right nerve in sham rats (Figure 1C). This data confirmed that the S1R level was elevated only in the injured site of sciatic nerve compared to other regions analyzed.
Radiosynthesis of [18F]FTC-146
[18F]FTC-146 was synthesized with a radiochemical yield of 5.75 ± 1.71% (n = 11) and a specific radioactivity of 7.92 ± 4.74 Ci/μmol (293.04 ± 182.04 GBq/μmol) using previously reported method [19, 21]. The final product was formulated in saline that contained 10% ethanol (v/v). Both radiochemical and chemical purities were greater than 99%. All radiochemical yields and specific radioactivities were decay-corrected to end-of-bombardment.
Imaging S1R-levels in model of nerve injury and neuropathic pain
To evaluate the feasibility and utility of S1R imaging as a potential non-invasive method of locating sites of nerve injury, we set out to assess the uptake of the S1R selective radioligand [18F]FTC-146 in sciatic nerves of SNI, sham-operated, and control rats via PET/MRI (Figure 2A and 2B) and ex vivo autoradiography (Figure 2C). Both imaging techniques demonstrated visual evidence of increased radiotracer accumulation in injured sciatic nerve (left hind limb) of SNI rats compared to uninjured nerves of SNI, sham, and control rats. Quantitation of PET images revealed elevated [18F]FTC-146 accumulation (normalized to adjacent muscle) in the injured nerve (nerve to muscle ratio = 3.64 ± 1.38; n = 4) compared to the uninjured right sciatic nerve (1.44 ± 0.33; n = 4; p<0.0005) of SNI rats, the nerves of the sham-operated rats (left nerve: 1.24 ± 0.10; n = 4; p<0.0005 and right nerve: 1.25 ± 0.19; n = 4; p<0.0005), and the nerves of control rats (left nerve: 1.41 ± 0.26; n = 4; p<0.0005 and right nerve: 1.40 ± 0.12; n = 4; p<0.0005) (Figure 2E). The fact that [18F]FTC-146 uptake in rat skeletal muscle was relatively low (~6.5-fold lower than uptake in injured nerves) and since the signal in muscle did not vary between the different rat groups meant that this tissue could serve as a suitable reference region for our PET image analysis/normalization. The use of a reference region helps to minimize unwanted intra-/inter-subject and PET scanner variability and maximize one's ability to detect subtle differences robustly in target expression levels.
To ensure that the in vivo uptake of radiotracer did not represent the distribution of non-specific [18F]FTC-146 binding, a sub-group of SNI, sham-operated, and control rats were pre-treated with haloperidol, a known S1R blocking agent, prior to radiotracer injection. The injured left sciatic nerves of the SNI rats pre-treated with haloperidol showed markedly reduced [18F]FTC-146 uptake relative to baseline (1.53; n = 2). Haloperidol pre-treatment did not appear to affect [18F]FTC-146 uptake in the sciatic nerves of sham or control rats.
The maximum PET signal in the SNI nerves, represented as absolute tracer uptake (i.e., percent injected dose per gram of tissue; %ID/gm), was 0.32 ± 0.04 %ID/gm in injured nerves and 0.15 ± 0.03 %ID/gm in uninjured nerves (p<0.0005).
Autoradiography of whole excised sciatic nerves showed higher signal in the left injured nerve of SNI rats (maximum pixel intensity value/µm2: 36.22×10³; n = 2) than in the right uninjured nerve (17.37×10³; n = 2), in the nerves of sham-operated rats (left nerve: 18.97×10³; n = 2 and right nerve: 16.94×10³; n = 2), and in the nerves of control rats (left nerve: 13.46×10³; n = 2 and right nerve: 14.22×10³; n = 2) (Figure 2C and 2F). Consistent with PET/MRI data, pretreatment with haloperidol significantly reduced [18F]FTC-146 accumulation in the injured nerves (15.78×10³; n = 2) (Figure 2F). Similarly, ex vivo autoradiography of 6 µm-thick nerve sections also showed increased signal in the neuroma at the site of transection of injured sciatic nerves compared to the uninjured nerves (Figure 3A). Moreover, the average signal intensities from autoradiography of whole nerves correlated with normalized PET signal (r(24) = 0.78; p<0.0001, Figure S5).
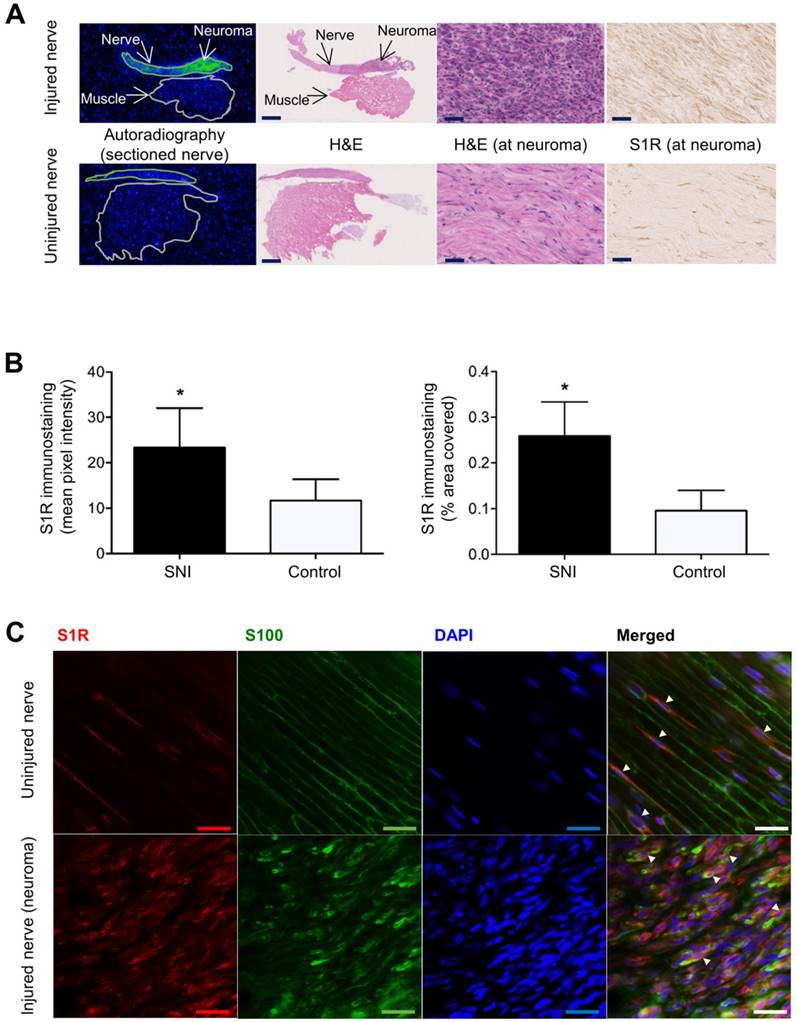
Images and quantitation of ex vivo autoradiography and S1R staining of injured and uninjured rat sciatic nerve sections. (A) Representative autoradiography images of injured (upper panel) versus uninjured (lower panel) nerve sections, H&E staining of the same section used for autoradiography, and immunohistochemical staining of S1R in injured versus uninjured nerves. Whole nerve and muscle images were taken at 1× magnification, scale bar = 2.0 mm; neuroma images were taken at 40× magnification, scale bar = 50 µm. (B) Quantitative bar graphs showing the % area occupied by S1R staining and the mean pixel/S1R-staining intensity in injured (n = 4) versus uninjured (n = 4) nerves. Error bars represent standard error of the mean value, *p<0.05. (C) Double immunofluorescence staining of injured (two upper panels) and uninjured (two lower panels) sciatic nerves. Schwann cell (using anti-S100β antibody) is shown in green, whereas S1R immunostaining (using anti-S1R antibody) is shown in red. DAPI (4',6-diamidino-2-phenylindole) nuclear counterstaining is shown in blue, and the merged image of all three stains for both the injured and uninjured nerves is shown on the far right of each row. All images were taken at 40× magnification, scale bar = 10 µm.
In summary, we could use the S1R radiotracer, [18F]FTC-146, to accurately detect the site of nerve injury in SNI rats via PET/MR imaging and ex vivo autoradiography. Blocking studies with haloperidol demonstrated that our PET signal was likely due to specific binding of [18F]FTC-146 to S1Rs.
Histological evaluation of S1R levels in nerve injury
To investigate whether [18F]FTC-146 accumulation in PET and autoradiography images corresponds with the levels and distribution of S1Rs, S1R staining of injured and uninjured rat sciatic nerves was performed. Staining of 6 μm-thick sciatic nerve sections adjacent to those used for autoradiography (above), with a S1R-specific antibody (validated by lack of staining in S1R-KO mouse brain tissue - Supplementary Figure S2), revealed elevated levels of S1R staining in injured nerves (n = 4) compared to uninjured control nerves (n = 4) (Figure 3A). Within each injured nerve, the neuroma itself visually contained the highest levels of S1R staining compared to the rest of the nerve (Supplementary Figure S3). Quantitation of staining (Figure 3B) showed two-fold higher S1R staining in injured nerves (within the neuroma) compared to uninjured nerves using two different quantitation methods: (i) % area occupied by S1R staining (injured nerves: 0.26 ± 0.038; n = 4; vs. uninjured nerves: 0.096 ± 0.022; n = 4; p<0.01), and (ii) mean pixel intensity of S1R staining (injured nerves: 23.3 ± 4.37; n = 4; vs. uninjured nerves: 11.7 ± 2.34; n = 4; p<0.05).
To obtain a first impression of the cell type(s) responsible for increased S1R expression in injured nerves, we tested the hypothesis that Schwann cells express S1R in the neuroma since Schwann cells are known to proliferate in sites of nerve injury [25] and have been reported to express S1R in uninjured rat sciatic nerves [26]. We performed double immunofluorescent staining with S1R and S100β (a marker for Schwann cells) to investigate whether S1R and Schwann cells are co-expressed in injured nerves. Our results demonstrated elevated levels of S1R and S100β immunoreactivities in injured nerves compared to uninjured nerves. Visually, the highest levels of S1R/S100β staining were seen in the neuroma. Merged images (S100β/S1R/DAPI) showed co-localization of S1R staining with S100β staining (Figure 3C), both in injured and uninjured sciatic nerve tissue. Merged images also showed much higher cellularity (as seen via DAPI, which is a nuclear stain) in injured nerves compared to uninjured nerves, which is consistent with the normal process of Wallerian degeneration that occurs before nerve regeneration [25].
Correlation of PET/autoradiography with Von Frey and S1R immunostaining
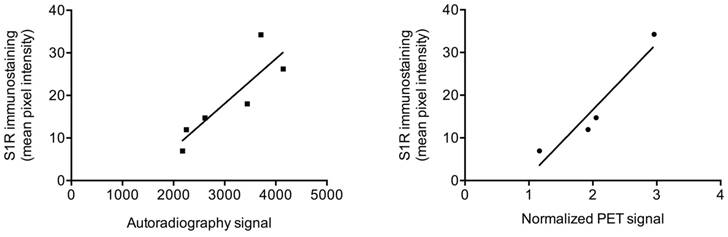
We examined the relationship between von Frey test results and the normalized PET signal in sciatic nerves (for rats that were not pre-treated with haloperidol) and found a strong negative correlation (r(12) = -0.78; p < 0.005). That is, a lower von Frey threshold, denoting greater pain, correlated with increased PET signal. We also examined the relationship between the immunohistochemical quantification of S1R expression and normalized PET signal or autoradiography signal in rat sciatic nerves. We found a very strong correlation between mean pixel intensity of S1R staining and normalized PET signal (r(4) = 0.95; p < 0.05), as well as with signal from autoradiography of nerve sections (r(6) = 0.87; p < 0.05) (Figure 4).
Correlation between autoradiography/PET and S1R staining. Scatter plots of autoradiography signal (as determined from nerve sections) or normalized [18F]FTC-146 PET signal against S1R staining pixel intensity in injured/uninjured nerves are shown.
Pilot pain treatment studies using [19F]FTC-146
To investigate if blocking S1Rs in the neuroma affects pain behavioral response, three SNI rats were treated with [19F]FTC-146, which is the non-radioactive version of [18F]FTC-146 and a S1R antagonist, by direct injection at the neuroma under ultrasound guidance. Three additional SNI rats treated with saline were used as controls. After 24 h post-treatment with [19F]FTC-146, the treated rats showed lower mechanical allodynia (threshold for pain = 4.96 ± 0.19; n = 3) as opposed to rats treated with saline (4.30 ± 0.23; n = 3) (p < 0.05). No significant difference was seen in the [19F]FTC-146-treated and saline-treated rats at baseline (4.35 ± 0.2 vs. 4.19 ± 0.12; n = 3; respectively). Similarly, no difference was seen in the von Frey test responses on the right uninjured paw between the two treatments, at either baseline or 24 h post-treatment (see Supplementary Figure S6).
Discussion
There were five key findings of this study: 1) [18F]FTC-146-PET/MRI enabled non-invasive detection of subacute peripheral nerve injury in a rat model of neuropathic pain; 2) the normalized PET signal in injured sciatic nerves correlated with pain sensitivity/severity; 3) the site of nerve injury was shown to contain increased expression of S1Rs, which was co-expressed in part with Schwann cells; 4) there was significant correlation between the levels of S1Rs, as determined by immunohistochemistry, and the uptake of [18F]FTC-146, as seen in PET and autoradiography images; and 5) direct treatment of the neuroma with [19F]FTC-146 decreases levels mechanical allodynia in animals with neuropathic pain.
The strong correlation between PET signal and pain levels indicates that this imaging strategy has the potential to provide accurate, non-invasive estimates about pain severity. Additionally, the significant correlation between PET/autoradiography signal and S1R staining means that [18F]FTC-146-PET/MRI could act as a potential biomarker of nerve injury by providing information concerning the precise location and magnitude of S1R-expression. Furthermore, blocking S1Rs at the site of the neuroma with a pharmacological dose of [19F]FTC-146 (under ultrasound guidance) produced pain relief. Overall, our results indicate specific binding of [18F]FTC-146 to S1Rs in sites of a subacute, 4-week-old nerve injury and suggest that increased S1R expression is associated with nerve injury and pain symptomology. While others have demonstrated the importance of S1Rs in central sensitization in sciatic nerve injury [13], this study is the first demonstration of visualizing elevated S1R expression at the peripheral nerve injury site.
In our studies, we observed co-localization of S1R staining with S100β staining in both injured and uninjured nerves, which agrees with a previous report that describes S1R expression in Schwann cells in the normal (uninjured) rat sciatic nerve [26]. While these results suggest that S1R expression arises from Schwann cells, these findings do not tell us whether increased S1R expression in injured nerves is due to expression in Schwann cells exclusively. Other cell types, including neurons and cells involved in inflammation, could contribute to S1R expression in the SNI model. Future studies will involve extensive investigation into which cell types express S1R in this model, and thus which cell types contribute to our PET signal in the presence of nerve injury. Regardless of the cell types expressing S1Rs, the close relation between S1Rs and chronic pain highlights the utility of [18F]FTC-146 PET/MRI as a viable technique for identification of nerve injury in the subacute period and, therefore, could potentially be used as a method of identifying pain generators as it relates to nerve injury.
Our results complement Bangaru et al.'s finding that S1R expression is decreased in the cytoplasm of rat dorsal root ganglion (DRG) neurons and satellite ganglion cells of axotomized nerves [27]. Due to the observed decrease in S1R expression in the DRG, the investigators conjectured that elevated S1R expression in neuropathic pain was not an explanation for pain relief after S1R blockade. In contradistinction, our results found increased S1Rs in the peripheral nerve at the site of nerve injury, some of which was realized in Schwann cells of the neuroma. It is therefore possible that, like glial cells in the central nervous system, S1R-enriched Schwann cells in the periphery play an important modulatory role in nociception. The increase of S1Rs in Schwann cells may also help explain the analgesic effect of S1R antagonists on neuropathic pain. Indeed, the persistence of Schwann cells in a chronic constrictive injury has been associated with the onset and persistence of neuropathic pain in this model [28]. This agrees with our results from ultrasound-guided treatment of the neuroma; the ability to reduce pain by treating the site of injury with an S1R blocker (i.e., [19F]FTC-146) demonstrates the involvement of S1Rs within the sciatic nerve in the generation of neuropathic pain.
The increase in Schwann cell numbers seen in our experiments is not unexpected at approximately 4 weeks after nerve injury. Within a couple of days after the transection of rat sciatic nerves or nerve roots, Schwann cells pause their myelin producing function, upregulate genes associated with the repair process and begin proliferating [29-31]. Initially, they remove degenerated extracellular debris, but approximately one week after the injury they recruit macrophages to continue this task [32]. Finally, the Schwann cells seek to align themselves into bands of Bungner, to support regrowth of the injured axons [33, 34]. The peak rate of Schwann cell proliferation is reached within a week, but the increased cell numbers are sustained for several weeks in preparation for nerve regeneration. If nerve growth does not occur, the ability of Schwann cells to survive and provide support to the neuron begins to decline within about eight weeks in a rat model [30, 35]. It can, however, take months for all denervated Schwann cells to die by apoptosis [36]. In our experiment, we scanned the rats at 4 weeks after injury, which is within the time window where an increased number of Schwann cells is expected. The increased PET signal seen at this time agrees with the time course of Schwann cell changes during Wallerian degeneration reported in the literature.
Current methods of diagnosing nerve injury and chronic pain include CT, US, MRI and electrophysiologic (i.e., electrodiagnostic or electroneurographic) tests, namely electromyography, quantitative neurosensory testing and nerve conduction studies. However, these tests suffer from various limitations and/or inaccuracies in determining cause and location of nerve injury [36-39]. These limitations include, but are not restricted to, invasiveness, propensity to technical and operator-dependent errors, and/or lack of sufficient sensitivity and specificity to diagnose nerve injury.
Considering the challenges of current clinical methods, the identification of non-invasive molecular imaging approaches that exploit biochemical and cellular markers is of paramount importance for advancing the management of nerve injury, neuroinflammation and the ensuing clinical manifestations of these entities. Our study demonstrates a molecular imaging method that satisfies the need for sensitivity and specificity in diagnosing nerve injury. One of the key strengths of our imaging approach is the combination of PET and MRI; the high sensitivity and molecular imaging capability of PET combined with the high spatial resolution and superior soft-tissue contrast of MRI allows for the simultaneous visualization of biochemical and anatomical alterations. While the use of PET/MRI has not yet been reported for clinical imaging of chronic pain and/or nerve injury, the increasing commercial availability of combined clinical PET/MR systems globally affords a great opportunity for improving the way we identify pain generators and regions of nerve injury, leading to better diagnosis and treatment of chronic pain and related conditions.
In addition to the potential clinical application of this technique, [18F]FTC-146 PET/MRI affords us the opportunity to further define the in vivo role of S1Rs in pain. That is, our imaging approach could help us better understand spatiotemporal connection between nerve injury, S1R expression, and pain generation, especially since S1Rs have been known to modulate pain and nociception [14]. Accordingly, these results can help explain why S1R antagonism or absence of S1R in knockout mice give rise to analgesia or attenuated pain behaviors in pre-clinical models of pain [40]. While an attractive approach for pain control, development of S1R antagonists will need to be carefully examined for possible side effects since central S1R activation plays an important role in neuroprotection and nerve regeneration in a number of pre-clinical models [41]. While significant work lies ahead in understanding differential dose-dependent effects on S1R blockade versus activation in human subjects, antagonism of central S1R could potentially give rise to increased neurodegeneration and/or disrepair following ischemic insults or injury. Thus, therapeutic strategies that alleviate pain through modulation of S1R biology will have to be optimized to diminish potential undesirable effects on regenerating tissues and minimize its use in patients recovering from acute stroke or neural injury.
In conclusion, the results of the current study show that we can non-invasively detect increased S1R density at the site of nerve injury in a neuropathic pain model via the use of a novel S1R radioligand ([18F]FTC-146) and PET/MRI. This study is, to the best of our knowledge, the first to demonstrate the feasibility of imaging S1Rs in peripheral nerve injury. Therefore, these results highlight the potential of S1R-PET imaging as a non-invasive biomarker of nerve injury and inflammation. Recently, we received eIND (exploratory Investigational New Drug) approval from the FDA for an [18F]FTC-146 clinical trial involving first-in-human studies with normal volunteers and patients suffering from chronic pain. We will assess this technique for image-guided delivery of pain therapeutics and for evaluation of novel analgesics related to S1R antagonism.
Supplementary Material
Supplementary figures and tables.
Acknowledgements
This project was supported in part by Ben and Catherine Ivy Foundation (FTC), the NCI ICMIC P50 CA114747 (SSG), NIDA R01 DA023205 (CRM), NIGMS P20 GM104932 (CRM), NIH R21 NS075820 (AER), NIH T32 HD007249 (ABL), the Center for Biomedical Imaging at Stanford, Stanford Medical Scientist Training program, and the UW McPerson Eye Research Institute Retina Research Foundation Edwin and Dorothy Gamewell Professorship (AER).
We would like to thank Ms. Preeti Borgohain, Ms. Minal Patankar, Mr. Shawn Scatliffe, Dr. Xiaoliang Zhou, Dr. Ahmad Salehi and Dr. Richard Luong for their technical assistance and useful discussion concerning S1R staining and peripheral nerve histological analysis respectively. We would also like to thank the Stanford Cyclotron & Radiochemistry Facility and Small Animal Imaging Facility for their valuable support.
Competing Interests
The authors have declared that no competing interest exists.
References
1. Jarvik JG, Yuen E, & Kliot M, Diagnosis of carpal tunnel syndrome. electrodiagnostic and MR imaging evaluation. Neuroimag Clin N Am. 2004;14(1):93-102
2. Martin WR, Eades CG, Thompson JA. et al. Effects of Morphine-Like and Nalorphine-Like Drugs in Nondependent and Morphine-Dependent Chronic Spinal Dog. J Pharmacol Exp Ther. 1976;197(3):517-532
3. Su TP, Hayashi T, Maurice T. et al. The sigma-1 receptor chaperone as an inter-organelle signaling modulator. Trends Pharmacol Sci. 2010;31(12):557-566
4. Walker JM, Bowen WD, Walker FO. et al. Sigma-Receptors - Biology and Function. Pharmacol Rev. 1990;42(4):355-402
5. Aydar E, Palmer CP, Klyachko VA. et al. The sigma receptor as a ligand-regulated auxiliary potassium channel subunit. Neuron. 2002;34(3):399-410
6. Iyengar S, Dilworth VM, Mick SJ. et al. Sigma Receptors Modulate Both A9 and A10 Dopaminergic-Neurons in the Rat-Brain - Functional Interaction with NMDA Receptors. Brain Res. 1990;524(2):322-326
7. Urani A, Privat A, & Maurice T. The modulation by neurosteroids of the scopolamine-induced learning impairment in mice involves an interaction with sigma(1) (sigma(1)) receptors. Brain Res. 1998;799(1):64-77
8. Zhang HL, Cuevas J. Sigma receptors inhibit high-voltage-activated calcium channels in rat sympathetic and parasympathetic neurons. J Neurophysiol. 2002;87(6):2867-2879
9. Roh DH, Choi SR, Yoon SY. et al. Spinal neuronal NOS activation mediates sigma-1 receptor-induced mechanical and thermal hypersensitivity in mice: involvement of PKC-dependent GluN1 phosphorylation. Br J Pharmacol. 2011;163(8):1707-1720
10. Kim HW, Roh DH, Yoon SY. et al. Activation of the spinal sigma-1 receptor enhances NMDA-induced pain via PKC- and PKA-dependent phosphorylation of the NR1 subunit in mice. Br J Pharmacol. 2008;154(5):1125-1134
11. Romero L, Zamanillo D, Nadal X. et al. Pharmacological properties of S1RA, a new sigma-1 receptor antagonist that inhibits neuropathic pain and activity-induced spinal sensitization. Br J Pharmacol. 2012;166(8):2289-2306
12. Nieto FR, Cendán CM, Sánchez-Fernández C. et al. Role of Sigma-1 Receptors in Paclitaxel-Induced Neuropathic Pain in Mice. J Pain. 2012;13(11):1107-1121
13. de la Puente B, Nadal X, Portillo-Salido E. et al. Sigma-1 receptors regulate activity-induced spinal sensitization and neuropathic pain after peripheral nerve injury. Pain. 2009;145(3):294-303
14. Drews E & Zimmer A. Central sensitization needs sigma receptors. Pain. 2009;145(3):269-270
15. Entrena JM Cobos EJ, Nieto FR. et al. Sigma-1 receptors are essential for capsaicin-induced mechanical hypersensitivity: Studies with selective sigma-1 ligands and sigma-1 knockout mice. Pain. 2009;143(3):252-261
16. Nieto FR Cendán CM, Cañizares FJ. et al. Genetic inactivation and pharmacological blockade of sigma-1 receptors prevent paclitaxel-induced sensory-nerve mitochondrial abnormalities and neuropathic pain in mice. Mol Pain. 2014;10:11
17. Wunsch B. The sigma(1) Receptor Antagonist S1RA Is a Promising Candidate for the Treatment of Neurogenic Pain. J Med Chem. 2012;55(19):8209-8210
18. James ML, Shen B, Nielsen CH. et al. Evaluation of Sigma-1 Receptor Radioligand [18F]FTC-146 in Rats and Squirrel Monkeys using Positron Emission Tomography. J Nucl Med. 2014;55:147-153
19. James ML, Shen B, Zavaleta CL. et al. New Positron Emission Tomography (PET) Radioligand for Imaging sigma-1 Receptors in Living Subjects. J Med Chem. 2012;55(19):8272-8282
20. Shen B, James ML, Andrews L. et al. Further validation to support clinical translation of [18F]FTC-146 for imaging sigma-1 receptors. EJNMMI Res. 2015;5:49
21. Shen B, Park JH, Hjørnevik T. et al. Radiosynthesis and First-In-Human PET/MRI Evaluation with Clinical-Grade [18F]FTC-146. Mol Imaging Biol. 2017 in press
22. Mavlyutov TA, Epstein ML, Andersen KA. et al. The Sigma-1 Receptor Is Enriched in Postsynaptic Sites of C-Terminals in Mouse Motoneurons. An Anatomical and Behavioral Study. Neuroscience. 2010;167(2):247-255
23. Ramachandran S, Lu H, Prabhu U. et al. Purification and characterization of the guinea pig sigma-1 receptor functionally expressed in Escherichia coli. Protein Expr Purif. 2007;51:283-292
24. Decosterd I, Woolf CJ, Spared nerve injury. an animal model of persistent peripheral neuropathic pain. Pain. 2000;87(2):149-158
25. Campbell WW. Evaluation and management of peripheral nerve injury. Clin Neurophysiol. 2008;119(9):1951-1965
26. Palacios G, Muro A, Verdu E. et al. Immunohistochemical localization of the sigma1 receptor in Schwann cells of rat sciatic nerve. Brain Res. 2004;1007:65-70
27. Bangaru ML, Weihrauch D, Tang QB. et al. Sigma-1 receptor expression in sensory neurons and the effect of painful peripheral nerve injury. Mol Pain. 2013;9:47
28. Marinelli S, Nazio F, Tinari A. et al. Schwann cell autophagy counteracts the onset and chronification of neuropathic pain. Pain. 2014;155:93-107
29. Trapp BD, Hauer P, Lemke G. Axonal Regulation of Myelin Protein mRNA Levels Myelinating Schwann Cells. J Neurosci. 1988;8(9):3515-3521
30. Liu HM, Yang LH, Yang YJ, Schwann cell properties. 3. C-fos expression, bFGF production, phagocytosis and proliferation during Wallerian degeneration. J Neuropathol Exp Neurol. 1995;54(4):487-496
31. Murinson BB, Archer DR, Li Y. et al. Degeneration of myelinated efferent fibers prompts mitosis in Remak Schwann cells of uninjured C-fiber afferents. J Neurosci. 2005;25(5):1179-87
32. Perry VH, Tsao JW, Fearn S. et al. Radiation-induced Reductions in Macrophaae Recruitment Have Only Slight Effects on Myelin Degeneration in Sectioned Peripheral Nerves of Mice. Eur J Neurosci. 1995;7(2):271-280
33. Griffin JW, Thompson WJ. Biology and pathology of nonmyelinating schwann cells. Glia. 2008;56:1518-1531
34. Stoll G, Griffin JW, Li CY. et al. Wallerian degeneration in the peripheral nervous system: participation of both Schwann cells and macrophages in myelin degradation. J Neurocytol. 1989;18(5):671-683
35. Sulaiman OAR, Gordon T. Effects of Short- and Long-Term Schwann Cell Denervation on Peripheral Nerve Regeneration, Myelination, and Size. Glia. 2000;32(3):234-246
36. Sartoretti-Schefer S, Brandle P, Wichmann W. et al. Intensity of MR contrast enhancement does not correspond to clinical and electroneurographic findings in acute inflammatory facial nerve palsy. Am J Neuroradiol. 1996;17(7):1229-1236
37. Mondelli M, Filippou G, Gallo A. et al. Diagnostic utility of ultrasonography versus nerve conduction studies in mild carpal tunnel syndrome. Arthritis Rheum. 2008;59(3):357-366
38. Terzis JK, Novikov ML. Radiological and Electrophysiological Detection of Nerve Roots Avulsion in Patients with Birth-Related Brachial Plexus Paralysis. Semin Plast Surg. 2005;19(1):24-41
39. Wilber DJ, Olshansky B, Moran JF. et al. Electrophysiological Testing and Nonsustained Ventricular-Tachycardia - Use and Limitations in Patients with Coronary-Artery Disease and Impaired Ventricular-Function. Circulation. 1990;82(2):350-358
40. Romero L, Merlos M, Vela JM. Antinociception by Sigma-1 Receptor Antagonists: Central and Peripheral Effects. Adv Pharmacol. 2016;75:179-215
41. Li Volti G, Murabito P. Sigma-1 receptor and neuroprotection: current outlook and potential therapeutic effects. Neural Regen Res. 2016;11(9):1392-1393
Author contact
![]() Corresponding author: Dr. Frederick T. Chin, Molecular Imaging Program at Stanford, Department of Radiology, Stanford University School of Medicine, 1201 Welch Road, Rm PS049, Stanford, CA 94305-5484 USA. Tel: +1-(650) 725-4182. e-mail address: chinfedu. Dr. Sandip Biswal, Division of Musculoskeletal Radiology, Department of Radiology, Stanford University School of Medicine, 300 Pasteur Drive S-068B, Stanford, CA 94305 USA. Tel: +1-(650) 725-8018. Email address: biswaledu.
Corresponding author: Dr. Frederick T. Chin, Molecular Imaging Program at Stanford, Department of Radiology, Stanford University School of Medicine, 1201 Welch Road, Rm PS049, Stanford, CA 94305-5484 USA. Tel: +1-(650) 725-4182. e-mail address: chinfedu. Dr. Sandip Biswal, Division of Musculoskeletal Radiology, Department of Radiology, Stanford University School of Medicine, 300 Pasteur Drive S-068B, Stanford, CA 94305 USA. Tel: +1-(650) 725-8018. Email address: biswaledu.