Impact Factor
- Issue 14; 2026
- Issue 13; 2026
- Issue 12; 2026
- Issue 11; 2026
- Issue 10; 2026
- Volume 16; 2026
- Advance Articles
- Past Issues
- Cover Images
- Cover Suggestion
- Index & Coverage
- Special Issues
Introduction
Materials and Methods
Results and Discussion
Concluding Remarks
Acknowledgements
Supplementary Material
References
International Journal of Biological Sciences
International Journal of Medical Sciences
 Global reach, higher impact

Theranostics 2017; 7(10):2704-2717. doi:10.7150/thno.19679 This issue Cite
Research Paper
Type 1 Diabetes: Urinary Proteomics and Protein Network Analysis Support Perturbation of Lysosomal Function
Harinder Singh1 ![]() , Yanbao Yu1, Moo-Jin Suh1, Manolito G Torralba1, Robert D. Stenzel1, Andrey Tovchigrechko1, Vishal Thovarai1, Derek M. Harkins1, Seesandra V. Rajagopala1, Whitney Osborne2, Fran R. Cogen2, Paul B. Kaplowitz2, Karen E. Nelson1, Ramana Madupu1, Rembert Pieper1
, Yanbao Yu1, Moo-Jin Suh1, Manolito G Torralba1, Robert D. Stenzel1, Andrey Tovchigrechko1, Vishal Thovarai1, Derek M. Harkins1, Seesandra V. Rajagopala1, Whitney Osborne2, Fran R. Cogen2, Paul B. Kaplowitz2, Karen E. Nelson1, Ramana Madupu1, Rembert Pieper1 ![]()
1. J. Craig Venter Institute, 9714 Medical Center Drive, Rockville, MD 20850;
2. Children's National Health System, 111 Michigan Ave, NW, Washington, DC 20010.
Received 2017-2-15; Accepted 2017-4-25; Published 2017-7-7
Abstract

While insulin replacement therapy restores the health and prevents the onset of diabetic complications (DC) for many decades, some T1D patients have elevated hemoglobin A1c values suggesting poor glycemic control, a risk factor of DC. We surveyed the stool microbiome and urinary proteome of a cohort of 220 adolescents and children, half of which had lived with T1D for an average of 7 years and half of which were healthy siblings. Phylogenetic analysis of the 16S rRNA gene did not reveal significant differences in gut microbial alpha-diversity comparing the two cohorts. The urinary proteome of T1D patients revealed increased abundances of several lysosomal proteins that correlated with elevated HbA1c values. In silico protein network analysis linked such proteins to extracellular matrix components and the glycoprotein LRG1. LRG1 is a prominent inflammation and neovascularization biomarker. We hypothesize that these changes implicate aberrant glycation of macromolecules that alter lysosomal function and metabolism in renal tubular epithelial cells, cells that line part of the upper urinary tract.
Keywords: Type 1 Diabetes, Lysosome, Protein network, Gut microbiome, Urinary proteome.
Introduction
Type 1 Diabetes (T1D) is an autoimmune disease characterized by the loss of insulin-producing β-cells in the pancreatic islets in genetically susceptible individuals. The incidence of T1D is now twice as high among children as it was two decades ago, and 10 to 20 times more common than 100 years ago [1-5]. The prevalence of T1D in Americans under age 20 rose by 23 percent between 2001-2009 (www.jdrf.org; www.searchfordiabetes.org). A prevalent scientific hypothesis on the rising levels of childhood T1D is the 'hygiene hypothesis', which holds that lack of exposure to once-prevalent microbes results in autoimmune hypersensitivity [6]. Several studies in animal models and most recently studies of the microflora residing in the human gut have demonstrated a link between gut microbiota and energy homeostasis [7, 8]. Imbalance in this homeostasis triggered by environmental factors may lead to disturbances such as inflammation and ultimate manifestation of the autoimmune T1D. The evidence is emerging that environmental factors such as viral infections [9] and perturbations of physiologically normal gut microbiota play important roles in disease onset [10] [11, 12]. The gut functions as an immune organ to protect us from ingested, potentially pathogenic bacteria and the billions of microorganisms in it play a role in regulating the immune system [13]. It is now well established that resident gut microbiota regulates specific mucosal T helper cells crucial for the host defense and, when perturbed, play a role in the development of autoimmune diseases [14]. The interplay of the latter with genetic and non-genetic factors resulting from inflammation [15], suggests a more complex etiology driving T1D pathogenesis [16].
Animal studies have shown that the gut bacterial composition differs significantly at the time of diabetes onset compared to healthy controls [13] [17]. Studies in germ-free mice have linked the activity of the Toll-like receptor-MyD88 pathway, critical to innate immunity, to the onset of T1D [18]. The human gut microbiome may be altered at the time of T1D onset due to autoimmune processes and years after T1D onset due to suboptimal insulin treatment and frequent hypo- and/or hyperglycemic states in patients, thus contributing to adverse long-term health outcomes [19, 20]. Two human cohort studies associating gut microbial profiles with T1D have been performed. One study described a less diverse T1D autoimmune gut microbiome in infants [21]. Another study found that T1D patients with good glycemic control and high physical fitness have gut microbiota similar to healthy individuals [22]. Comprehensive studies using larger cohorts and matched genetic backgrounds for patients and controls could yield further insights into the relationship of gut microbiota with the onset or progression of T1D, for instance, a correlation of certain gut microbial genera with metabolic perturbations known to affect T1D patients. Such discoveries may initiate targeted investigations towards the use of probiotics. Physiological links between the abundance of the genus Bacteroides in the human intestine and an altered metabolism of small chain fatty acids, which are anaerobic bacterial fermentation products and mediators of inflammation, have indeed been discovered [23].
Metabolites and proteins can serve as surrogate biomarkers to assess the risk of disease onset and complications associated with T1D and type 2 diabetes years or decades after disease onset. Urinary albumin is a diagnostic biomarker used in the clinic to assess one such complication, diabetic nephropathy (DN) [24, 25]. HbA1c, a glycated form of hemoglobin, is a biomarker for glycemic control and considered predictive of long-term diabetic complications [26]. In accordance with the life span of erythrocytes, HbA1c levels allow plasma glucose concentration estimates over a three-month average. The aberrant hemoglobin glycation appears to be linked to frequent exposure of this protein and other cellular macromolecules to high glucose levels. While HbA1c is an early glycation product, advanced glycation end products (AGEs) form when diabetic complications become clinically evident [27]. The Diabetes Control and Complications Trial (DCCT) and the Epidemiology of Diabetes Interventions and Complications study (EDIC) assessed median HbA1c levels for an intensive therapy cohort treated with insulin over 6.5 years [28]. On average, the HbA1c levels were lower than in a cohort with standard insulin therapy. Once all T1D patients in that cohort had received intensive insulin therapy, differences in HbA1c levels declined over five years and were not discernable thereafter, even though the risk of diabetic complications in the DCCT cohort originally receiving intensive insulin therapy continued to be lower [28]. Metabolic memory has been discussed to describe the long-term nature of diabetic complications in the context of chronic hyperglycemia [29]. There is a need for improved biomarkers of the metabolic memory effects associated with diabetic complications.
Recently, we surveyed the urinary proteome for protein abundance changes comparing a cohort of 40 children and adolescents who were diagnosed with T1D, on average 6.3 years earlier, and a cohort of healthy siblings in the same age range [30]. While the T1D patients were asymptomatic for diabetic complications, quantitative protein differences may point to pathophysiological processes predictive of future disease. Our data revealed that 13 lysosomal enzymes were increased in abundance in the urine of the T1D cohort versus the control cohort [30], suggesting that more proteins from this subcellular organelle were released into the urinary tract from kidney filtration and reabsorption processes in T1D patients. This may or may not be linked to activation or damage of lysosomes in proximal renal cells. Lysosomes are subcellular organelles responsible for the catabolism of glycoproteins, glycosaminoglycans and glycolipids [31, 32]. Diabetes-associated aberrant glycation of such macromolecules is a reasonable explanation for the mobilization of lysosomal catabolic pathways in T1D patients. Indeed, lysosomal membrane permeabilization resulting in the cytoplasmic release of enzymes functionally active in lysosomes of renal tubular epithelial cells (TECs) was shown to be caused by DN-associated AGE formation [33]. The luminal surface of proximal TECs has densely packed microvilli allowing the cells to resorb and excrete proteins at a high capacity. The question arises as to whether T1D patients asymptomatic for DN develop lysosomes with compromised functions and membrane barriers linked to irreversible complications such as DN later in life. In that context, lysosomal enzymuria was described for patients in early stages of DN [34].
Here, we examined a larger cohort of young T1D patients and their healthy siblings using proteomics to verify previous results indicating moderately increased lysosomal protein excretion in the urine of T1D patients. We established protein-metabolite networks to support the hypothesis of lysosomal dysfunction. Finally, we surveyed the gut microbiota using 16S rDNA gene-based phylogenetic typing to assess gut microbial differences in T1D patients versus their healthy siblings.
Materials and Methods
Study Population and Specimen Collection
A case-control, prospective study was conducted in which typically one sibling of a sibling or twin pair developed T1D and the other sibling was healthy. In a few cases, several siblings were enrolled. Study subjects were recruited at Children's National Health System, Washington D.C., (CNHS) between 2011 and 2014. The study was approved by the Institutional Review Boards of CNHS and the J. Craig Venter Institute (JCVI). Participating human subjects or parents, if the participant was a child, provided informed consent under the IRB study no. Pro00001986. The criteria for inclusion comprised the range of 3-18 years of age and the American Diabetes Association's criteria for the diagnosis of T1D [35] with HbA1c levels of less than 15%. Subjects who reported antibiotic treatments within the three months prior to sampling were excluded due to the known impact of antibiotics on the composition of gut microbiota. All patients were treated with insulin, and their healthy sibling(s) served as controls. There was no evidence of renal function decline in any of the enrolled T1D patients. While the study did not allow gender and age matching of sibling pairs due to demographic limitations, the average age and frequency of each gender comparing disease and control groups were similar. Proteomics and metagenomics (omics) datasets ranging from 98 to 106 patients and their siblings were obtained. Information on gender, age, family medical history, date of T1D onset, Glutamic Acid Decarboxylase (GAD65) autoantibody test results, a one-time HbA1c value for subjects in the T1D cohort, occurrence of infections and antibiotic usage over three months prior to specimen collection were recorded (Supplementary Data, Table S1).
Stool and urine samples were obtained from every subject enrolled in the study and stored at -20°C at the clinical site for up to two weeks. A standard stool collection protocol developed by the Human Microbiome Project (HMP) initiative [36] was used in this study. Mid-stream urine specimens were provided with instructions for sample collection by the study coordinator when the human subjects visited the clinical site. Specimens were frozen immediately, kept frozen during transport and stored at -80°C until used for omics analyses.
Stool DNA Extraction
The DNA for 16S PCR was extracted from stool samples using a MoBIO powersoil purification kit. We aliquoted approximately 1 g of stool into a centrifuge tube and resuspended it in 800 µl of lysis buffer (1 M Tris-HCl, 2 mM EDTA, 1.2% Triton X-100). Stool samples were incubated at 75°C for 10 minutes, allowed to cool to room temperature, followed by the addition of 60 µl 200 mg/ml lysozyme and 5µl RNase A. Stool lysates were incubated overnight at 37°C, and then added to lysing tubes provided in the MoBIO powersoil purification kit. The DNA was extracted using the manufacturer's specifications and eluted in 100 µl of the solution [37].
16S rDNA Analysis by MiSeq Sequencing
DNA extracted from stool samples was amplified using primers that targeted the V1-V3 regions of the 16S rRNA gene [37]. These primers included the i5 and i7 adaptor sequences for Illumina MiSeq pyrosequencing as well as unique 8 bp indices incorporated onto both primers such that each sample receives its unique barcode pair. This method of incorporating the adaptors and index sequences onto the primers at the PCR stage provided minimal loss of sequence data when compared to previous methods that would ligate the adaptors to every amplicon after amplification. This method also allows generating sequence reads which are all in the same 5'-3' orientation. Using approximately 100 ng of extracted DNA, the amplicons were generated with Platinum Taq polymerase (Life Technologies, CA) and by using the following cycling conditions: 95°C for 5min for an initial denaturing step followed by 95°C for 30 sec, 55°C for 30 sec, 72°C for 30 sec for a total of 35 cycles followed by a final extension step of 72°C for 7 min then stored at 4°C. Once the PCR for each sample was completed, the amplicons were purified using the QIAquick PCR purification kit (Qiagen Valencia, CA), quantified fluorometrically using SYBR Gold Nucleic Acid Gel Stain (ThermoFisher Scientific), normalized, and pooled in preparation for bridge amplification followed by Illumina MiSEQ sequencing using the dual index 2x300 bp format (Roche, Branford, CT) following the manufacturer's protocol.
Processing and Filtering of Sequence Reads
Operational taxonomic units (OTUs) were generated de novo from raw Illumina sequence reads using the UPARSE pipeline [38]. Paired-end reads were trimmed of adapter sequences, barcodes and primers prior to assembly. Sequences of low quality and singletons were discarded. Sequences were subjected to a de-replication step and abundances were determined. Chimera filtering of the sequences occurred during the clustering step. We used the Wang classifier (method=wang) and bootstrapped using 100 iterations (iters=100). We set mothur to report full taxonomies only for sequences where 80 or more of the 100 iterations are the same (cutoff=80). Taxonomies were assigned to the OTUs with mothur [39] using version 123 of the SILVA 16S ribosomal RNA database [40] as the reference. Tables with OTUs and the corresponding taxonomy assignments were generated and used in subsequent analyses. The next step was to remove likely non-informative OTUs with an independent filtering process. Rare OTUs or taxa are strongly affected by MiSeq sequencing errors, and any statistical conclusions relying on them are typically unstable. Even in the univariate differential abundance analysis, the presence of such taxa increases the penalty from the multiple testing correction applied to the more abundant taxa. We used unbiased metadata-independent filtering at each level of the taxonomy by eliminating all features that did not pass these criteria. This included samples with less than 2000 reads and OTUs present in less than 10 samples.
Identification of Phylogenetic Groups in Gut Microbiota
The phyloseq package version 1.16.2 in R package version 3.2.3 was used for the microbiome census data analysis [41, 42]. The ordination analysis was performed using non-metric multidimensional scaling (NMDS) with the Bray-Curtis dissimilarity matrix [43]. The data output was used for the generation of a heatmap using the plot_heatmap function in the phyloseq package [41]. Differences in microbial richness (alpha diversity) were evaluated using different algorithms included in the phyloseq plot_richness function. For genus-level and OTU count matrices, we performed the following richness and diversity analyses using the R phyloseq package. The plot_richness function was used to create a plot of alpha diversity index estimates for each sample. Heatmaps of taxonomic profiles clustered hierarchically using the plot_heatmap function in phyloseq were constructed [44]. A beta diversity Bray-Curtis dissimilarity matrix was used to compute non-metric multidimensional scaling (NMDS). The ordination output was plotted in the form of heatmaps using the plot_heatmap function including a side bar where clinical variables associated with each sample were assigned to look for specific associations.
Shotgun Proteomics Sample Preparation
The urine specimens were thawed, neutralized with 1 M Tris-HCl (pH 7.8) and then centrifuged at 1,500 × g at 10°C for 15 min. Pelleted urine sediments were discarded. Soluble urine (SU) samples were concentrated in 15 ml ultrafiltration units (10 kDa MWCO) as described previously [30] and analyzed in SDS-PAGE gels (4-12% acrylamide gradient; Invitrogen, CA). Protein staining intensities using the Coomassie Brilliant Blue G250 dye allowed estimating the urinary protein concentrations [30]. The filter-aided sample preparation (FASP) method using 30 kDa MWCO filter devices (Sartorius, Germany) was applied to process urine samples [30] before the tryptic peptide mixtures were desalted with the spinnable StageTip protocol [45]. Eluates were dried and stored at -80°C until used for MS analysis.
Shotgun Proteomics by LC-MS/MS Analysis
LC-MS/MS analysis was performed using an Ultimate 3000-nano LC system coupled to a Q-Exactive mass spectrometer (Thermo Scientific, USA). The LC-MS/MS experimental and data acquisition methods have been described in detail [46]. In brief, peptides were separated over 110 min gradient from 2% to 80% (over 100 min to 35% and over 10 min to 80%) in buffer B (0.1% formic acid in acetonitrile) at a flow rate of 200 nl/min. MS survey scans were acquired at a resolution of 70,000 over a mass range of m/z 250-1,800. In each cycle, the ten most intense ions were subjected to high-energy collisional dissociation (HCD) applying a normalized collision energy of 27%. The MS2 scans were performed at a resolution of 17,500. Typically, three replicates of LC-MS/MS experiments were run for a given sample. The human protein sequence database was downloaded from UniProtKB resource (version 2016_01; reviewed entries only, 26,050 sequences). Raw MS data were collected and analyzed with the Proteome Discoverer software tool (version 1.4, Thermo Scientific) to obtain protein identification data setting protein false discovery (FDR) rates at 1%. This method was used in initial analysis stages to ensure that raw datasets had sufficient proteome depth (≥ 150 protein IDs).
Quantification and Statistical Analysis of Urinary Proteomic Data
The MaxQuant software tool (version 1.5.1.0) [47] accepting most default settings was employed to identify and quantify proteins from raw MS data. Combining data files representing LC-MS/MS replicates for each sample, the database searches against the UniProt protein database mentioned above were conducted using the search engine Andromeda incorporated into the MaxQuant environment. Protein N-terminal acetylation, oxidation (M) and deamidation (NQ) were set as variable modifications, and cysteine carbamidomethylation was set as a fixed modification. Enzyme specificity was set to trypsin, and the minimal peptide length was set to seven amino acids. Proteins isoforms that could not be discriminated based on unique peptides were reported as a single protein group. The precursor and fragment ion masses were identified with an initial mass tolerance of 6 ppm and 20 ppm, respectively. The maximum false discovery rate (FDR) for both peptide and protein identifications was set to 1%. For label-free protein quantification, the MaxLFQ algorithm was used accepting a minimum number of two peptides for each quantified protein. Default settings for quantification based on MS1 peak integration and for normalization among all datasets were accepted. Proteins not present in at least 20% of the samples of either human subject group were removed. This was followed by the elimination of samples where quantitative information was available for less than 25% of the entire set of identified proteins. Missing values were imputed using the LSimpute algorithm with the LSimpute_adaptive option [48]. Histograms which are displayed for the Log2 transformed MaxLFQ values prior to and after imputation in the Supplementary Data, Dataset S2 show that data were more normalized after imputation. Therefore, data with imputations of missing values were the final input for statistical analyses.
Statistical Analyses for Gut Microbiome and Urinary Proteome Data
To detect differential abundances in the gut microbiota at a genus or species level the DESeq2 package version 1.12.3 in R was used. The phyloseq object are converted into a DESeq2 object using the function phyloseq_to_deseq2 function. DESeq2 [49] is a method for the differential analysis of count data that uses shrinkage estimation for dispersions and fold changes to improve the stability and interpretability of estimates. The DESeq2 test uses a negative binomial model rather than simple proportion-based normalization or rarefaction to control for different sequencing depths, which may increase the power and also lower the false positive detection rate [50]. Default options of DESeq2 were used for its multiple testing adjustment applying Benjamini & Hochberg [51].
The differential proteomic analysis was performed using the Limma software package, which is part of the R package and used for the analysis of expression data using a linear model which is fit to gene and protein expression data [52]. The linear model allows analyses of the entire experiment as an integrated whole, sharing information between samples. Limma accepts log-ratios or log-intensity values of the expressed proteins as input. Multiple testing adjustments were described in the previous paragraph. The p-value cutoff for the selection of significant proteins and OTUs is 0.05 after FDR adjustment for multiple comparisons.
Gene Ontology, Clustering and Classification Analyses
Gene ontology information of proteins was obtained using the ClueGO version 2.2.5 and CluePedia version 1.2.5 plugin in Cytoscape version 3.3.0 [53-55]. The biological process, cellular component, molecular function and immune system process ontology data were recent database updates (31.03.2016). The KEGG pathway data were from a 10.02.2016 update. For GO enrichment analysis, p-values of less than 0.05 were considered. All experimental (EXP_IDA_IPI_IMP_IGI_IEP) evidence codes were selected. The GO terms were connected by the proteins that shared those GO terms. Differentially expressed proteins and samples were clustered using the dist function in R, which calculates Euclidean distance matrix between different proteins and samples. The distance matrix is used to generate hierarchical cluster using the hclust function in R and converted into a heatmap with the heatmap function in R. Proteomes of the T1D and healthy sibling (HS) groups were classified using the Random Forest package version 4.6 in R [56]. We used 1000 trees in Random Forest for the classification of the T1D and control group proteome data.
Protein Network Analysis
For a comprehensive human protein-protein interaction analysis, a list of known binary protein-protein interactions were compiled from IntAct and PINA2 databases [57, 58]. The IntAct and PINA2 databases contain experimentally derived interaction information collected from multiple resources. We considered only the interactions between human proteins and removed those considered to be indirect associations or to have a high noise level: interactions obtained from light scattering, fluorescence microscopy, imagining, confocal microscopy, tandem affinity purification, luminescence-based mammalian interactome mapping, and affinity chromatography-tandem mass spectrometry methods. This data filtering step ensured that only high confidence interactions were considered for the generation of a protein-protein interaction network. The network analyses were performed using the software tool Cytoscape [55]. Protein-ligand interactions were obtained from the ChEBI database; only those ligands interacting with differentially abundant proteins were considered [59].
Validation of Protein-Protein Interactions
The interactions of FN1, SDC4 and HSA with LRG1 were examined using a blot overlay assay. We used 200 ng each of purified FN1 (Cat no. P4955, Abnova), SDC4 (Cat no: H00006385-P02, Abnova) and HSA. Denatured proteins were separated by SDS-PAGE and electroblotted onto a polyvinylidene difluoride membrane. Residual SDS bound to the membrane was removed by washing with 30 mM Tris-HCl (pH 7.4) with 0.05% Tween 20 for 15 minutes. The membrane was blocked with 2% nonfat milk overnight at 4˚C. To identify protein-protein interactions, it was incubated with purified LRG1 (8 nM), a protein prepared using an in vitro wheat germ expression system (Cat no: H00116844-O01, Abnova). Binding of blotted proteins to LRG1 was detected using an anti-LRG1 monoclonal antibody (Cat no: H00116844-M01, Abnova) using a standard Western blotting procedure and chemiluminescent detection [30].
Results and Discussion
Summary of Metadata for the T1D and Healthy Sibling Cohorts
The 16S rDNA data for the survey of gut microbiota were obtained from analyses of 205 stool samples consisting of 99 T1D patients and 106 healthy siblings (HS) as the control group. For the T1D cohort, the average age and duration since disease onset were 14.7 and 7.1 years, respectively. The averaged HbA1c value for the cohort was 8.4. Urinary proteomes were profiled from 104 T1D and 111 HS subjects. Even though the subjects, associated with 102 families, were not perfectly matched for both data types, the overlaps were extensive and average age and duration since T1D onset were unchanged (Table 1). Demographic and clinical data are summarized in Supplementary Data, Table S1. To our knowledge, none of the siblings originally enrolled as healthy controls were diagnosed with T1D or seroconverted to a GAD65 autoantibody positive status during the active enrollment phase. However, seven HS subjects were GAD65 autoantibody positive when they were recruited for this study. Limited information was available with respect to the alleles HLA DR3/4-HLADQ8, which are considered high T1D risk alleles. Two sibling pairs for whom 16S rDNA and proteomic data were available had the HLA DR3/4-DQ8 allele. No HS case revealed simultaneous presence of the HLA DR3/4-DQ8 allele and the GAD65 autoantibody positive status.
Human Subject Cohort Overview.
| Microbiome Data | ||||||||
|---|---|---|---|---|---|---|---|---|
| Sample cohort | Sample size | Age (years) | Age range (min, max) | T1D duration (years) | Duration range (min, max) | HbA1c (%) | HbA1c (min, max) | Gender (m/f) |
| Healthy Siblings | 113 | 13.9 | 5, 22 | NA | NA | NA | NA | 60/53 |
| Type 1 Diabetes | 110 | 14.5 | 7, 19 | 7.1 | 3,17 | 8.4 | 5.5,14.9 | 55/55 |
HbA1c: hemoglobin A1c; m, male; f, female
No Major Changes in Diversity of GI Microbiota Comparing T1D Patients and Healthy Siblings
We compared the GI microbiota derived from T1D and HS stool samples via analysis of the 16S rRNA marker gene. The average number of annotated sequences per sample was 63,688 (2,221,617, maximum; 50,561, median; 8,872, minimum). The UPARSE pipeline identified 1747 OTUs and, after removing OTUs not present in more than ten samples, the number of OTUs was reduced to 1237. These OTUs were used to calculate the alpha diversity of microbiota in T1D patients compared to HS controls using the Shannon index, the Simpson index, and the InvSimpson alpha diversity measures (Supplementary Data, Dataset S1). Wilcoxon rank sum tests returned p-values of 0.61, 0.35 and 0.35, respectively, suggesting the absence of statistically significant differences in alpha diversity. The 1237 OTUs were collapsed using the tax_glom function to 608 species-level OTUs, 280 genus-level OTUs, and 87 family level OTUs. Since not all OTUs were assigned to species and genera and termed unclassified, uncultured and unidentified, they were not used in differential analyses.
To determine whether the cohorts could be separated in an NMDS plot, we performed NMDS ordination using Bray-Curtis dissimilarity and obtained a 0.22 stress level using two dimensions at the genus level. 16S rRNA profiles showed no evidence of differences in the composition of GI microbiota comparing the T1D and HS cohorts. NMDS ordination performed at the family level resulted in a 0.19 stress level. Family level and phylum level data were used to generate a heat map based on the NMDS ordination. The phyla and class abundance profiles across all samples did not reveal differences comparing the two cohorts (Supplementary Data, Dataset S1). Performing classification of the data using the Random Forest method, a ROC value of 0.49 was further evidence that the composition of GI microbiota associated with the T1D cohort was not different from the HS cohort.
Higher Abundance of Streptococcus salivarius subsp. thermophiles in T1D Patients Compared to Healthy Siblings
To determine differentially abundant OTUs comparing the T1D and HS subjects, we applied a negative binomial model implemented in DESeq2. The data in Table 2 reveal differential family, genus and species level abundances. OTU_35 is present in all T1D and HS samples with an average of 398 and 148 read counts, respectively, and a 1.24 Log2-fold increase in the T1D cohort with an adjusted p-value of less than 0.01. This OTU was assigned to Streptococcus salivarius subsp. thermophilus. This subspecies is a component of oral probiotic supplement VSL#3 [60]. In addition, VSL#3 contains Bifidobacterium and Lactobacillus species. The probiotic supplement was reported to reduce the incidence and delay the onset of T1D in a rodent model and NOD mouse [61]. Another study reported that VSL#3 alone or in combination with retinoic acid (RA) protected NOD mice from T1D onset [62]. Oral administration of VSL#3 in the murine model was reported to reduce insulitis and decrease the destruction rate of β-cells in the pancreas. This probiotic supplement was also linked to a decrease of ulcerative colitis in patients suffering from mild to moderately active ulcerative colitis [63]. Mindful that 16S rRNA profiles only provided rough abundance estimates for taxa, Streptococcus salivarius subsp. thermophiles contributes only 1% and 0.38% to the total GI microbiota of the T1D and HS cohorts, respectively. Another microbial species more abundant in the T1D group vs. the HS group is Eubacterium eligens (ATCC_27750). Few reads were assigned to this species making a differential physiological impact of the species on host interactions in T1D patients compared to healthy subjects unlikely.
Gut Microbiome Changes Comparing T1D and Healthy Sibling Cohorts.
| Taxonomic Rank | HS* (% composition) | T1D* (% composition) | Log FC | p-value | |
|---|---|---|---|---|---|
| A: T1D patients versus HS subjects | |||||
| Phylum | Family | ||||
| Firmicutes | Streptococcaceae | 250 (0.64) | 582 (1.49) | 0.98 | 0.02 |
| Firmicutes | Lactobacillaceae | 354 (0.90) | 28 (0.07) | -1.96 | 0.03 |
| Phylum | Genus | ||||
| Firmicutes | Incertae sedis | 25 (0.06) | 68 (0.17) | 1.19 | 0.03 |
| Genus | Species | ||||
| Enterococcus | Unclassified | 720 (1.84) | 67 (0.17) | -2.95 | 0.00 |
| Streptococcus | Streptococcus salivarius subsp. thermophiles | 148 (0.38) | 398 (1.02) | 1.2 | 0.00 |
| Incertae sedis | Eubacterium eligens ATCC 27750 | 14 (0.04) | 55 (0.14) | 1.5 | 0.01 |
| Bacteroides | Unclassified | 278 (0.71) | 184 (0.47) | -1.45 | 0.02 |
| Ruminococcaceae UCG-002 | Uncultured bacterium | 109 (0.28) | 54 (0.14) | -1.34 | 0.02 |
| Blautia | Uncultured organism | 126 (0.32) | 238 (0.61) | 0.8 | 0.02 |
| Streptococcus | Unclassified | 62 (0.16) | 124 (0.32) | 0.99 | 0.02 |
| Eubacterium coprostanoligenes group | Uncultured organism | 67 (0.17) | 4 (0.01) | -2.41 | 0.02 |
| B: T1D patients with high HbA1c values versus HS cohort | |||||
| Genus | Species | ||||
| Enterococcus | Unclassified | 2870 (7.30) | 148 (0.36) | -4.7 | 0.00 |
| Ruminococcaceae_UCG-014 | uncultured_Ruminococcaceae_bacterium | 0 (0) | 24 (0.06) | 4.8 | 0.01 |
| Clostridium_sensu_stricto_1 | Clostridium_butyricum | 1635 (4.16) | 639 (1.54) | 3.8 | 0.03 |
*Average number of sequence reads; number in brackets indicates contribution of a phylogenetic group in %. Log FC: Log-fold change with positive and negative values indicating higher and lower abundances in the T1D cohort, respectively. The p-value is adjusted for multiple testing (Benjamini-Hochberg test).
Analysis at the family level suggests the depletion of Lactobacillaceae in the T1D cohort under study. Interestingly, Lactobacillaceae are quantitatively decreased in MyD88-deficient non-obese diabetic NOD mice compared to mice resistant to the development of T1D [64]. Analysis at the genus level indicates that Enterococci are strongly decreased in abundance in the T1D vs. HS cohort, and the most highly represented phylogenetic group showing differential abundance in the 16S rRNA survey. Considering the observed abundance changes in opposite directions and the close phylogenetic relationship between Streptococci and Enterococci we speculate that the bacteria compete for the same niche in the gut microbiome, with Enterococci less able to adapt to the higher sugar concentrations in the diabetic host. In addition to Enterococci (genus level), the species Clostridium butyricum was decreased comparing the high HbA1c group (n > 9.0) of T1D patients with the family-matched HS group. This change was not statistically significant comparing the T1D group with moderately elevated HbA1c values (6.5 < n < 9.0) and the HS cohort. The biological significance of changes in Enterococcus and S. salivarius abundances in the gut microbiome remains to be elucidated.
Increased Abundance of Proteins with Roles in Lysosomal Catabolism and Inflammation in the T1D Cohort vs. the HS Cohort
LC-MS/MS analyses allowed us to reliably quantify 618 proteins from urine concentrates of 215 human subjects. Comparing the T1D cohort with the HS cohort, 37 and 20 proteins are increased and decreased in abundance, respectively (n > 1.3; adjusted p-value < 0.05). The proteins with the strongest abundance changes are listed in the Table 3, and additional proteins in the Supplementary Data, Dataset S2.
Urinary proteins altered in abundance comparing T1D and Healthy Sibling Cohorts.
| Proteins Increased in T1D vs HS | Proteins Decreased in T1D vs HS | ||||||||
|---|---|---|---|---|---|---|---|---|---|
| Protein ID | Protein name | FC | GS | SC | Protein ID | Protein name | FC | GS | SC |
| LRG1 | Leucine-rich alpha-2-glycoprotein | 2.84 | O,N | 62 | COL12A1 | Collagen alpha-1(XII) chain | -1.47 | O,N | 29 |
| CD14 | Monocyte differentiation antigen CD14 | 1.91 | O,N | 58 | UMOD | Uromodulin | -1.45 | N | 58 |
| AZGP1 | Zinc-alpha-2-glycoprotein | 1.80 | N | 72 | SDC4 | Syndecan-4 | -1.39 | O | 25 |
| NAGA*#^ | Alpha-N-acetylgalactosaminidase | 1.75 | N | 35 | FGFR2*^ | Fibroblast growth factor receptor 2 | -1.37 | N | 6 |
| CTSD*# | Cathepsin D | 1.71 | O,N | 56 | RNASE2*# | Non-secretory ribonuclease | -1.37 | N | 42 |
| GM2A# | Ganglioside GM2 activator | 1.70 | N | 63 | CD44 | CD44 antigen | -1.37 | O,N | 12 |
| GNS*# | N-acetylglucosamine-6-sulfatase | 1.62 | N | 42 | TNC | Tenascin | -1.37 | N | 34 |
| CTSC*# | Dipeptidyl peptidase 1 chain | 1.61 | N | 48 | BCAN^ | Brevican core protein | -1.36 | O,N | 5 |
| A1BG | Alpha-1B-glycoprotein | 1.58 | N | 65 | INAFM2 | Putative transmembrane protein INAFM2 | -1.36 | 22 | |
| CP* | Ceruloplasmin | 1.56 | N | 65 | GPRC5B | G-protein coupled receptor family C group 5 member B | -1.35 | N | 19 |
| CPE* | Carboxypeptidase E | 1.52 | N | 60 | CD320^ | CD320 antigen | -1.35 | N | 19 |
| CTSB*# | Cathepsin B | 1.51 | N | 51 | FN1 | Fibronectin | -1.34 | O,N | 43 |
| CPQ*# | Carboxypeptidase Q | 1.50 | N | 43 | AMY2A* | Pancreatic alpha-amylase | -1.33 | N | 84 |
| SERPINA6 | Corticosteroid-binding globulin | 1.48 | N | 49 | PTPRN* | Receptor-type tyrosine-protein phosphatase-like N | -1.33 | O,N | 7 |
| LUM | Lumican (Keratan sulfate proteoglycan lumican) | 1.44 | N | 44 | MUC1 | Mucin-1 | -1.33 | O,N | 72 |
Protein names and descriptions are from entries in the database UniProt. Fold change values along with adjusted p-values were obtained from analyses using the Limma software package. FC: Fold change, GS: types of glycosylation sites (O-linked and/or N-linked); SC: amino acid sequence coverage; *enzymatic function; #presence in lysosomes; ^indicates more than 15% missing values among the 215 datasets.
Several proteins with abundance increases in the T1D cohort, compared to the HS cohort, have functions in inflammatory processes. The protein on average increased the most in abundance in T1D patients compared to healthy siblings is leucine-rich alpha-2-glycoprotein (LRG1). Functions of LRG1 include positive regulation of angiogenesis and granulocyte differentiation and a role in transforming growth factor beta (TGF-β) receptor signaling [65, 66]. Another protein increased in the T1D cohort and characterized as a mediator of inflammation is CD14. CD14 is a prominent adhesion protein present on leukocyte cell surfaces and secreted into plasma. It interacts with the lipopolysaccharide (LPS)-binding protein which, in turn, binds to cell envelope LPSs derived from Gram-negative bacteria prior to engagement of Toll-like receptors [67, 68]. It is also a receptor for lipoteichoic acid and cell envelope proteins of Gram-positive bacteria such as Streptococcus sanguis, Streptococcus pneumoniae and Staphylococcus aureus [69, 70]. Finally, CD14 modulates adipose tissue inflammation and is involved in insulin resistance [71]. AZGP1 is a MHC class I glycoprotein that stimulates lipid mobilization with a putative role in insulin resistance [72, 73]. CPE is a carboxypeptidase that processes pro-insulin and other hormones and is highly expressed in the pancreas. Some of these inflammatory proteins are highly expressed in monocytes and renal tissue according to data from the human proteome map [74, 75]. Their expression levels in various cells and tissues are included in the Supplementary Data, Dataset S2.
Most differently abundant proteins had higher ratios when only the T1D cohort with HbA1c values > 9 was selected for comparison with healthy subjects. LRG1 is 3.5 times more abundant, and CTSD (2.4), (2.2), A1BG (2.2), IGHM (2.0), AZGP1 (2.0), CD14 (2.0) and NAGA (2.0) also revealed higher quantitative ratios compared to the HS cohort. Twenty-four proteins have a fold change greater than 1.5 for the high HbA1c value group, while only ten proteins have a fold change greater than 1.5 for the group with moderately raised HbA1c values (6.5 < n < 9), each compared to the HS cohort. Among the fourteen proteins increased more than 1.5-fold when the high HbA1c group was selected are ceruloplasmin (CP), the glycoprotein A1BG, lumican, prostatic acid phosphatase, the complement factor C4A and angiotensin-converting enzyme 2 (ACE2). Detailed data are presented in Supplementary Data, Dataset S2.
Regarding the presence in distinct subcellular fractions, the fact that eight of the 15 proteins increased the most in the T1D cohort compared to the HS cohort were lysosomal is striking and verified our previous findings for a cohort consisting of 40 T1D and 41 HS subjects [30]. GM2A is a lysosomal activator for the breakdown of ganglioside GM2 and other molecules containing terminal N-acetyl hexosamines [76]. Enhanced activity of the lysosomal protease cathepsin D was linked to disease complications affecting diabetes patients [77, 78]. NAGA is a lysosomal glycosidase responsible for the breakdown of glycolipids [79]. Lysosomes are organelles with a critical role in the disposal of waste products. They return small molecules such as amino acids, fatty acids, nucleotides and sugars back into circulation. As presented in Table 3, many abundance-changed proteins are glycosylated, among them extracellular matrix (ECM) proteins (brevican, tenascin, fibronectin, syndecan-4 and lumican), cell surface determinants (CD14 and CD320), and proteins secreted into body fluids (LRG1, AZGP1 and corticosteroid-binding globulin). These proteins have cell binding and adherence functions. CP is an acute phase protein in blood plasma and a ferroxidase involved in peroxidation (Fe2+ to Fe3+). A mutation of the gene results in aceruloplasminemia, the absence of functional CP, which is also relevant in diabetes [80].
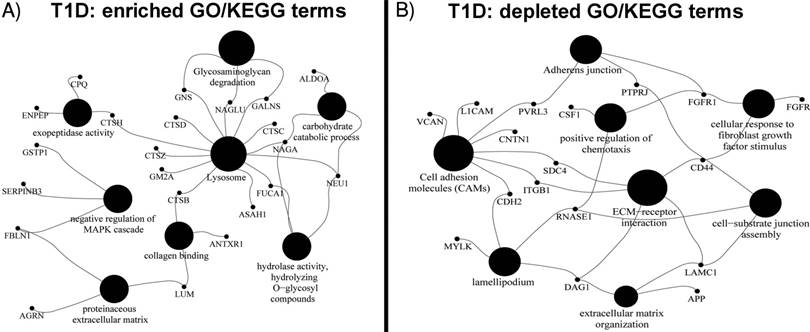
Gene Ontology Analyses Support Increased Catabolic Pathway Use in T1D Patients
Differential GO term analyses using an FDR < 0.05 as a threshold for statistical significance support the abovementioned biological interpretations. Enriched biological process GO terms for the T1D cohort are catabolic processes targeting membrane lipids, glycoproteins, carbohydrates, nitrogen compound metabolism, protein degradation and negative regulation of the MAPK cascade. Enriched molecular function GO terms are hexosaminidase and peptidoglycan receptor activities, collagen binding and peptidase activator activities involved in apoptosis. Enriched cellular localization GO terms are lysosomes and extracellular vesicular exosomes. A highly enriched KEGG pathway pertains to lysosomes, glycosaminoglycan degradation, and apoptosis (Figure 1). Depleted biological process GO terms include kidney epithelium development, Ras protein signal transduction, positive regulation of chemotaxis, cellular response to fibroblast growth factor stimulus and assembly of cell-substrate junctions. Depleted molecular function GO terms include binding functions implicating fibroblasts, syndecans, collagens, Wnt proteins, the ECM and vitamins. Depleted cellular component GO terms include the ciliary part, the Golgi apparatus, cell periphery and projection, and the synapse. Depleted KEGG pathways were the P13K-Agt and Ras signaling pathways, extracellular matrix-receptor interactions, the adherens junction, and cell adhesion molecules. All GO term and KEGG data are provided in Supplementary Data, Dataset S2.
GO terms and KEGG pathway of proteins quantitatively (A) increased and (B) decreased in the T1D cohort using the ClueGO Plugin with statistically significant p-values < 0.05. The GO terms were grouped based on highest significance of GO terms. The GO terms are linked based on medium kappa score and the size of nodes denote the enrichment significance.
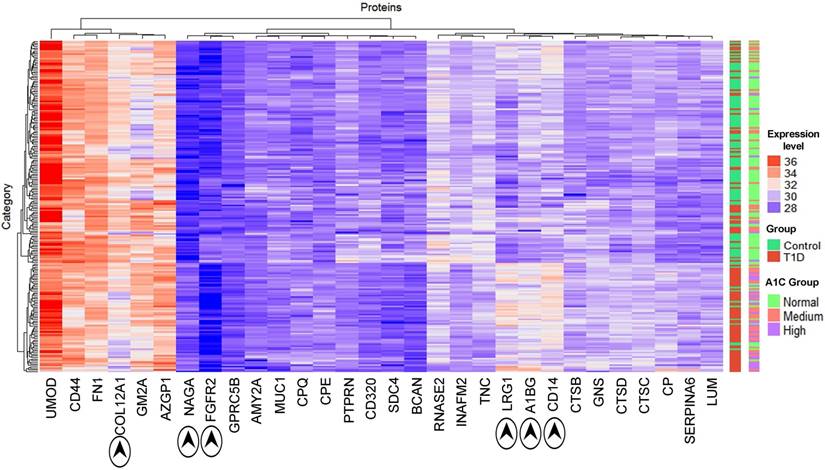
Thirty proteins significantly changed in abundance (Table 3) were used for a clustering analysis with the Euclidean distance metric (Figure 2). A cluster enriched in T1D patients near the bottom of the heat map is dominated by the high-level HbA1c group and, to a lesser extent, the medium level HbA1c group. Random Forest classification was performed using expression profiles of the entire set of proteins and the set of 30 differentially abundant proteins. ROC values of 0.81 and 0.85, respectively, suggest that they classify the cohort into T1D patients and healthy controls. While no single protein had a ROC value greater than 0.75, biomarker sets consisting of 3 proteins had ROC values of 0.80 or greater. This value was 0.84 combining LRG1, CPQ and MYLK. A graphic depicting the relevance of proteins for the classification and ROC values is included in Supplementary Data, Dataset S2.
Hierarchical clustering of T1D and HS samples using the expression profiles of 30 differentially regulated proteins (see Table 2). The x-axis displays protein names while the y-axis displays clusters of the 210 subjects. The bar on the right denotes subjects in a two-color code (green for healthy subjects; red for T1D patients) and a three-color code based on HbA1c values (green for healthy subjects; red for medium levels and purple for high levels of HbA1c). Protein abundances (log values) are displayed in a red-to-blue color code (high to low abundance). The proteins COL12A1, NAGA, FGFR2, LRG1, A1BG and CD14 drive the separation of the two main clusters.
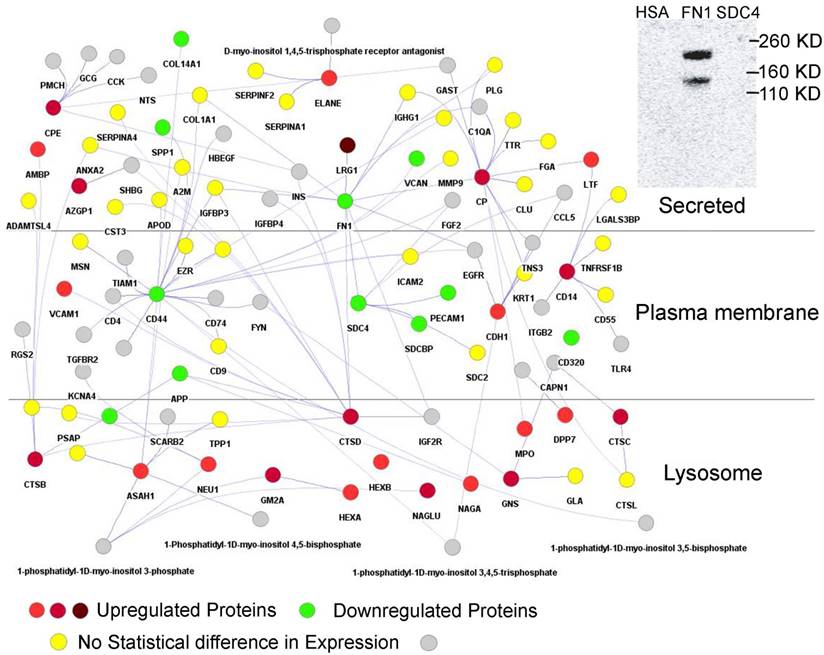
Integrated Network Analysis Supports Functional Relationship of FN1, LRG1, and SDC4
Using Cytoscape [55] proteins interacting with those that had a fold change of more than +/-1.2 were retrieved to generate a protein network in silico. This network consisted of 860 nodes with 940 edges (Supplementary Data, Dataset S2). Hub proteins in the network consist of FN1 (320 interactions), CDH1 (72), SPP1 (62), CD44 (58), CP (44), FGFR2 (28), ASAH1 (28), MUC1 (28), CTSD (27), CTSB (24), IGHM (23), CPE (20), SDC4 (19), CD14 (16), and AZGP1 (11). Many hub proteins, which play essential roles in cellular control, were differentially abundant comparing the T1D and HS groups, supporting the notion of a complex system that contributes to increased inflammation in T1D patients. CTSB and CTSD are cathepsins. ASAH1 is an acid ceramidase degrading sphingolipid ceramide into sphingosine and free fatty acid. These lysosomal enzymes degrade cellular waste products. A particularly interesting sub-network is shown in Figure 3. It highlights the interaction of LRG1, strongly increased in abundance in the T1D cohort, with FN1, a highly connected protein mediating cell migration and extracellular matrix rearrangements under inflammatory conditions. Previous studies in a mouse model have shown that LRG1 interacts with FN1. Our far western blot experiment showed that human LRG1 and FN1 also specifically interact (Figure 3, insert). Furthermore, FN1 interacts with SDC4, an ECM protein that was decreased in abundance, and with the enzymes CP and CTSD, both increased in abundance in the T1D dataset. CTSD and FN1 interact with insulin. Glycosylated FN1 was described as a potential biomarker for the prediction of gestational diabetes [81]. CTSD proteolytically cleaves insulin, insulin-like growth factor and several IGFBPs [82, 83]. Another peptidase displayed in the network (CPE) processes pre-insulin and other hormone precursors [84]. Considering the central place of FN1, an extensively glycosylated protein, in the network we hypothesize that changes in proteolytic and glycolytic pathways affect FN1, perhaps directly via modification in peptide or glycosylated side chains, and contribute to inflammation in T1D patients. Variation in glycosylation was previously shown to mediate changes in protein-protein interactions [85].
Section of protein-protein interaction network including the interactions of 29 proteins with differential abundance in the T1D and HS cohorts (LRG1, CD14, AZGP1, NAGA, CTSD, CTSB, CPE, and CP). The shade of red indicates the fold change in abundance (light red = > 1.2 and < 1.5; medium red = >1.5 and < 2.0; dark red = >2.0). Only LRG1 has fold change above 2.0 in the above network. A green denotes downregulated proteins with fold change > -1.0 and < -1.5 and include highly connected SDC4 and FN1. A yellow color denotes the absence of statistically significant changes of connected proteins in the network. A grey color denotes protein absence in our proteome datasets. The connection of CTSD and CPE to insulin (INS) pertains to INS protein processing by these peptidases. The separation of subcellular locations in the graphic illustrates the concept of lysosomes as subcellular biomarkers of altered metabolism in individuals with T1D. An insert (top-right) depicts the physical interaction of LRG1 and FN1. Albumin (HSA) served as a negative control of the FN1/LRG1 interaction. The extracellular matrix protein SDC4 did not show an interaction with LRG1 in far-Western blot experiments.
Role of Exosome Formation
Proteins ranked by Random Forest analyses as most important to discern T1D from HS proteomic datasets and KEGG/GO pathway enrichment analyses support the notion that there is a T1D-associated process of enhanced lysosomal protein excretion, potentially triggered by lysosomal membrane damage that, in turn, is related to AGE formation and perturbation of lipid metabolism in T1D patients. The evidence is emerging that lysosomes are not only a cellular waste disposal system but also a control center for metabolism in general [86]. Gangliosides are important glycosphingolipids with ceramide as the basic lipid building block. Published data suggest that ceramide induces the release of exosomes into multi-vesicular endosomes and their delivery to lysosomes [87]. Based on the hypothesis that lipid metabolic changes in T1D patients result in larger ceramide quantities that, in turn, result in more exosome-endosome trafficking, we assume that higher lysosomal protein contents in urine of T1D patients might be related to an increase in the release of urinary exosomes. We generated pooled urine samples from T1D and HS patients enriched for exosomes via filtration on 0.02 micron filters and ultracentrifugation at 100,000 x g for 15 h and analyzed the proteins in these concentrates by LC-MS/MS. We did not find evidence for either exosome enrichment or lysosomal protein enrichment within the exosome fraction for the T1D sample pool. Two to three percent of the peptide-spectral matches pertained to lysosomal proteins suggesting that the latter are largely secreted as soluble proteins into urine for both the T1D and the HS cohort.
Concluding Remarks
We have shown in two separate proteomic studies, with overlapping cohorts comprised of 81 and 215 T1D patients and healthy siblings, that many proteins increased in abundance in the urine of T1D versus healthy subjects are associated with catabolic functions in lysosomes. Lysosomes are a cellular compartment responsible for the degradation of cellular waste including glycoproteins, glycolipids, and proteoglycans [31, 32]. Aberrantly glycated proteins and lipids and products of their catabolism, called AGEs, are one factor implicated in the etiology of clinical complications of T1D such as nephropathy, retinopathy and atherosclerosis. AGEs are formed due to chronically elevated sugar levels in diabetes patients. They activate the catabolism in lysosomes and disrupt the autophagy-lysosome pathway in renal TECs via analyses of human tissues from individuals diagnosed with DN and in renal TEC lines [33]. A consequence of this pathway's perturbation is lysosomal membrane permeabilization, a process resulting in cathepsin protease release and cell death [33]. The observation of lysosomal enzymuria is consistent with an early phase of this pathology as renal TECs interface with the urinary ducts that allow the physiological resorption and excretion of various molecules from the kidneys into the urinary tract and vice versa. A diagnostic biomarker for advanced DN, albumin, is measured in urine when the reabsorption capacity of renal TECs reaches its limit. We are intrigued by a potential subclinical renal pathology of diabetes that can be measured long before albuminuria begins: lysosomal enzymuria. Indeed, the loss of lysosomal enzymes in urine was suggested as an early stage biomarker of DN [88] [34]. Elevated plasma levels of lysosomal enzymes have also been described as biomarkers of diabetic microangiopathy correlating with glycemic control [89]. Together with our data, these findings support the concept that membrane damage in lysosomes of renal TECs occurs in T1D patients with frequently elevated glucose levels at a younger age than both clinical and histological data currently suggest. A simple diagnostic test based on the quantitative measurement of lysosomal enzyme contents in the urine of individuals diagnosed with T1D could be useful.
We have no evidence that the observed gut microbiome changes, affecting a relatively small subset of gut microbial phylogenetic groups according to 16S rRNA profiles in the comparison of ~ 100 patients and their healthy siblings, are physiologically important and linked to imperfect glycemic control or related to subclinical inflammation in young T1D patients. The changes in lysosomal function and structural integrity in T1D patients may be metabolic memory effects of frequent hyperglycemia. Our data do not support the notion that metabolic memory effects in T1D patients modulate the gut microbiome structure. Further research including longitudinally surveyed patient cohorts and the examination of metabolic capabilities of Streptococcus salivarius are needed to assess the role of gut microbial community members with potential benefits to the health of T1D patients.
Acknowledgements
This work was supported by National Institute of Diabetes and Digestive and Kidney grant 1DP3DK094343-01. We thank the Ruggles Family Foundation for a contribution to fund the mass spectrometer used for the proteomics experiments. We thank Ms. Kenya Platero for technical assistance in the laboratory. The funding bodies did not have a role in study design, data collection and analysis, the decision to publish, and preparation of the manuscript.
Author contributions
Harinder Singh performed the proteomics and microbiome data analysis and interpretation, writing manuscript, Yanbao Yu carried out the proteomics experiments and data analysis, Moo-Jin Suh carried out the proteomics experiments, Manolito G Torralba performed the metagenomics experiments, Robert D. Stenzel assisted in metagenomics experiments, Andrey Tovchigrechko helped in metagenomics data analysis, Vishal Thovarai analyzed metadata and metagenomics data, Derek M. Harkins support the metagenomics analysis, Seesandra V. Rajagopala performed the biochemical experiments, Whitney Osborne recruited human subjects and collected medical data, Fran R. Cogen recruited human subjects and was clinical co-lead, Paul B. Kaplowitz recruited human subjects and was clinical lead, Karen E. Nelson design the project, Ramana Madupu participated in protein design, implementation and manuscript writing, Rembert Pieper design and implementation of the project, data analysis and interpretation, writing manuscript.
Supplementary Material
Supplementary figures and tables.
Competing Interests
The authors have declared that no competing interest exists.
References
1. Bell RA M-DE, Beyer JW, D'Agostino RB Jr, Lawrence JM, Linder B, Liu LL, Marcovina SM, Rodriguez BL, Williams D, Dabelea D; SEARCH for Diabetes in Youth Study Group. Diabetes in non-Hispanic white youth: prevalence, incidence, and clinical characteristics: the SEARCH for Diabetes in Youth Study. Diabetes Care. 2009;32:S102-11
2. Gale EAM. The Rise of Childhood Type 1 Diabetes in the 20th Century. Diabetes. 2002;51:3353-61
3. RB. L. Incidence of Diabetes in Children and Youth—Tracking a Moving Target. JAMA. 2007;297:2760-2
4. Vehik K HR, Lezotte D, Norris JM, Klingensmith G, Bloch C, Rewers M, Dabelea D. Increasing incidence of type 1 diabetes in 0- to 17-year-old Colorado youth. Diabetes Care. 2007;30:503-9
5. Gordon P. Diabetes rising: How a rare disease became a modern pandemic, and what to do about it. JAMA. 2010;304:2539
6. Musso G GR, Cassader M. Obesity, diabetes, and gut microbiota: the hygiene hypothesis expanded? Diabetes Care. 2010;33:2277-84
7. Cani PD DN. Gut microflora as a target for energy and metabolic homeostasis. Curr Opin Clin Nutr Metab Care. 2007;10:729-34
8. Vrieze A HF, Zoetendal EG, de Vos WM, Hoekstra JB, Nieuwdorp M. The environment within: how gut microbiota may influence metabolism and body composition. Diabetologia. 2010;53:606-13
9. Oikarinen M, Tauriainen S, Oikarinen S, Honkanen T, Collin P, Rantala I. et al. Type 1 diabetes is associated with enterovirus infection in gut mucosa. Diabetes. 2012;61:687-91
10. Endesfelder D, zu Castell W, Ardissone A, Davis-Richardson AG, Achenbach P, Hagen M. et al. Compromised gut microbiota networks in children with anti-islet cell autoimmunity. Diabetes. 2014;63:2006-14
11. Hober D SF. Enteroviral pathogenesis of type 1 diabetes. Discov Med 2010 Aug. 2010;10:151-60
12. Lammi N KM, Tuomilehto J. Do microbes have a causal role in type 1 diabetes? Med Sci Monit. 2005;11:RA63-9
13. Aspord C, Thivolet C. Nasal administration of CTB-insulin induces active tolerance against autoimmune diabetes in non-obese diabetic (NOD) mice. Clinical and experimental immunology. 2002;130:204-11
14. Kamada N, Seo SU, Chen GY, Nunez G. Role of the gut microbiota in immunity and inflammatory disease. Nature reviews Immunology. 2013;13:321-35
15. Westerholm-Ormio M, Vaarala O, Pihkala P, Ilonen J, Savilahti E. Immunologic activity in the small intestinal mucosa of pediatric patients with type 1 diabetes. Diabetes. 2003;52:2287-95
16. Vaarala O. Human intestinal microbiota and type 1 diabetes. Current diabetes reports. 2013;13:601-7
17. Roesch LF, Lorca GL, Casella G, Giongo A, Naranjo A, Pionzio AM. et al. Culture-independent identification of gut bacteria correlated with the onset of diabetes in a rat model. The ISME journal. 2009;3:536-48
18. Wen L, Ley RE, Volchkov PY, Stranges PB, Avanesyan L, Stonebraker AC. et al. Innate immunity and intestinal microbiota in the development of Type 1 diabetes. Nature. 2008;455:1109-13
19. Basu S, Larsson A, Vessby J, Vessby B, Berne C. Type 1 diabetes is associated with increased cyclooxygenase- and cytokine-mediated inflammation. Diabetes Care. 2005;28:1371-5
20. Gogitidze Joy N, Hedrington MS, Briscoe VJ, Tate DB, Ertl AC, Davis SN. Effects of acute hypoglycemia on inflammatory and pro-atherothrombotic biomarkers in individuals with type 1 diabetes and healthy individuals. Diabetes Care. 2010;33:1529-35
21. Giongo A, Gano KA, Crabb DB, Mukherjee N, Novelo LL, Casella G. et al. Toward defining the autoimmune microbiome for type 1 diabetes. The ISME journal. 2011;5:82-91
22. Stewart CJ, Nelson A, Campbell MD, Walker M, Stevenson EJ, Shaw JA. et al. Gut microbiota of Type 1 diabetes patients with good glycaemic control and high physical fitness is similar to people without diabetes: an observational study. Diabetic medicine: a journal of the British Diabetic Association. 2016;34:127-134
23. Vinolo MA, Rodrigues HG, Nachbar RT, Curi R. Regulation of inflammation by short chain fatty acids. Nutrients. 2011;3:858-76
24. Hovind P, Tarnow L, Rossing P, Jensen BR, Graae M, Torp I. et al. Predictors for the development of microalbuminuria and macroalbuminuria in patients with type 1 diabetes: inception cohort study. BMJ. 2004;328:1105
25. Mogensen CE, Chachati A, Christensen CK, Close CF, Deckert T, Hommel E. et al. Microalbuminuria: an early marker of renal involvement in diabetes. Uremia Invest. 1985;9:85-95
26. Gallagher EJ, Le Roith D, Bloomgarden Z. Review of hemoglobin A(1c) in the management of diabetes. J Diabetes. 2009;1:9-17
27. Goldin A, Beckman JA, Schmidt AM, Creager MA. Advanced glycation end products - Sparking the development of diabetic vascular injury. Circulation. 2006;114:597-605
28. Nathan DM. The diabetes control and complications trial/epidemiology of diabetes interventions and complications study at 30 years: overview. Diabetes Care. 2014;37:9-16
29. Aschner PJ, Ruiz AJ. Metabolic memory for vascular disease in diabetes. Diabetes technology & therapeutics. 2012;14(Suppl 1):S68-74
30. Suh MJ, Tovchigrechko A, Thovarai V, Rolfe MA, Torralba MG, Wang J. et al. Quantitative Differences in the Urinary Proteome of Siblings Discordant for Type 1 Diabetes Include Lysosomal Enzymes. J Proteome Res. 2015;14:3123-35
31. Schulze H, Kolter T, Sandhoff K. Principles of lysosomal membrane degradation: Cellular topology and biochemistry of lysosomal lipid degradation. Biochimica et biophysica acta. 2009;1793:674-83
32. Winchester B. Lysosomal metabolism of glycoproteins. Glycobiology. 2005;15:1R-15R
33. Liu WJ, Shen TT, Chen RH, Wu HL, Wang YJ, Deng JK. et al. Autophagy-Lysosome Pathway in Renal Tubular Epithelial Cells Is Disrupted by Advanced Glycation End Products in Diabetic Nephropathy. The Journal of biological chemistry. 2015;290:20499-510
34. Gatsing D, Garba IH, Adoga GI. The use of lysosomal enzymuria in the early detection and monitoring of the progression of diabetic nephropathy. Indian J Clin Biochem. 2006;21:42-8
35. American Diabetes A. Diagnosis and classification of diabetes mellitus. Diabetes Care. 2010;33(Suppl 1):S62-9
36. Human Microbiome Project C. Structure, function and diversity of the healthy human microbiome. Nature. 2012;486:207-14
37. Rajagopala SV, Yooseph S, Harkins DM, Moncera KJ, Zabokrtsky KB, Torralba MG. et al. Gastrointestinal microbial populations can distinguish pediatric and adolescent Acute Lymphoblastic Leukemia (ALL) at the time of disease diagnosis. BMC genomics. 2016;17:635
38. Edgar RC. UPARSE: highly accurate OTU sequences from microbial amplicon reads. Nat Methods. 2013;10:996-8
39. Schloss PD, Westcott SL, Ryabin T, Hall JR, Hartmann M, Hollister EB. et al. Introducing mothur: open-source, platform-independent, community-supported software for describing and comparing microbial communities. Appl Environ Microbiol. 2009;75:7537-41
40. Quast C, Pruesse E, Yilmaz P, Gerken J, Schweer T, Yarza P. et al. The SILVA ribosomal RNA gene database project: improved data processing and web-based tools. Nucleic Acids Res. 2013;41:D590-6
41. McMurdie PJ, Holmes S. phyloseq: an R package for reproducible interactive analysis and graphics of microbiome census data. PLoS One. 2013;8:e61217
42. Team RC. R: A Language and Environment for Statistical Computing. R Foundation for Statistical Computing. 2015 Vienna, Austria
43. Bray JR, Curtis JT. An Ordination of the Upland Forest Communities of Southern Wisconsin. Ecological Monographs. 1957;27:326-49
44. Rajaram S, Oono Y. NeatMap-non-clustering heat map alternatives in R. BMC Bioinformatics. 2010;11:45
45. Yu Y, Pieper R. Urinary pellet sample preparation for shotgun proteomic analysis of microbial infection and host-pathogen interactions. Methods in molecular biology. 2015;1295:65-74
46. Yu Y, Suh MJ, Sikorski P, Kwon K, Nelson KE, Pieper R. Urine sample preparation in 96-well filter plates for quantitative clinical proteomics. Anal Chem. 2014;86:5470-77
47. Cox J, Matic I, Hilger M, Nagaraj N, Selbach M, Olsen JV. et al. A practical guide to the MaxQuant computational platform for SILAC-based quantitative proteomics. Nature protocols. 2009;4:698-705
48. Mordes JP, Bortell R, Blankenhorn EP, Rossini AA, Greiner DL. Rat Models of Type 1 Diabetes: Genetics, Environment, and Autoimmunity. ILAR Journal. 2004;45:278-91
49. Love MI, Huber W, Anders S. Moderated estimation of fold change and dispersion for RNA-seq data with DESeq2. Genome biology. 2014;15:550
50. McMurdie PJ, Holmes S. Waste not, want not: why rarefying microbiome data is inadmissible. PLoS computational biology. 2014;10:e1003531-e
51. Benjamini Y, Hochberg Y. Controlling the False Discovery Rate: A Practical and Powerful Approach to Multiple Testing. Journal of the Royal Statistical Society Series B (Methodological). 1995;57:289-300
52. Ritchie ME, Phipson B, Wu D, Hu Y, Law CW, Shi W. et al. limma powers differential expression analyses for RNA-sequencing and microarray studies. Nucleic Acids Res. 2015;43:e47
53. Bindea G, Mlecnik B, Hackl H, Charoentong P, Tosolini M, Kirilovsky A. et al. ClueGO: a Cytoscape plug-in to decipher functionally grouped gene ontology and pathway annotation networks. Bioinformatics. 2009;25:1091-3
54. Bindea G, Galon J, Mlecnik B. CluePedia Cytoscape plugin: pathway insights using integrated experimental and in silico data. Bioinformatics. 2013;29:661-3
55. Shannon P, Markiel A, Ozier O, Baliga NS, Wang JT, Ramage D. et al. Cytoscape: a software environment for integrated models of biomolecular interaction networks. Genome Res. 2003;13:2498-504
56. Breiman L. Random Forests. Machine Learning. 2001;45:5-32
57. Orchard S, Ammari M, Aranda B, Breuza L, Briganti L, Broackes-Carter F. et al. The MIntAct project-IntAct as a common curation platform for 11 molecular interaction databases. Nucleic Acids Res. 2014;42:D358-63
58. Cowley MJ, Pinese M, Kassahn KS, Waddell N, Pearson JV, Grimmond SM. et al. PINA v2.0: mining interactome modules. Nucleic Acids Res. 2012;40:D862-5
59. Hastings J, de Matos P, Dekker A, Ennis M, Harsha B, Kale N. et al. The ChEBI reference database and ontology for biologically relevant chemistry: enhancements for 2013. Nucleic Acids Res. 2013;41:D456-63
60. Chapman TM, Plosker GL, Figgitt DP. VSL#3 probiotic mixture: a review of its use in chronic inflammatory bowel diseases. Drugs. 2006;66:1371-87
61. Calcinaro F, Dionisi S, Marinaro M, Candeloro P, Bonato V, Marzotti S. et al. Oral probiotic administration induces interleukin-10 production and prevents spontaneous autoimmune diabetes in the non-obese diabetic mouse. Diabetologia. 2005;48:1565-75
62. Dolpady J, Sorini C, Di Pietro C, Cosorich I, Ferrarese R, Saita D. et al. Oral Probiotic VSL#3 Prevents Autoimmune Diabetes by Modulating Microbiota and Promoting Indoleamine 2,3-Dioxygenase-Enriched Tolerogenic Intestinal Environment. J Diabetes Res. 2016;2016:7569431
63. Sood A, Midha V, Makharia GK, Ahuja V, Singal D, Goswami P. et al. The probiotic preparation, VSL#3 induces remission in patients with mild-to-moderately active ulcerative colitis. Clin Gastroenterol Hepatol. 2009;7:1202-1209.e1
64. Peng J, Narasimhan S, Marchesi JR, Benson A, Wong FS, Wen L. Long term effect of gut microbiota transfer on diabetes development. J Autoimmun. 2014;53:85-94
65. Wang X, Abraham S, McKenzie JA, Jeffs N, Swire M, Tripathi VB. et al. LRG1 promotes angiogenesis by modulating endothelial TGF-beta signalling. Nature. 2013;499:306-11
66. O'Donnell LC, Druhan LJ, Avalos BR. Molecular characterization and expression analysis of leucine-rich alpha2-glycoprotein, a novel marker of granulocytic differentiation. J Leukoc Biol. 2002;72:478-85
67. Tsukamoto H, Fukudome K, Takao S, Tsuneyoshi N, Kimoto M. Lipopolysaccharide-binding protein-mediated Toll-like receptor 4 dimerization enables rapid signal transduction against lipopolysaccharide stimulation on membrane-associated CD14-expressing cells. Int Immunol. 2010;22:271-80
68. Kelley SL, Lukk T, Nair SK, Tapping RI. The crystal structure of human soluble CD14 reveals a bent solenoid with a hydrophobic amino-terminal pocket. J Immunol. 2013;190:1304-11
69. Banks J, Poole S, Nair SP, Lewthwaite J, Tabona P, McNab R. et al. Streptococcus sanguis secretes CD14-binding proteins that stimulate cytokine synthesis: a clue to the pathogenesis of infective (bacterial) endocarditis? Microbial pathogenesis. 2002;32:105-16
70. Schröder NWJ, Morath S, Alexander C, Hamann L, Hartung T, Zähringer U. et al. Lipoteichoic Acid (LTA) of Streptococcus pneumoniaeand Staphylococcus aureus Activates Immune Cells via Toll-like Receptor (TLR)-2, Lipopolysaccharide-binding Protein (LBP), and CD14, whereas TLR-4 and MD-2 Are Not Involved. Journal of Biological Chemistry. 2003;278:15587-94
71. Fernandez-Real JM, Perez del Pulgar S, Luche E, Moreno-Navarrete JM, Waget A, Serino M. et al. CD14 modulates inflammation-driven insulin resistance. Diabetes. 2011;60:2179-86
72. McDermott LC, Freel JA, West AP, Bjorkman PJ, Kennedy MW. Zn-alpha2-glycoprotein, an MHC class I-related glycoprotein regulator of adipose tissues: modification or abrogation of ligand binding by site-directed mutagenesis. Biochemistry. 2006;45:2035-41
73. Montastier E, Villa-Vialaneix N, Caspar-Bauguil S, Hlavaty P, Tvrzicka E, Gonzalez I. et al. System model network for adipose tissue signatures related to weight changes in response to calorie restriction and subsequent weight maintenance. PLoS Comput Biol. 2015;11:e1004047
74. Mariategui J, Chavez H, Oballe J. [About a new anticonvulsant psychotropic. Preliminary results with carbamazepine]. Rev Neuropsiquiatr. 1967;30:189-97
75. Kim MS, Pinto SM, Getnet D, Nirujogi RS, Manda SS, Chaerkady R. et al. A draft map of the human proteome. Nature. 2014;509:575-81
76. Planas R, Carrillo J, Sanchez A, de Villa MC, Nunez F, Verdaguer J. et al. Gene expression profiles for the human pancreas and purified islets in type 1 diabetes: new findings at clinical onset and in long-standing diabetes. Clinical and experimental immunology. 2010;159:23-44
77. Monickaraj F, McGuire PG, Nitta CF, Ghosh K, Das A. Cathepsin D: an Mvarphi-derived factor mediating increased endothelial cell permeability with implications for alteration of the blood-retinal barrier in diabetic retinopathy. FASEB J. 2016;30:1670-82
78. Feron D, Begu-Le Corroller A, Piot JM, Frelicot C, Vialettes B, Fruitier-Arnaudin I. Significant lower VVH7-like immunoreactivity serum level in diabetic patients: evidence for independence from metabolic control and three key enzymes in hemorphin metabolism, cathepsin D, ACE and DPP-IV. Peptides. 2009;30:256-61
79. Asfaw B, Schindler D, Ledvinova J, Cerny B, Smid F, Conzelmann E. Degradation of blood group A glycolipid A-6-2 by normal and mutant human skin fibroblasts. J Lipid Res. 1998;39:1768-80
80. Takahashi Y, Miyajima H, Shirabe S, Nagataki S, Suenaga A, Gitlin JD. Characterization of a nonsense mutation in the ceruloplasmin gene resulting in diabetes and neurodegenerative disease. Hum Mol Genet. 1996;5:81-4
81. Rasanen JP, Snyder CK, Rao PV, Mihalache R, Heinonen S, Gravett MG. et al. Glycosylated fibronectin as a first-trimester biomarker for prediction of gestational diabetes. Obstet Gynecol. 2013;122:586-94
82. Authier F, Metioui M, Fabrega S, Kouach M, Briand G. Endosomal proteolysis of internalized insulin at the C-terminal region of the B chain by cathepsin D. The Journal of biological chemistry. 2002;277:9437-46
83. Claussen M, Kubler B, Wendland M, Neifer K, Schmidt B, Zapf J. et al. Proteolysis of insulin-like growth factors (IGF) and IGF binding proteins by cathepsin D. Endocrinology. 1997;138:3797-803
84. Liew CW, Assmann A, Templin AT, Raum JC, Lipson KL, Rajan S. et al. Insulin regulates carboxypeptidase E by modulating translation initiation scaffolding protein eIF4G1 in pancreatic beta cells. Proc Natl Acad Sci U S A. 2014;111:E2319-28
85. Millard CJ, Campbell ID, Pickford AR. Gelatin binding to the 8F19F1 module pair of human fibronectin requires site-specific N-glycosylation. FEBS Lett. 2005;579:4529-34
86. Lim CY, Zoncu R. The lysosome as a command-and-control center for cellular metabolism. The Journal of cell biology. 2016;214:653-64
87. Trajkovic K, Hsu C, Chiantia S, Rajendran L, Wenzel D, Wieland F. et al. Ceramide triggers budding of exosome vesicles into multivesicular endosomes. Science. 2008;319:1244-7
88. Salem MA, el-Habashy SA, Saeid OM, el-Tawil MM, Tawfik PH. Urinary excretion of n-acetyl-beta-D-glucosaminidase and retinol binding protein as alternative indicators of nephropathy in patients with type 1 diabetes mellitus. Pediatr Diabetes. 2002;3:37-41
89. Waters PJ, Flynn MD, Corrall RJ, Pennock CA. Increases in plasma lysosomal enzymes in type 1 (insulin-dependent) diabetes mellitus: relationship to diabetic complications and glycaemic control. Diabetologia. 1992;35:991-5
Author contact
![]() Corresponding authors: Harinder Singh, hsinghorg; Tel: (301) 795-7684 Rembert Pieper, rpieperorg; Tel: (301) 795-7605
Corresponding authors: Harinder Singh, hsinghorg; Tel: (301) 795-7684 Rembert Pieper, rpieperorg; Tel: (301) 795-7605