Impact Factor
- Issue 14; 2026
- Issue 13; 2026
- Issue 12; 2026
- Issue 11; 2026
- Issue 10; 2026
- Volume 16; 2026
- Advance Articles
- Past Issues
- Cover Images
- Cover Suggestion
- Index & Coverage
- Special Issues
Introduction
Materials and Methods
Results
Discussion
Conclusion
Supplementary Material
Acknowledgements
References
International Journal of Biological Sciences
International Journal of Medical Sciences
 Global reach, higher impact

Theranostics 2017; 7(9):2431-2442. doi:10.7150/thno.19184 This issue Cite
Research Paper
3-D Electrochemical Impedance Spectroscopy Mapping of Arteries to Detect Metabolically Active but Angiographically Invisible Atherosclerotic Lesions
René R. Sevag Packard1, 2, 3*, Yuan Luo4*, Parinaz Abiri1, 5, Nelson Jen1, 2, Olcay Aksoy1, 2, William M. Suh1, 2, Yu-Chong Tai4, Tzung K. Hsiai1, 2, 3, 5 ![]()
1. Division of Cardiology, Department of Medicine, David Geffen School of Medicine, University of California, Los Angeles, California;
2. Ronald Reagan UCLA Medical Center, Los Angeles, California;
3. Veterans Affairs West Los Angeles Medical Center, Los Angeles, California;
4. Electrical and Mechanical Engineering, California Institute of Technology, Pasadena, California;
5. Department of Bioengineering, Henry Samueli School of Engineering and Applied Sciences, University of California, Los Angeles, California.
* Equal contribution
Received 2017-1-14; Accepted 2017-4-18; Published 2017-6-22
Abstract

We designed a novel 6-point electrochemical impedance spectroscopy (EIS) sensor with 15 combinations of permutations for the 3-D mapping and detection of metabolically active atherosclerotic lesions. Two rows of 3 stretchable electrodes circumferentially separated by 120° were mounted on an inflatable balloon for intravascular deployment and endoluminal interrogation. The configuration and 15 permutations of 2-point EIS electrodes allowed for deep arterial penetration via alternating current (AC) to detect varying degrees of lipid burden with distinct impedance profiles (Ω). By virtue of the distinctive impedimetric signature of metabolically active atherosclerotic lesions, a detailed impedance map was acquired, with the 15 EIS permutations uncovering early stages of disease characterized by fatty streak lipid accumulation in the New Zealand White rabbit model of atherosclerosis. Both the equivalent circuit and statistical analyses corroborated the 3-D EIS permutations to detect small, angiographically invisible, lipid-rich lesions, with translational implications for early atherosclerotic disease detection and prevention of acute coronary syndromes or strokes.
Keywords: Electrochemical Impedance Spectroscopy, 3-D Mapping, Atherosclerosis.
Introduction
Electrochemical Impedance Spectroscopy (EIS) is the macroscopic representation of the electric field and current density distribution within the specimen being tested. EIS characterizes the dielectric properties of blood vessels and lipid-rich plaques [1-3]. Applying quasi-electrostatic limits to Maxwell's equations, the field distribution is described as follows [4]:
(Eq.1)
where 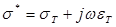 .
.  and
and  denote the conductivity and permittivity of the sample, respectively, ω the angular frequency,
  , and φ the voltage distribution. Current density,
  , is calculated with the distribution of electric field,
  . Thus, electrical impedance of the sample, z, according to Maxwell's equations, is expressed as follows:
(Eq.2)
where  denotes the electrode-tissue interface area, and Δφ the voltage difference across the two electrodes of the EIS sensor. Intravascular ultrasound (IVUS)-guided EIS sensors detect atherosclerotic lesions associated with oxidative stress in fat-fed New Zealand White (NZW) rabbits [5]. Specifically, vessel walls harboring oxidized low density lipoprotein cholesterol (oxLDL) exhibit distinct EIS values [3]. However, atherosclerotic lesions are often eccentric and multiple. To detect these lesions, we sought to develop a novel 6-point electrode configuration for comprehensive 3-D endoluminal interrogation of angiographically invisible atherosclerosis.
OxLDL [6] in atherosclerotic lesions display distinct frequency-dependent electrical and dielectrical properties [7-8]. We developed concentric bipolar electrodes to assess elevated EIS signals in oxLDL-rich lesions from human coronary, carotid, and femoral arteries [1]. By deploying the flexible and stretchable bipolar electrodes to the aorta of NZW rabbits, we demonstrated a significant increase in impedance magnitude in oxLDL-rich plaques [3]. We further established a 2-point micro-electrode configuration to allow for deep intraplaque penetration via alternating current (AC) [9]. The frequency sweep from 10 to 300 kHz generated an increase in capacitance, providing distinct changes in impedance (Ω) in relation to varying degrees of aortic intraplaque lipid burden [9].
To advance intravascular EIS interrogation for flexible 3-D endoluminal plaque detection, we hereby propose a 6-point electrode configuration to enable 15 alternating EIS permutations of 2-point electrode arrays for comprehensive impedance mapping and detection of lipid-rich atherosclerotic lesions. The individual electrode configuration was identical in each row, where three electrodes were circumferentially and equidistantly positioned. In addition to optimal contact with the endoluminal surface, this new 6-point configuration enabled 15 different pairs of electrodes to provide 3-D interrogation of the endoluminal area. We demonstrated the capability of flexible 3-D EIS sensors to detect angiographically invisible early atherosclerotic lesions in different aortic segments from NZW rabbits on high-fat diet-induced hypercholesterolemia. The 3-D EIS measurements were in close agreement with the equivalent circuit model for aortas consisting of vessel tissue, atherosclerotic lesion, blood and perivascular fat. Statistical analysis corroborated the 3-D EIS permutations for early atherosclerosis detection, with clinical implications to prevent acute coronary syndromes or strokes.
Materials and Methods
Sensor design and fabrication
The newly designed 6-point EIS sensor featured six individual electrodes that were circumferentially mounted on an inflatable balloon (Fig. 1). The individual electrodes were identical in dimensions (600 µm × 300 µm) and connected to an impedance analyzer (Gamry Series G 300 potentiostat, PA) that was installed in a desktop computer. Specifically, there were three electrodes embedded in each row, and the distance between the two rows was 2.4 mm (Fig. 1b). Within each layer, the 3 electrodes were equidistantly placed around the circumference of the balloon at 120° separation from each other (Fig. 1c). This 6-point configuration optimized the contact with the endoluminal surface for EIS measurements. Furthermore, the 6 electrodes allowed for 15 different combinations of 2-point electrodes for 3-dimensional endoluminal interrogation.
Design and deployment of the balloon-inflatable electrodes. (a) Photographs reveal the device prototype with zoomed-in views of balloon-inflation, providing details of the individual electrodes, balloon, and radio-opaque markers. (b) Top and (c) side views provide the dimensions of the 6-point sensor upon balloon-inflation. (d) A 3-dimensional schematic illustration of the 6-point electrochemical impedance spectroscopy (EIS) device highlights the endoluminal deployment strategy upon balloon-inflation (∅ 3mm). The inset shows the device under the balloon-deflated state (∅ 1mm) prior to deployment. The individual electrodes (six in total) are in contact with the endoluminal surface upon balloon-inflation.
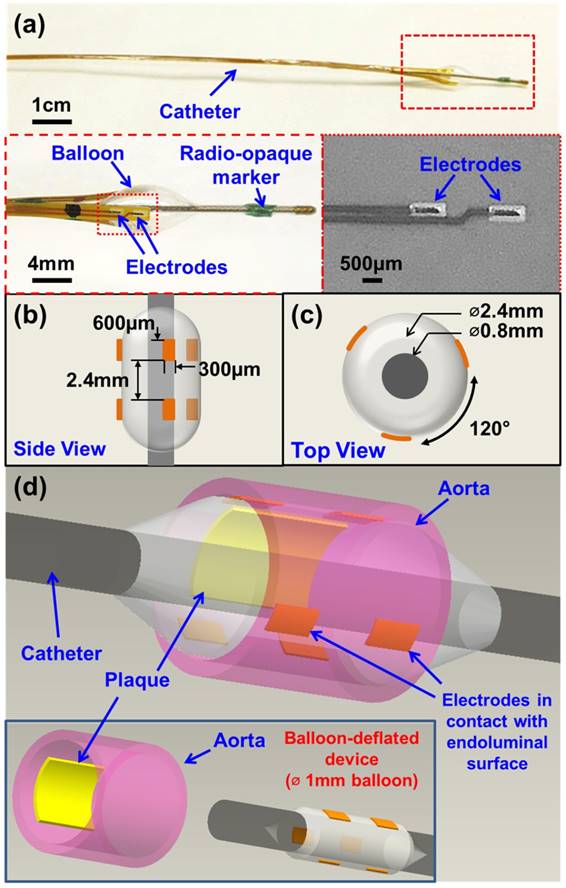
To micro-fabricate the EIS sensors, we first acquired flexible polyimide electrodes (FPCexpress.com, Ontario, CA) with a nominal length of up to 1 meter to bypass the need for interconnects that are required between electrode pads and wirings [9]. These flexible electrodes have been pre-constructed according to the pattern shown in Fig. 1 using the following process: a copper layer (12 µm) was deposited onto the polyimide substrate (12 µm) through electroplating, followed by selective chemical etching of the lithographically-defined patterns via the dry film photoresist (Fig. 2). A second layer of polyimide (12 µm) was added to cover the majority of the copper area using a lamination process. The copper area that eventually became the electrode/contact pad was left uncovered. Finally, a layer of Au/Ni (50 nm/2000 nm) was added through electroless-nickel-immersion-gold (ENIG) process.
Fabrication process of flexible electrodes. (a) Deposition of copper layer and patterning of dry-film photoresist; (b) etching of copper layer; (c) deposition of another polyimide layer and exposing sensor electrodes and contact pad; (d) plating of Au/Ni layer. (e) Schematic of the final device assembly.
To develop the catheter-based device for intravascular deployment, we mounted the inflatable balloon (9 mm in length, 1 mm diameter under deflation and ~3 mm diameter under inflation, Ventiona Medical, NH) on the terminal end of the catheter (40 cm in length) (Vention Medical, NH). Miniature holes were designed to enable balloon inflation. A pair of tantalum foils (1×1 mm, Advanced Research Materials, Oxford, UK) was incorporated to both ends of the balloon as a radiopaque marker, and was secured by a short segment of heat-shrink tube (in green) (Vention Medical, NH). The front end of the flexible electrodes was mounted onto the balloon by the silicone adhesive (Henkel, CT), and the rest of the electrodes and the catheter were encapsulated with the insulating heat-shrink tube 40cm long, amber (Vention Medical, NH). The electrical connection to the impedance analyzer (Gamry Series G 300 potentiostat) was made via the soldering wires on the exposed contact pads at the terminal end of the flexible electrodes. The prototype of the 6-point sensor was comprised of the radio-opaque markers, the inflatable balloon, and the electrodes packaged around the catheter (Fig. 1a-d). A mechanical pump (Atrion Medical Products Inc., Arab, AL) was connected to the end of the catheter to induce balloon inflation.
Equivalent electrical circuits
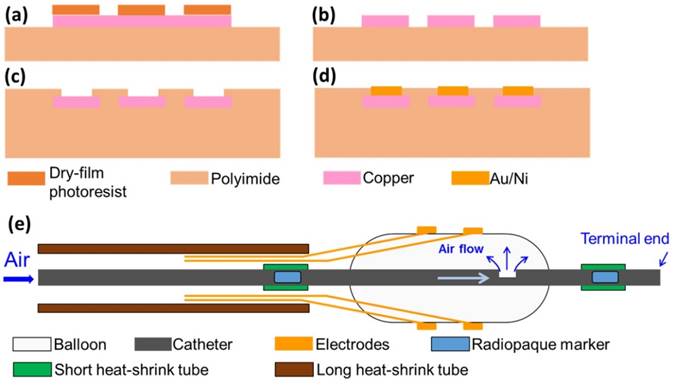
Equivalent circuit models were developed to analyze the electrochemical impedance of atherosclerotic lesions at 3 distinct segments of the aorta (Fig. 3a-d) in the setting of balloon inflation and deflation (Fig. 3e, f). A cross-sectional perspective of the circuit configuration provides the operational principle underlying electrode-tissue interface for the endoluminal EIS interrogation. Four main types of tissue contribute to the aggregated impedance values; namely, blood, aortic wall, atherosclerotic plaque and perivascular fat circumscribing the vessel. In this context, a simple circuit block was first applied to generalize the impedimetric behavior of the individual tissues, consisting of a parallel circuit with two paths: 1) a resistive element (R1) in series with a capacitive element (C) to model the cells; 2) a pure resistive element (R2) to model the extracellular materials (red frame in Fig. 3g) [10]. We further modeled the electrode-tissue interface using the constant phase element (CPE) to take into account the non-linear double layer capacitance behavior. The impedance of the interface can be expressed as:
In vivo sensor deployment and equivalent circuit modeling. The EIS sensor, identified on angiography by the proximal and distal markers, was deployed at 3 levels of the aorta (a), namely the thoracic aorta (b), the abdominal aorta at the level of renal artery bifurcation (c), and the distal abdominal aorta (d). The radiopaque markers made of tantalum (highlighted on the still angiograms by the black circle pointed to by the yellow arrows) permit the identification of the exact position of the device within the aorta. A cross-sectional perspective of the deflated (e) and inflated (f) balloon in the aorta shows specific electrodes to perform the endoluminal EIS measurement. The equivalent circuit includes the blood as primary circuit component upon balloon-deflation (g). The equivalent circuit further includes the aorta, plaque, blood, and perivascular fat all as the circuit components upon balloon-inflation (h). Legend. C: capacitive element. CPE: constant phase element. DM: distal sensor marker. Y: nominal capacitance value, 0<a<1. PM: proximal sensor marker. R: resistive element. S: sheath.
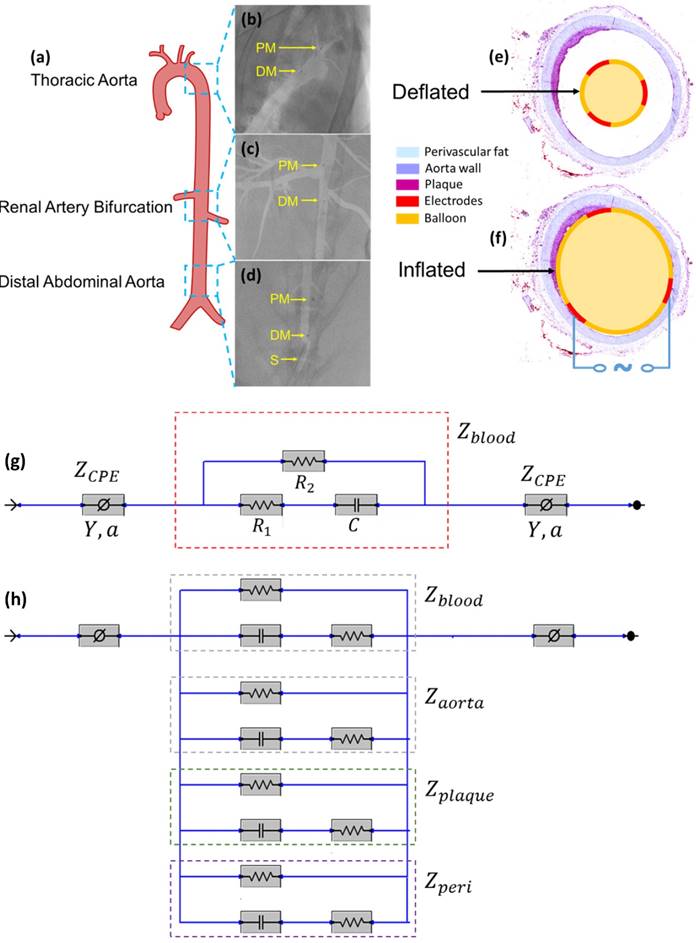
(Eq.3)
Where Y denotes the empirical admittance value, and a a constant between 0 and 1, representing the non-ideal interface effects.
When the balloon was deflated, blood was included as the primary component (Zblood) in the circuit model as other tissues were shielded by the presence of blood in contact with the electrodes (Fig. 3g). When the balloon was inflated, the endoluminal surface was in contact with the electrodes. As a result, all of the tissue types contributed to the path of the current flow, accounting for the parallel circuit configuration for the blood, plaque, vessel wall (aorta), and perivascular fat (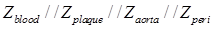 ) (Fig. 3h).
Animal model
All animal studies were approved by the UCLA Office of Animal Research. Analyses were conducted in n=4 control rabbits fed a chow diet and n=5 age-matched high-fat fed NZW male rabbits [11]. High-fat animals were placed on a 1.5% cholesterol and 6.0% peanut oil diet (Harlan laboratory) for 8 weeks prior to harvesting. Animals were anesthetized with isofluorane gas, endotracheally intubutated and placed on a mechanical ventilator. A femoral cut-down was performed and a 4-French arterial sheath placed in the common femoral artery. Under fluoroscopic guidance (Siemens Artis Zeego with robotic arm) and iodinated contrast dye injection, the EIS sensor was advanced for in vivo interrogation of the distal abdominal aorta (site no. 1), followed by the aorta at the level of renal artery bifurcation (site no. 2), and finally at the level of the thoracic aorta (site no. 3). (Fig. 3a-d). Following animal harvesting, aortic samples from the 3 sites were sent for histological analyses. In the adopted scheme of high-fat feeding, these 3 anatomic sites corresponded to areas with trace atherosclerosis, or fatty streaks (abdominal aorta), and mild plaque (thoracic aorta) by histology.
EIS measurement
EIS measurement was conducted along the aorta, namely, abdominal aorta proximal to the aortic bifurcation, abdominal aorta at the level of the renal artery bifurcation, and thoracic aorta. The device with radiopaque markers was placed at these pre-selected segments of the aorta via invasive angiography that was performed during fluoroscopy to mark the exact position of the endoluminal EIS measurements. During balloon inflation, a constant pressure at ~10 psi (pounds per square inch) was applied through a mechanical pump to establish contact with the endoluminal surface. EIS measurements were conducted using the Gamry system (Gamry Series G 300 potentiostat, PA, USA). At each interrogation site, two replicates of each fifteen permutations were performed. AC signals with peak-to-peak voltages of 50 mV and frequencies ranging from 1 - 300 kHz were delivered at each site. The impedance magnitudes were acquired at 10 data points per frequency decade.
Histology
After euthanasia, rabbits were perfused through the left ventricle with normosaline followed by 4% paraformaldehyde. Following fixation, aortic segments which had been identified in vivo by the radiopaque markers and interrogated during invasive angiography, were marked based on anatomic landmarks, excised, and samples sent to the CVPath Institute (Gaithersburg, MD) for further processing and staining. Following cryosectioning, samples were stained with hematoxylin and eosin and oil-Red-O for neutral lipids. Atherosclerotic areas identified by oil-Red-O were quantified using image J software (National Institutes of Health, Bethesda, MD).
Statistical analyses
To test for differences in impedance values, the Brown-Forsythe test was used to determine significance across groups, and Dunnett's test was used for multiple comparisons and correction of multiple testing. Impedance values were further compared using the Mann-Whitney test for differences in medians, and the Kolmogorov-Smirnov test for differences in global value distributions. GraphPad version 6 was used to perform the statistical analyses. A P-value < 0.05 was considered significant.
Results
Intravascular deployment for EIS permutations
Impedimetric interrogation was demonstrated in the thoracic aorta, abdominal aorta at the level of the renal artery bifurcation, and abdominal aorta proximal to the aortic bifurcation (Fig. 3a-d). Prior to the EIS measurements, angiographic images were obtained to localize the EIS sensors as demarcated by the radiopaque tantalum pairs. Invasive angiography was unable to detect early atherosclerotic lesions [12] in high-fat diet fed rabbits (Fig. 3b-d). A representative schematic of the intravascular sensor with deflated (Fig. 3e) and inflated (Fig. 3f) balloon is shown. The equivalent circuit includes the blood as primary circuit component upon balloon-deflation (Fig. 3g, Table S1). The equivalent circuit further includes the aorta, plaque, blood, and perivascular fat all as the circuit components upon balloon-inflation (Fig. 3h, Table S2).
EIS mapping
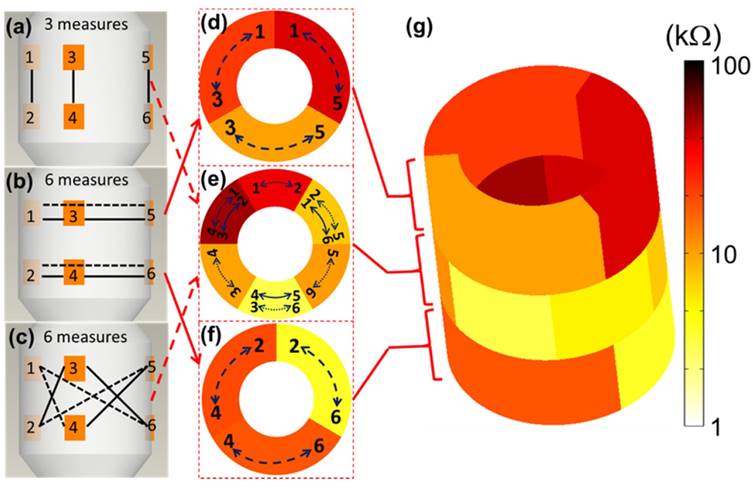
The 6-point electrode configuration enabled the demonstration of 15 EIS permutations (3+6+6) consisting of 3 2-point electrodes that were vertically linked between the two rows (Fig. 4a), 6 2-point electrodes that were linked circumferentially within rows (Fig. 4b), and 6 2-point electrodes that were cross-linked diagonally between the two rows (Fig. 4c). This novel combination of 15 permutations paved the way for flexible 3-D interrogation and impedimetric mapping of the arterial segment over 3 rings, or sub-segments, as illustrated (Fig. 4d-f). For the 3-D mapping, each color represents impedance values using a distinct electrode permutation (Fig. 4g), with lighter colors indicating lower impedances and darker colors higher impedances, as illustrated using a logarithmic scale. This user-friendly readout permits rapid clinical impedance interpretation of lesion types, detection of clinically silent atherosclerosis, and physician adoption based on usability.
3-D EIS mapping using the 15 permutations of the 6-point device. There are 6 electrodes on the device and the individual pairs of electrodes are connected by the solid/dotted lines, each representing one permutation. The design of the 6-point EIS sensor into 2 rows, or rings, of 3-point electrodes permits 3 sets of long axis (vertical) interrogations (a), 6 sets of short axis (horizontal) interrogations (b), and 6 sets of diagonal interrogations (c) to create analysis of three arterial rings (d-f). (g) 3-D mapping of a reconstructed aortic segment with atherosclerosis highlights the 15 (3+6+6) distinct permutations of the EIS impedance measurements with corresponding color scale.
EIS measurements
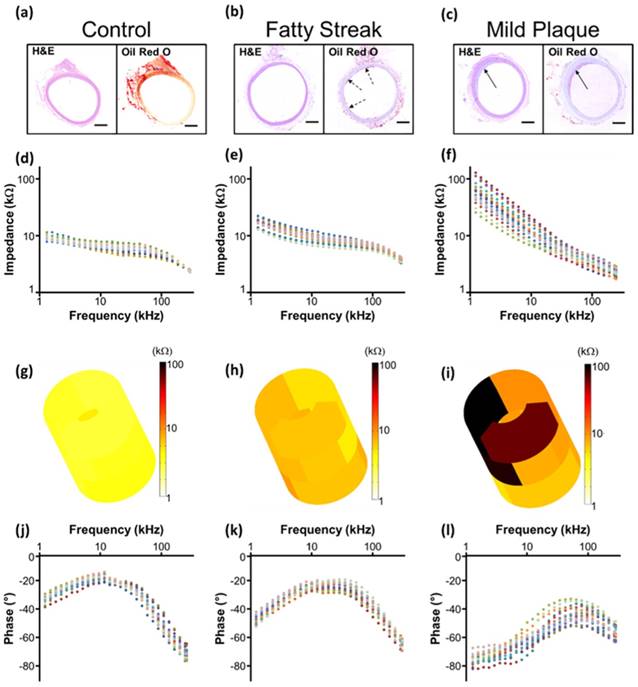
Representative real-time EIS measurements of impedance and phase are compared among the three segments of the aorta and correlated with histological findings (Fig. 5). Histology staining with oil-Red-O for atherosclerotic lesions supported the changes in EIS in response to the eccentric plaques from the thoracic aorta to the renal bifurcation and distal abdominal aorta (Fig. 5a-c). Early lesions, also known as fatty streaks, stained positive for intra-lesion neutral lipids by oil-Red-O (Fig. 5b). The sweeping frequency ranged from 1 - 300 kHz within which the impedance decreased monotonously across conditions. Differences in impedance were most significant at 1 kHz (Fig. 5d-f). In the 3-D impedance map, lighter colors (yellow) were observed in control aortas (Fig. 5g), intermediate colors (yellow, light brown) in fatty streaks (Fig. 5h), and darker colors (dark brown, black) were present in the atherosclerotic plaques (Fig. 5i). Furthermore, increasing delays in phase were identified with lesion progression from control (Fig. 5j) to fatty streak (Fig. 5k) to mild plaque (Fig. 5l). The behavior of the EIS measurements was reflective of the heterogeneous composition of the atherosclerotic lesions.
EIS measurements and corresponding histology. Hematoxylin & eosin (H&E) staining was used for arterial wall and oil-Red-O for the lipid-laden atherosclerotic lesions to validate the EIS impedance measurements in control aortas (a, d), in fatty streaks from abdominal aortas (b, e), and in mild atherosclerotic plaques from the thoracic aorta (c, f). Eccentric plaques developed in the New Zealand White rabbits on high-fat diet in the thoracic aorta area (c, solid arrows), whereas much smaller, early atherosclerotic lesions, or fatty streaks, developed in the two abdominal sites (b, dotted arrows). Corresponding examples of the impedance magnitude obtained from the 15 interrogations in response to the sweeping frequency from 1 - 300 kHz are presented in logarithmic scale (d-f). The reconstruction of the 15 permutation measures are represented in 3-D color coded impedance maps, visually demonstrating differences between control (g), fatty streak (h), and mild atherosclerotic plaque (i). Corresponding phase plots are also presented in logarithmic scale (j-l). Scale bar: 1mm.
Equivalent circuit modeling
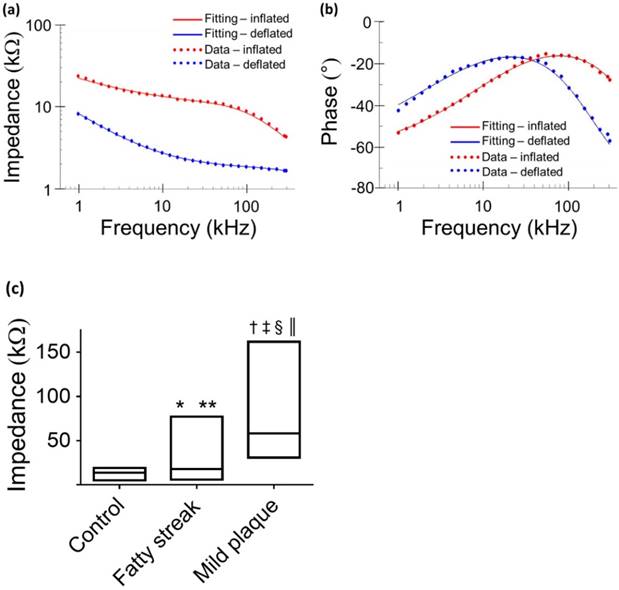
Equivalent circuits were modeled to predict changes in EIS in response to balloon deflation and inflation (Fig. 3). The model parameters (as shown in Fig. 3) were numerically calculated by using a simplex algorithm available in the Gamry Echem Analyst software. Curve fitting was performed by incorporating the model parameters, namely; blood, vessel tissue, plaque, and perivascular fat. The theoretical curve fittings were in agreement with the experimental impedance (Ω) (Fig. 6a) and phase (°) measurements (Fig. 6b) during balloon deflation and inflation. Under the deflation state, the electrodes were in contact with the highly conductive blood, and the model parameters for the vessel tissue, lipid-rich plaques, and perivascular fat were electrically shielded for our equivalent circuit model (Fig. 3e, g, and Fig. 6a, b). Under the inflation state, the electrodes were in contact with the endoluminal surface and/or plaque, plus the additional model parameters from the vessel wall (Fig. 3f, h and Fig. 6a, b). The constant phase element can be described by the two variables Y and a. Our fitting results in both balloon deflated and inflated condition for Y/a are 321 nS·sa / 0.691 (where n=nano, S=Siemens, and s=seconds) and 248 nS·sa / 0.659, respectively, which indicates there is no significant distinction between the two scenarios in terms of contact impedance. A Bode diagram comparison of the two different constant phase elements is presented in the supplementary information (Fig. S1) to show the behavior of the  . The value of a not being equal to 1 verifies the non-ideal capacitive behavior the electrode-tissue interface. The fitting results of other resistance and capacitance values are available in the supplementary information (Table S1), as well as a physical model to compare the circuit model fitting with reported conductivity and permittivity of different tissues.
Comparison between theoretical and experimental data. Representative data fitting was performed under balloon-deflation and -inflation (a, b). A simplex algorithm in the Gamry Echem Analyst software was used to demonstrate the EIS measurements by applying the two equivalent circuit models (Fig. 3g, h). The fitting curves (solid lines) are in agreement with the experimental measurements (dotted lines) for impedance (a) and phase (b). In vivo data obtained at a frequency of 1kHz demonstrates significant differences in the median and range (min - max) of impedance values by condition (c). Legend. *P = 0.016 medians control vs. fatty streak. **P = 0.024 value distributions control vs. fatty streak. †P < 0.001 medians control vs. mild atherosclerotic plaque. ‡P < 0.001 value distributions control vs. mild atherosclerotic plaque. §P < 0.001 medians fatty streak vs. mild atherosclerotic plaque. ║P < 0.001 value distributions fatty streak vs. mild atherosclerotic plaque.
Data analysis of 3-D EIS measurements
From each aortic interrogation point, the 15 permutations obtained at 1 kHz are displayed as the medians and the 2 extreme values (minimum - maximum) of the impedance range. These demonstrated a tight spread of values in control aortas, with a median impedance of 13.79 kΩ and a narrow range of global values ranging from a minimum of 5.22 kΩ to a maximum of 19.13 kΩ. Fatty streaks identified in the abdominal aorta at the level of renal artery bifurcation area or proximal to the aortic bifurcation demonstrated a median (17.75 kΩ) and range of values (minimum 5.79 - maximum 77.05 kΩ) intermediate to values in control segments and to values in mild plaque segments from the thoracic aorta (median 58.32 kΩ, minimum 30.86 kΩ, maximum 161.74 kΩ) (Fig. 6c). There was a significant difference across groups (P < 0.001), which was maintained by the pair-wise comparisons with correction for multiple testing. Comparing control to fatty streak, there was a significant difference in impedance medians (P = 0.016) and value distributions (P = 0.024). This difference was further accentuated when comparing control to mild atherosclerotic plaque (P < 0.001 for differences in both medians and value distributions). The impedance differences between fatty streaks and mild atherosclerotic plaques were also highly significant (P < 0.001 for differences in both medians and value distributions).
Discussion
The presented novel 6-point configuration advances disease detection to flexible 3-D interrogation of early atherosclerotic lesions that harbor distinct electrochemical properties otherwise invisible by current imaging modalities such as invasive angiography. Atherosclerosis is a chronic inflammatory disease of the arterial wall resulting from a complex interplay between heritability [13], environmental factors [14], intestinal microbiota [15], biomechanical forces [16], and other causes. Atherosclerosis develops over decades [17] with evidence of early lesions, or fatty streaks, present in autopsy series of young adults who died in their early 20's [18]. The end result of the advanced stages of the pathobiology of atherosclerosis remains a leading cause of mortality and morbidity worldwide through clinical manifestations such as acute coronary syndromes or strokes [19]. Invasive coronary angiography is considered the gold standard of coronary artery disease determination. Whereas this technique permits visualization of established atherosclerotic plaques, it does not have the necessary spatial resolution to detect early stages of the disease [20]. Thus, 3-D EIS mapping provides the dielectric property at the electrode-tissue interface to detect metabolically active atherosclerotic lesions, albeit angiographically invisible, for possible early medical intervention and prevention of acute coronary syndromes or stroke.
Percutaneous transluminal coronary angioplasty (PTCA) - or balloon dilation of the coronary arteries - has been routinely performed for 40 years, initially as a standalone procedure [21], and subsequently combined with coronary stent deployment [22]. The safety of balloon dilation of arteries to treat atherosclerotic lesions is well documented in humans [23] and experimental models [24], with success determined by a post-procedure angiogram [25]. Future clinical application in humans of our current proposed 6-point EIS sensor would similarly require intravascular advancement of the catheter and verification of balloon inflation under angiographic guidance, with close monitoring of impedance characteristics to differentiate the distinct patterns obtained when the sensor is only in contact with blood (deflated, or not fully deployed) as opposed to the endoluminal vessel wall (inflated, or fully deployed) (Fig. 6a).
It is recognized that tissues store charges, and frequency-dependent electrical impedance (Z) develops in response to applied alternating current (AC). Previously proposed applications of EIS include assessment of cellular viability of human cancer cells [26] and amyloid β-sheet misfolding [27]. When an AC current is applied to the plaque in a vessel, a complex electric impedance (Z) is generated as a function of frequency. Z is defined as the summation of a resistive part (r) and a reactive part (Xc) multiplied by the complex number (j) ( ) [1, 28]. Fat-free tissue is known as a good electrical conductor for its high water (approximately 73%) and electrolytes content (ions and proteins), whereas fatty tissue is anhydrous and a poor conductor. Thus, these electrical properties synergistically render a significantly lower electrical conductivity in lipid-rich plaques (
 ;
;  ,
,  being the intrinsic conductivity and permittivity of the tissue) than the rest of the blood and vascular components. Early stage lesions, though small in size and thus difficult to detect with conventional angiography, still exhibit a distinctive impedimetric behavior as opposed to normal arteries. These EIS properties have formed the electrochemical basis to detect early stage lipid-rich plaques.
Several distinctive electrode configurations have been reported for intravascular impedimetric interrogation. Süselbeck et al. introduced a catheter-based 4-point electrode configuration to address the electrode-tissue contact impedance issue. However, its relatively large device dimension - required to accommodate 4 electrodes (2 cm in total length) - posed a clinical challenge for intravascular deployment [8]. We previously demonstrated the 2-point concentric electrode configuration, providing a ~2000 fold reduction in device dimension (300 µm in diameter) to enable integration with different sensing modalities, including ultrasonic transducers and flow sensors [2, 5]. Furthermore, the concentric configuration addressed the heterogeneous tissue composition, uneven surface topography and non-uniform current distribution of the atherosclerotic lesions. Recently, we introduced the 2-point electrode concept by implementing two identical flexible electrodes (240 µm in diameter) with a large separation (400 µm); thus, providing a deep current penetration for intraplaque burden detection [9].
Although 4-electrode systems can be miniaturized to become more suitable in clinical applications, they still occupy twice the space of 2-electrode systems. This issue further manifests itself when multiple measuring sites are required, as in the case of the 6-point configuration presented in the current study. There would be 12 electrodes needed to implement the equivalent for 4-electrode systems, thereby greatly complicating the possible electrode layout design as well as the electrical connections to the measurement instruments. Regarding the electrode-tissue interface impedance, as shown in Fig. 6a there is a clear shift of the impedance value throughout the frequency spectrum between balloon deflation and inflation. These impedance values are composed of the interface impedance as well as the tissues under interrogation, thereby indicating that the interface impedance is dominated by the tissue impedance. Hence, the impedance measurement reflects varying responses from the underlying tissues (atherosclerotic plaques, aorta, etc.) and can be utilized in evaluating different tissue compositions. It is worth noting that if the electrodes were to be further miniaturized, thereby increasing the electrode-tissue interface impedance, the tissue impedance might not be the dominating component in our 2-electrode system. Further treatment, e.g. electroplating platinum black onto the electrode to reduce the interface impedance, would be necessary to achieve high measurement specificity.
The aforementioned EIS sensing devices only focus on the local current detection that merely detects a small region of the entire endovascular segment where the atherosclerotic lesions are often eccentric and multiple. We further advance EIS sensing by implementing the 6-point configuration to optimize 3-D detection of small, angiographically invisible, atherosclerotic lesions. This unique configuration allowed for six stretchable electrodes to be circumferentially and equidistantly positioned in individual rows around a dilatable balloon (Fig. 1 and 2) and were deployed in vivo in the NZW rabbit model of atherosclerosis. Upon balloon inflation, all electrodes were made possible to be in contact with the endoluminal surface. The elongated flexible polyimide electrodes eliminated the packaging challenge to connect the individual miniaturized contact pads with electrical wires for the 2-point sensors [9]. The addition of active electrodes (from 2 to 6) engendered 15 different permutations to extend the EIS measurements from a focal region to an entire circumferential ring of the aorta. Data fitting results using an equivalent circuit model further demonstrate close agreement between the experimental EIS measurements and theoretical equivalent circuit modeling (Fig. 6). The fitting results are presented in the supplementary information (Table S1) and we further performed a detailed physical modeling to demonstrate that our findings are in reasonable agreement with reported electrical properties of multiple tissues, thereby validating the simplified circuit model (Fig. S2, S3, Table S2, S3). The local EIS measurements were then reconstructed into 3-D impedimetric mapping (Fig. 4) to significantly enhance the visualization quality and translational applicability of the impedance data.
We demonstrate that the impedance value distribution obtained from different combinations of the 6-point electrodes at a frequency of 1 kHz exhibits a significantly wider range in aortas of high-fat diet fed rabbits compared to controls on a normal diet (Fig. 6c). This finding signifies a major characteristic shift from healthy arteries to ones with subclinical atherosclerosis and therefore can serve as a detection criterion. The wider range of impedance value arises from the fact that the existence of eccentric and multiple atherosclerotic lesions around the endoluminal surface increases the overall impedance variation compared to a homogeneous healthy artery. Previously designed EIS devices [1, 7-9] interrogated only limited segments of the vessel, potentially missing lesions which are not in close proximity with the electrodes. Therefore, our new 6-point configuration permits comprehensive 3-D mapping and successful detection of eccentric and small atherosclerotic lesions which harbor metabolically active lipids (Fig. 5 and 6), however remain invisible with conventional angiography (Fig. 3b-d).
Conclusion
We introduce a novel 6-point electrode design for early detection of subclinical atherosclerotic lesions. The unique electrode configuration allows for 3 stretchable electrodes to be circumferentially and equidistantly positioned in individual layers. The 15 EIS permutations provide a paradigm shift, allowing the reconstruction of a 3-D map of impedance spectroscopy. In this context, we have identified metabolically active plaques, also known as fatty streaks, that harbor lipid-laden macrophage foam cells [2, 3, 9, 29] that are otherwise non-detectable by current angiography. Thus, 3-D EIS mapping holds translational promises for early detection and prevention of acute coronary syndromes or strokes.
Supplementary Material
Supplementary figures and tables.
Acknowledgements
This study was supported by National Institutes of Health grants HL118650 (T.K.H., Y.C.T.), HL083015 (T.K.H.), HL111437 (T.K.H., Y.C.T.), and HL129727 (T.K.H.), the UCLA STAR program (R.R.S.P.), and American Heart Association Scientist Development Grant 16SDG30910007 (R.R.S.P.).
Competing Interests
The authors have declared that no competing interest exists.
References
1. Yu F, Dai X, Beebe T, Hsiai T. Electrochemical impedance spectroscopy to characterize inflammatory atherosclerotic plaques. Biosensors and Bioelectronics. 2011;30:165-73
2. Yu F, Lee J, Jen N, Li X, Zhang Q, Tang R. et al. Elevated electrochemical impedance in the endoluminal regions with high shear stress: Implication for assessing lipid-rich atherosclerotic lesions. Biosensors and Bioelectronics. 2013;43:237-44
3. Yu F, Li R, Ai L, Edington C, Yu H, Barr M. et al. Electrochemical impedance spectroscopy to assess vascular oxidative stress. Annals of Biomedical Engineering. 2011;39:287-96
4. Larsson J. Electromagnetics from a quasistatic perspective. American Journal of Physics. 2007;75:230-9
5. Ma J, Luo Y, Packard RRS, Ma T, Ding Y, Abiri P. et al. Ultrasonic transducer-guided electrochemical impedance spectroscopy to assess lipid-laden plaques. Sensors and Actuators B: Chemical. 2016;235:154-61
6. Sevanian A, Hwang J, Hodis H, Cazzolato G, Avogaro P, Bittolo-Bon G. Contribution of an in vivo oxidized LDL to LDL oxidation and its association with dense LDL subpopulations. Arteriosclerosis, Thrombosis, and Vascular Biology. 1996;16:784-93
7. Streitner I, Goldhofer M, Cho S, Thielecke H, Kinscherf R, Streitner F. et al. Electric impedance spectroscopy of human atherosclerotic lesions. Atherosclerosis. 2009;206:464-8
8. Suselbeck T, Thielecke H, Kochlin J, Cho SB, Weinschenk I, Metz J. et al. Intravascular electric impedance spectroscopy of atherosclerotic lesions using a new impedance catheter system. Basic Research in Cardiology. 2005;100:446-52
9. Packard RRS, Zhang X, Luo Y, Ma T, Jen N, Ma J. et al. Two-Point Stretchable Electrode Array for Endoluminal Electrochemical Impedance Spectroscopy Measurements of Lipid-Laden Atherosclerotic Plaques. Annals of Biomedical Engineering. 2016;44:2695-706
10. Meissner R, Eker B, Kasi H, Bertsch A, Renaud P. Distinguishing drug-induced minor morphological changes from major cellular damage via label-free impedimetric toxicity screening. Lab on a Chip. 2011;11:2352-61
11. Anitschkow N, Chalatow S. On Experimental Cholesterin Steatosis and Its Significance in the Origin of Some Pathological Processes. Arteriosclerosis. 1983;3:178-82
12. Kashyap VS, Pavkov ML, Bishop PD, Nassoiy SP, Eagleton MJ, Clair DG. et al. Angiography underestimates peripheral atherosclerosis: lumenography revisited. Journal of Endovascular Therapy. 2008;15:117-25
13. Kathiresan S, Srivastava D. Genetics of human cardiovascular disease. Cell. 2012;148:1242-57
14. Jackson SP. Arterial thrombosis—insidious, unpredictable and deadly. Nature Medicine. 2011;17:1423-36
15. Koeth RA, Wang Z, Levison BS, Buffa JA, Org E, Sheehy BT. et al. Intestinal microbiota metabolism of L-carnitine, a nutrient in red meat, promotes atherosclerosis. Nature Medicine. 2013;19:576-85
16. Brown AJ, Teng Z, Evans PC, Gillard JH, Samady H, Bennett MR. Role of biomechanical forces in the natural history of coronary atherosclerosis. Nature Reviews Cardiology. 2016;13:210-20
17. Libby P. Mechanisms of acute coronary syndromes and their implications for therapy. New England Journal of Medicine. 2013;368:2004-13
18. Enos WF, Holmes RH, Beyer J. Coronary disease among United States soldiers killed in action in Korea: preliminary report. Journal of the American Medical Association. 1953;152:1090-3
19. Libby P, Ridker PM, Hansson GK. Progress and challenges in translating the biology of atherosclerosis. Nature. 2011;473:317-25
20. Dweck MR, Doris MK, Motwani M, Adamson PD, Slomka P, Dey D. et al. Imaging of coronary atherosclerosis—evolution towards new treatment strategies. Nature Reviews Cardiology. 2016;13:533-48
21. Grüntzig A. Transluminal dilatation of coronary-artery stenosis. Lancet. 1978;311:263
22. Sigwart U, Puel J, Mirkovitch V, Joffre F, Kappenberger L. Intravascular stents to prevent occlusion and re-stenosis after transluminal angioplasty. New England Journal of Medicine. 1987;316:701-6
23. Indolfi C, De Rosa S, Colombo A. Bioresorbable vascular scaffolds—basic concepts and clinical outcome. Nature Reviews Cardiology. 2016;13:719-29
24. Iqbal J, Chamberlain J, Francis SE, Gunn J. Role of animal models in coronary stenting. Annals of Biomedical Engineering. 2016;44:453-65
25. Levine GN, Bates ER, Blankenship JC, Bailey SR, Bittl JA, Cercek B. et al. 2011 ACCF/AHA/SCAI Guideline for percutaneous coronary intervention. Circulation. 2011;124:e574-e651
26. Hondroulis E, Zhang R, Zhang C, Chen C, Ino K, Matsue T. et al. Immuno nanoparticles integrated electrical control of targeted cancer cell development using whole cell bioelectronic device. Theranostics. 2014;9:919
27. Li H, Huang Y, Zhang B, Yang D, Zhu X, Li G. A new method to assay protease based on amyloid misfolding: application to prostate cancer diagnosis using a panel of proteases biomarkers. Theranostics. 2014;7:701
28. Aroom KR, Harting MT, Cox CS, Radharkrishnan RS, Smith C, Gill BS. Bioimpedance analysis: a guide to simple design and implementation. Journal of Surgical Research. 2009;153:23-30
29. Cao H, Yu F, Zhao Y, Scianmarello N, Lee J, Dai W. et al. Stretchable electrochemical impedance sensors for intravascular detection of lipid-rich lesions in New Zealand White rabbits. Biosensors and Bioelectronics. 2014;54:610-6
Author contact
![]() Corresponding author: Tzung K. Hsiai, Departments of Medicine and Bioengineering, David Geffen School of Medicine, Henry Samueli School of Engineering & Applied Science, UCLA, Los Angeles, CA 90073. E-mail: thsiaiucla.edu. Tel: 310-825-4467
Corresponding author: Tzung K. Hsiai, Departments of Medicine and Bioengineering, David Geffen School of Medicine, Henry Samueli School of Engineering & Applied Science, UCLA, Los Angeles, CA 90073. E-mail: thsiaiucla.edu. Tel: 310-825-4467