Impact Factor
- Issue 14; 2026
- Issue 13; 2026
- Issue 12; 2026
- Issue 11; 2026
- Issue 10; 2026
- Volume 16; 2026
- Advance Articles
- Past Issues
- Cover Images
- Cover Suggestion
- Index & Coverage
- Special Issues
Introduction
HER family pathways and...
Molecular imaging strategies
Platform integration to guide...
Discussion
Acknowledgements
References
International Journal of Biological Sciences
International Journal of Medical Sciences
 Global reach, higher impact

Theranostics 2017; 7(7):2111-2133. doi:10.7150/thno.17934 This issue Cite
Review
Harnessing Integrative Omics to Facilitate Molecular Imaging of the Human Epidermal Growth Factor Receptor Family for Precision Medicine
Martin Pool1*, H. Rudolf de Boer1*, Marjolijn N. Lub-de Hooge2, 3, Marcel A.T.M. van Vugt1# ![]() , Elisabeth G.E. de Vries1#
, Elisabeth G.E. de Vries1# ![]()
1. Department of Medical Oncology, University of Groningen, University Medical Center Groningen, Groningen, The Netherlands;
2. Department of Clinical Pharmacy and Pharmacology, University of Groningen, University Medical Center Groningen, Groningen, The Netherlands;
3. Department of Nuclear Medicine and Molecular Imaging, University of Groningen, University Medical Center Groningen, Groningen, The Netherlands.
* Co-first author
# Co-senior author
Received 2016-10-15; Accepted 2017-3-2; Published 2017-5-27
Abstract

Cancer is a growing problem worldwide. The cause of death in cancer patients is often due to treatment-resistant metastatic disease. Many molecularly targeted anticancer drugs have been developed against 'oncogenic driver' pathways. However, these treatments are usually only effective in properly selected patients. Resistance to molecularly targeted drugs through selective pressure on acquired mutations or molecular rewiring can hinder their effectiveness. This review summarizes how molecular imaging techniques can potentially facilitate the optimal implementation of targeted agents. Using the human epidermal growth factor receptor (HER) family as a model in (pre)clinical studies, we illustrate how molecular imaging may be employed to characterize whole body target expression as well as monitor drug effectiveness and the emergence of tumor resistance. We further discuss how an integrative omics discovery platform could guide the selection of 'effect sensors' - new molecular imaging targets - which are dynamic markers that indicate treatment effectiveness or resistance.
Keywords: Molecular imaging, cancer therapy, personalized medicine, EGFR, HER2, HER3, drug resistance.
Introduction
Cancer is the third leading cause of death in the world and mortality is expected to rise (1, 2). Despite current state-of-the-art treatment options, many cancer patients will ultimately die due to metastatic disease. In the last few decades, new insights in biological processes underlying cancer led to a flood of rationally designed targeted drug candidates (3). However, these targeted agents have not reached their full potential due to inadequate patient selection, which may partly be solved by enrichment of patient populations using specific biomarkers (3). Underlying reason for these patient sub-populations is inter-tumor heterogeneity caused by genotypic and phenotypic differences between tumors of similar histopathological subtype (4). Similarly, within and between tumor lesions of a single patient (intra-tumor heterogeneity), drug target and biomarker expressions are neither homogeneous nor static (4). Thus, high degrees of intra-tumor heterogeneity in acquired mutations and target expression levels can lead to clonal heterogeneity, an outgrowth of treatment-resistant cells, and ultimately, treatment failure (5, 6). Furthermore, pathway rewiring can lead to acquired resistance. Combined, these factors prevent or circumvent efficacy of targeted drugs (7), requiring advanced detection tools to determine tumor heterogeneity, biomarker expression dynamics for improving patient selection, and monitor treatment efficacy. In this review, we will discuss how molecular imaging may complement molecular testing to facilitate patient selection and monitor drug efficacy. We will also review discovery platforms for novel imaging markers that signify response or resistance to molecularly targeted treatments.
Molecular imaging is well-suited for visualization and clinical assessment of biological processes, as it can non-invasively and quantitatively monitor whole-body marker expression (8, 9). By comparing the uptake of imaging tracers across all lesions and between patients, the tumor heterogeneity, drug delivery, and biological responses to drug treatment can be assessed before clinical progression becomes apparent by conventional techniques, e.g. biopsies and anatomical imaging (8). Furthermore, molecular imaging has the potential to monitor 'effect sensors', early response biomarkers providing insight into the functional changes at the cellular level that reflect the effectiveness of treatment or emergence of resistance mechanisms.
We will also explore various techniques and platforms that can be utilized for identification, selection and molecular imaging of drug targets and effect sensors. The role of the human epidermal growth factor receptor (HER) family in human cancers has been extensively studied. Consequently, multiple HER-targeted agents are in clinical use and many HER-targeted imaging strategies and resistance mechanisms have been reported (10). Therefore, we will use the known crosstalk, resistance mechanisms and effect sensors of the HER family as a model.
Search Strategy
Public data base searches were performed on PubMed, ClinicalTrials.gov and Google Scholar for combinations of the following search terms: “EGFR”, “HER2”, “HER3”, “HER4”, “c-MET”, “VEGF-A”, “Src”, “ImmunoPET”, “PET”, “SPECT”, “molecular imaging”, “fluorescence imaging”, ''near-infrared”, “nuclear imaging”, ''optoacoustic imaging”, “resistance”, “breast cancer”, “lung cancer”, “gastric cancer”, “colorectal cancer”, “systems biology”, “integrative omics”, “genomics”, “transcriptomics”, “proteomics”, “mass spec”, “biomarker”, and “treatment response”.
Important abbreviations
Protein-related; EGFR: epidermal growth factor receptor; HER: human EGFR family; HER2-4: human EGFR 2-4; RTK: receptor tyrosine kinase; c-MET: cellular-mesenchymal to epithelial transition factor; HSP90: heat shock protein-90; Src: Rous sarcoma oncogene cellular homolog
Cancer-related; CRC: colorectal cancer; NSCLC: non-small cell lung cancer; HNSCC: head and neck squamous cell carcinoma; TKI: tyrosine kinase inhibitor; mAb: monoclonal antibody
Imaging; SPECT: Single photon emission computed tomography; PET: positron emission tomography; CT: computed tomography; Zr: zirconium; In: indium; Ga: Gallium; Cu: Copper; Tc: technetium; I: iodine; F: fluorine; C: carbon; NIRF: near-infrared fluorescence; 800CW: IRDye 800CW
Omics; CNAs: copy number aberrations; PTMs: post-translational modifications; MS: mass spectrometry; TCGA: The Cancer Genome Atlas consortium
HER family pathways and resistance in cancer
HER family signaling
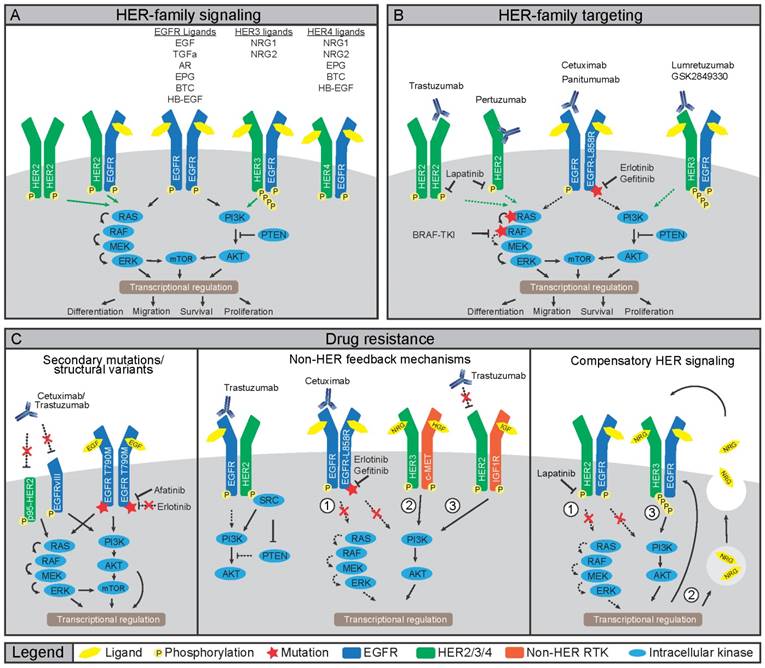
To understand how HER-targeted imaging strategies could potentially benefit patients, it is important to identify the HER-mediated signal transductions, which are the underlying processes determining treatment efficacy. The HER family consists of four receptor tyrosine kinases (RTKs); epidermal growth factor receptor (EGFR), HER2, HER3 and HER4 (also ERBB1-ERBB4). HER members function through homo- or heterodimerization to stimulate proliferation, cell survival, and metastasis (Figure 1A) (11). Like most RTKs, HER proteins comprise an extracellular ligand-binding domain and an intracellular ATP-dependent tyrosine kinase (TK) domain. Ligand-induced conformational changes in HER family proteins allow for dimerization, which promotes transphosphorylation of tyrosine residues in TK domains of dimerization partners leading to downstream protein kinase B (AKT) and extracellular signal-regulated kinase (ERK) pathway activation (12,13). Various ligands non-exclusively bind to EGFR, HER3 and HER4, as listed in Figure 1C (11). In contrast, no ligand is known to bind HER2. Rather, HER2 conformation allows constitutive dimerization making it the preferred dimerization partner for other HER family members (14). HER3 only has weak intrinsic kinase activity and thus mainly depends on heterodimerization for phosphorylation of six unique tyrosine residues in the C-terminal tail, initiating potent downstream signaling (15-17).
Involvement of HER family in cancer treatment and resistance A) Ligand binding to HER family members induces homo- or hetero-dimerization. Transphosphorylation of kinase domains then induces a downstream phosphorylation cascade including PI3K/AKT/mTOR and RAS/RAF/MEK/ERK pathways. B) Cancers that dependent on HER family activity can be treated using mAbs or TKIs. Binding of mAbs can inhibit receptor function by preventing dimerization or ligand binding, or by inducing internalization and degradation. Small molecule TKIs inhibit transphosphorylation by blocking the ATP binding pockets, either of the receptors or downstream signaling nodes. C) Multiple mechanisms of resistance to HER family-directed therapy have been discovered. Expression of truncated variant HER2-p65 or EGFRvIII prevent antibody binding, while gatekeeper mutations in EGFR limit binding of erlotinib or gefitinib to TK domain of EGFR (left panel). Inhibition of HER signaling can be restored by interactions with non-HER family members, namely c-MET, IGF1R or Src (middle panel). Lastly, compensatory feedback mechanism exist within the HER family, where inhibition of HER2 induces expression and activation of HER3 to restore PI3K/AKT signaling (right panel).
HER family receptors in cancer and treatment resistance
HER ligands are aberrantly expressed in various cancers and HER family members, especially EGFR and HER2, are oncogenic drivers upon mutation or amplification (Figure 1) (10). Therefore, several HER-directed therapeutics have been developed including small molecule tyrosine kinase inhibitors (TKIs) and monoclonal antibodies (mAbs) (Figure 1B) (10). The HER2 mAb trastuzumab increases overall survival of patients with metastatic disease and of patients with HER2-positive breast cancers in the adjuvant setting (18). Nevertheless, resistance to HER-directed treatments frequently occurs (Figure 1C). Resistance can develop from selective pressure on existing or de novo mutations, which circumvent drug action (19). Alternatively, treatment resistance can develop through rewiring of parallel signaling pathways often involving other RTKs taking over the proliferative drive (19-24). Although not all mechanisms of treatment resistance are understood, multiple mechanisms that drive resistance to HER-directed agents have been elucidated underscoring the need for preventive and alternative treatment strategies.
Treatment with EGFR-directed mAbs cetuximab or panitumumab shows anti-tumor efficacy in a subset of colorectal cancer (CRC) patients harboring KRAS wild-type (wt) tumors while EGFR TKIs gefitinib or erlotinib are not effective due to the absence of mutations in EGFR (10). In CRC patients with EGFR-wt tumors, resistance to EGFR-directed therapeutics can emerge through selection or de novo acquisition of oncogenic KRAS mutations (25). In contrast to CRC, treatment with EGFR-mAbs in non-small cell lung cancer (NSCLC) hardly improves clinical outcomes. Yet, treatment with gefitinib and erlotinib has an anti-tumor effect in NSCLC patients harboring activating mutations in the EGFR TK domain (26). Invariably, these patients develop resistance, which in ~60% of the patients, is due to the EGFR-T790M ''gatekeeper'' mutation that renders EGFR insensitive to both gefitinib and erlotinib (Figure 1C) (26). To counter this mechanism, second and third generation EGFR TKIs with increased affinity for EGFR-T790M are in development. The TKI afatinib, approved for EGFR-exon 19 deletions or exon 21 L858R substitutions in NSCLC, is also being evaluated in combination with cetuximab in NSCLC patients harboring T790M mutations. (27, 28). The EGFRvIII mutation, which lacks the ligand-binding domain encoded by exons 2-7 leading to constitutive kinase activity, is mainly found in glioblastoma multiforme. The lack of a ligand-binding domain and absence of kinase mutations make that EGFRvIII mutant cancers respond poorly to TKIs and EGFR mAbs regardless of mAb ability to bind to the receptor (29).
In breast cancer, HER2 is an oncogenic driver with 20-25% of breast cancers harboring HER2 amplification and are classified as HER2-positive. Compared to amplifications, HER2 mutations are rare. Nevertheless, these mutations are found in ~2% of NSCLCs and may render tumors amenable to HER2-directed therapy (30). Multiple underlying mechanisms have been described for HER2-directed trastuzumab treatment resistance. For instance, expression of a truncated p95-HER2 isoform hampers binding of trastuzumab to HER2 and results in clinical trastuzumab resistance (31, 32). Alternatively, resistance can develop through increased signaling from other RTKs, including EGFR, HER3, insulin-like growth factor receptor (IGF1R), and cellular-mesenchymal to epithelial transition factor (c-MET) (33). Since trastuzumab does not prevent interaction between HER2 and other RTKs, the HER2-directed mAb pertuzumab was developed to prevent dimerization by blocking the HER2-dimerization domain (34). In light of this, the addition of pertuzumab to trastuzumab and docetaxel as first-line treatment resulted in a longer overall survival of patients with metastatic breast cancer (35). Furthermore, a trastuzumab-based antibody-drug conjugate (ADC), ado-trastuzumab emtansine (T-DM1), was developed to deliver a potent maytansinoid toxin payload to HER2-positive cells. Treatment with T-DM1 showed an overall survival benefit in patients with HER2-positive breast cancers and tumor responses were seen in patients who had developed trastuzumab resistance (36). Thus, novel treatment and combination strategies, such as the addition of pertuzumab or using ADCs, can limit or circumvent resistance to trastuzumab.
Although overlooked for a long time, HER3 received interest as a drug target when somatic mutations were discovered in breast and gastric cancers, and when a role for HER3 signaling as a resistance mechanism to HER-directed therapeutics was revealed (37). Specifically, when HER family members are targeted by TKIs, HER3 can re-activate downstream signaling, ultimately shifting signaling towards increased phosphoinositide-3 kinase (PI3K) /AKT activity and increased HER3 expression (20,21). Indeed, resistance to the EGFR/HER2-directed TKI lapatinib in HER2-positive breast cancer cell lines was the result of increased EGFR-HER3 signaling complexes induced by autocrine secretion of HER3 ligand NRG1 (Figure 1C). Notably, NRG1 expression was a negative predictor of lapatinib treatment, suggesting binding of NRG1 to EGFR-HER3 complexes as a potential cause of resistance (22). As the TK domain of HER3 is virtually inactive, drug design for HER3-targeted therapies mainly focuses on preventing dimerization using mAbs, which are currently being clinically evaluated (37). Additionally, changes in HER3 expression or activation might serve as an early readout of resistance to EGFR or HER2 therapy.
Resistance mechanisms through non-HER family receptors and downstream signaling nodes
HER family members also interact with non-HER family members (23, 38). The crosstalk between RTKs and downstream signaling nodes compose of feedback activation loops leading to intriguingly complex signaling networks. This diversity also underlies many resistance mechanisms to drugs that target single components of this signaling network and could be potential imaging targets to monitor treatment efficacy.
One dimerization partner that can drive resistance to HER-targeting drugs is c-MET, a RTK that promotes growth, metastasis, and angiogenesis (39). Binding of the ligand hepatocyte growth factor/scatter factor (HGF/SF) to c-MET leads to homodimerization, autophosphorylation, and downstream signaling through PI3K and AKT (40) making c-MET a prime suspect for alternative signaling after EGFR blockade (23, 40). Indeed, resistance to cetuximab or gefitinib in head and neck squamous cell carcinoma (HNSCC) and NSCLC cell lines involved MET amplification and subsequent heterodimerization of HER3 with c-MET (Figure 1C) (23,24). Furthermore, in preclinical studies, HGF-induced c-MET signaling resulted in resistance to gefitinib in NSCLC and lapatinib in breast cancer cell lines (19, 41). These reports signify that dual targeting of c-MET and EGFR might be necessary to prevent the emergence of resistance. Preliminary in vitro results have indeed shown synergistic effects of combined inactivation of EGFR and c-MET in HNSCC and NSCLC cell lines (23, 42, 43). Several c-MET targeting agents ranging from TKIs, antibodies against c-MET, as well as antibodies against the c-MET ligand HGF are currently in phase III clinical trials (44).
Another player in HER family signal transduction is Rous sarcoma oncogene cellular homolog (Src), a non-receptor TK that regulates cell growth, migration, and survival signaling pathways. Src interacts with EGFR and HER2 as well as with c-MET, IGF1R, platelet-derived growth factor receptor (PDGFR) and fibroblast growth factor receptor (FGFR) (45). Binding of Src to HER2 conferred resistance to trastuzumab in human tumor cell line models harboring a HER2-exon 16 deletion (Figure 1C) (46). In another study, Src activation conferred resistance to erlotinib in vitro and in vivo by inducing c-MET expression in HNSCC models, which could be rescued by genetic or pharmacological inactivation of c-MET (47) indicating that Src, at least in the selected in vitro models, is a key regulator of c-MET-mediated resistance to HER-targeted agents.
Compensatory signaling upon EGFR inhibition can also be mediated by IGF1R. Considerable overlap has been observed in the functions of IGF1R and the HER family and upregulation of the IGF1R signaling axis has been observed to compensate for the loss of HER signaling (48). In a retrospective study of 155 patients with HER2-positive breast cancers treated with trastuzumab as an adjuvant, increased expression of EGFR and IGF1R and dysregulation of the AKT pathway were observed following the failure of neoadjuvant or conventional therapy and were associated with worse treatment outcome (49). In line with these results, IGF1R activation and dimerization with HER2 was observed in a trastuzumab-resistant clone of the human breast cancer cell line SKBR3 but not its parental trastuzumab-sensitive cell line (38). Furthermore, resistance to irreversible EGFR TKIs was mediated through activation of the IGF1R pathway in PC9 NSCLC cells (48). Also, epigenetic alterations were shown to drive IGF1R engagement in a human cancer cell lines panel, causing transient resistance to gefitinib, erlotinib, cisplatin and BRAF inhibitor treatment (50).
Taken together, a theme emerges in which inactivation of key HER family members results in strong positive feedback on various other RTKs, including c-MET, IGF1R, and Src. Ultimately, this rewiring restores proliferation and survival signaling and results in treatment-resistant clones. How this positive feedback is wired at the molecular level is unclear, although it seems to converge at reinstating AKT or ERK signaling.
Also, when downstream signaling components of the HER pathway are targeted, rapid rewiring and activation of parallel pathways were observed. Inhibition of PI3K in HER2-positive cell lines resulted in activation of FOXO transcription factors and upregulation of HER3 (48), which was similar to HER2 inhibition (20). Also, PI3K inhibition in HER2-overexpressing human breast cancer xenografts resulted in acquired dependency on ERK signaling (51). Further, inhibition of AKT, the critical downstream target of PI3K, induced HER3 expression and activation of HER3, IGF1R, and the insulin receptor (IR) in human breast cancer, prostate cancer, and NSCLC cell lines (52). Likewise, treatment of breast cancer cell lines with the mechanistic target of rapamycin (mTOR) inhibitor AZD8055 resulted in induction of HER proteins and activation of HER3 specifically (53). The aforementioned resistance mechanisms underscore the plasticity of the HER family and parallel signaling networks and warrants the development of non-invasive diagnostic tools that can be applied serially to identify not only which tumors respond to anti-HER drugs but also when resistance to these agents develops.
Molecular imaging strategies
Here, we will discuss how molecular imaging strategies might be employed to improve HER family-directed treatment with a focus on marker-selective imaging agents. Besides imaging generic cancer processes such as glucose metabolism with 18F-FDG or proliferation by 18F-FLT, marker-selective imaging agents can capture a broad range of cancer hallmarks (54), which might be informative for the efficacy of HER-directed treatment.
Molecular imaging can be performed by various modalities, e.g. radionuclide, optical, optoacoustic and magnetic resonance imaging, with each modality having unique advantages as well as limitations (8). Molecular imaging with radionuclides is the most widely used technique. The main attractive features of radionuclide-based imaging are high signal sensitivity and the ability to non-invasively acquire quantitative three-dimensional information of whole body tracer distribution. For single photon emission computed tomography (SPECT) imaging, a three-dimensional image is computed from multiple two-dimensional images taken at different angles of a gamma ray-emitting radioisotope. On the other hand, when multiple detectors are used, positron emission tomography (PET) imaging can be inherently three dimensional, based on the origin of the two near-perpendicular 511 keV gamma rays emitted after positron annihilation. In contrast to SPECT, physical collimators are not necessary for PET resulting in higher sensitivity, spatial resolution, and corresponding shorter acquisition time for scans allowing more temporal resolution to study dynamic features (55).
Accurate quantification of cellular receptor levels using molecular imaging agents can be affected by - but not limited to - a variety of factors such as blood flow, vascular permeability, vascularization, lymphatic drainage, cellular internalization rate, non-specific binding, blood and interstitial pressure, metabolites, number of binding-sites, the enhanced permeability and retention effect, as well as tracer pharmacokinetics (56, 57). Additional complications in quantification, can come from external sources such as respiration movements of the subject as well as differences between scanners, settings, and reconstruction algorithms. The partial volume effect, image blurring due to the finite resolution of the scanner, and target heterogeneity within the tissues contained in the smallest resolution unit (i.e. pixels, voxels) can also affect the accuracy of quantification (57). To resolve these issues, efforts have been directed towards more accurate quantification of molecular imaging data, a subject that has been expertly reviewed by others (56, 57).
Radioisotopes for SPECT and PET imaging can be incorporated in targeting molecules in various ways, e.g. through covalent binding or chelation. Selection of the most appropriate radioisotope is based on the physical half-life of the radionuclide, which should match the biological half-life of the imaging agent to balance optimal time for tracer accumulation in lesions with sufficient signal strength, while minimizing radiation burden. For instance, carbon-11 (11C, t1/2 = 20 min, PET) and fluorine-18 (18F, t1/2 = 110 min, PET) are often used to label small molecules, with little or no alteration of their kinetic parameters. In contrast, high molecular weight biomolecules, such as antibodies, need relatively long-lived radiometals for optimal contrast, such as zirconium-89 (89Zr, t1/2 = 78.4 h, PET), indium-111 (111In, t1/2 = 67.3h, SPECT) or radiohalogen iodine-124 (124I, t1/2 = 100.3 h, PET). Fluorine-18, as well as radiometals copper-64 (64Cu. t1/2 = 12.7 h, PET), technetium-99m (99mTc, t1/2 = 6.0 h, SPECT) and galium-68 (68Ga, t1/2 = 68 min, PET) are well-suited for imaging biomolecules with short biological half-lives.
Besides radionuclide-based imaging, optical methods such as near-infrared fluorescence (NIRF) and optoacoustic imaging have received increasing attention. These techniques combine high resolution with real-time signal acquisition in the field of view. Advantages of optical methods compared to radionuclide-based imaging are the lack of radiation burden to patients, ''off the shelf'' availability of tracer molecules, and relatively low costs. Limitations of optical imaging include the difficulty of signal quantitation, limited penetration depth, and a restricted field of view. Optical methods, therefore, appear most suited for localized organ-level imaging, such as intra-operative or endoscopic imaging.
Molecular imaging capabilities are rapidly expanding and many known processes and pathways that comprise the hallmarks of cancer can be visualized using PET or SPECT tracers (54). In this context, molecular imaging can be used to non-invasively determine lesion biomarker status to facilitate proper patient selection. Labeled drugs or analogs thereof can be used to assess drug accumulation across lesions. Many HER family targeting tracers have been described in the literature. The tracers mentioned in this review highlight the most important findings within each imaging strategy, and are listed in Table 2. For a systematic overview of HER-targeted tracers, we refer to excellent reviews by others (58,59).
Overview of preclinical and clinical tracers
| Tracer | Modality | Scaffold | Study type | Target | Remarks | Ref | |
|---|---|---|---|---|---|---|---|
| Target expression | |||||||
| 64Cu-cetuximab | PET | mAb | Preclinical | EGFR | Correlation with EGFR expression xenografts | 62 | |
| 111In-cetuximab | SPECT | mAb | Preclinical | EGFR | Correlation with EGFR expression xenografts | 63 | |
| 111In-f(ab')2-cetuximab | SPECT | f(ab')2 | Preclinical | EGFR | Correlation with EGFR expression xenografts | 61 | |
| 89Zr-cetuximab | PET | mAb | Preclinical | EGFR | No correlation with EGFR expression xenografts | 64 | |
| 64Cu-cetuximab | PET | mAb | Preclinical | EGFR | No correlation with EGFR expression xenografts | 65 | |
| 89Zr-cetuximab | PET | mAb | Clinical | EGFR | Tumor uptake in metastatic colorectal patients | 67 | |
| IRDye 800CW-cetuximab | NIRF | mAb | Preclinical | EGFR | Detection of breast cancer xenograft lesions | 79 | |
| IRDye 800CW-cetuximab | NIRF | mAb | Preclinical | EGFR | Detection of implanted EGFR-positive lesions in colonoscopy of a resected human colon | 82 | |
| IRDye 800CW-cetuximab | NIRF | mAb | Clinical | EGFR | Intraoperative tumor detection in HNSCC patients | 83 | |
| IRDye 800CW-cetuximab | NIRF | mAb | Clinical | EGFR | Correlation between ex vivo fluorescent signal and EGFR density per IHC in excised HNSCC patient tumors | 84 | |
| 89Zr-imgatuzumab | PET | mAb | Preclinical | EGFR | Influence of circulating shed EGFR on tracer tumor uptake and kinetics | 66 | |
| IRDye 800CW-7D12 | NIRF | nanobody | Preclinical | EGFR | Detected EGFR overexpressing xenografts | 80 | |
| IRDye 800CW-7D12 | NIRF | nanobody | Preclinical | EGFR | Intraoperative visualization of orthotopic primary tongue tumor xenografts and cervical lymph node metastases | 81 | |
| IRDye 800CW-panitumumab | NIRF | mAb | Preclinical | EGFR | Detection of breast cancer xenograft lesions | 79 | |
| IRDye 800CW-panitumumab | NIRF | mAb | Preclinical | EGFR-wt/ EGFRvIII | Similar affinity to EGFR-wt and EGFRvIII-expressing xenografts | 75 | |
| IRDye 800CW-EGFR affibody | NIRF | affibody | Preclinical | EGFR-wt/ EGFRvIII | Similar affinity to EGFR-wt and EGFRvIII-expressing xenografts | 75 | |
| IRDye 800CW-EGF | NIRF | ligand | Preclinical | EGFR-wt/ EGFRvIII | Accumulated in EGFR-wt, but not EGFRvIII-expressing xenografts | 75 | |
| 99mTc-3C10 | SPECT | mAb | Preclinical | EGFR-wt/ EGFRvIII | Accumulated more in EGFRvIII than in EGFR-wt xenografts | 77 | |
| IRDye 680RD-biotin-4G1 | NIRF | mAb | Preclinical | EGFR-wt/ EGFRvIII | Accumulated more in EGFRvIII than in EGFR-wt xenografts | 78 | |
| 124I-IMP-R4-ch806 | PET | mAb | Preclinical | EGFRvIII | Accumulated in EGFRvIII-transfected U87MG xenografts | 68 | |
| 11C-erlotinib | PET | TKI | Preclinical | EGFR-wt/ mutEGFR | Accumulation more in exon 19 and 21 mutated than in EGFR-T790M and EGFR-wt xenografts | 68-70 | |
| 11C-erlotinib | PET | TKI | Clinical | mutEGFR | Volume of distribution higher in NSCLC patients with EGFR exon 19 deletion than in lesions of patients without activating mutations | 71 | |
| 11C-erlotinib | PET | TKI | Clinical | mutEGFR | 3 out of 4 patients with 11C-erlotinib PET positive lesions responded to erlotinib, while best response in 11C-erlotinib PET negative lesions was stable disease in 2 out of 9 patients | 72 | |
| 11C-erlotinib | PET | TKI | Clinical | mutEGFR | Case report of high 11C-erlotinib uptake in brain metastases of EGFR exon 19 mutated NSCLC patient which responded to erlotinib | 73 | |
| 18F-afatinib | PET | TKI | Preclinical | EGFR/HER2 | Higher accumulation in EGFR-wt and EGFR-exon 19 deletion, compared to EGFR-T790M xenografts | 74 | |
| 89Zr-trastuzumab | PET | mAb | Preclinical | HER2 | Specific uptake in HER2-positive xenografts | 86, 88 | |
| 89Zr-trastuzumab | PET | mAb | Clinical | HER2 | Detection of lesions in HER2-positive breast cancer patients | 94 | |
| 111In-trastuzumab | SPECT | mAb | Clinical | HER2 | Detection of lesions in HER2-positive breast cancer patients | 93 | |
| 89Zr-pertuzumab | PET | mAb | Preclinical | HER2 | Specific uptake in HER2-positive xenografts | 79 | |
| 111In-ABY-002 | SPECT | affibody | Clinical | HER2 | Detection of lesions in HER2-positive breast cancer patients | 90 | |
| 68Ga-ABY-002 | PET | affibody | Clinical | HER2 | Detection of lesions in HER2-positive breast cancer patients | 90 | |
| 68Ga-2Rs15d | PET | nanobody | Clinical | HER2 | Detection of lesions in HER2-positive breast cancer patients | 91 | |
| 111In-Fab-PEG24-HRG | PET | Fab/HRG construct | Preclinical | HER2/ HER3 | HER3 and HER2-mediated uptake in xenografts | 100 | |
| 89Zr-lumretuzumab | PET | mAb | Preclinical | HER3 | HER3-specific uptake in xenografts | 95 | |
| 89Zr-lumretuzumab | PET | mAb | Clinical | HER3 | Tumor uptake in patients with solid tumors, as well as tumor uptake before and after administrating therapeutic doses cold lumretuzumab | 102 | |
| 64Cu-DOTA-HER3 F(ab')2 | PET | f(ab')2 | Preclinical | HER3 | HER3-specific uptake in xenografts | 96 | |
| 68Ga-HEHEHE-Z08698 | PET | affibody | Preclinical | HER3 | HER3-specific uptake in xenografts | 97 | |
| 111In-HEHEHE-Z08698 | SPECT | affibody | Preclinical | HER3 | HER3-specific uptake in xenografts | 98 | |
| 99mTc-HEHEHE-Z08699 | SPECT | affibody | Preclinical | HER3 | HER3-specific uptake in xenografts | 99 | |
| 111In-HEHEHE-Z08699 | SPECT | affibody | Preclinical | HER3 | HER3-specific uptake in xenografts | 97 | |
| 64Cu-patritumab | PET | mAb | Clinical | HER3 | Tumor uptake in patients with solid tumors | 101 | |
| Accumulation | |||||||
| IRDye 700DX-cetuximab | NIRF | mAb | Preclinical | EGFR | Photoimmunotherapy and detection of lesions | 103 | |
| 89Zr-cetuximab | PET | mAb | Preclinical | EGFR | Prediction of accumulation for 88Y- and 177Lu-labeled cetuximab | 104 | |
| 64Cu-MM-302 | PET | liposome | Preclinical | HER2 | Predict deposition, kinetics and efficacy of the parental doxorubicin-loaded liposome in xenografted mice and primates | 105, 106 | |
| 89Zr-trastuzumab | PET | mAb | Clinical | HER2 | 89Zr-trastuzumab scans to determine intra/interpatient HER2 heterogeneity and (non-)responders to T-DM1 therapy | 107 | |
| 89Zr-trastuzumab | PET | mAb | Preclinical | HER2 | Increased uptake of 89Zr-trastuzumab after N-acetylcysteine treatment of MUC4-expressing xenografts | 111 | |
| 89Zr-pertuzumab | PET | mAb | Preclinical | HER2 | Enhanced residualization of 89Zr-pertuzumab with concurrent trastuzumab treatment in xenografted mice | 87 | |
| 89Zr-trastuzumab/ 89Zr-Bevacizumab / 89Zr-IgG | PET | mAb | Preclinical | HER2/ VEGF/ generic | Anti-angiogenic agent bevacizumab decreased general antibody tracer uptake in xenografts | 113 | |
| 111In-trastuzumab/ 125I-trastuzumab/111In-IgG/ 125I-IgG | SPECT | mAb | Preclinical | HER2/ generic | Anti-angiogenic agent B20-4.1 decreased general antibody tracer uptake in xenografts | 112 | |
| 89Zr-MMOT0530A | PET | mAb | Preclinical | mesothelin | Tumor accumulation of naked antibody version of ADC DMOT4039A | 108 | |
| 89Zr-MMOT0530A | PET | mAb | Clinical | mesothelin | 89Zr-MMOT0530A uptake as predictor for clinical response to the corresponding ADC DMOT4039A | 109 | |
| Treatment effects | |||||||
| 64Cu-DOTA Cetuximab F(ab')2 | PET | f(ab')2 | Preclinical | EGFR | EGFR upregulation after PI3K inhibitor GDC-0941 and AKT inhibitor GDC-0068 treatment | 119 | |
| 89Zr-MEHD7945A | PET | mAb | Preclinical | EGFR/ HER3 | EGFR and HER3 upregulation after AKT inhibition by GDC-0068 | 126 | |
| 89Zr-trastuzumab | PET | mAb | Preclinical | HER2 | Downregulation of HER2 expression through afatinib treatment | 120 | |
| 89Zr-trastuzumab | PET | mAb | Preclinical | HER2 | HER2 downregulation after HSP90 inhibition with NVP-AUY-922 | 122 | |
| 89Zr-trastuzumab | PET | mAb | Preclinical | HER2 | HER2 downregulation after HSP90 inhibition with PU-H71 | 124 | |
| 89Zr-trastuzumab | PET | mAb | Clinical | HER2 | HER2 downregulation after HSP90 inhibition with NVP-AUY922 in HER2-positive breast cancer patients | 125 | |
| 89Zr-trastuzumab F(ab')2 | PET | f(ab')2 | Preclinical | HER2 | Upregulation and stabilization of HER2 at the plasma membrane after lapatinib treatment | 121 | |
| 89Zr-trastuzumab F(ab')2 | PET | f(ab')2 | Preclinical | HER2 | HER2 downregulation after HSP90 inhibition with 17AAG | 121 | |
| AlexaFluor 680-ZHer2:342 | NIRF | affibody | Preclinical | HER2 | HER2 downregulation after HSP90 inhibition with 17-DMAG | 123 | |
| 64Cu-DOTA-HER3 F(ab')2 | PET | f(ab')2 | Preclinical | HER3 | HER3 upregulation after AKT inhibition by GDC-0068 | 119 | |
| 89Zr-mAb391 | PET | mAb | Preclinical | IG1R | IGF1R downregulation after HSP90 inhibition with NVP-AUY-922 | 115 | |
| 89Zr-bevacizumab | PET | mAb | Preclinical | VEGF | VEGF-A downregulation after heat shock protein-90 inhibition NVP-AUY922 | 114, 115 | |
| 89Zr-bevacizumab | PET | mAb | Preclinical | VEGF | Downregulation of VEGF-A through everolimus treatment | 116 | |
| 89Zr-bevacizumab | PET | mAb | Clinical | VEGF | Downregulation of VEGF-A through everolimus treatment | 117 | |
| 89Zr-ranibizumab | PET | f(ab')2 | Preclinical | VEGF | Sunitinib treatment-induced changes in VEGF-A tumor levels | 118 | |
| Intracellular processes | |||||||
| 111In-anti-p27kip1-TAT | SPECT | mAb | Preclinical | p27kip1 | Upregulation of p27kip1 after trastuzumab treatment | 128 | |
| 111In-anti-γH2AX-TAT | SPECT | mAb | Preclinical | phospho- H2AX | Detection of DNA breaks induced by chemo and radiotherapy | 129 | |
| 111In-anti-γH2AX-TAT | SPECT | mAb | Preclinical | phospho- H2AX | Detection of DNA breaks induced during tumorigenesis of breast cancer in BALB/C Neu-T mice | 131 | |
| 89Zr-anti-γH2AX-TAT | PET | mAb | Preclinical | phospho- H2AX | Detection of DNA breaks induced by chemo and radiotherapy | 130 | |
Target expression imaging
Molecular imaging may be used in the clinical setting to measure HER family expression status in multiple tumor lesions simultaneously and to visualize the inter-tumor heterogeneity. Measuring multiple lesions at once might be relevant as single biopsies or small tumor fractions are not an adequate representation of all lesions (60). Whether molecular imaging can be used to better predict response to EGFR-targeted agents is unresolved. However, several animal studies showed a correlation between EGFR expression of human cancer xenografts and uptake of 64Cu-cetuximab, 111In-cetuximab and 111In-f(ab')2-cetuximab (61-63). Other preclinical studies, however, found discordance between xenograft EGFR expression and 89Zr-cetuximab or 64Cu-cetuximab accumulation. In these studies, EGFR overexpression did not necessarily result in corresponding high tumor tracer accumulation, suggesting that factors other than EGFR expression, such as perfusion and vascular permeability might influence cetuximab-based tracer tumor uptake (64, 65). For instance, in a preclinical study circulating shed EGFR ectodomain (sEGFR) influenced the kinetics and tumor targeting of the EGFR antibody tracer 89Zr-imgatuzumab (66). In a patient study, six out of 10 metastatic CRC patients showed 89Zr-cetuximab tumor uptake when administered with a therapeutic dose of cetuximab. Four of these six patients had clinical benefit of cetuximab therapy, while a progressive disease was observed in three out of four patients without 89Zr-cetuximab uptake (67). Although promising, larger cohorts should be screened to establish the value of 89Zr-cetuximab for prediction of cetuximab efficacy in metastatic CRC colorectal cancer patients (NCT02117466).
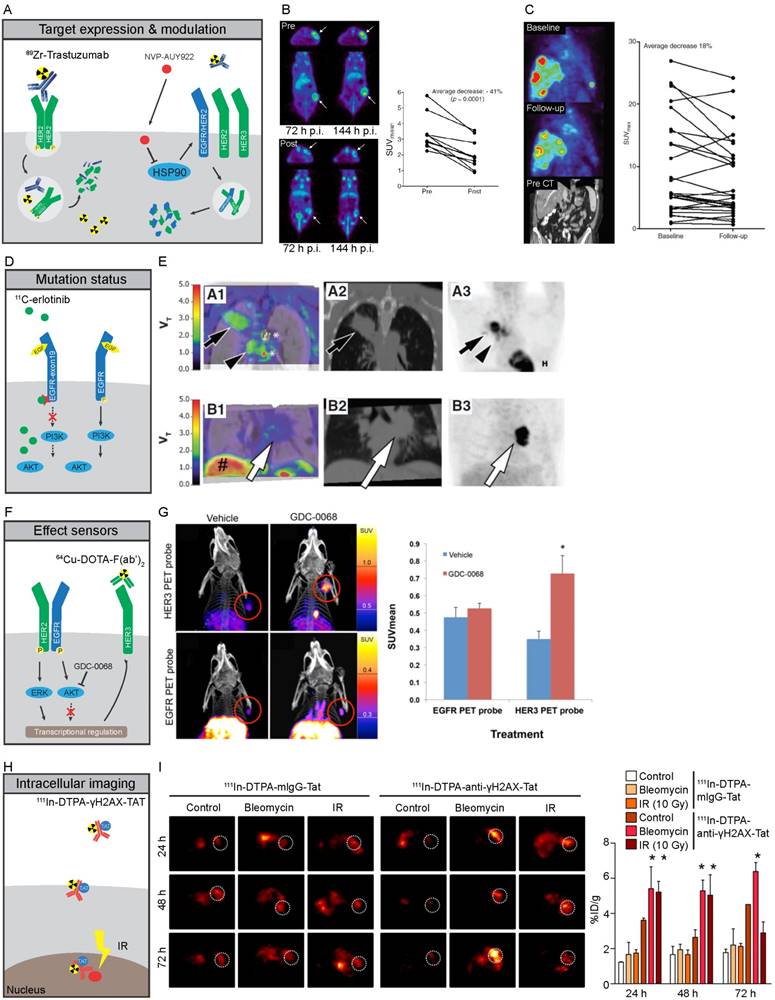
The EGFR TKIs erlotinib and gefitinib display higher affinity for oncogenic EGFR mutants. This feature can be exploited to selectively image mutant EGFR variants and provides an attractive tool for assessing heterogeneity in EGFR mutation status. In several preclinical studies, there was a higher accumulation of 11C-erlotinib in NSCLC and glioma xenografts containing activating EGFR mutations in exon 19 and 21 when compared to xenografts of erlotinib-resistant EGFR-T790M, EGFR-wt, or EGFR with activating mutations in its extracellular domain (68-70). The 11C-erlotinib volume of distribution was higher in patients with NSCLC lesions with EGFR activating exon 19 deletion than in lesions from patients without activating mutations (Figure 2D, E) (71). In another series of 13 NSCLC patients, three out of four patients with 11C-erlotinib PET positive lesions responded to erlotinib treatment while the best response seen in in two out of nine patients with 11C-erlotinib PET negative lesions was a stable disease (72). A case report showed high 11C-erlotinib uptake in brain metastases of a NSCLC patient with an exon 19 mutation in the primary tumor with response to erlotinib in both primary tumor and brain metastases, underscoring the potential value of mutant-specific imaging of EGFR status (73). Imaging with the pan-HER TKI afatinib can also be used to visualize receptor mutation status. Analysis of 18F-afatinib showed higher accumulation in A549 EGFR-wt and HCC827 EGFR-exon 19 deletion compared to H1975 EGFR-T790M human NSCLC cell line xenografts. This reflects the affinity of afatinib to EGFR with activating mutations (74).
Molecular imaging strategies of HER family proteins A-C) Expression of cell membrane bound HER2 can be imaged by specific binding of 89Zr-trastuzumab to HER2, leading to residualizing of 89Zr in tumor cells due to internalization and subsequent degradation of the antibody-receptor complex. HSP90 inhibition by NVP-AUY922 leads to destabilization and degradation of HER family proteins at the plasma membrane, leading to lower antigen availability and reduced tracer uptake. B) PET images of mice scanned with 89Zr-trastuzumab before (Top) and after (Bottom) treatment with NVP-AUY922, quantified for 144 hours (122). C) 89Zr-trastuzumab PET imaging of a metastatic breast cancer patient before (Top) and after 3 weeks of NVP-AUY922 treatment (Middle), with CT-scan prior to treatment shown in Bottom panel. Quantification of all lesions shows a heterogeneous response with a total average decrease in 89Zr-trastuzumab uptake after 3 weeks of NYP-AUY922 treatment (125). D,E) Higher accumulation of 11C-erlotinib occurs in tumors with specific activating mutations in EGFR due to its higher affinity to the mutated TK compared to EGFR-wt. NSCLC tumors with exon-19 deletion (series A) showed higher uptake compared to EGFR-wt tumors (series B). A1-B1: CT fused-parametric 11C-erlotinib Vt; A2-B: CT; A3-B3: 18F-FDG (71) F,G) Imaging of HER3 levels using 64Cu-DOTA-F(ab')2 can be utilized as effect sensor of AKT inhibitors, as GDC-0068 specifically induces expression of HER3, but not EGFR, as feedback mechanism of AKT inhibition in mouse xenografts after 72h of treatment (119). H,I) Imaging of intracellular processes can be facilitated by TAT-modified antibodies. 111In-DTPA-anti-yH2AX-Tat antibodies visualized the formation of DNA damage foci marked by γ-H2AX treatment upon treatment with irradiation of DNA damaging agent bleomycin in mouse xenografts (129).
Analogously, several preclinical imaging studies have been performed to visualize EGFRvIII status. Specifically, IRDye 800CW (800CW)-panitumumab and an 800CW-EGFR affibody bound to EGFR-wt and EGFRvIII with similar affinity in a rat glioma model. In contrast, 800CW-labeled EGFR ligand EGF identified EGFR-wt but not EGFRvIII-expressing lesions, reflecting the compromised EGFRvIII ligand-binding pocket (75). In another study, the 124I-IMP-R4-labeled EGFRvIII-specific antibody ch806 was tested in human glioblastoma EGFRvIII-transfected U87MG xenografts expressing EGFRvIII; no preferential imaging of EGFRvIII could be established since only EGFRvIII cell lines were used (76). Another EGFRvIII-specific antibody, 99mTc-labeled 3C10, displayed over ten-fold higher accumulation in EGFRvIII-transfected U87MG human glioblastoma xenografts compared with the parental U87MG (77). Furthermore, the IRDye 680RD-labeled EGFRvIII antibody biotin-4G1 accumulated more in EGFRvIII-expressing F98npEGFRvIII than in EGFR-wt F98npEGFR rat glioblastoma xenografts (78). Overall, evidence exists that EGFRvIII might be distinguished from EGFR-wt using EGFRvIII tracers. However, more rigorous preclinical and clinical data and relevance are required to move this field forward.
Research on fluorescently labeled proteins recognizing EGFR mainly focused on their use as an add-on 'red flag' technique for intraoperative and endoscopic procedures. Both 800CW-cetuximab and 800CW-panitumumab were tested for detection of breast cancer xenograft lesions (79). Also, EGFR nanobody 800CW-7D12 could detect EGFR-overexpressing A431 human squamous cell carcinoma xenografts (80). In a preclinical intraoperative study, 800CW-7D12 could visualize orthotopic primary tongue tumor xenografts and resulting cervical lymph node metastases which were otherwise not detectable with the naked eye (81). Also, 800CW-cetuximab was successfully used to detect EGFR-positive lesions in a preclinical simulated colonoscopy of a resected human colon with human EGFR-expressing colon cancer HCT116luc xenografts stitched into the colon wall (82). 800CW-cetuximab was likewise tested in HNSCC patients during surgery using wide-field NIR imaging. In these patients, tumor-to-background ratios of 4.3 and 5.2 were observed at 3 to 4 days after infusion of 25 and 62.5 mg/m2 doses of 800CW-cetuximab respectively (83). There was a correlation between the fluorescent signal of 800CW-cetuximab and EGFR density in excised HNSCC tumors as determined by IHC (84). To establish the clinical value of EGFR-targeted tracers, multiple clinical studies with 800CW-cetuximab and 800CW-panitumumab for intraoperative procedures and 89Zr-cetuximab, 11C-erlotinib, and 89Zr-panitumumab for EGFR PET imaging are currently pursued (Table 1).
Overview of ongoing clinical trials with molecular imaging of HER family members and related targets
| Target expression imaging | |
| EGFR | ClinicalTrials.gov identifiers |
| 89Zr-cetuximab | NCT01691391, NCT02117466, NCT00691548 |
| 89Zr-panitumumab | NCT02192541, NCT00326495 |
| 800CW-cetuximab | NCT01987375, NCT02736578 |
| 800CW-panitumumab | NCT02415881 |
| HER2 | |
| 89Zr-trastuzumab | NCT01420146, NCT02286843, NCT01832051, NCT02065609, NCT01957332, NCT02023996, NCT01565200 |
| 111In-pertuzumab | NCT01805908 |
| 68Ga-ABY-025 | NCT02095210, NCT01858116 |
| HER3 | |
| 89Zr-RO5479599 | NCT01482377 |
| 89Zr-GSK2849330 | NCT02345174 |
| VEGF-A | |
| 89Zr-bevacizumab | NCT01894451 |
| 800CW-bevacizumab | NCT02113202, NCT01972373, NCT02129933 NCT01508572, NCT02583568, NCT02743975 |
| Drug accumulation imaging | |
| EGFR | |
| 700DX-cetuximab (RM-1929) | NCT02422979 |
| HER2 | |
| 89Zr-trastuzumab | NCT01565200 |
| 64Cu-trastuzumab | NCT01939275 |
| 64Cu-MM-302 | NCT01304797 |
| Mutant specific imaging | |
| EGFR | |
| 11C-erlotinib | NCT02111889 |
HER2 overexpression in breast cancer is associated with worse prognosis, if not treated with HER2-directed therapy (85). HER2 has therefore been extensively studied as an imaging target to select patients for HER2-directed therapy (Figure 2A). 89Zr-trastuzumab as well as 89Zr-pertuzumab showed specific uptake in HER2-positive xenografts in mice (86-88) while 111In- and 89Zr-trastuzumab, 111In- and 68Ga-labeled HER2 affibodies and a 68Ga-HER2-nanobody have been applied in patients diagnosed with HER2-positive breast cancer (89-94). 64Cu- and 89Zr-trastuzumab and 68Ga-ABY-025 PET are currently being tested for their value in identifying HER2-positive lesions and heterogeneity in breast and gastric cancer patients (Table 1).
As discussed above, HER3 has been implicated in many escape mechanisms from HER family-targeted therapies. Therefore, early identification of changes in HER3 expression might serve to identify patients at risk of HER3-mediated treatment resistance and possibly for selection of patients eligible for HER3-targeted treatment. HER3 expression levels have been successfully imaged in vivo with the antibody 89Zr-lumretuzumab (95) and 64Cu-DOTA-HER3 F(ab')2 (96), as well as 99mTc-, 111In- and 68Ga-labeled HEHEHE-Z08698 and HEHEHE-Z08699 affibodies (97-99) while bispecific HER2/HER3 tracer 111In-DTPA-Fab-PEG24-HRG, based upon heregulin and a trastuzumab Fab, showed HER3 and HER2-mediated uptake in SK-OV-3, MDA-MB-468 and BT474 xenografts (100). HER3 imaging has been studied clinically with 64Cu-patritumab, revealing tumor uptake in cancer patients, as well as high liver uptake which could be saturated with pre-administration of 9 mg/kg cold patritumab (101). In imaging studies of patients, 89Zr-lumretuzumab showed a decrease in tracer tumor uptake after administration of 400, 800 and 1600 mg flat doses of unlabeled lumretuzumab when compared to a pre-dosing 89Zr-lumretuzumab scan with a 100 mg protein dose (102). Another HER3 antibody tracer, 89Zr-GSK2849330, is currently being studied in the clinic (Table 1).
Imaging of drug accumulation in tumors
Several imaging probes do internalize after binding to their targets. Radiometals 64Cu, 68Ga, 89Zr, and 111In have residualizing properties, because these highly charged isotopes will remain trapped in cells after tracer internalization and subsequent catabolization resulting in accumulation of signal over time in antigen-expressing tissues. Radiohalogens such as 18F and iodine isotopes, and fluorescent dyes, on the other hand, are released from the cell after catabolization of the imaging probe. Residualizing probes will therefore roughly reflect the cumulative tracer exposure, while tracers using non-internalizing or non-residualizing isotopes approximate antigen density and binding capacity of the tracer over time.
An example of a non-residualizing approach is the antibody-photosensitizer conjugate IRDye 700DX (700DX)-cetuximab, which was effective in inhibiting tumor growth and could simultaneously image human triple negative breast cancer xenografts (103). 700DX-cetuximab is currently being evaluated as dual imaging and treatment (theranostic) modality in patients with recurrent head and neck cancer (Table 1). Use of a fluorescent approach to study drug accumulation might be feasible for lesions within the penetration depth of signal as well as during surgery or in endoscopic procedures. Accumulation of residualizing radioactive tracers in lesions, on the other hand, could be used as a proxy for antigen-specific delivery of the toxic payloads of ADCs and radio-immunotherapeutic agents. 89Zr-cetuximab was able to predict the accumulation of EGFR-directed radio-immunotherapeutics 88Y- and 177Lu-labeled cetuximab in A431 xenografts (104). Furthermore, a 64Cu-labeled variant of MM-302, a HER2-targeting liposome containing doxorubicin, was successfully used to predict deposition, kinetics, and efficacy of the parental liposome in xenografts (105, 106). An ongoing clinical trial assesses whether deposition of 64Cu-MM-302 can predict the outcome of the doxorubicin-loaded parent liposome therapy in advanced breast cancer patients (Table 1). A similar approach was already used in 56 breast cancer patients receiving 89Zr-trastuzumab PET scans prior to T-DM1 therapy to determine intra/interpatient HER2 heterogeneity and to identify non-responding patients. In this study, 28 out of 39 89Zr-trastuzumab PET-positive patients responded to T-DM1 therapy, while 14 out of 16 of 89Zr-trastuzumab PET-negative patients had a stable or progressive disease (107). These results indicated that 89Zr-trastuzumab might be used to identify patients who benefit from T-DM1 therapy. In another study, 89Zr-labeled MMOT0530A, the naked antibody component of the mesothelin-ADC DMOT4039A, accumulated preferentially in human pancreatic cancer xenografts (108). 89Zr-MMOT0530A was further tested in 11 patients with ovarian or pancreatic cancer, revealing a large degree of heterogeneity of lesion tracer uptake, while PET uptake 4 days post injection correlated with IHC staining for mesothelin on a per patient basis. However, the small patient sample precluded analyses of correlation between lesion 89Zr-MMOT0530A uptake and clinical response to the corresponding ADC DMOT4039A (109).
Important in this context, residualization of tracers can be modulated by therapeutic interventions. For instance, multiple antibodies targeting the same antigen could lead to enhanced residualization, as was shown for 89Zr-pertuzumab and concurrent trastuzumab administration in HER2-positive xenografted mice (110). Decreased steric hindrance of HER2 after administration of mucolytic agent N-acetylcysteine increased the uptake of 89Zr-trastuzumab in MUC4-expressing JIMT1 human breast cancer model (111). Interestingly, treatment with anti-angiogenic agents could affect uptake and accumulation of tracer through modulation of vascularization and permeability for macromolecular therapeutics such as antibodies (112, 113). Specifically, uptake of either 89Zr-labeled trastuzumab, bevacizumab, or IgG control antibody in xenografts was decreased in animals treated with the vascular endothelial growth factor A (VEGF-A) antibody bevacizumab due to vascular normalization (112,113). We envision that molecular imaging strategies could be employed for rationally designing drug combinations to increase deposition of drugs in tumors and possibly increase efficacy, for instance of ADCs. Importantly, such strategies can also instruct which treatment combinations should be avoided.
Imaging treatment effects
As therapies often elicit changes in expression, membrane localization and dynamics of proteins, such changes could potentially be used as 'effect sensors' to monitor treatment response (Figure 2F). Assessment of functional treatment effects has been performed by measuring cell membrane proteins and ligands for which expression is known to be modulated upon successful target engagement. As an example, the VEGF receptor (VEGFR) ligand VEGF-A was potently down-regulated after heat shock protein-90 (HSP90) inhibition and consequently led to a decreased uptake of 89Zr-bevacizumab in breast and ovarian cancer xenografts (114,115). Downregulation of VEGF-A can also be the result of mTOR inhibition by mTOR inhibitors such as everolimus and could be visualized using 89Zr-bevacizumab in mice and humans (116, 117). Also, treatment with VEGFR1-3-targeting TKI, sunitinib, a TKI targeting VEGFR1-3 led to changes in VEGF-A tumor levels that could be effectively assessed by bevacizumab F(ab')2-fragment 89Zr-ranibizumab in ovarian and colon cancer xenografts (118).
Besides measuring ligands, analysis of RTK expression has been used as an effect sensor for successful target engagement. For instance, PI3K inhibitor GDC-0941 and AKT inhibitor GDC-0068 led to upregulation of EGFR in HCC70 human breast cancer xenograft which could be visualized with a 64Cu-DOTA EGFR F(ab')2 fragment derived from cetuximab (119). Afatinib treatment, on the other hand, lowered HER2 expression in a human gastric cancer N87 xenograft model in mice, which was visualized using 89Zr-trastuzumab (120). Lapatinib, on the other hand, interfered with receptor dynamics by upregulating and stabilizing HER2 at the plasma membrane, ultimately leading to lower 89Zr-trastuzumab-F(ab')2 tracer uptake in a breast cancer model (121). HSP90 inhibition also downregulated RTKs such as IGF1R and HER2, which was effectively discriminated by 89Zr-mAb391 and 89Zr-trastuzumab by PET, respectively, as well as by AlexaFluor680-ZHer2:342 affibodies for HER2 with near-infrared fluorescence in breast cancer xenografts (Figure 2B) (115,121-124). This latter approach was clinically validated using HER2 as an effect sensor for treatment with HSP90 inhibitor NVP-AUY922 in HER2-positive breast cancer patients using 89Zr-trastuzumab PET and correlated with a response by computed tomography (CT) (Figure 2C) (125). Also, inhibition of AKT by GDC-0068 led to an upregulation of HER3 in patient-derived triple negative breast cancer xenografts, which in turn increased dual EGFR/HER3 antibody 89Zr-MEHD7945A tumor uptake (126). Selective imaging of HER3 upregulation after GDC-0068 treatment in MDA-MB-468 human breast cancer xenografts was demonstrated using 64Cu-DOTA-HER3 F(ab')2 (Figure 2F,G) (119).
These are examples of HER family therapy effects that can be visualized and might be applied to adjust therapy in a timely fashion. However, only a few effects sensors are currently available to image treatment effects. This is partly because the effect sensor has to be excreted or expressed extracellularly to have accessibility to the target. This is due to the difficulty of high molecular weight imaging probes like antibodies, to cross the plasma membrane, and if required, the nuclear membrane.
Imaging Intracellular processes in vivo
Visualization of intracellular targets has been largely restricted to small molecule-based imaging tracers. In general, intracellular processes for which imaging is currently feasible are generic processes such as tumor glucose metabolism by 18F-FDG and cellular proliferation using 18F-FLT and 11C-thymidine incorporation. One strategy to overcome the hurdle posed by the inability of antibodies to cross membranes, is modifying them with the HIV1-derived cell-penetrating transactivator of transcription (TAT) peptide, to ensure nuclear deposition (Figure 2H) (127). Using this technique, 111In-anti-p27kip1-TAT antibody SPECT imaging was able to visualize upregulation of the nuclear localized cyclin-dependent kinase inhibitor p27kip1 after trastuzumab treatment of mice bearing human breast cancer xenografts (128). More recently, this approach has also been applied for detection of DNA damage using a phospho-specific H2AX antibody in human breast cancer xenografts and during tumorigenesis in a transgenic BALB-neuT murine breast cancer model, 111In- and 89Zr-labeled TAT-modified phospho-H2AX antibody detected DNA breaks induced by chemo and radiotherapy (Figure 2H,I) (129-131).
Many targeted therapies aim to inactivate intracellular proteins, which currently are not accessible for high molecular weight imaging probes. Approaches similar to imaging with the TAT-modified phospho-H2AX antibody could be envisioned, where changes in the activity of intracellular signaling pathways, including altered activation status of AKT or MAPK, could be visualized. Imaging these targets might reveal whether the intended therapeutic inactivation of a specific intracellular target is achieved and sustained or whether signaling is reactivated or rewired. If the plasma membrane no longer posed a barrier in such strategies, the number of possible targets for high molecular weight probes would greatly increase. In such a scenario, imaging studies of prognostic or predictive markers could focus on the most relevant targets, and would no longer be restricted to proxies at the plasma membrane.
Radiomics
The emerging field of radiomics combines imaging data with 'omics' methodology. In radiomic analyses, quantitative features are mined from large data sets of (mainly routine) medical tomographic imaging data such as PET, CT and MRI scans using bioinformatics. Examples of features comprise, amongst others, descriptors for shape, size, volume and texture in space and over time, which in turn might reflect underlying pathophysiology. These features are combined with clinical outcome data and other patient characteristics to develop predictive models for genetic and molecular characteristics, prognosis, as well as treatment response (132, 133).
Tentative retrospective radiomics studies for prediction of HER tumor status have yielded encouraging results. A set of 11 radiomic features extracted from CT images of patients with lung adenocarcinoma was predictive for EGFR mutation status, with an area under the curve (AUC) of the receiver operating characteristic curve (ROC) of 0.667 for radiomic data alone, and 0.709 when combined with clinical parameters (134). In another study, a decision tree based upon several CT textural features could differentiate KRAS mutants from EGFR-wt NSCLC patients with sensitivity, specificity, and accuracy of 96.3%, 81.0% and 89.6%, respectively (135). Radiomic features extracted from 18F-FDG PET in NSCLC patients could discriminate mutant EGFR from EGFR-wt as well as mutant EGFR from KRAS mutants but could make no distinction between KRAS mutant and EGFR-wt (136). To our knowledge, no radiomics studies with HER-targeted molecular imaging probes have been reported. However, future radiomic analysis of large databases of PET data from HER-targeted tracers, combined with clinical data, might help identify features for prediction of underlying patient phenotype and outcome.
Platform integration to guide selection of novel tracers
Both the arsenal of available tracers as well as the technology for molecular imaging are advancing rapidly. However, molecular imaging can benefit from other disciplines for the identification of novel discriminating factors. In this regard, large data sets of biological information can increasingly be utilized for the identification of the most interesting and informative targets for imaging. Clinical and pre-clinical studies progressively include 'omics' methodologies encompassing genomic, transcriptomic, and proteomic analyses. Combined with clinical outcome metrics these data yield an 'integrative omics' approach. This offers great opportunities for extensive data mining to discover biomarkers which associate with tumor characteristics, treatment responses, and survival outcomes. These biomarker panels are not only useful to define new molecular-based tumor markers for molecular testing, but also provide a great resource to identify relevant molecular imaging targets, indicative of treatment effectiveness or resistance (137-139).
Clinical classification using integrative omics
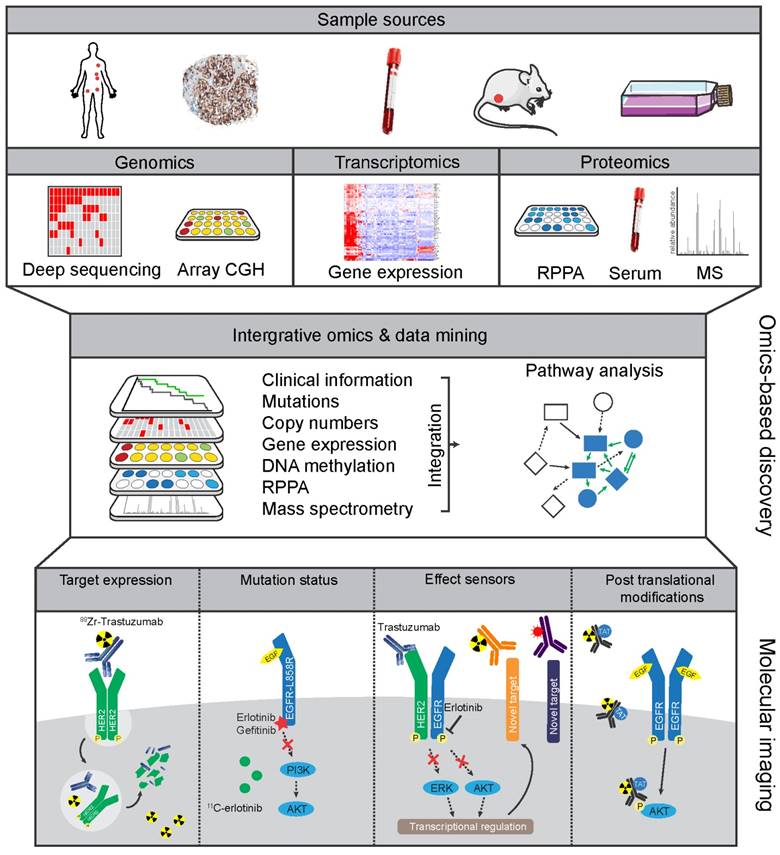
Integrative omics can be applied to uncover key pathways that are altered in cancer by utilizing information from the 'cancer genome' with an associated 'cancer proteome' (140). Often-used platforms include combinations of genomics (i.e. DNA sequencing for mutations, copy number aberrations (CNAs), and methylation of genes), transcriptomics (microarray RNA-based or RNAseq-based expression analysis), and proteomic analysis (proteins abundance and post-translational modifications (PTMs) using mass spectrometry (MS) or multiplexed reverse-phase protein arrays (RPPA)) (Figure 3) (141). Because integrative omics approaches use unbiased selection methods, they are of potential interest for classification of patient groups and identification of biomarkers. Large-scale initiatives have attempted to diversify on histological cancer subtypes by identifying common features within the high information density of multiple platforms. For example, in-depth genomic analysis of 2,000 breast cancers identified 10 genetic classifications of breast cancer with distinct survival outcomes, although their clinical relevancy will need to be validated (142). Reassuringly, in a study of over 6,000 breast cancer patients, expression profiling using a panel of 70 genes (MammaPrint) showed that adjuvant chemotherapy could be safely withheld in the group of patients with genetically low-risk hormonal breast cancers (143). Further in-depth analysis of gene expression showed how immune cell-specific gene patterns could be used to define the fraction of infiltrating immune cells within 7,270 breast cancer profiles. The data also identified associations between different tumor compositions and therapy response as well as the outcome for known breast cancer subtypes (144). Besides diversifying on single cancer types, integrative omics analysis can identify molecular patterns across cancer types. The Cancer Genome Atlas (TCGA) consortium, for instance, has compiled transcription and genomic profiling of more than 500 tumor samples each for 11 cancer types (145). Meta-analysis on all combined TCGA-data sets uncovered new insights into shared features and common oncogenic drivers across tumor types and was used to classify tumors as being either largely driven by mutations or chromosomal aberrations (146). The potential of integrative omics to yield new imaging targets was indicated by an explorative study. Combined analyses of microarray database Oncomine and Gene Ontology identified not only known imaging targets (e.g. HER2 in breast cancer) but also potential imaging targets to differentiate between normal and cancer tissues in six different cancer types including MUC1 in ovarian cancer (138). The studies mentioned above confirmed previously established profiles, and more importantly, uncovered sub-classifications with distinct biological features, disease characteristics, and prognosis.
Omics-based strategies to facilitate discovery of novel molecular imaging targets Tissue or serum samples collected from patients, or from other in vivo and in vitro sources, can be analyzed by genomic, transcriptomic, and proteomic discovery platforms. The resulting profiles can then be combined by integrative omics approaches to develop molecular-based tumor classifications and discover potential informative biomarkers. From this integrative approach new protein targets or mutations could be discovered that distinguish tumor from benign tissue. Similarly, analyzing pre- and post-treatment profiles could potentially lead to discovery of effect sensors that signify response to treatment or emergence of resistance pathways.
The studies above mainly used genomic and transcriptomic analyses, whereas technological advances have significantly improved the sensitivity and resolution of high-throughput proteomics (147). Genomic and proteomic integration was recently applied in a large-scale analysis of TCGA colorectal cancer data (148). Five unique protein signatures were identified, which confirmed established genomic signatures and revealed clinically relevant cancer sub-populations (148). A similar approach was employed for the breast cancer TCGA cohort that also included phospho-proteomic analysis linking genetic alterations to changes in phosphorylated kinases (149). To a certain degree, protein expression is expected to resemble gene transcription levels, especially in the case of CNAs, resulting in gene amplifications or deletions (150). However, the proteogenomic analysis of TCGA data showed very often protein levels did not correlate well with mRNA levels or CNAs, underscoring the need for proteomic data to validate and further improve genetics-based classifications. This notion is particularly important for genomics-based selection of biomarkers intended for use in tissue samples or imaging. Taken together, omics studies have shown that (epi)genetic alterations give rise to a wide range of new molecular-based cancer classifications and large-scale genomic and proteomic analyses can support their identification.
Many biomarkers are used for patient stratification before treatment, however, they are not necessarily suitable for patient follow-up during and after treatment. In contrast to molecular imaging that allows for multiple, non-invasive whole body scans over time, genomic biomarkers are limited by the number of invasive re-biopsies for follow-up sampling and not necessarily informative for all lesions due to intra-tumor heterogeneity. This can potentially be improved by including molecular imaging in treatment decisions. For example, patients with 89Zr-trastuzumab PET HER2-positive pattern, showed more clinical benefit on T-DM1 therapy when compared to patients with a HER2 PET-negative pattern (107). It is also of note, that detection of circulating tumor DNA (ctDNA) in blood might partly alleviate the difficulty of repeated invasive biopsies and allow for patient follow-up during treatment by retrospective analysis of serially obtained samples. For instance, a de novo EGFR mutation in exon 21 could be identified in circulating tumor DNA of a patient with recurrent ovarian cancer (151). Similarly, the emergence of EGFR-T790M mutation was detected prior to progressive disease by serial measurement of ctDNA in plasma of NSCLC patients and was associated with worse overall survival (152).
An alternative strategy to discover therapy response biomarkers would involve pre- and post-treatment analysis of the proteomic make-up of tumors from responders versus non-responders. Such an approach would define proteins that dynamically change depending upon the efficacy of treatment and as such might be used as effect sensor biomarkers. Pre-clinical imaging studies have shown the feasibility of monitoring drug-induced changes in protein expression with radionuclide imaging, such as the successful imaging of increased expression of EGFR and HER3 following treatment with PI3K/AKT TKIs using 64Cu-antibody F(ab')2 fragments (119). Using this approach, potential effect sensors identified in omics studies could be validated with molecular imaging. However, large-scale proteome analysis of tumor samples about treatment is not widely performed, mainly due to the difficulty in obtaining post-treatment samples. Such analyses are certainly warranted to identify reliable markers for treatment response.
Although molecular profiling studies have provided valuable insights in cancer subtypes, the question remains whether the profiles can be reliably measured with standard clinical techniques and if they truly improve the survival outcomes. Recent clinical trials have shown the feasibility of treatment based on selected biomarkers panels, whole genome, or proteome analysis. For example, the BATTLE trial assessed the feasibility of a selected set of genomic and proteomic biomarkers for erlotinib treatment, including EGFR mutations or CNA analysis, to guide treatment decision for NSCLC patients (153). At a larger scale, the WINTHER trial aims at full genomic analysis to stratify patients with so-called 'actionable alterations', mutations that can be targeted with approved or experimental treatments (154). Another example is the CPCT initiative in which next generation sequencing of tumor samples was performed to guide drug choice for patients with metastatic disease (155). It is conceivable that omics-based screening will identify more patients with actionable alterations, leading to incremental knowledge and increasingly predictive biomarker profiles. To this end, molecular imaging could play a role in biomarker-driven studies that focus on alterations that lead to changes in expressed proteins. To clinically test treatments based on molecular biomarkers, trial designs are adapted to enroll patients with rare mutations from multiple cancer types in so-called basket clinical trials. Using such a design, patients from 7 different cancer types harboring a BRAF-V600E mutation could be treated with the BRAF inhibitor vemurafenib (156). The recently launched TAPUR study (NCT02693535) encompasses 15 basket trials for patients with rare mutations. Amongst these are trials for patients with EGFR-mutated tumors to be treated with erlotinib, EGFR-wt tumors without any downstream RAS or RAF mutations with cetuximab, and treatment with trastuzumab and pertuzumab for patients with tumors harboring HER2 amplifications. These developments will give an indication of the added value of omics for trial designs and treatment guidance and offer a unique opportunity for molecular imaging to be incorporated in future profiling studies.
Platform integration to identify novel biomarkers
Biomarkers are increasingly a part of clinical testing for classification of cancer and differentiation into relevant subgroups. Activating EGFR mutations are targeted for effective treatment with TKIs erlotinib or gefitinib in NSCLC while ALK mutations or ROS1 translocations define a subgroup responding to crizotinib (157). Other prototypical examples of genomic biomarker-based guidance for treatment choice are BCR-ABL translocations in chronic myeloid leukemia treated with imatinib, BRCA1/2 mutations in ovarian cancer treated with PARP inhibitors, and BRAF-V600E mutations in melanoma treated with BRAF inhibitors (158-160). Besides these genomic biomarkers, many tumor-expressed protein biomarkers have been reported, including HER2, estrogen receptor (ER), and progesterone receptor (PR) in breast cancer, and c-KIT in gastro-intestinal stromal tumors (161). Interestingly, these protein targets (except c-KIT) can be successfully monitored in the clinic using a diverse panel of molecular imaging techniques for HER2, ER, and PR (94, 162, 163). Despite the plethora of biomarkers reported in the literature, only a relatively small number has been approved for clinical use (161). However, a renewed focus in precision medicine to develop targeted drugs together with matched biomarkers should improve the utility and numbers of biomarkers in the clinic (157). We anticipate that by providing insight into whole body and temporal expression of biomarkers, molecular imaging approaches can be one of the platforms to validate and apply new and existing tumor markers.
Genomic changes do not translate to phenotypic changes per se due to, for instance, regulation of RNA translation or protein function affected by post-translational modifications (PTMs). PTMs, such as phosphorylation and ubiquitination, can greatly affect the activity, stability, and function of proteins and can be highly dynamic modifications. Proteogenomic analyses by the Clinical Proteome Tumor Analysis Consortium (CPTAC) on CRC and breast cancer TCGA tumor specimens showed that translational factors could be quantitatively analyzed by proteomics and integrated with genomics to validate and improve molecular profiling (148,149). Integration of multiple platforms allows for more depth of analysis and stringent selection, potentially leading to more successful biomarkers (164). The addition of proteomics to existing genomic platforms can determine whether genomic markers are functionally expressed, allows for correlation of metabolic and enzymatic processes with genomic profiles, and can be used to follow-up on serum biomarkers and effect sensors in time. Ultimately, this could lead to robust molecular imaging candidates to visualize drug resistance or tumor responses (Figure 3).
To find new molecular imaging targets, proteomics can be used for validation of selected genomic markers or identification of new markers based upon the integration of proteomic and genomic data. For validation or measurement of a selected number of biomarkers after the initial discovery, targeted MS techniques such as multiple reaction monitoring-MS (MRM-MS) or reverse phase protein array (RPPA) are most suitable, whereas new biomarkers are better identified with quantitative proteomics. Thus far, MRM-MS has been mostly employed for serum biomarkers such as prostate-specific antigen or changes in metabolism (165). Serum biomarkers are extensively explored using proteomics and employed as diagnostic tools. However, serum biomarkers mostly reflect tumor load and do not provide information on inter- and intra-tumor heterogeneity making them less suitable as molecular imaging targets. Nevertheless, serum analysis can be integrated with genomics to study treatment responses. For instance, by analyzing temporal changes in gene expression and serum metabolites in an EGFR-L828R-T790M-driven mouse tumor model, it was possible to identify changes in metabolic pathways, such as the glutathione pathway essential for tumor response to EGFR TKI afatinib alone or in combination with the mTOR inhibitor rapamycin (166). As glutamine is a precursor of the glutathione pathway, molecular imaging with 18F-glutamine PET in NSCLC and breast cancer patients might facilitate monitoring drug-induced changes in this pathway (167). Thus, similar approaches can be used to measure changes in metabolic or enzymatic processes identified by genomics and confirmed by proteomic measurements. In addition to imaging of the prostate specific membrane antigen (PSMA) to visualize prostate cancer, the enzymatic activity of PSMA could be visualized with urea-based tracers, which are metabolized by PSMA (152, 153). Such studies point to cellular processes underlying biomarkers that might be used for molecular imaging.
RPPA is a promising technique for analysis of cellular biomarker panels, as it allows multiplexed assessment of markers limited only by the availability of specific antibodies. The combination of transcriptomic, genomic, and drug sensitivity data by RPPA analysis of 71 proteins in 84 NSCLC cell lines showed that sensitivity to EGFR inhibition correlated better with activated EGFR levels than EGFR abundance (160). These data are in concordance with the correlation between activated EGFR and EGFR TKI sensitivity found in clinical studies. As another example, a pattern of high AXL expression and c-MET activation was identified using RPPA in breast cancer tissues supposedly driving proliferation (170). Gene expression analysis studies have further led to the identification of AXL as a driver of resistance to EGFR TKIs in HNSCC and NSCLC models (171, 172). Considering that AXL imaging has already been performed with 64Cu-labeled (173) and NIRF-dye Cy5.5-conjugated AXL antibodies (174) in AXL-positive A549 human NSCLC xenografts in mice, this proliferation pathway and resistance mechanism to EGFR TKIs could potentially be monitored by non-invasive imaging. RPPA has been employed on a large scale targeting nearly 200 proteins and phosphorylated variants on 4,379 tumor samples, largely from 11 TCGA cancer cohorts and 3 independent cohorts (175). Although these data, so far only used to uncover pan-cancer proteomic relations in the TCGA cohorts, still provide a unique opportunity to integrate genomic TCGA analyses with proteomic data across multiple tumor types (176).
Identification of novel prognostic biomarkers or protein-based early effect sensors should not depend on fixed, preselected, antibodies used in RPPA and is better studied with a quantitative MS-based proteome-wide analysis. This can be performed using either isotope or chemical labeling or by label-free quantitation. Proteogenomic analysis of the TCGA CRC cohort was performed with label-free analysis using spectral counting and expression levels of protein were quantified in relation to all measured samples (148). To accurately quantify protein expression changes or PTMs, knowledge of control or standardized expression levels is essential. To this end, protein-labeling techniques can be employed together with MS, which utilizes incorporation of stable isotopes in cell lines. For example, SILAC-MS quantifies ratios between proteins derived from stable isotope-labeled cell lines and their unlabeled counterparts from control cell cultures. This technique can thus be used to measure protein dynamics when a certain treatment is applied to one of the cell cultures (177). Alternatively, isotope labeling can be performed post-treatment on cells or patient tissues using standardized SILAC-labeled reference samples or chemical labeling using isobaric tags for the relative and absolute quantitation (iTRAQ) method (178). Using SILAC-based proteomics, increased levels of EGFR, Clusterin-CLU, and HADHB were found as potential biomarkers in trastuzumab-resistant breast cancer cell lines compared to their parental controls (179). An early proteomic response to EGFR inhibition by gefitinib in human NSCLC cell line A431 was also investigated using SILAC-MS identifying a panel of 15 membrane proteins upregulated after gefitinib treatment (180). Although not clinically validated, these proteins identified in both studies were suggested as early markers of resistance to trastuzumab. Quantitative proteomics is, therefore, a promising discovery platform for new molecular imaging effect sensors by analyzing drug-induced changes in proteomes of cancer cells.
A largely untouched area of biomarkers is PTMs of proteins, that can be identified using MS. SILAC- and iTRAQ-based MS strategies, which are highly effective in quantifying changes in multiple PTMs simultaneously, such as changes in phosphorylation, glycosylation, or ubiquitination (181). PTMs are particularly interesting molecular markers as they portray the underlying, highly dynamic, biologic processes in cancer. For example, the extensive phospho-proteome analysis was performed to map EGFR signaling in relation to the sensitivity to HER family inhibitors. This approach confirmed alterations in established downstream signaling after EGFR TKI treatment, while feedback pathways involving HER2 and HER3, as well as changes in autophagy pathways were identified (166, 167). Furthermore, SILAC phospho-proteomic analysis detected high levels of phosphorylated EGFR in EGFR-wt pancreatic cancer cell lines sensitive to erlotinib, suggesting phosphorylated EGFR as a predictive marker for erlotinib treatment when EGFR mutations are absent (184). Using iTRAQ labeling of 105 TCGA breast cancer samples with corresponding genomic and clinical data, new correlations between genetic alterations (e.g. CNAs) and protein translation were found. For instance, loss of chromosome arm 5q containing SKP1 and CETN3 in basal breast cancers was shown as the potential cause of increased expression of EGFR and Src (149). Furthermore, CNAs could also be linked to changes in phosphorylation, as HER2 amplification induced over-expression and activation of not only HER2 but also of the surrounding genes CDK12, MED1, and GRB7 (149). Assuming the availability of specific probes for detection of PTMs, molecular imaging, for example using TAT-modified antibody strategies, would allow for direct analysis of pathway activation status, and may be more informative than analysis of the plain abundance of pathway components.
Developments in genomic and proteomic platforms will continue to improve biomarker discovery that will lead to implementation in clinical studies. With the existing and expanding data from these studies, molecular imaging targets can be identified that can potentially guide treatment decisions.
Discussion
Development of targeted therapies and their implementation in clinical practice can be aided by molecular testing of tumor biopsies or blood-borne markers. Complementary to these diagnostic tools, we described how molecular imaging techniques could provide valuable information on whole body distribution of drug targets to aid the assessment of drug efficacy during treatment. Measuring target presence and dynamics across multiple tumor lesions could be highly relevant to assess drug uptake, especially regarding marker-dependent agents using toxic payloads such as ADCs. Besides radionuclide-based imaging strategies, advances in optical imaging might enable simultaneous visualization of multiple markers at organ-level resolution, removing the radiation burden and lowering production costs. To unveil many relevant intracellular processes, technical advances should be aimed at bringing high affinity, large molecular weight probes, such as antibodies and analogs past cellular membranes, allowing high-contrast visualization of intracellular processes in tumor cells. Whether molecular imaging of oncogenic growth factor receptor imaging is sufficient to assess treatment efficacy and resistance of HER family-driven cancers is currently being investigated in clinical trials.
Many imaging agents are directed to commonly used tumor markers or drug targets to acquire a better understanding of target distribution and behavior. However, this array of markers can be greatly expanded by making use of integrative omics approaches that link patient and tumor characteristics to genomic and proteomic analysis. From these efforts, molecular markers have been discovered that distinguish specific subsets of cancers that could be assessed by molecular imaging. Similarly, radiomics approaches combine patient and tumor characteristics, including mutation status, for computational analysis of molecular imaging data to discover prognostic or predictive features for treatment response and outcome. Key oncogenic tumor targets or distinguishing tumor markers identified by omics approaches are not often the ideal extracellular imaging targets. However, new technologies in intracellular localization of imaging tracers might enable monitoring the activation status of these relevant biological components. Lastly, there is an unmet opportunity for pre- and post-treatment imaging of effect sensors that can be discovered by omics analysis of serially obtained tumor samples.
In summary, an extensive arsenal of molecular probes is already available to image HER family members and related proteins. Coupled to omics-based discovery platforms, this can open up an arsenal of other novel tracers for monitoring treatment efficacy and drug resistance.
Acknowledgements
This work was funded by the European Research Council (ERC) advanced grant OnQview to E.G.E.d.V.
Permissions
We thank the authors and journals for the use of original data figures shown in Figure 2. Figure 2B was originally published in European Journal of Cancer. 89Zr-trastuzumab PET visualises HER2 downregulation by the HSP90 inhibitor NVP-AUY922 in a human tumour xenograft. Oude Munnink TH et al. Eur J Cancer. 2010;46:678-684. © by Elsevier Ltd. Figure 2C and E were originally published in Clinical Cancer Research, and Figure 2I in Cancer Research: Gaykema SBM et al. 89Zr-trastuzumab and 89Zr-bevacizumab PET to evaluate the effect of the HSP90 inhibitor NVP-AUY922 in metastatic breast cancer patients. Clin Cancer Res. 2014;20:3945-3954; Bahce I et al. Development of [11C]erlotinib positron emission tomography for in vivo evaluation of EGF receptor mutational status. Clin Cancer Res. 2013;19:183-193; Cornelissen B et al. Imaging DNA damage in vivo using γH2AX-targeted immunoconjugates. Cancer Res. 2011;71:4539-4549. © by the American Association of Cancer Research. Figure 2G was originally published in JNM. Wehrenberg-Klee E et al. Differential receptor tyrosine kinase PET imaging for therapeutic guidance. J Nucl Med. 2016;115:169417. © by the Society of Nuclear Medicine and Molecular Imaging, Inc.
Competing Interests
The authors have declared that no competing interest exists.
References
1. Ferlay J, Soerjomataram I, Ervik M, Dikshit R, Eser S, MWWIC. Cancer incidence and mortality worldwide: IARC CancerBase No.11. Globocan. 2012 v1.0. 2012
2. Bray F, Jemal A, Grey N, Ferlay J, Forman D. Global cancer transitions according to the Human Development Index (2008-2030): A population-based study. Lancet Oncol. 2012;13:790-801
3. De Bono JS, Ashworth A. Translating cancer research into targeted therapeutics. Nature. 2010;467:543-549
4. Fisher R, Pusztai L, Swanton C. Cancer heterogeneity: implications for targeted therapeutics. Br J Cancer. 2013;108:479-485
5. Cottu PH, Asselah J, Lae M, Pierga JY, Diéras V, Mignot L. et al. Intratumoral heterogeneity of HER2/neu expression and its consequences for the management of advanced breast cancer. Ann Oncol. 2008;19:596-597
6. Gerlinger M, Rowan AJ, Horswell S, Larkin J, Endesfelder D, Gronroos E. et al. Intratumor heterogeneity and branched evolution revealed by multiregion sequencing. N Engl J Med. 2012;366:883-892
7. McGranahan N, Favero F, de Bruin EC, Birkbak NJ, Szallasi Z, Swanton C. Clonal status of actionable driver events and the timing of mutational processes in cancer evolution. Sci Transl Med. 2015;7:283ra54
8. Williams S-P. Tissue distribution studies of protein therapeutics using molecular probes: molecular imaging. AAPS J. 2012;14:389-399
9. de Vries EGE, de Jong S, Gietema JA. Molecular imaging as a tool for drug development and trial design. J Clin Oncol. 2015;33:2585-2587
10. Arteaga CL, Engelman JA. ERBB receptors: From oncogene discovery to basic science to mechanism-based cancer therapeutics. Cancer Cell. 2014;25:282-303
11. Yarden Y. The EGFR family and its ligands in human cancer signalling mechanisms and therapeutic opportunities. Eur J Cancer. 2001;37(Suppl 4):S3-S8
12. Zhang X, Gureasko J, Shen K, Cole PA, Kuriyan J. An allosteric mechanism for activation of the kinase domain of epidermal growth factor receptor. Cell. 2006;125:1137-1149
13. Tzahar E, Waterman H, Chen X, Levkowitz G, Karunagaran D, Lavi S. et al. A hierarchical network of interreceptor interactions determines signal transduction by Neu differentiation factor/neuregulin and epidermal growth factor. Mol Cell Biol. 1996;16:5276-5287
14. Garrett TPJ, McKern NM, Lou M, Elleman TC, Adams TE, Lovrecz GO. et al. The crystal structure of a truncated ErbB2 ectodomain reveals an active conformation, poised to interact with other ErbB receptors. Mol Cell. 2003;11:495-505
15. Guy PM, Platko J V, Cantley LC, Cerione RA, Carraway KL. Insect cell-expressed p180erbB3 possesses an impaired tyrosine kinase activity. Proc. Natl Acad Sci USA. 1994;91:8132-8136
16. Soltoff S, Carraway K. ErbB3 is involved in activation of phosphatidylinositol 3-kinase by epidermal growth factor. Mol Cell Biol. 1994;14:3550-3558
17. Hellyer NJ, Kim MS, Koland JG. Heregulin-dependent activation of phosphoinositide 3-kinase and Akt via the ErbB2/ErbB3 co-receptor. J Biol Chem. 2001;276:42153-42161
18. O'Sullivan CC, Bradbury I, Campbell C, Spielmann M, Perez EA, Joensuu H. et al. Efficacy of adjuvant trastuzumab for patients with human epidermal growth factor receptor 2-positive early breast cancer and tumors ≤ 2 cm: A meta-analysis of the randomized trastuzumab trials. J Clin Oncol. 2015;33:2600-2608
19. Turke AB, Zejnullahu K, Wu Y-L, Song Y, Dias-Santagata D, Lifshits E. et al. Preexistence and clonal selection of MET amplification in EGFR mutant NSCLC. Cancer Cell. 2010;17:77-88
20. Garrett JT, Olivares MG, Rinehart C, Granja-Ingram ND, Sánchez V, Chakrabarty A. et al. Transcriptional and posttranslational up-regulation of HER3 (ErbB3) compensates for inhibition of the HER2 tyrosine kinase. Proc Natl Acad Sci USA. 2011;108:5021-5026
21. Sergina NV, Rausch M, Wang D, Blair J, Hann B, Shokat KM. et al. Escape from HER family tyrosine kinase inhibitor therapy by the kinase-inactive HER3. Nature. 2007;445:437-441
22. Xia W, Petricoin EF, Zhao S, Liu L, Osada T, Cheng Q. et al. An heregulin-EGFR-HER3 autocrine signaling axis can mediate acquired lapatinib resistance in HER2+ breast cancer models. Breast Cancer Res. 2013;15:R85
23. Engelman JA, Zejnullahu K, Mitsudomi T, Song Y, Hyland C, Park JO. et al. MET amplification leads to gefitinib resistance in lung cancer by activating ERBB3 signaling. Science. 2007;316:1039-1043
24. Wheeler DL, Huang S, Kruser TJ, Nechrebecki MM, Armstrong EA, Benavente S. et al. Mechanisms of acquired resistance to cetuximab: role of HER (ErbB) family members. Oncogene. 2008;27:3944-3956
25. Van Cutsem E, Köhne C-H, Hitre E, Zaluski J, Chang Chien C-R, Makhson A. et al. Cetuximab and chemotherapy as initial treatment for metastatic colorectal cancer. N Engl J Med. 2009;360:1408-1417
26. Ohashi K, Maruvka YE, Michor F, Pao W. Epidermal growth factor receptor tyrosine kinase inhibitor-resistant disease. J Clin Oncol. 2013;31:1070-1080
27. Regales L, Gong Y, Shen R, de Stanchina E, Vivanco I, Goel A. et al. Dual targeting of EGFR can overcome a major drug resistance mutation in mouse models of EGFR mutant lung cancer. J Clin Invest. 2009;119:3000-3010
28. Janjigian YY, Smit EF, Groen HJM, Horn L, Gettinger S, Camidge DR. et al. Dual inhibition of EGFR with afatinib and cetuximab in kinase inhibitor-resistant EGFR-mutant lung cancer with and without T790M mutations. Cancer Discov. 2014;4:1036-1045
29. Gan HK, Cvrljevic AN, Johns TG. The epidermal growth factor receptor variant III (EGFRvIII): Where wild things are altered. FEBS J. 2013;280:5350-5370
30. Mazières J, Peters S, Lepage B, Cortot AB, Barlesi F, Beau-Faller M. et al. Lung cancer that harbors an HER2 mutation: epidemiologic characteristics and therapeutic perspectives. J Clin Oncol. 2013;31:1997-2003
31. Scaltriti M, Rojo F, Ocaña A, Anido J, Guzman M, Cortes J. et al. Expression of p95HER2, a truncated form of the HER2 receptor, and response to anti-HER2 therapies in breast cancer. J Natl Cancer Inst. 2007;99:628-638
32. Sperinde J, Jin X, Banerjee J, Penuel E, Saha A, Diedrich G. et al. Quantitation of p95HER2 in paraffin sections by using a p95-specific antibody and correlation with outcome in a cohort of trastuzumab-treated breast cancer patients. Clin Cancer Res. 2010;16:4226-4235
33. Lavaud P, Andre F. Strategies to overcome trastuzumab resistance in HER2-overexpressing breast cancers: focus on new data from clinical trials. BMC Med. 2014;12:132
34. Scheuer W, Friess T, Burtscher H, Bossenmaier B, Endl J, Hasmann M. Strongly enhanced antitumor activity of trastuzumab and pertuzumab combination treatment on HER2-positive human xenograft tumor models. Cancer Res. 2009;69:9330-9336
35. Swain SM, Baselga J, Kim S-B, Ro J, Semiglazov V, Campone M. et al. Pertuzumab, trastuzumab, and docetaxel in HER2-positive metastatic breast cancer. N Engl J Med. 2015;372:724-734
36. Phillips GDL, Fields CT, Li G, Dowbenko D, Schaefer G, Miller K. et al. Dual targeting of HER2-positive cancer with trastuzumab emtansine and pertuzumab: critical role for neuregulin blockade in antitumor response to combination therapy. Clin Cancer Res. 2014;20:456-468
37. Kol A, Terwisscha van Scheltinga AGT, Timmer-Bosscha H, Lamberts LE, Bensch F, de Vries EGE. et al. HER3, serious partner in crime: therapeutic approaches and potential biomarkers for effect of HER3-targeting. Pharmacol Ther. 2014;143:1-11
38. Nahta R, Yuan LXH, Zhang B, Kobayashi R, Esteva FJ. Insulin-like growth factor-I receptor/human epidermal growth factor receptor 2 heterodimerization contributes to trastuzumab resistance of breast cancer cells. Cancer Res. 2005;65:11118-111128
39. Furlan A, Kherrouche Z, Montagne R, Copin M-C, Tulasne D. Thirty years of research on Met receptor to move a biomarker from bench to bedside. Cancer Res. 2014;74:6737-6745
40. Blumenschein GR, Mills GB, Gonzalez-Angulo AM. Targeting the hepatocyte growth factor-cMET axis in cancer Therapy. J Clin Oncol. 2012;30:3287-3296
41. Wilson TR, Fridlyand J, Yan Y, Penuel E, Burton L, Chan E. et al. Widespread potential for growth-factor-driven resistance to anticancer kinase inhibitors. Nature. 2012;487:505-509
42. Tang Z, Du R, Jiang S, Wu C, Barkauskas DS, Richey J. et al. Dual MET-EGFR combinatorial inhibition against T790M-EGFR-mediated erlotinib-resistant lung cancer. Br J Cancer. 2008;99:911-922
43. Seiwert TY, Jagadeeswaran R, Faoro L, Janamanchi V, Nallasura V, Dinali M El. et al. The MET receptor tyrosine kinase is a potential novel therapeutic target for head and neck squamous cell carcinoma. Cancer Res. 2009;69:3021-3031
44. Chang K, Karnad A, Zhao S, Freeman JW. Roles of c-Met and RON kinases in tumor progression and their potential as therapeutic targets. Oncotarget. 2015;6:3507-3518
45. Roskoski R. Src protein-tyrosine kinase structure, mechanism, and small molecule inhibitors. Pharmacol Res. 2015;94:9-25
46. Mitra D, Brumlik MJ, Okamgba SU, Zhu Y, Duplessis TT, Parvani JG. et al. An oncogenic isoform of HER2 associated with locally disseminated breast cancer and trastuzumab resistance. Mol Cancer Ther. 2009;8:2152-2162
47. Stabile LP, He G, Lui VWY, Henry C, Gubish CT, Joyce S. et al. C-Src activation mediates erlotinib resistance in head and neck cancer by stimulating c-Met. Clin Cancer Res. 2013;19:380-392
48. Cortot AB, Repellin CE, Shimamura T, Capelletti M, Zejnullahu K, Ercan D. et al. Resistance to irreversible EGF receptor tyrosine kinase inhibitors through a multistep mechanism involving the IGF1R pathway. Cancer Res. 2013;73:834-843
49. Gallardo A, Lerma E, Escuin D, Tibau A, Muñoz J, Ojeda B. et al. Increased signalling of EGFR and IGF1R, and deregulation of PTEN/PI3K/Akt pathway are related with trastuzumab resistance in HER2 breast carcinomas. Br J Cancer. 2012;106:1367-1373
50. Sharma SV, Lee DY, Li B, Quinlan MP, Takahashi F, Maheswaran S. et al. A chromatin-mediated reversible drug-tolerant state in cancer cell subpopulations. Cell. 2010;141:69-80
51. Serra V, Scaltriti M, Prudkin L, Eichhorn PJA, Ibrahim YH, Chandarlapaty S. et al. PI3K inhibition results in enhanced HER signaling and acquired ERK dependency in HER2-overexpressing breast cancer. Oncogene. 2011;30:2547-2557
52. Chandarlapaty S, Sawai A, Scaltriti M, Rodrik-Outmezguine V, Grbovic-Huezo O, Serra V. et al. AKT inhibition relieves feedback suppression of receptor tyrosine kinase expression and activity. Cancer Cell. 2011;19:58-71
53. Chen S-M, Guo C-L, Shi J-J, Xu Y-C, Chen Y, Shen Y-Y. et al. HSP90 inhibitor AUY922 abrogates up-regulation of RTKs by mTOR inhibitor AZD8055 and potentiates its antiproliferative activity in human breast cancer. Int J Cancer. 2014;135:2462-2474
54. Alam IS, Arshad MA, Nguyen Q, Aboagye EO. Radiopharmaceuticals as probes to characterize tumour tissue. Eur J Nucl Med Mol Imaging. 2015;42:537-561
55. Rahmim A, Zaidi H. PET versus SPECT: strengths, limitations and challenges. Nucl Med Commun. 2008;29:193-207
56. Tichauer KM, Wang Y, Pogue BW, Liu JTC. Quantitative in vivo cell-surface receptor imaging in oncology: kinetic modeling and paired-agent principles from nuclear medicine and optical imaging. Phys Med Biol. 2015;60:R239-R269
57. Tomasi G, Turkheimer F, Aboagye E. Importance of quantification for the analysis of PET data in oncology: Review of current methods and trends for the future. Mol Imaging Biol. 2012;14:131-613
58. Corcoran EB, Hanson RN. Imaging EGFR and HER2 by PET and SPECT: a review. Med Res Rev. 2014;34:596-643
59. Gebhart G, Flamen P, De Vries EGE, Jhaveri K, Wimana Z. Imaging diagnostic and therapeutic targets: human epidermal growth factor receptor 2. J Nucl Med. 2016;57:81S-88S
60. Lenz H-J, van Cutsem E, Khambata-Ford S, Mayer RJ, Gold P, Stella P. et al. Multicenter phase II and translational study of cetuximab in metastatic colorectal carcinoma refractory to irinotecan, oxaliplatin, and fluoropyrimidines. J Clin Oncol. 2006;24:4914-4921
61. Van Dijk LK, Hoeben BAW, Kaanders JHAM, Franssen GM, Boerman OC, Bussink J. Imaging of epidermal growth factor receptor expression in head and neck cancer with SPECT/CT and 111In-labeled cetuximab-F(ab')2. J Nucl Med. 2013;54:2118-2124
62. Cai W, Chen K, He L, Cao Q, Koong A, Chen X. Quantitative PET of EGFR expression in xenograft-bearing mice using 64Cu-labeled cetuximab, a chimeric anti-EGFR monoclonal antibody. Eur J Nucl Med Mol Imaging. 2007;34:850-858
63. Hoeben BA, Molkenboer-Kuenen JDM, Oyen WJG, Peeters WJM, Kaanders JH, Bussink J. et al. Radiolabeled cetuximab: dose optimization for epidermal growth factor receptor imaging in a head-and-neck squamous cell carcinoma model. Int J Cancer. 2011;129:870-878
64. Aerts HJWL, Dubois L, Perk L, Vermaelen P, van Dongen GAMS, Wouters BG. et al. Disparity between in vivo EGFR expression and 89Zr-labeled cetuximab uptake assessed with PET. J Nucl Med. 2009;50:123-131
65. Niu G, Sun X, Cao Q, Courter D, Koong A, Le Q-T. et al. Cetuximab-based immunotherapy and radioimmunotherapy of head and neck squamous cell carcinoma. Clin Cancer Res. 2010;16:2095-2105
66. Pool M, Kol A, Gerdes CA, Lub-de Hooge MN, de Jong S, de Vries EG, Terwisscha van Scheltinga AG. Extracellular domain shedding influences specific tumor uptake and organ distribution of EGFR PET tracer 89Zr-imgatuzumab. Oncotarget. 2016;7:68111-68121
67. Menke-Van der Houven van Oordt CW, Gootjes EC, Huisman MC, Vugts DJ, Roth C, Luik AM. et al. 89Zr-cetuximab PET imaging in patients with advanced colorectal cancer. Oncotarget. 2015;6:30384-30393
68. Petrulli JR, Sullivan JM, Zheng M, Bennett DC, Charest J, Huang Y. et al. Quantitative analysis of [11C ]-erlotinib PET demonstrates specific binding for activating mutations of the EGFR kinase domain. Neoplasia. 2013;15:1347-1353
69. Memon AA, Jakobsen S, Dagnaes-Hansen F, Sorensen BS, Keiding S, Nexo E. Positron emission tomography (PET) imaging with [11C]-labeled erlotinib: A micro-PET study on mice with lung tumor xenografts. Cancer Res. 2009;69:873-878
70. Abourbeh G, Itamar B, Salnikov O, Beltsov S, Mishani E. Identifying erlotinib-sensitive non-small cell lung carcinoma tumors in mice using [11C]erlotinib PET. EJNMMI Res. 2015;5:4
71. Bahce I, Smit EF, Lubberink M, Van Der Veldt AAM, Yaqub M, Windhorst AD. et al. Development of [11C]erlotinib positron emission tomography for in vivo evaluation of EGF receptor mutational status. Clin Cancer Res. 2013;19:183-193
72. Memon AA, Weber B, Winterdahl M, Jakobsen S, Meldgaard P, Madsen HHT. et al. PET imaging of patients with non-small cell lung cancer employing an EGF receptor targeting drug as tracer. Br J Cancer. 2011;105:1850-1855
73. Weber B, Winterdahl M, Memon AA, Sorensen BS, Keiding S, Sorensen L. et al. Erlotinib accumulation in brain metastases from non-small cell lung cancer: Visualization by positron emission tomography in a patient harboring a mutation in the epidermal growth factor receptor. J Thorac Oncol. 2011;6:1287-1289
74. Slobbe P, Windhorst AD, Stigter-van Walsum M, Smit EF, Niessen HG, Solca F. et al. A comparative PET imaging study with the reversible and irreversible EGFR tyrosine kinase inhibitors [11C]erlotinib and [18F]afatinib in lung cancer-bearing mice. EJNMMI Res. 2015;5:14
75. Gong H, Kovar JL, Cheung L, Rosenthal EL, Olive DM. A comparative study of affibody, panitumumab, and EGF for near-infrared fluorescence imaging of EGFR- and EGFRvIII-expressing tumors. Cancer Biol Ther. 2014;15:185-193
76. Lee FT, O'Keefe GJ, Gan HK, Mountain AJ, Jones GR, Saunder TH. et al. Immuno-PET quantitation of de2-7 epidermal growth factor receptor expression in glioma using 124I-IMP-R4-labeled antibody ch806. J Nucl Med. 2010;51:967-972
77. Takasu S, Takahashi T, Okamoto S, Oriuchi N, Nakayashiki N, Okamoto K. et al. Radioimmunoscintigraphy of intracranial glioma xenograft with a technetium-99m-labeled mouse monoclonal antibody specifically recognizing type III mutant epidermal growth factor receptor. J Neurooncol. 2003;63:247-256
78. Liu K, Liu X, Peng Z, Sun H, Zhang M, Zhang J. et al. Retargeted human avidin-CAR T cells for adoptive immunotherapy of EGFRvIII expressing gliomas and their evaluation via optical imaging. Oncotarget. 2015;6:23735-23747
79. Korb ML, Hartman YE, Kovar J, Zinn KR, Bland KI, Rosenthal EL. Use of monoclonal antibody-IRDye800CW bioconjugates in the resection of breast cancer. J Surg Res. 2014;188:119-128
80. Oliveira S, Van Dongen GAMS, Stigter-Van Walsum M, Roovers RC, Stam JC, Mali W. et al. Rapid visualization of human tumor xenografts through optical imaging with a near-infrared fluorescent anti-epidermal growth factor receptor nanobody. Mol Imaging. 2012;11:33-46
81. van Driel PBAA, van der Vorst JR, Verbeek FPR, Oliveira S, Snoeks TJA, Keereweer S. et al. Intraoperative fluorescence delineation of head and neck cancer with a fluorescent anti-epidermal growth factor receptor nanobody. Int J Cancer. 2014;134:2663-2673
82. Tjalma JJ, Garcia-Allende PB, Hartmans E, Terwisscha van Scheltinga AG, Boersma-van Ek W, Glatz J. et al. Molecular fluorescence endoscopy targeting vascular endothelial growth factor A for improved colorectal polyp detection. J Nucl Med. 2016;57:480-485
83. Rosenthal EL, Warram JM, de Boer E, Chung TK, Korb ML, Brandwein-Gensler M. et al. Safety and tumor specificity of cetuximab-IRDye800 for surgical navigation in head and neck cancer. Clin Cancer Res. 2015;21:3658-3666
84. de Boer E, Warram JM, Tucker MD, Hartman YE, Moore LS, de Jong JS. et al. In vivo fluorescence immunohistochemistry: localization of fluorescently labeled cetuximab in squamous cell carcinomas. Sci Rep. Nature Publishing Group. 2015;5:10169
85. Ross JS, Fletcher JA. The HER-2/neu oncogene in breast cancer: prognostic factor, predictive factor, and target for therapy. Stem Cells. 1998;16:413-428
86. Dijkers ECF, Kosterink JGW, Rademaker AP, Perk LR, van Dongen GAMS, Bart J. et al. Development and characterization of clinical-grade 89Zr-trastuzumab for HER2/neu immunoPET imaging. J Nucl Med. 2009;50:974-981
87. Marquez BV, Ikotun OF, Zheleznyak A, Wright B, Hari-Raj A, Pierce RA. et al. Evaluation of 89Zr-pertuzumab in breast cancer xenografts. Mol Pharm. 2014;11:3988-3995
88. Tinianow JN, Gill HS, Ogasawara A, Flores JE, Vanderbilt AN, Luis E. et al. Site-specifically 89Zr-labeled monoclonal antibodies for immunoPET. Nucl Med Biol. 2010;37:289-297
89. Sorensen J, Sandberg D, Sandstrom M, Wennborg A, Feldwisch J, Tolmachev V. et al. First-in-human molecular imaging of HER2 expression in breast cancer metastases using the 111In-ABY-025 affibody molecule. J Nucl Med. 2014;55:730-735
90. Baum RP, Prasad V, Müller D, Schuchardt C, Orlova A, Wennborg A. et al. Molecular imaging of HER2-expressing malignant tumors in breast cancer patients using synthetic 111In- or 68Ga-labeled affibody molecules. J Nucl Med. 2010;51:892-897
91. Keyaerts M, Xavier C, Heemskerk J, Devoogdt N, Everaert H, Ackaert C. et al. Phase I study of 68Ga-HER2-nanobody for PET/CT assessment of HER2 expression in breast carcinoma. J Nucl Med. 2016;57:27-33
92. Gaykema SBM, Brouwers AH, Hovenga S, Lub-de Hooge MN, de Vries EGE, Schroder CP. Zirconium-89-trastuzumab positron emission tomography as a tool to solve a clinical dilemma in a patient with breast cancer. J Clin Oncol. 2012;30:e74-75
93. Perik PJ, Lub-De Hooge MN, Gietema JA, Van Der Graaf WTA, De Korte MA, Jonkman S. et al. Indium-111-labeled trastuzumab scintigraphy in patients with human epidermal growth factor receptor 2-positive metastatic breast cancer. J Clin Oncol. 2006;24:2276-2282
94. Dijkers EC, Oude Munnink TH, Kosterink JG, Brouwers AH, Jager PL, de Jong JR. et al. Biodistribution of 89Zr-trastuzumab and PET imaging of HER2-positive lesions in patients with metastatic breast cancer. Clin Pharmacol Ther. 2010;87:586-592
95. Terwisscha van Scheltinga AGT, Lub-de Hooge MN, Abiraj K, Schröder CP, Pot L, Bossenmaier B. et al. ImmunoPET and biodistribution with human epidermal growth factor receptor 3 targeting antibody 89Zr-RG7116. MAbs. 2014;6:1051-1058
96. Wehrenberg-Klee N.S, Turker B, Chang P, Heidari U, Mahmood E. Development of a HER3 PET probe for breast cancer imaging. J Nucl Med. 2014;55(supplement 1):550
97. Andersson KG, Rosestedt M, Varasteh Z, Malm M, Sandström M, Tolmachev V. et al. Comparative evaluation of 111In-labeled NOTA-conjugated affibody molecules for visualization of HER3 expression in malignant tumors. Oncol Rep. 2015;34:1042-1048
98. Rosestedt M, Andersson KG, Mitran B, Tolmachev V, Löfblom J, Orlova A. et al. Affibody-mediated PET imaging of HER3 expression in malignant tumours. Sci Rep. 2015;5:15226
99. Orlova A, Malm M, Rosestedt M, Varasteh Z, Andersson K, Selvaraju RK. et al. Imaging of HER3-expressing xenografts in mice using a 99mTc(CO) 3-HEHEHE-ZHER3:08699 affibody molecule. Eur J Nucl Med Mol Imaging. 2014;41:1450-1459
100. Razumienko EJ, Scollard D a, Reilly RM. Small-animal SPECT/CT of HER2 and HER3 expression in tumor xenografts in athymic mice using trastuzumab Fab-heregulin bispecific radioimmunoconjugates. J Nucl Med. 2012;53:1943-1950
101. Lockhart AC, Liu Y, Dehdashti F, Laforest R, Picus J, Frye J. et al. Phase 1 evaluation of [64Cu]DOTA-patritumab to assess dosimetry, apparent receptor occupancy, and safety in subjects with advanced solid tumors. Mol Imaging Biol. 2015;3:446-453
102. Bensch F, Lamberts LE, Smeenk MM, Jorritsma-Smit A, Lub-de Hooge MN. 89Zr-lumretuzumab PET imaging before and during HER3 antibody lumretuzumab treatment of solid tumor patients. J Clin Oncol. 2016;34(supp):l abstr11555
103. Nagaya T, Sato K, Harada T, Nakamura Y, Choyke PL, Kobayashi H. Near infrared photoimmunotherapy targeting EGFR positive triple negative breast cancer: Optimizing the conjugate-light regimen. PLoS One. 2015;10:e0136829
104. Perk LR, Visser GWM, Vosjan MJWD, Stigter-van Walsum M, Tijink BM, Leemans CR. et al. 89Zr as a PET surrogate radioisotope for scouting biodistribution of the therapeutic radiometals 90Y and 177Lu in tumor-bearing nude mice after coupling to the internalizing antibody cetuximab. J Nucl Med. 2005;46:1898-1906
105. Lee H, Zheng J, Gaddy D, Orcutt KD, Leonard S, Geretti E. et al. A gradient-loadable 64Cu-chelator for quantifying tumor deposition kinetics of nanoliposomal therapeutics by positron emission tomography. Nanomedicine. 2015;11:155-165
106. Gaddy DF, Lee H, Zheng J, Jaffray DA, Wickham TJ, Hendriks BS. Whole-body organ-level and kidney micro-dosimetric evaluations of 64Cu-loaded HER2/ErbB2-targeted liposomal doxorubicin (64Cu-MM-302) in rodents and primates. EJNMMI Res. 2015;5:24
107. Gebhart G, Lamberts LE, Wimana Z, Garcia C, Emonts P, Ameye L. Molecular imaging as a tool to investigate heterogeneity of advanced HER2-positive breast cancer and to predict patient outcome under trastuzumab emtansine (T-DM1): the ZEPHIR trial. Ann Oncol. 2015;27:1-22
108. Weele EJ, Terwisscha van Scheltinga AGT, Kosterink JGW, Pot L, Vedelaar SR, Lamberts LE. et al. Imaging the distribution of an antibody-drug conjugate constituent targeting mesothelin with 89Zr and IRDye 800CW in mice bearing human pancreatic tumor xenografts. Oncotarget. 2015;6:42081-42090
109. Lamberts TE, Menke-van der Houven van Oordt CW, ter Weele EJ, Bensch F, Smeenk MM, Voortman J. et al. ImmunoPET with anti-mesothelin antibody in patients with pancreatic and ovarian cancer before anti-mesothelin antibody-drug conjugate treatment. Clin Cancer Res. 2016;22:1642-1652
110. Marquez B V, Ikotun OF, Zheleznyak A, Wright B, Hari-Raj A, Pierce R A. et al. Evaluation of 89Zr-pertuzumab in breast cancer xenografts. Mol Pharm. 2014;11:3988-3995
111. Wimana Z, Gebhart G, Guiot T, Vanderlinden B, Morandini R, Doumont G. et al. Mucolytic agents can enhance HER2 receptor accessibility for [89Zr]trastuzumab, improving HER2 imaging in a mucin-overexpressing breast cancer xenograft mouse model. Mol Imaging Biol. 2015;17:697-703
112. Pastuskovas C V, Mundo EE, Williams SP, Nayak TK, Ho J, Ulufatu S. et al. Effects of anti-VEGF on pharmacokinetics, biodistribution, and tumor penetration of trastuzumab in a preclinical breast cancer model. Mol Cancer Ther. 2012;11:752-762
113. Arjaans M, Oude Munnink TH, Oosting SF, Terwisscha van Scheltinga AGT, Gietema JA, Garbacik ET. et al. Bevacizumab-induced normalization of blood vessels in tumors hampers antibody uptake. Cancer Res. 2013;73:3347-3455
114. Nagengast WB, de Korte MA, Oude Munnink TH, Timmer-Bosscha H, den Dunnen WF, Hollema H. et al. 89Zr-bevacizumab PET of early antiangiogenic tumor response to treatment with HSP90 inhibitor NVP-AUY922. J Nucl Med. 2010;51:761-767
115. Terwisscha van Scheltinga AGT, Berghuis P, Nienhuis HH, Timmer-Bosscha H, Pot L, Gaykema SBM. et al. Visualising dual downregulation of insulin-like growth factor receptor-1 and vascular endothelial growth factor-A by heat shock protein 90 inhibition effect in triple negative breast cancer. Eur J Cancer. 2014;50:2508-2516
116. Van der Bilt ARM, Terwisscha van Scheltinga AGT, Timmer-Bosscha H, Schröder CP, Pot L, Kosterink JGW. et al. Measurement of tumor VEGF-A levels with 89Zr-bevacizumab PET as an early biomarker for the antiangiogenic effect of everolimus treatment in an ovarian cancer xenograft model. Clin Cancer Res. 2012;18:6306-6314
117. Van Asselt SJ, Oosting SF, Brouwers AH, Bongaerts AHH, de Jong JR, Lub-de Hooge MN. et al. Everolimus reduces 89Zr-bevacizumab tumor uptake in patients with neuroendocrine tumors. J Nucl Med. 2014;55:1087-1092
118. Nagengast WB, Lub-de Hooge MN, Oosting SF, Den Dunnen WFA, Warnders FJ, Brouwers AH. et al. VEGF-PET imaging is a noninvasive biomarker showing differential changes in the tumor during sunitinib treatment. Cancer Res. 2011;71:143-153
119. Wehrenberg-Klee E, Turker NS, Heidari P, Larimer BM, Juric D, Baselga J. et al. Differential receptor tyrosine kinase PET imaging for therapeutic guidance. J Nucl Med. 2016;115:169417
120. Janjigian YY, Viola-Villegas N, Holland JP, Divilov V, Carlin SD, Gomes-DaGama EM. et al. Monitoring afatinib treatment in HER2-positive gastric cancer with 18F-FDG and 89Zr-trastuzumab PET. J Nucl Med. 2013;54:936-943
121. Oude Munnink TH, De Vries EGE, Vedelaar SR, Timmer-Bosscha H, Schröder CP, Brouwers AH. et al. Lapatinib and 17AAG reduce 89Zr-trastuzumab-F(ab') 2 uptake in SKBR3 tumor xenografts. Mol Pharm. 2012;9:2995-3002
122. Oude Munnink TH, Korte MA de, Nagengast WB, Timmer-Bosscha H, Schröder CP, Jong JR de. et al. 89Zr-trastuzumab PET visualises HER2 downregulation by the HSP90 inhibitor NVP-AUY922 in a human tumour xenograft. Eur J Cancer. 2010;46:678-684
123. Van De Ven SMWY, Elias SG, Chan CT, Miao Z, Cheng Z, De A. et al. Optical imaging with HER2-targeted affibody molecules can monitor Hsp90 treatment response in a breast cancer xenograft mouse model. Clin Cancer Res. 2012;18:1073-1081
124. Holland JP, Caldas-Lopes E, Divilov V, Longo VA, Taldone T, Zatorska D. et al. Measuring the pharmacodynamic effects of a novel Hsp90 inhibitor on HER2/neu expression in mice using 89Zr-DFO-trastuzumab. PLoS One. 2010;5:e8859
125. Gaykema SBM, Schröder CP, Vitfell-Rasmussen J, Chua S, Munnink THO, Brouwers AH. et al. 89Zr-trastuzumab and 89Zr-bevacizumab PET to evaluate the effect of the HSP90 inhibitor NVP-AUY922 in metastatic breast cancer patients. Clin Cancer Res. 2014;20:3945-3954
126. Tao JJ, Castel P, Radosevic-Robin N, Elkabets M, Auricchio N, Aceto N. et al. Antagonism of EGFR and HER3 enhances the response to inhibitors of the PI3K-Akt pathway in triple-negative breast cancer. Sci Signal. 2014;7:29
127. Cornelissen B, Hu M, McLarty K, Costantini D, Reilly RM. Cellular penetration and nuclear importation properties of 111In-labeled and 123I-labeled HIV-1 tat peptide immunoconjugates in BT-474 human breast cancer cells. Nucl Med Biol. 2007;34:37-46
128. Cornelissen B, Kersemans V, McLarty K, Tran L, Vallis KA, Reilly RM. In vivo monitoring of intranuclear p27kip1 protein expression in breast cancer cells during trastuzumab (Herceptin) therapy. Nucl Med Biol. 2009;36:811-819
129. Cornelissen B, Kersemans V, Darbar S, Thompson J, Shah K, Sleeth K. et al. Imaging DNA damage in vivo using γH2AX-targeted immunoconjugates. Cancer Res. 2011;71:4539-4549
130. Knight JC, Topping C, Mosley M, Kersemans V, Falzone N, Fernández-Varea JM. et al. PET imaging of DNA damage using 89Zr-labelled anti-γH2AX-TAT immunoconjugates. Eur J Nucl Med Mol Imaging. 2015;42:1707-1717
131. Cornelissen B, Able S, Kartsonaki C, Kersemans V, Allen PD, Iezzi M. et al. Imaging DNA damage allows detection of preneoplasia in the BALB-neuT model of breast cancer. J Nucl Med. 2014;55:2026-2031
132. Cook GJR, Siddique M, Taylor BP, Yip C, Chicklore S, Goh V. Radiomics in PET: principles and applications. Clin Transl Imaging. 2014;2:269-276
133. Gillies RJ, Kinahan PE, Hricak H. Radiomics: images are more than pictures, they are data. Radiology. 2015;278:563-577
134. Liu Y, Kim J, Balagurunathan Y, Li Q, Garcia AL, Stringfield O. et al. Radiomic features are associated with EGFR mutation status in lung adenocarcinomas. Clin Lung Cancer. 2016;17:441-448
135. Weiss GJ, Ganeshan B, Miles KA, Campbell DH, Cheung PY, Frank S. et al. Noninvasive image texture analysis differentiates K-ras mutation from pan-wildtype NSCLC and is prognostic. PLoS One. 2014;9:e100244
136. Yip SS, Kim J, Coroller T, Parmar C, Rios Velazquez E, Huynh E. et al. Associations between somatic mutations and metabolic imaging phenotypes in non-small cell lung cancer. J Nucl Med. 2016;1048:1-22
137. Hartmans E, Orian-Rousseau V, Matzke-Ogi A, Karrenbeld A, Groot DJA de, Jong S de. et al. Functional genomic mRNA profiling of colorectal adenomas: identification and in vivo validation of CD44 and splice variant CD44v6 as molecular imaging targets. Theranostics. 2017;7:482-492
138. Yang Y, Adelstein SJ, Kassis AI. General approach to identifying potential targets for cancer imaging by integrated bioinformatics analysis of publicly available genomic profiles. Mol Imaging. 2011;10:123-134
139. de Vries EGE, Munnink THO, van Vugt MATM, Nagengast WB. Toward molecular imaging-driven drug development in oncology. Cancer Discov. 2011;1:25-28
140. Pleasance ED, Cheetham KK, Stephens PJ, McBride DJ, Humphray SJ, Greenman CD. et al. A comprehensive catalogue of somatic mutations from a human cancer genome. Nature. 2010;463:191-196
141. Weinstein JN, Collisson EA, Mills GB, Shaw KRM, Ozenberger BA, Ellrott K. et al. The cancer genome atlas pan-cancer analysis project. Nat Genet. 2013;45:1113-1120
142. Curtis C, Shah SP, Chin S-F, Turashvili G, Rueda OM, Dunning MJ. et al. The genomic and transcriptomic architecture of 2,000 breast tumours reveals novel subgroups. Nature. 2012;486:346-352
143. Cardoso F, van't Veer LJ, Bogaerts J, Slaets L, Viale G, Delaloge S. et al. 70-Gene signature as an aid to treatment decisions in early-stage breast cancer. N Engl J Med. 2016;375:717-729
144. Bense RD, Sotiriou C, Piccart-Gebhart MJ, Haanen JBAG, van Vugt MATM, de Vries EGE, Schröder CP, Fehrmann RSN. Relevance of tumor-infiltrating immune cell composition and functionality for disease outcome in breast cancer. J Natl Cancer Inst. 2017;109:djw192
145. The Cancer Genome Atlas Network. Comprehensive molecular portraits of human breast tumours. Nature. 2012;490:61-70
146. Kandoth C, McLellan MD, Vandin F, Ye K, Niu B, Lu C. et al. Mutational landscape and significance across 12 major cancer types. Nature. 2013;502:333-339
147. Cox J, Mann M. Quantitative, high-resolution proteomics for data-driven systems biology. Annu Rev Biochem. 2011;80:273-299
148. Zhang B, Wang J, Wang X, Zhu J, Liu Q, Shi Z. et al. Proteogenomic characterization of human colon and rectal cancer. Nature. 2014;513:382-387
149. Mertins P, Mani DR, Ruggles K V, Gillette MA, Clauser KR, Wang P. et al. Proteogenomics connects somatic mutations to signalling in breast cancer. Nature. 2016;534:55-62
150. Geiger T, Cox J, Mann M. Proteomic changes resulting from gene copy number variations in cancer cells. PLoS Genet. 2010;6:e1001090
151. Forshew T, Murtaza M, Parkinson C, Gale D, Tsui DWY, Kaper F. et al. Noninvasive identification and monitoring of cancer mutations by targeted deep sequencing of plasma DNA. Sci Transl Med. 2012;4:136-68
152. Zheng D, Ye X, Zhang MZ, Sun Y, Wang JY, Ni J. et al. Plasma EGFR T790M ctDNA status is associated with clinical outcome in advanced NSCLC patients with acquired EGFR-TKI resistance. Sci Rep. 2016;6:20913
153. Kim ES, Herbst RS, Wistuba II, Jack Lee J, Blumenschein GR, Tsao A. et al. The BATTLE trial: personalizing therapy for lung cancer. Cancer Discov. 2011;1:44-53
154. Rodon J, Soria JC, Berger R, Batist G, Tsimberidou A, Bresson C. et al. Challenges in initiating and conducting personalized cancer therapy trials: Perspectives from WINTHER, a Worldwide Innovative Network (WIN) Consortium trial. Ann Oncol. 2015;26:1791-1798
155. Bijlsma RM, Bredenoord AL, Gadellaa-Hooijdonk CG, Lolkema MP, Sleijfer S, Voest EE. et al. Unsolicited findings of next-generation sequencing for tumor analysis within a Dutch consortium: clinical daily practice reconsidered. Eur J Hum Genet. 2016;24:1-5
156. Hyman DM, Puzanov I, Subbiah V, Faris JE, Chau I, Blay J-Y. et al. Vemurafenib in multiple non-melanoma cancers with BRAF V600 mutations. N Engl J Med. 2015;373:726-736
157. Vargas AJ, Harris CC. Biomarker development in the precision medicine era: lung cancer as a case study. Nat Rev Cancer. 2016;16:525-537
158. Fong PC, Boss DS, Yap TA, Tutt A, Wu P, Mergui-Roelvink M. et al. Inhibition of poly(ADP-ribose) polymerase in tumors from BRCA mutation carriers. N Engl J Med. 2009;361:123-134
159. Bollag G, Hirth P, Tsai J, Zhang J, Ibrahim PN, Cho H. et al. Clinical efficacy of a RAF inhibitor needs broad target blockade in BRAF-mutant melanoma. Nature. 2010;467:596-599
160. Ummanni R, Mannsperger HA, Sonntag J, Oswald M, Sharma AK, König R. et al. Evaluation of reverse phase protein array (RPPA)-based pathway-activation profiling in 84 non-small cell lung cancer (NSCLC) cell lines as platform for cancer proteomics and biomarker discovery. Biochim Biophys Acta. 2014;1844:950-959
161. Füzéry AK, Levin J, Chan MM, Chan DW. Translation of proteomic biomarkers into FDA approved cancer diagnostics: issues and challenges. Clin Proteomics. 2013;10:13
162. Van Kruchten M, de Vries EGE, Brown M, de Vries EFJ, Glaudemans AWJM, Dierckx RAJO. et al. PET imaging of oestrogen receptors in patients with breast cancer. Lancet Oncol. 2013;14:e465-475
163. Dehdashti F, Laforest R, Gao F, Aft RL, Dence CS, Zhou D. et al. Assessment of progesterone receptors in breast carcinoma by PET with 21-18F-fluoro-16α,17α-[(R)-(1'-α-furylmethylidene)dioxy]-19-norpregn-4-ene-3,20-dione. J Nucl Med. 2012;53:363-370
164. Orchard S, Binz P-A, Borchers C, Gilson MK, Jones AR, Nicola G. et al. Ten years of standardizing proteomic data: a report on the HUPO-PSI Spring Workshop: April 12-14th, 2012, San Diego, USA. Proteomics. 2012;12:2767-2772
165. Kitteringham NR, Jenkins RE, Lane CS, Elliott VL, Park BK. Multiple reaction monitoring for quantitative biomarker analysis in proteomics and metabolomics. J. Chromatogr. B Anal. Technol. Biomed. Life Sci. 2009;877:1229-1239
166. Weaver Z, Difilippantonio S, Carretero J, Martin PL, El Meskini R, Iacovelli AJ. et al. Temporal molecular and biological assessment of an erlotinib-resistant lung adenocarcinoma model reveals markers of tumor progression and treatment response. Cancer Res. 2012;72:5921-5933
167. Baek S, Choi C-M, Ahn SH, Lee JW, Gong G, Ryu J-S. et al. Exploratory clinical trial of (4S)-4-(3-[18F]fluoropropyl)-L-glutamate for imaging xC- transporter using positron emission tomography in patients with non-small cell lung or breast cancer. Clin Cancer Res. 2012;18:5427-5437
168. Haseman MK, Rosenthal SA, Polascik TJ. Capromab pendetide imaging of prostate cancer. Cancer Biother Radiopharm. 2000;15:131-140
169. Banerjee SR, Foss CA, Castanares M, Mease RC, Byun Y, Fox JJ. et al. Synthesis and evaluation of technetium-99m- and rhenium-labeled inhibitors of the prostate-specific membrane antigen (PSMA). J Med Chem. 2008;51:4504-4517
170. Gujral TS, Karp RL, Finski A, Chan M, Schwartz PE, MacBeath G. et al. Profiling phospho-signaling networks in breast cancer using reverse-phase protein arrays. Oncogene. 2013;32:3470-3476
171. Giles KM, Kalinowski FC, Candy PA, Epis MR, Zhang PM, Redfern AD. et al. Axl mediates acquired resistance of head and neck cancer cells to the epidermal growth factor receptor inhibitor erlotinib. Mol Cancer Ther. 2013;12:2541-2558
172. Zhang Z, Lee JC, Lin L, Olivas V, Au V, LaFramboise T. et al. Activation of the AXL kinase causes resistance to EGFR-targeted therapy in lung cancer. Nat Genet. 2012;44:852-860
173. Liu S, Li D, Guo J, Canale N, Li X, Liu R. et al. Design, synthesis, and validation of Axl-targeted monoclonal antibody probe for microPET imaging in human lung cancer xenograft. Mol Pharm. 2014;11:3974-3979
174. Li D, Liu S, Liu R, Park R, Yu H, Krasnoperov V. et al. Axl-targeted cancer imaging with humanized antibody h173. Mol Imaging Biol. 2014;16:511-518
175. Li J, Lu Y, Akbani R, Ju Z, Roebuck PL, Liu W. et al. TCPA: a resource for cancer functional proteomics data. Nat Methods. 2013;10:1046-1047
176. Şenbabaoğlu Y, Sümer SO, Sánchez-Vega F, Bemis D, Ciriello G, Schultz N. et al. A Multi-method approach for proteomic network inference in 11 human cancers. PLoS Comput Biol. 2016;12:e1004765
177. Ong S-E, Blagoev B, Kratchmarova I, Kristensen DB, Steen H, Pandey A. et al. Stable isotope labeling by amino acids in cell culture, SILAC, as a simple and accurate approach to expression proteomics. GMol Cell Proteomics. 2002;1:376-386
178. Geiger T, Cox J, Ostasiewicz P, Wisniewski JR, Mann M. Super-SILAC mix for quantitative proteomics of human tumor tissue. Nat Methods. 2010;7:383-385
179. Boyer AP, Collier TS, Vidavsky I, Bose R. Quantitative proteomics with siRNA screening identifies novel mechanisms of trastuzumab resistance in HER2 amplified breast cancers. Mol Cell Proteomics. 2012;12:180-193
180. Kani K, Faca VM, Hughes LD, Zhang W, Fang Q, Shahbaba B. et al. Quantitative proteomic profiling identifies protein correlates to EGFR kinase inhibition. Mol Cancer Ther. 2012;11:1071-1081
181. Hennrich MLM, Gavin AA. Quantitative mass spectrometry of posttranslational modifications: Keys to confidence. Sci Signal. 2015;8:1-5
182. Tzouros M, Golling S, Avila D, Lamerz J, Berrera M, Ebeling M. et al. Development of a 5-plex SILAC method tuned for the quantitation of tyrosine phosphorylation dynamics. Mol Cell Proteomics. 2013;12:3339-3349
183. Zhang X, Belkina N, Jacob HKC, Maity T, Biswas R, Venugopalan A. et al. Identifying novel targets of oncogenic EGF receptor signaling in lung cancer through global phosphoproteomics. Proteomics. 2015;15:340-355
184. Harsha HC, Jimeno A, Molina H, Mihalas AB, Goggins MG, Hruban RH. et al. Activated epidermal growth factor receptor as a novel target in pancreatic cancer therapy. J Proteome Res. 2008;7:4651-4658
Author contact
![]() Corresponding authors: Elisabeth G.E. de Vries, MD, PhD, Marcel A.T.M. van Vugt, PhD, Department of Medical Oncology, University of Groningen, University Medical Center Groningen, P.O. Box 30.001, 9700 RB Groningen, The Netherlands +31 50 3612934 (EGEdV) / +31 50 3615002 (MATMvV) e.ge.de.vriesnl / m.vugtnl
Corresponding authors: Elisabeth G.E. de Vries, MD, PhD, Marcel A.T.M. van Vugt, PhD, Department of Medical Oncology, University of Groningen, University Medical Center Groningen, P.O. Box 30.001, 9700 RB Groningen, The Netherlands +31 50 3612934 (EGEdV) / +31 50 3615002 (MATMvV) e.ge.de.vriesnl / m.vugtnl