Impact Factor
- Issue 14; 2026
- Issue 13; 2026
- Issue 12; 2026
- Issue 11; 2026
- Issue 10; 2026
- Volume 16; 2026
- Advance Articles
- Past Issues
- Cover Images
- Cover Suggestion
- Index & Coverage
- Special Issues
Introduction
Results
Discussion
Materials and methods
Supplementary Material
Acknowledgements
References
International Journal of Biological Sciences
International Journal of Medical Sciences
 Global reach, higher impact

Theranostics 2017; 7(6):1663-1673. doi:10.7150/thno.17886 This issue Cite
Research Paper
MiR-200c Inhibits the Tumor Progression of Glioma via Targeting Moesin
Yuanyuan Qin1, 2, 3*, Weilong Chen1, 2*, Bingjie Liu1, 2, 3, Lei Zhou1, 2, Lu Deng1, 2, Wanxiang Niu4, Dejun Bao4, Chuandong Cheng4, Dongxue Li4, Suling Liu5, 6 ![]() , Chaoshi Niu3, 4, 7
, Chaoshi Niu3, 4, 7 ![]()
1. The CAS Key Laboratory of Innate Immunity and Chronic Disease, Hefei National Laboratory for Physical Sciences at the Microscale, School of Life Sciences, University of Science and Technology of China, Hefei, Anhui 230027, China;
2. Innovation Center for Cell Signaling Network;
3. Medical Center, University of Science and Technology of China, Hefei, Anhui, P.R. China;
4. Department of Neurosurgery, Anhui Provincial Hospital Affiliated to Anhui Medical University, Hefei, Anhui 230001, P.R. China;
5. Key Laboratory of Breast Cancer in Shanghai, Cancer Institute, Department of Breast Surgery, Fudan University Shanghai Cancer Center, Shanghai 200032, China;
6. Institutes of Biomedical Sciences, Fudan University, Shanghai 200032, China;
7. AnHui Province Key Laboratory of Brain Function and Brain Disease, Hefei, Anhui 230001, P.R. China.
* These authors contributed equally to this article.
Received 2016-10-11; Accepted 2017-2-8; Published 2017-4-10
Abstract

We attempt to demonstrate the regulatory role of miR-200c in glioma progression and its mechanisms behind. Here, we show that miR-200c expression was significantly reduced in the glioma tissues compared to paratumor tissues, especially in malignant glioma. Exogenous overexpression of miR-200c inhibited the proliferation and invasion of glioma cells. In addition, the in vivo mouse xenograft model showed that miR-200c inhibited glioma growth and liver metastasis, which is mainly regulated by targeting moesin (MSN). We demonstrated that the expression of MSN in glioma specimens were negatively correlated with miR-200c expression, and MSN overexpression rescued the phenotype about cell proliferation and invasion induced by miR-200c. Moreover, knockdown of MSN was able to mimic the effects induced by miR-200c in glioma cells. These results indicate that miR-200c plays an important role in the regulation of glioma through targeting MSN.
Keywords: glioma, miR-200c, moesin.
Introduction
Glioma, which is the most common intracranial tumor, originated in the glial cells. Glioma can be divided into gradeⅠto grade Ⅳ according to the classification of the World Health Organization [1,2]. The most malignant glioma, grade Ⅳ glioblastoma in adults and grade Ⅳ medulloblastoma which occurs in children, have a dismal prognosis [3,4]. Because of the characteristics of the invasive growth of glioma, it has no obvious boundaries with normal brain tissue [5, 6], and is difficult to be removed completely and easy to relapse owing to resistance of radiotherapy and chemotherapy, so the brain glioma is still one of the most malignant tumors [7-9]. New breakthrough in the treatment of glioma is critical.
microRNAs are small non-coding RNAs, which post-transcriptionally regulate the downstream gene expression [10-12]. Most importantly, the complicated regulatory network not only regulates the expression of multiple genes through one microRNA, but also allows the combination of several microRNAs to regulate one gene [13-15]. Recent studies show that microRNA expression is associated with a variety of human cancers progression [16-19]. microRNAs can regulate the expression of tumor related genes, and act as a tumor suppressor gene or an oncogene, playing an important role in the diagnosis and treatment of cancer.
miR-200c belongs to the miR-200 family [20-22], which can be divided into two subfamilies according to its seed sequence: miR-200a, miR-141 and miR-200b, miR-200c, miR-429 [23-26]. The seed sequence determines the similarities and differences of the function of these microRNAs. In recent years, a large number of studies have shown that miR-200c expression disorders in a variety of tumors [27-31]. Many researchers have shown that miR-200c inhibits the expression of transcription factors ZEB1 and ZEB2. ZEB1 and ZEB2 downregulate the expression of E-cadherin and reduce the adhesion of cells, thus promoting the invasion and metastasis of tumor cells [32-35]. MSN, also known as moesin, belongs to ERM family of proteins which appear to function as a cross-linker between membrane proteins and actin-based cytoskeleton [36-39], therefore, it is momentous for recognition between cells, also vital for cell polarity [40, 41]. In recent years, lots of evidences indicated that MSN is closely related to initiation and development of tumor [42-44]. Since miR-200c has been reported very important in some cancer such as breast cancer [25, 29, 30], and our preliminary data showed that miR-200c was downregulated in glioma, however, the mechanism of miR-200c regulating glioma remains unclear, it is urgent to further investigate the effects of miR-200c on glioma growth and unravel the potential mechanism.
In this study, we discovered that miR-200c is significantly downregulated in glioma samples including cell lines and the clinical specimens. With miR-200c overexpression, the cell proliferation, invasion and soft agar colony formation ability were decreased significantly, and tumor growth was suppressed. In addition, we demonstrated that MSN, the miR-200c target gene, plays a very important role in this process.
Results
The expression of miR-200c is reversely correlated with glioma grade
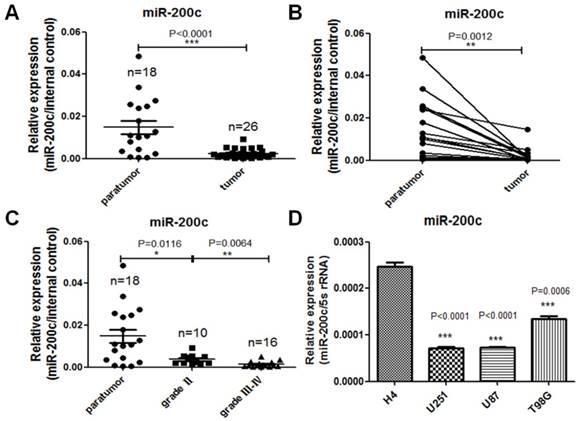
In order to investigate the expression difference of miR-200c in glioma and the paratumor tissues, we detected miR-200c levels in 26 glioma tissues, 18 paratumor tissues adjacent to the tumor and 4 glioma cell lines with different grades by qRT-PCR. Our studies show that miR-200c expression level was much lower in glioma compared to the paratumors (Figure 1A). Moreover, for each pair of paratumor and glioma tissue derived from the same patient, miR-200c was down-regulated in glioma tissues significantly (Figure 1B). According to the World Health Organization standard, glioma can be divided into four grades, and the most malignant glioma are grade III and grade IV. Based on this standard, grade III and grade IV tumors had the lowest expression levels of miR-200c (Figure 1C). The similar results were also obtained in the four glioma cell lines, among which miR-200c level is higher in low grade cell line H4 than glioblastoma cell lines (U251,U87,T98G) belonging to grade Ⅳ, high grade (Figure 1D). These results demonstrated that miR-200c levels were negatively correlated with malignancy of glioma.
miR-200c expression is reversely correlated with the malignancy of glioma. A, RNA was extracted from patients' paratumor and glioma tissues, and then reversely transcribed to cDNA. miR-200c expression level was measured by qRT-PCR. There were eight cases of glioma tissues that had no corresponding paratumor tissues. n stands for total numbers of patients. B, The two connected dots represent the miR-200c levels in glioma tissues and paratumor isolated from the same patient. C, Dividing glioma samples in A chart according to the grade of glioma. D, miR-200c expression level was measured in four different glioma cell lines by qRT-PCR. *, P < 0.05. **, P < 0.01. ***, P < 0.001. Error bars, mean ± SEM.
miR-200c overexpression inhibits cell proliferation and anchorage-independent growth in vitro
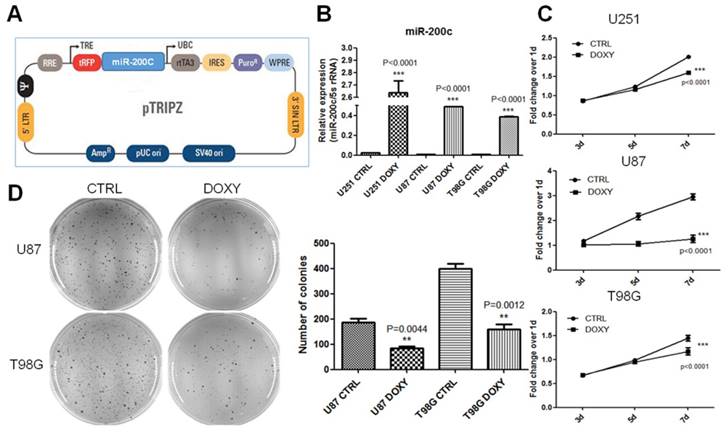
In order to investigate the role of miR-200c in tumor growth of glioma, we constructed the miR-200c overexpression system by using the doxycycline (DOXY) inducible pTRIPZ (Figure 2A). qRT-PCR assay suggested miR-200c was significantly upregulated in glioma cells after DOXY induction (Figure 2B). To be rigorous, we have checked the induction efficiency of miR-200c overexpression after induction for different periods (24 hours, 3 days, 3 weeks) and the results showed significant overexpression at all time points (Figure S2). MTT assay suggested induction of miR-200c significantly inhibited cell proliferation of glioma (Figure 2C). Soft agar growth assay suggested miR-200c overexpression inhibited the anchorage-independent growth of tumor cells by more than 50% (Figure 2D). These results suggested that miR-200c acts as a tumor suppressor for glioma in vitro.
miR-200c overexpression significantly inhibits cell proliferation and anchorage-independent growth in vitro. A, The diagram of Doxycycline-inducible miR-200c overexpression lentiviral vector (pTRIPZ-miR-200c). B, Different cell lines were transduced with the pTRIPZ-miR-200c lentivirus and selected with puromycin for 7 days (T98G and U251, 5ug/ml puromycin; U87, 10ug/ml puromycin). Cells were treated with Doxycycline (DOXY, pTRIPZ-miR-200c-DOXY) or without Doxycycline (CTRL, pTRIPZ-miR-200c-CTRL). Total RNA was isolated and miR-200c expression levels were measured by qRT-PCR. C, Eight hundreds of lentivirus-transduced cells were seeded in 96-well culture plates and cultured in the absence (CTRL) and presence (DOXY) of doxycycline for 3, 5 or 7 days. MTT assays were conducted following the manufacturer's protocol and the optical density (OD) value was measured at 490 nm. D, The soft agar colony formation assay(left) was carried out with 8X10³~1X10⁴ cells per well in 6-well culture plates and the cells were cultured in the absence (CTRL) and presence (DOXY) of doxycycline for 1 month approximately. And colonies were counted in the whole field (right). **, P < 0.01. ***, P < 0.001. Error bars, mean ± SEM.
miR-200c inhibits cell invasion and induces epithelial phenotype in vitro
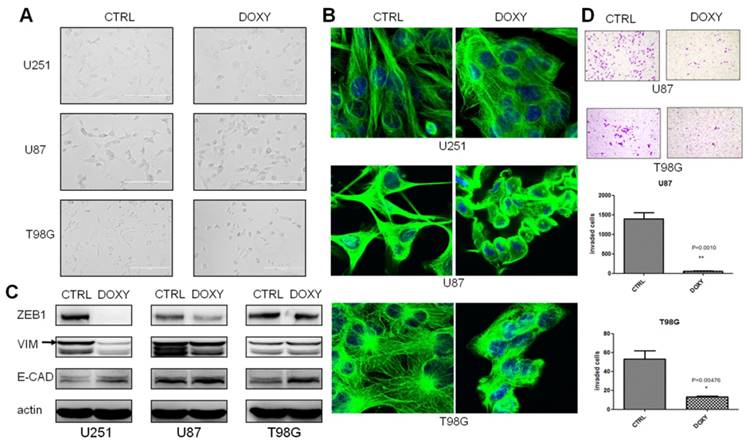
We observed obvious cell morphology change in the third week after miR-200c overexpression. Cells were changed from mesenchymal morphology to epithelial morphology (Figure 3A). β-tubulin antibody was used to stain microtubules by immune fluorescence to observe cell morphology with confocal microscope to further confirm the morphological alterations (Figure 3B). To determine whether miR-200c induced mesenchymal-epithelial transition (MET), we analyzed the expression of the mesenchymal markers ZEB1 and Vimentin (VIM) and epithelial marker E-Cadherin (E-CAD). Western blot assay showed miR-200c overexpression increased E-CAD expression, and decreased ZEB1 expression in U87 and U251 cell lines. But VIM was descended only in U251 (Figure 3C). MET always accompanies alteration of cellular invasion and metastasis. Therefore, we tested the effect of miR-200c on invasion of glioma cells. miR-200c overexpression dramatically inhibited the cell invasion of U87 and T98G (Figure 3D). However, invasion of U251 cells hardly occurred with our standardized protocol of invasion assay, so statistics not gained.
miR-200c overexpression significantly inhibits cell invasion as well as induces epithelial phenotype in vitro. A, Cell morphology was captured with optical microscope after culturing in the absence (CTRL) and presence (DOXY) of doxycycline for 3 weeks. B, Representative confocal images of cell morphology. Green, β-tubulin. Blue, DAPI for nucleus. C, After culturing in the absence (CTRL) and presence (DOXY) of doxycycline for 3 weeks, western blot was carried out to detect the expression levels of ZEB1, E-Cadherin (E-CAD) and Vimentin (VIM). The band as indicated by the arrow is the correct band. D, T98G and U87 were cultured in the absence (CTRL) and presence (DOXY) of doxycycline for 3 weeks in vitro, and then the invasive ability of the cells was investigated with the matrigel invasion assay according to the manufacturer's protocol(top). Quantitative analysis of the total invasive cells from three independent experiments was shown on the bottom. *, P < 0.05. **, P < 0.01. Error bars, mean ± SEM.
miR-200c inhibits tumor growth and metastasis in vivo
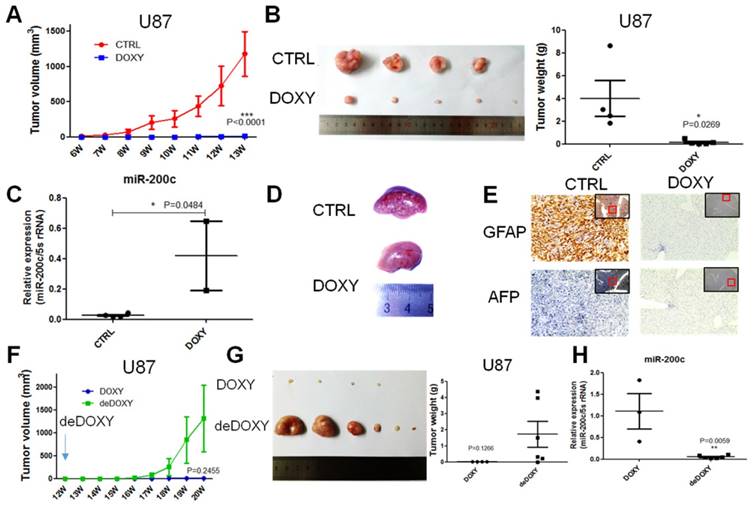
In vitro, miR-200c significantly repressed cell proliferation and invasion. Whether miR-200c could regulate tumor growth and metastasis in vivo must be further demonstrated. One million U87-miR-200c CTRL cells were implanted to the two flanks of nude mice per site subcutaneously, and mice were divided into two groups. CTRL group was supplied with 2.5% sucrose of water, while the DOXY group was supplied with 2.5% sucrose of water containing 1mg/ml doxycycline. The tumor was monitored and measured weekly. miR-200c overexpression significantly inhibited tumor growth, and the volume of tumor derived from U87 with miR-200c overexpression was significantly smaller than tumor derived from CTRL group (Figure 4A). We dissected the mice to harvest the tumors and noticed that tumors from CTRL group were significantly larger and heavier than the DOXY group (Figure 4B). miR-200c levels in the collected tumors were also measured by qRT-PCR, and showed that miR-200c was overexpressed in tumors of DOXY group indeed (Figure 4C), confirming miR-200c inhibited glioma growth. Interestingly, when dissecting mice, there was an obvious difference in the pathological lesions of liver between CTRL group and DOXY group (Figure 4D). Subsequently, we analyzed the expression of GFAP and AFP in paraffin sections of the liver by immunohistochemical staining (IHC). GFAP is glial fibrillary acidic protein, and is used to determine whether tumor is derived from glial. AFP, alpha-fetoprotein, is used as the marker of liver tumor. IHC assay suggested that the liver of CTRL group was GFAP positive and AFP negative, while the liver of DOXY group was double negative (Figure 4E). This illustrates that there are metastasis lesions in CTRL group, while overexpression of miR-200c significantly inhibited metastasis. Furthermore, we keep some of the tumor-absent mice from DOXY group alive and equally divide them into two groups. DOXY was abrogated in one group (deDOXY) and continued in another group (DOXY). It is revealed that the tumors in the deDOXY group grew up and bigger than the DOXY group after withdrawing the doxycycline (Figure 4F), and the tumor volume and tumor weight was larger and higher than that of in DOXY group (Figure 4G). miR-200c levels in the tumors of deDOXY group were decreased as expected (Figure 4H). These results suggested that miR-200c inhibited glioma tumor growth and metastasis, and the efficacy of this inhibition only be maintained in the presence of miR-200c overexpression.
miR-200c overexpression inhibits the tumor growth and metastasis of U87 cells in vivo. A, One million U87 control cells (pTRIPZ-miR-200c-CTRL) were implanted into two flanks of nude mice per site, and then we divided the mice into two groups. DOXY group was supplied with drinking water containing DOXY(1mg/ml). The volume of tumor was measured once a week. B, The tumors of CTRL and DOXY group were taken out at the end of treatment, and the tumor images (left) and tumor weight (right) are shown, n=6. Here, in the CTRL group, there are only four tumors because the CTRL tumor grow more rapidly. For humanitarian consideration, a mouse with large tumors was sacrificed in advance, so these two tumors were not added to the photograph. Number of tumors in other group less than six indicated there was no tumor initiation in some injection sites. C, We took out the part of the tumor to carry out the RNA extraction and qRT-PCR. miR-200c expression level was shown. D, Representative liver images of CTRL group and DOXY group. E, We took out the liver of CTRL group and DOXY group, embedded in paraffin, and stained with GFAP and AFP. The red framed squares refer to the area where the enlarged image is located. F, We divided the DOXY group into two groups. DOXY of one group was removed from drinking water (deDOXY). The volume of tumor was measured once a week. G, The tumors of DOXY and deDOXY group were taken out, and the tumor images (left) and tumor weight (right) are shown, n=6. Number of tumors less than six indicated there was no tumor initiation in some injection sites. H, The miR-200c expression level of DOXY and deDOXY measured by qRT-PCR. *, P < 0.05. **, P < 0.01. ***, P < 0.001. Error bars, mean ± SEM.
miR-200c directly binds to the 3'UTR of MSN
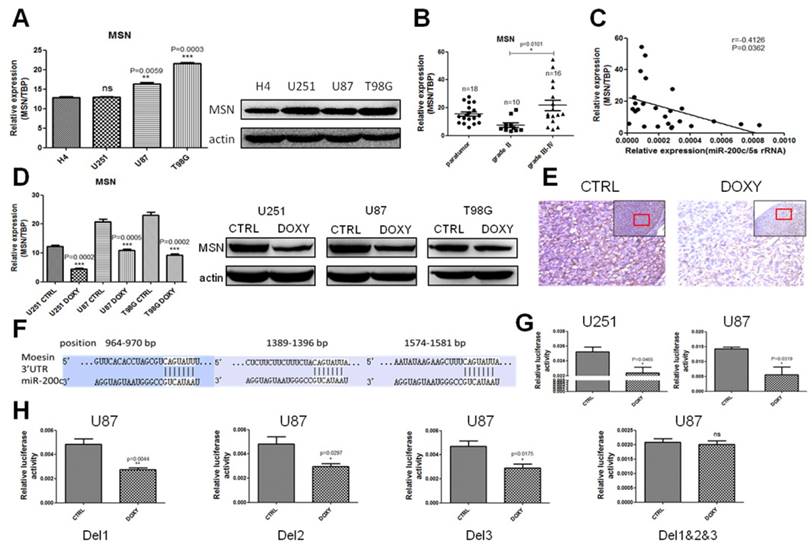
microRNAs generally regulate target gene expression by directly binding to its 3'UTR region. Targetscan and miRBase were used to predict the target genes of miR-200c, and inspired us that MSN might be the target of miR-200c. qRT-PCR and western blot assay suggested MSN was lower in the low grade glioma cell line H4 compared to the high grade glioma cell lines (Figure 5A). MSN was high expressed in grade III-IV glioma samples compared to the grade Ⅱ glioma samples by analyzing MSN levels in glioma specimens (Figure 5B). We also analyzed the correlation between miR-200c levels and MSN levels in glioma specimens. It clearly showed that there was a negative correlation between miR-200c levels and MSN levels (Figure 5C). In addition, MSN was significantly downregulated when miR-200c was overexpressed in glioma cell lines (Figure 5D). IHC staining using tumors derived from U87 with miR-200c overexpression or CTRL suggested MSN was downregulated when miR-200c was overexpressed (Figure 5E). These results suggested that MSN might be a target gene of miR-200c. Sequence aligning showed that the 3'UTR of MSN did exist three regions to which the miR-200c seed sequences may combine (Figure 5F). In order to study whether miR-200c directly bound to the 3'UTR of MSN and regulate MSN expression, we cloned the 3'UTR of MSN to the downstream of luciferase reportor gene. Luciferase activity assay suggested miR-200c overexpression could significantly reduce the activity of luciferase (Figure 5G). Then, we deleted the single or three miR-200c binding sites in the MSN 3'UTR, and brought about that simultaneous deletions of three binding sites could completely block the regulation of miR-200c on MSN (Figure 5H). However, the deletion of each site alone could not abolish the repression of miR-200c on MSN. This phenomenon might be accounted for the reciprocal compensations among the three binding regions (Figure 5H). Taken together, our results indicate miR-200c regulated MSN by binding to the 3'UTR region directly.
MSN is a direct and functional target of miR-200c. A, The expression level of MSN was detected by qRT-PCR (left) and western blot (right) in different grades of glioma cell lines. B, RNA was extracted from patients' glioma tissues, and MSN expression level was measured by qRT-PCR. n stands for total numbers of patients. C, The correlation analysis of miR-200c and MSN expressions. D, The expression level of MSN after overexpressing miR-200c measured by qRT-PCR (left) and western blot (right). E, The expression of MSN measured by IHC. The red framed squares refer to the area where the enlarged image is located. F, Predicted miR-200c target sequences in 3'UTR of MSN. G, The pGL3-MSN-3'UTR plasmids and internal-control renilla plasmids were transiently transfected into pTRIPZ-miR-200c cell lines, then cells were seeded in 96-well culture plates, 2X10⁴ cells per well in the absence (CTRL) and presence (DOXY) of doxycycline for 36h. The relative luciferase activity is defined as the value of activity of luciferase gene folded over internal control. H, We deleted the single (Del1, Del2, Del3) or three (Del1&2&3) miR-200c possible binding regions of MSN 3'UTR. The relative luciferase activity is shown. *, P < 0.05. **, P < 0.01. ***, P < 0.001. Error bars, mean ± SEM.
The effect of miR-200c on glioma is rescued by MSN overexpression
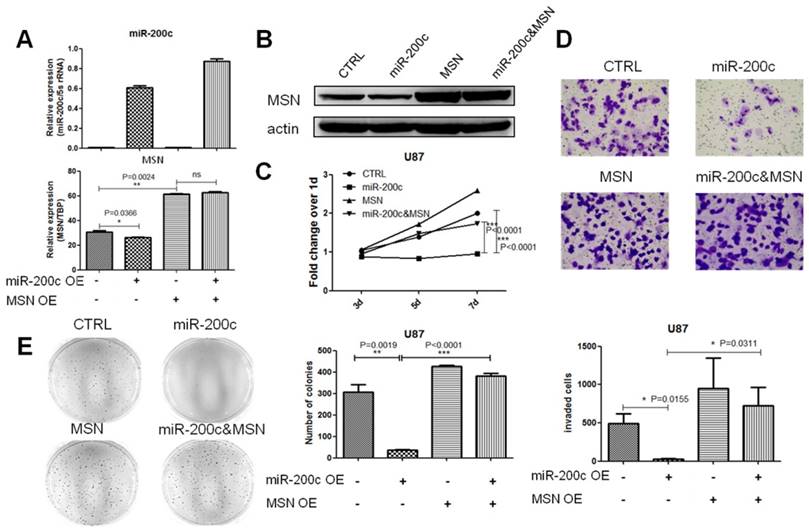
In order to explore whether miR-200c inhibited glioma proliferation and invasion through inhibiting MSN, we constructed a cell line overexpressing miR-200c and MSN without 3'UTR simultaneously in U87. qRT-PCR and western blot assay showed MSN was upregulated and was not inhibited by miR-200c (Figure 6A and 6B). MTT assay, transwell invasion assay and soft agar growth assay revealed that MSN overexpression promoted glioma cell proliferation and invasion. Double overexpression of miR-200c and MSN promoted glioma cell proliferation and invasion compared to miR-200 overexpression alone, confirming miR-200c inhibiting glioma cell proliferation and invasion by downregulating MSN and the phenotype caused by miR-200c overexpression could be recused by MSN overexpression (Figure 6C-6E).
The effect of miR-200c on glioma can be rescued by MSN overexpression. A, We obtained the ORF(open reading frame) region of MSN from full length cDNA of U87, and cloned it into pSIN-BSD(BSD, blasticidin resistant). MSN overexpression lentivirus was produced using 293T cell line, transfected U87 control cells (pTRIPZ-miR-200c-CTRL), and then selected with BSD for 15 days (10ug/ml). The expression level of miR-200c and MSN detected by qRT-PCR are shown. B, The expression level of MSN detected by western blot. C, Cell proliferation activity was measured by MTT assay as described. D, Cell invasion ability was measured by the matrigel invasion assay as described. The image (top) and quantitative analysis of the total invasive cells (bottom) are shown. E, Anchorage-independent growth ability was measured by the soft agar colony formation assay as described. The image (left) and quantitative analysis of colonies (right) are shown. *, P < 0.05. **, P < 0.01. ***, P < 0.001. Error bars, mean ± SEM.
MSN knockdown mimics the effects of miR-200c overexpression on cell invasion and proliferation of glioma cells
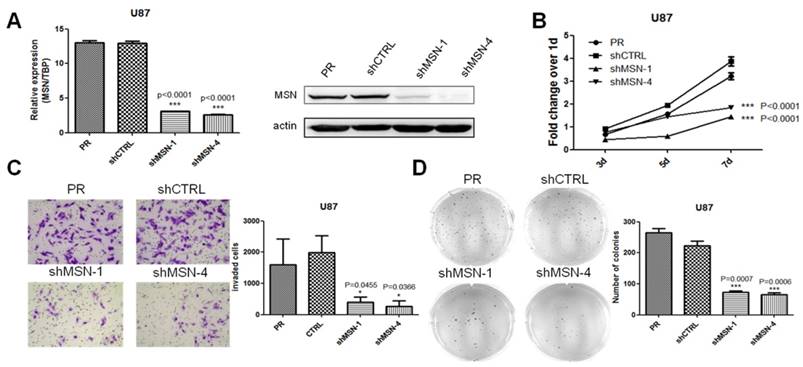
Repression of miR-200c on glioma cell proliferation and invasion by targeting MSN suggested MSN might regulate glioma progression. However, little is known about the role of MSN in glioma progression, and whether MSN knockdown could mimic the effects of miR-200c on glioma. Two different short hairpin RNAs (shRNA) were applied to knock down the expression of MSN in U87 cell line stably (Figure 7A). To define the role of MSN in glioma, the effect of MSN knockdown on tumor cell growth and invasion were examined (Figure 7B-7D). Stable knockdown of MSN in U87 inhibited cell proliferation and invasion, suggesting a probably oncogenic effect of MSN on glioma growth, and MSN knockdown has similar effects on glioma as miR-200c overexpression.
MSN knockdown mimics the effects of miR-200c on cell invasion and proliferation of glioma cells. A, To knock down MSN, shMSN and shCTRL lentivirus was produced using 293T cell lines, and transfected U87 cell lines, and then selected with puromycin for 7 days (10ug/ml) to obtained stable cell lines. The MSN expressing level was detected by qRT-PCR (left) and western blot(right). B, Cell proliferation activity was measured by MTT assay as described. C, Cell invasion ability was measured by the matrigel invasion assay as described, the image (left) and quantitative analysis of the total invasive cells (right) are shown. D, Anchorage-independent growth ability was measured by the soft agar colony formation assay as described. The image (left) and quantitative analysis of colonies (right) are shown. *, P < 0.05. ***, P < 0.001. Error bars, mean ± SEM.
Discussion
Glioma, especially the grade Ⅳ glioblastoma, predicts very poor prognosis [45]. Understanding and studying the molecular mechanisms of the glioma initiation and progression are important to develop the effective therapy strategies for glioma patients. Our results showed that there was a negative correlation between the expression of miR-200c in glioma and the tumor grade. In addition, miR-200c regulated the growth, invasion and metastasis of glioma cells.
It's been reported that miR-200c directly target some oncogenes, and the downregulation of miR-200c in tumor tissues leads to the upregulation of these target genes [46, 47]. Recent years, the study about the role of miR-200c in tumor progression has been widely carried out. miR-200c induces mesenchymal-epithelial-transitions (MET) of cancer cells by targeting the E-cadherin repressors, ZEB1 and ZEB2, thus reduces their aggressiveness [33]. miR-200c also inhibits melanoma cell proliferation, migration and drug resistance through downregulating Bmi-1 [48]. Beyond that, miR-200c induces CD95 associated apoptosis by targeting FAP-1 [49]. miR-200 family can repress breast cancer metastasis through moesin-dependent pathway, miR-200c can inhibit the metastasis of breast cancer by acting on MSN, but no significant effect on proliferation of breast cancer [50]. However, the function of miR-200c in glioma has not been well studied and the mechanisms are not clear. Our current study showed that MSN also played an important role in regulation of tumor cell proliferation. The reason for the divergence may be the following: first, they chose a high metastatic cell line focusing on tumor metastasis. From a different direction, we focus our research on invasion and proliferation. Second, our work was based on several different types of glioma tumor cells, illuminating the more universal function of miR-200c.
In our experiment, the expression of ZEB1 was not significantly down-regulated after miR-200c overexpression in T98G cell line. It was reported that ZEB1 is not only a marker of epithelial mesenchymal transition, but also has been reported to be targeted by miR-200c in many studies [20,33,34,50]. ZEB1 were significantly down-regulated after mir-200c overexpression in U251 and U87, but not in T98G, which might indicate that ZEB1, in T98G, is not significantly regulated by miR-200c. Furthermore, in T98G, regulation of ZEB1 may be stronger by other proteins or ncRNAs than by miR-200c and the complicated regulation network may weaken the effect of miR-200c on ZEB1. In addition, our results showed that MSN was down-regulated in all three cell lines, confirming that MSN, not ZEB1, plays a broader role in mediating miR-200c regulation on glioma development.
Although some important discoveries were revealed in our study, there were also some limits. First, we used a subcutaneous tumor model, this may lead to the consequences that we are not completely simulating the tumor microenvironment of glioma growth in vivo. But it is significant that miR-200c overexpression inhibited tumor metastasis in our study, although there are only a few clinical cases of distal metastasis of gliomas, which may provide a reference for other types of tumor metastasis. Second, according to the previous reports, N-terminal of MSN protein is FERM domain which can interact with the transmembrane receptor. C-terminal of MSN protein is F-actin binding domain which can interact with the cytoskeleton [37, 51], and the activated state of MSN through phosphorylation can act on downstream signaling pathways [52, 53]. As an oncogene, how MSN plays its role in the regulation of glioma by interacting with the downstream pathway is not yet clear, which is the field we will focus on in subsequent study.
Since miR-200c plays such an important regulatory role in glioma, together with the grade of gliomas, its expression can be used to predict the prognosis of patients. On the other hand, our study showed a positive correlation between MSN and the malignancy of glioma, reflecting its capacity of oncogenesis. It's shown that MSN stimulates the proliferation of glioma cells via interaction with CD44, probably being a potential therapeutic target [44]. If we can develop a drug targeting MSN or interfering the interaction between MSN and downstream proteins, it may be able to provide a new therapeutic approach for the treatment of glioma. Of course, these assumptions need more experimental data to validate and more supports from clinical data.
In summary, we described here that the low expression of miR-200c is associated with high grade glioma. Overexpression of miR-200c inhibits the growth, invasion and metastasis of glioma, and induces the occurrence of mesenchymal-epithelial-transitions (MET). MSN, as a direct target gene of miR-200c, plays a vital role in this process. These results may help us to better understand the mechanisms of miR-200c in regulating glioma, and might provide a novel therapeutic target for the clinical treatment of glioma.
Materials and methods
Human glioma specimens and paratumor tissues
All frozen human glioma samples used in this study were obtained from Anhui Provincial Hospital (Hefei, Anhui, China), and classified according to World Health Organization (WHO) standard, which includes paratumor tissue, grade II (low grade astrocytoma, oligodendroglioma, and ependymocytoma), grade III (anaplastic oligodendroglioma, anaplastic astrocytoma, and anaplastic ependymocytoma), and grade IV (Glioblastoma multiforme, and medulloblastoma) glioma tissues. Informed consent was obtained from all patients before surgery as advocated by the regional ethics committee.
Cell culture
The low grade glioma cell line H4 and glioblastoma cell line U251 were purchased from Cell Resource Center (CAMS/PUMC, Beijing, China). The glioblastoma cell lines U87 and T98G were purchased from ATCC. All of the cell lines were tested and authenticated. These cell lines were maintained at 37℃ in an atmosphere of 5% CO2 in Dulbecco's Modified Eagle Medium (Gibco, USA) supplemented with 10% FBS (Gibco, USA) and 1% pen-strep (Beyotime, China).
Tumorigenicity in nude mice
All nude mice were bred and housed in AAALAC-accredited specific pathogen-free rodent facilities at University of Science and Technology of China. Mice were housed in sterilized, ventilated microisolator cages and supplied with autoclaved commercial chow and sterile water. All mouse experiments were conducted in accordance with standard operating procedures approved by the University Committee on the Use and Care of Animals at University of Science and Technology of China. Tumorigenicity was determined by injecting U87-miR-200c CTRL cells with matrigel subcutaneously into the two flanks of one-month old female nude mice (1x10⁶ cells per site). The tumor number of each group is six. The animals were euthanized when the tumors were 1.0 - 1.5cm in diameter. A portion of each tumor was fixed in formalin and embedded in paraffin for histological analysis. Another portion was utilized for qRT-PCR analysis. The tumor sizes were measured once a week with a caliper, and calculated as tumor volume = Length x Width2 / 2. The organs were dissected for metastasis analysis.
Plasmid/short hairpin RNA construction and virus infection
pTRIPZ-miR-200c plasmids were purchased from Openbiosystems (USA). MSN was amplified from the reverse-transcribed cDNA from U87 cell line, and cloned into pSIN (puromycin resistant) vector which was purchased from Addgene, and then replaced the selection marker puromycin to blasticidin. The short hairpin RNAs (shRNAs) were purchased from Sigma, the sense sequence of shMSN-1 and shMSN-4 were designed as follows: shMSN-1: 5'-CCGGGCTAAATTGAAACCTGGAATTCTCGAGAATTCCAGGTTTCAATTTAGCTTTTTG-3', shMSN-4:5'-CCGGGCATTGACGAATTTGAGTCTACTCGAGTAGACTCAAATTCGTCAATGCTTTTTG-3'. A highly efficient lentiviral system was used to generate MSN-overexpressing plasmid DNA, and the MSN-shRNA plasmid DNA. The cell lines were infected with the lentiviruses and the stable cell lines were established. The lentiviral transfection efficiency was over 90% in all cell lines.
Western blot
For sample preparation, when the cell culture reaches to 80% confluence, the cells were collected and split for 40 minutes on ice, the supernatant was denatured in 5x loading buffer containing SDS in boiling water for 10 minutes. 5% non-fat dry milk dissolved in TBST (TBS containing 0.1% Tween-20) was used for blocking and antibody dilution. The following antibodies and dilutions were used: ZEB1 (1:500, 21544-1-AP, Proteintech), VIM (1:1000, 5741s, Cell Signaling Technology), E-CAD (1:1000, 20874-1-AP, Proteintech), actin (1:1000, HC201, TransGen), MSN (1:2000, EP1863Y, abcam), goat anti-mouse IgG-HRP (1:5000, sc-2005, Santa Cruz), goat anti-rabbit IgG (1:5000, sc-2004, Santa Cruz). Western HRP Substrate (WBLUF0500, Millipore) was used to detect horseradish peroxidase conjugated secondary antibodies.
MTT assay
Eight hundreds of cells were seeded in 96-well culture plates, and cultured for 3, 5, or 7 days. MTT (M-2128, Sigma) was added to reach the final concentration of 0.5mg/ml, and the cells were incubated at 37 Celsius degree for 4 hours, and then the supernatant was removed and 100ul of DMSO was added, the optical density (OD) value was measured at 490 nm after shaking it for 10 minutes.
Invasion assay
Twenty thousand cells were seeded in the chambers with 8um pore size (0216, BD) coated with Matrigel (354234, Corning), and placed into 24-well culture plate. After 36 hours, cells in lower chambers were fixed and stained with 0.1% crystal violet, the invaded cells were photographed to analyze by microscope.
The soft agar colony formation assay
Eight thousand cells were seeded in 2 X medium mixed with soft agar, and cultured in the incubator for four weeks. Colonies were stained with 0.005% crystal violet, and then analyzed the number of colonies.
qRT-PCR
Total RNA was extracted with Trizol (Takara) and the RNA concentration was measured with Nanodrop (Thermos scientific). 1ug of RNA was reverse-transcripted to cDNA using ReverTra Ace qPCR RT Kit (FSQ-101, TOYOBO). miR-200c was reverse-transcripted using primers with specificity. qRT-PCR was carried out to detect the expression level of miR-200c or other genes using AceQ qPCR SYBR Green Master Mix (Q111, Vazyme). Real time PCR data for mRNA and miR-200c are expressed relative to reference gene, respectively. The formula of relative expression value was as follows: 2 (-ΔCt). We used three reference genes, 5s rRNA, U6 and U24 when detecting the expression level of miR-200c in paratumor and glioma tissues. To verify the stability of these reference genes, we calculated and showed the mean values of reference genes with the standard deviations for glioma and paratumor tissues, and the results were shown in Figure S1. All primers used are provided in Table S1.
Immunohistochemistry
The tumor tissues or the livers of mice were fixed in formalin and processed for paraffin embedding. Sectioned samples were de-paraffined in xylene and rehydrated in graded alcohol. Antigen retrieval was done according to the manufacture's protocol (MVS-0100, Maxvision), and then the endogenous peroxidase was inactivated with 3% hydrogen peroxide methanol solution, blocked with animal non-immune serum (SP KIT-B, Maxvision) and incubated with primary antibodies overnight at 4℃, and then incubated with secondary antibodies for 15 minutes. Slides were stained using the detection kit (DAB-0031, Maxvision), cell nucleus was stained with hematoxylin (ZLI-9610, ZSGB-BIO). The following antibodies and dilutions were used for immunohistochemistry: MSN (1:150, EP1863Y, Abcam), peroxidase-conjugated secondary antibody (KIT-5010, Maxvision), GFAP (ZM-0118, ZSGB-BIO), AFP (ZM-0009, ZSGB-BIO).
Immune fluorescence staining and confocal imaging
Cells of 0.2 million were seeded in chamber (154526, Thermo Scientific), and cultured for two days. Cells were fixed with cold methanol, membrane perforated with 0.15% Triton X-100 (TB0198, Sangon Biotech), blocked with animal non-immune serum (SP KIT-B, Maxvision), and incubated with primary antibodies overnight at 4℃, and then incubated with secondary antibodies for one hour. Cell nucleus was stained with DAPI (P36931, Life Technologies). Images were captured with confocal microscope (LSM 710, Zeiss) with 100x oil objective lens. The following antibodies were used for immune fluorescence: β-tubulin (1:100, HC101, TransGen Biotech), goat anti-mouse IgG secondary antibody Alexa Fluor 488 (1:200, A-11029, Life Technologies).
Luciferase reportor assay
The 3'UTR of MSN was amplified from the reverse-transcribed cDNA from U87 cell line and cloned into pGL3 3'UTR luciferase reportor plasmids. The pGL3-MSN-3'UTR and internal-control renilla plasmids were co-transfected into pTRIPZ-miR-200c cell lines using lipo3000 (L3000001, Invitrogen) according to the manufacturer's instructions. After 24 hours, cells were dissociated and seeded into 96 wells plates with or without DOXY. Luciferase activity was measured by bioluminescence meter (Veritas) using luciferase assay system (E2920, Promega).
Statistical analysis
Results are presented as the mean ± SEM for at least three repeated individual experiments for each group, the student's t-test was used to compare the difference of two samples. P-value < 0.05 was considered significant.
Supplementary Material
Supplementary figures and tables.
Acknowledgements
This study was supported by the National Key Research and Development Program of China (Stem Cell and Translational Research 2016YFA0101202), the MOST grant (2015CB553800), NSFC grants (81530075, 81472741 and 81322033), the Science and Technology Project grant from Anhui Province (No:1506c085017, No: 1606c08235, No:1604a0802069) and the Fundamental Research Funds for the Central Universities (WK2070000034).
Competing Interests
The authors have declared that no competing interest exists.
References
1. Louis DN, Ohgaki H, Wiestler OD, Cavenee WK, Burger PC, Jouvet A. et al. The 2007 WHO classification of tumours of the central nervous system. Acta Neuropathol. 2007;114:97-109
2. Yan H, Parsons DW, Jin G, McLendon R, Rasheed BA, Yuan W. et al. IDH1 and IDH2 mutations in gliomas. N Engl J Med. 2009;360:765-73
3. Kanzawa T, Germano I, Komata T, Ito H, Kondo Y, Kondo S. Role of autophagy in temozolomide-induced cytotoxicity for malignant glioma cells. Cell Death Differ. 2004;11:448-57
4. Cobbs CS, Harkins L, Samanta M, Gillespie GY, Bharara S, King PH. et al. Human cytomegalovirus infection and expression in human malignant glioma. Cancer Res. 2002;62:3347-50
5. Yuan J, Liu L, Hu Q. Mathematical modeling of brain glioma growth using modified reaction-diffusion equation on brain MR images. Comput Biol Med. 2013;43:2007-13
6. Yu S-Q, Wang J-S, Chen S-Y, Liu X-M, Li Y, Ding Y-M. et al. Diagnostic significance of intraoperative ultrasound contrast in evaluating the resection degree of brain glioma by transmission electron microscopic examination. Chinese Med J-Peking. 2015;128:186-90
7. Chakravarti A, Chakladar A, Delaney MA, Latham DE, Loeffler JS. The epidermal growth factor receptor pathway mediates resistance to sequential administration of radiation and chemotherapy in primary human glioblastoma cells in a RAS-dependent manner. Cancer Res. 2002;62:4307-15
8. Frosina G. DNA repair and resistance of gliomas to chemotherapy and radiotherapy. Mol Cancer Res. 2009;7:989-99
9. Lomonaco SL, Finniss S, Xiang C, DeCarvalho A, Umansky F, Kalkanis SN. et al. The induction of autophagy by γ-radiation contributes to the radioresistance of glioma stem cells. Int J Cancer. 2009;125:717-22
10. Bartel DP. MicroRNAs: genomics, biogenesis, mechanism, and function. cell. 2004;116:281-97
11. Deng L, Shang L, Bai S, Chen J, He X, Martin-Trevino R. et al. MicroRNA100 inhibits self-renewal of breast cancer stem-like cells and breast tumor development. Cancer Res. 2014;74:6648-60
12. Ke J, Zhao Z, Hong S-H, Bai S, He Z, Malik F. et al. Role of microRNA221 in regulating normal mammary epithelial hierarchy and breast cancer stem-like cells. Oncotarget. 2015;6:3709-21
13. Zhu S, Wu H, Wu F, Nie D, Sheng S, Mo Y-Y. MicroRNA-21 targets tumor suppressor genes in invasion and metastasis. Cell Res. 2008;18:350-9
14. Zhu S, Si M-L, Wu H, Mo Y-Y. MicroRNA-21 targets the tumor suppressor gene tropomyosin 1 (TPM1). J Biol Chem. 2007;282:14328-36
15. Bartel DP, Chen C-Z. Micromanagers of gene expression: the potentially widespread influence of metazoan microRNAs. Nat Rev Genet. 2004;5:396-400
16. Lujambio A, Ropero S, Ballestar E, Fraga MF, Cerrato C, Setién F. et al. Genetic unmasking of an epigenetically silenced microRNA in human cancer cells. Cancer Res. 2007;67:1424-9
17. Saito Y, Liang G, Egger G, Friedman JM, Chuang JC, Coetzee GA. et al. Specific activation of microRNA-127 with downregulation of the proto-oncogene BCL6 by chromatin-modifying drugs in human cancer cells. Cancer cell. 2006;9:435-43
18. Calin GA, Croce CM. MicroRNA signatures in human cancers. Nat Rev Cancer. 2006;6:857-66
19. Wong H-KA, El Fatimy R, Onodera C, Wei Z, Yi M, Mohan A. et al. The cancer genome atlas analysis predicts MicroRNA for targeting cancer growth and vascularization in glioblastoma. Mol Ther. 2015;23:1234-47
20. Gregory PA, Bert AG, Paterson EL, Barry SC, Tsykin A, Farshid G. et al. The miR-200 family and miR-205 regulate epithelial to mesenchymal transition by targeting ZEB1 and SIP1. Nat Cell Biol. 2008;10:593-601
21. Wiklund ED, Bramsen JB, Hulf T, Dyrskjøt L, Ramanathan R, Hansen TB. et al. Coordinated epigenetic repression of the miR-200 family and miR-205 in invasive bladder cancer. Int J Cancer. 2011;128:1327-34
22. Gibbons DL, Lin W, Creighton CJ, Rizvi ZH, Gregory PA, Goodall GJ. et al. Contextual extracellular cues promote tumor cell EMT and metastasis by regulating miR-200 family expression. Gene Dev. 2009;23:2140-51
23. Nam EJ, Yoon H, Kim SW, Kim H, Kim YT, Kim JH. et al. MicroRNA expression profiles in serous ovarian carcinoma. Clin Cancer Res. 2008;14:2690-5
24. Vrba L, Jensen TJ, Garbe JC, Heimark RL, Cress AE, Dickinson S. et al. Role for DNA methylation in the regulation of miR-200c and miR-141 expression in normal and cancer cells. PloS one. 2010;5:e8697
25. Bendoraite A, Knouf EC, Garg KS, Parkin RK, Kroh EM, O'Briant KC. et al. Regulation of miR-200 family microRNAs and ZEB transcription factors in ovarian cancer: evidence supporting a mesothelial-to-epithelial transition. Gynecol Oncol. 2010;116:117-25
26. Eades G, Yao Y, Yang M, Zhang Y, Chumsri S, Zhou Q. miR-200a regulates SIRT1 expression and epithelial to mesenchymal transition (EMT)-like transformation in mammary epithelial cells. J Biol Chem. 2011;286:25992-6002
27. Ceppi P, Mudduluru G, Kumarswamy R, Rapa I, Scagliotti GV, Papotti M. et al. Loss of miR-200c expression induces an aggressive, invasive, and chemoresistant phenotype in non-small cell lung cancer. Mol Cancer Res. 2010;8:1207-16
28. Nakada C, Matsuura K, Tsukamoto Y, Tanigawa M, Yoshimoto T, Narimatsu T. et al. Genome-wide microRNA expression profiling in renal cell carcinoma: significant down-regulation of miR-141 and miR-200c. J Pathol. 2008;216:418-27
29. Shimono Y, Zabala M, Cho RW, Lobo N, Dalerba P, Qian D. et al. Downregulation of miRNA-200c links breast cancer stem cells with normal stem cells. Cell. 2009;138:592-603
30. Puhr M, Hoefer J, Schäfer G, Erb HH, Oh SJ, Klocker H. et al. Epithelial-to-mesenchymal transition leads to docetaxel resistance in prostate cancer and is mediated by reduced expression of miR-200c and miR-205. Am J Pathol. 2012;181:2188-201
31. Cittelly DM, Dimitrova I, Howe EN, Cochrane DR, Jean A, Spoelstra NS. et al. Restoration of miR-200c to ovarian cancer reduces tumor burden and increases sensitivity to paclitaxel. Mol Cancer Ther. 2012;11:2556-65
32. Hurteau GJ, Carlson JA, Spivack SD, Brock GJ. Overexpression of the microRNA hsa-miR-200c leads to reduced expression of transcription factor 8 and increased expression of E-cadherin. Cancer Res. 2007;67:7972-6
33. Korpal M, Lee ES, Hu G, Kang Y. The miR-200 family inhibits epithelial-mesenchymal transition and cancer cell migration by direct targeting of E-cadherin transcriptional repressors ZEB1 and ZEB2. J Biol Chem. 2008;283:14910-4
34. Chen ML, Liang LS, Wang XK. miR-200c inhibits invasion and migration in human colon cancer cells SW480/620 by targeting ZEB1. Clin Exp Metastas. 2012;29:457-69
35. Wellner U, Schubert J, Burk UC, Schmalhofer O, Zhu F, Sonntag A. et al. The EMT-activator ZEB1 promotes tumorigenicity by repressing stemness-inhibiting microRNAs. Nat Cell Biol. 2009;11:1487-95
36. Tsukita S, Yonemura S, Tsukita S. ERM (ezrin/radixin/moesin) family: from cytoskeleton to signal transduction. Curr Opin Cell Biol. 1997;9:70-5
37. Pearson MA, Reczek D, Bretscher A, Karplus PA. Structure of the ERM protein moesin reveals the FERM domain fold masked by an extended actin binding tail domain. Cell. 2000;101:259-70
38. Oda Y, Aishima S, Morimatsu K, Hayashi A, Shindo K, Fujino M. et al. Differential ezrin and phosphorylated ezrin expression profiles between pancreatic intraepithelial neoplasia, intraductal papillary mucinous neoplasm, and invasive ductal carcinoma of the pancreas. Hum Pathol. 2013;44:1487-98
39. Li Y-y, Zhou C-X, Gao Y. Moesin regulates the motility of oral cancer cells via MT1-MMP and E-cadherin/p120-catenin adhesion complex. Oral Oncol. 2015;51:935-43
40. Ning G, Bijron JG, Yuan J, Hirsch MS, McKeon FD, Nucci MR. et al. Differential expression of p-ERM, a marker of cell polarity, in benign and neoplastic oviductal epithelium. Int J Gynecol Pathol. 2013;32:345-52
41. Georgescu M-M, Cote G, Agarwal NK, White CL. NHERF1/EBP50 controls morphogenesis of 3D colonic glands by stabilizing PTEN and ezrin-radixin-moesin proteins at the apical membrane. Neoplasia. 2014;16:365-74 e2
42. Kobayashi H, Sagara J, Kurita H, Morifuji M, Ohishi M, Kurashina K. et al. Clinical significance of cellular distribution of moesin in patients with oral squamous cell carcinoma. Clin Cancer Res. 2004;10:572-80
43. DeSouza LV, Matta A, Karim Z, Mukherjee J, Wang XS, Krakovska O. et al. Role of moesin in hyaluronan induced cell migration in glioblastoma multiforme. Mol Cancer. 2013;12:1
44. Zhu X, Morales FC, Agarwal NK, Dogruluk T, Gagea M, Georgescu M-M. Moesin is a glioma progression marker that induces proliferation and Wnt/β-catenin pathway activation via interaction with CD44. Cancer Res. 2013;73:1142-55
45. Gupta T, Sarin R. Poor-prognosis high-grade gliomas: evolving an evidence-based standard of care. Lancet Oncol. 2002;3:557-64
46. Shenouda SK, Alahari SK. MicroRNA function in cancer: oncogene or a tumor suppressor? Cancer Metastasis Rev. 2009;28:369-78
47. Kan T, Meltzer SJ. MicroRNAs in Barrett's esophagus and esophageal adenocarcinoma. Curr Opin Pharmacol. 2009;9:727-32
48. Liu S, Tetzlaff MT, Cui R, Xu X. miR-200c inhibits melanoma progression and drug resistance through down-regulation of BMI-1. Am J Pathol. 2012;181:1823-35
49. Schickel R, Park S-M, Murmann AE, Peter ME. miR-200c regulates induction of apoptosis through CD95 by targeting FAP-1. Mol Cell. 2010;38:908-15
50. Li X, Roslan S, Johnstone C, Wright J, Bracken C, Anderson M. et al. MiR-200 can repress breast cancer metastasis through ZEB1-independent but moesin-dependent pathways. Oncogene. 2014;33:4077-88
51. Niggli V, Rossy J. Ezrin/radixin/moesin: versatile controllers of signaling molecules and of the cortical cytoskeleton. Int J Biochem Cell Biol. 2008;40:344-9
52. Nakamura F, Amieva MR, Furthmayr H. Phosphorylation of threonine 558 in the carboxyl-terminal actin-binding domain of moesin by thrombin activation of human platelets. J Biol Chem. 1995;270:31377-85
53. Carreno S, Kouranti I, Glusman ES, Fuller MT, Echard A, Payre F. Moesin and its activating kinase Slik are required for cortical stability and microtubule organization in mitotic cells. J Cell Biol. 2008;180:739-46
Author contact
![]() Corresponding authors: Suling Liu, Key Laboratory of Breast Cancer in Shanghai, Cancer Institute, Department of Breast Surgery, Fudan University Shanghai Cancer Center, Shanghai 200032, China; Tel/Fax: 086-21-34771023. Email: sulingedu.cn Chaoshi Niu, Department of Neurosurgery. Department of Neurosurgery, Anhui Provincial Hospital Affiliated to Anhui Medical University, Hefei, Anhui 230001, P.R. China; Email: niuchaoshicom
Corresponding authors: Suling Liu, Key Laboratory of Breast Cancer in Shanghai, Cancer Institute, Department of Breast Surgery, Fudan University Shanghai Cancer Center, Shanghai 200032, China; Tel/Fax: 086-21-34771023. Email: sulingedu.cn Chaoshi Niu, Department of Neurosurgery. Department of Neurosurgery, Anhui Provincial Hospital Affiliated to Anhui Medical University, Hefei, Anhui 230001, P.R. China; Email: niuchaoshicom