Impact Factor
- Issue 14; 2026
- Issue 13; 2026
- Issue 12; 2026
- Issue 11; 2026
- Issue 10; 2026
- Volume 16; 2026
- Advance Articles
- Past Issues
- Cover Images
- Cover Suggestion
- Index & Coverage
- Special Issues
Introduction
Materials and Methods
Results
Discussion
Conclusion
Supplementary Material
Acknowledgements
References
International Journal of Biological Sciences
International Journal of Medical Sciences
 Global reach, higher impact

Theranostics 2017; 7(6):1477-1488. doi:10.7150/thno.19099 This issue Cite
Research Paper
Theranostic Performance of Acoustic Nanodroplet Vaporization-Generated Bubbles in Tumor Intertissue
Yi-Ju Ho, Chih-Kuang Yeh ![]()
Department of Biomedical Engineering and Environmental Sciences, National Tsing Hua University, Hsinchu, Taiwan.
Received 2017-1-7; Accepted 2017-2-10; Published 2017-4-3
Abstract

Solid tumors with poorly perfused regions reveal some of the treatment limitations that restrict drug delivery and therapeutic efficacy. Acoustic droplet vaporization (ADV) has been applied to directly disrupt vessels and release nanodroplets, ADV-generated bubbles (ADV-Bs), and drugs into tumor tissue. In this study, we investigated the in vivo behavior of ADV-Bs stimulated by US, and evaluated the possibility of moving intertissue ADV-Bs into the poorly perfused regions of solid tumors. Intravital imaging revealed intertissue ADV-B formation, movement, and cavitation triggered by US, where the distance of intertissue ADV-B movement was 33-99 µm per pulse. When ADV-Bs were applied to tumor cells, the cell membrane was damaged, increasing cellular permeability or inducing cell death. The poorly perfused regions within solid tumors show enhancement due to ADV-B accumulation after application of US-triggered ADV-B. The intratumoral nanodroplet or ADV-B distribution around the poorly perfused regions with tumor necrosis or hypoxia were demonstrated by histological assessment. ADV-B formation, movement and cavitation could induce cell membrane damage by mechanical force providing a mechanism to overcome treatment limitations in poorly perfused regions of tumors.
Keywords: nanodroplets, intertissue bubbles, acoustic droplet vaporization, poorly perfused regions, bubble cavitation.
Introduction
Blood perfusion within tumors is an important source of oxygen and nutrition transport for assisting cell proliferation. The limited diffusion distance of oxygen is approximately 200 µm [1]. Since the rate of tumor cell proliferation is faster than that of angiogenesis, tumors have poorly perfused regions where there is hypoxia or necrosis due to insufficient oxygen and nutrition transport [2-3]. Moreover, with chemotherapy, anti-cancer drugs are delivered to the target lesions by blood perfusion, and the penetration distance from vessels to tumor tissue is restricted by the size of the drugs and various tumor microenvironments [4-5]. Poorly perfused tumor regions have non-uniform intratumoral drug distribution, which reduces the therapeutic efficacy; incomplete treatment of tumor cells might increase the probability of treatment resistance, malignant progression, recurrence, locoregional spread, and distant metastasis [6-8]. As a result, the treatment of poorly perfused regions within solid tumors is a critical issue for tumor therapy.
Therapeutic ultrasound (US) combined with drug-loaded microbubbles (MBs) or acoustic droplets is extensively applied in tumor therapy [9-10]. The combination therapy of drug release and physical treatment for vascular disruption induced by bubble cavitation or acoustic droplet vaporization (ADV) improves the efficacy of tumor growth inhibition [11-14]. Since bubbles oscillate, cavitate, and be destroyed during US stimulation, the adjacent cells might get damaged, resulting in changes to the membrane permeability or death from irreversible damage [15-18]. The rapid volume change of ADV also produces mechanical forces that induce cell damage when droplets are vaporized to gaseous bubbles after US stimulation [19-21]. Moreover, the ADV-generated bubbles (ADV-Bs) might have the same characteristics as microbubbles (MBs), resulting in various effects on the biological mechanisms of cells stimulated by US [22-23]. However, short lifetime in vivo (10-20 min) of MBs restricts the effective treatment time and lowers the intratumoral uniformity of treatment to cause tumor recurrence and resistance [9, 24]. Previous studies needed to give high dosage or multiple injections of MBs during treatment to compensate this limitation [14, 25]. Thus, the stable structure of acoustic droplets with liquid core prolongs the lifetime to show more appropriate for therapeutic applications than that of MBs [26-27].
According to the abnormal vascular morphology of tumors, nano-sized droplets (NDs) can passively penetrate tumor tissue via the enhanced permeability and retention (EPR) effect [26, 28-29]. After ND accumulation, there is intratumoral enhancement on US imaging induced by intertissue ADV-Bs, which demonstrates that NDs could be vaporized to form ADV-Bs in the tumor tissue [11, 30-32]. Because bubble cavitation and ADV can induce vascular disruption and tissue erosion to break the barriers of tumor microenvironments, bubbles and droplets might penetrate into the interstitial tissue and directly attack tumor cells that are distant from the vessels [22, 26, 33]. In addition, the pressure gradient derived from the acoustic wave in continuous media produces an acoustic radiation force that pushes the bubbles away from the wave source [34-35]. Previous studies have demonstrated intravascular displacement of MBs and penetration of MBs into clots by radiation force and bubble cavitation [35-37]. These findings suggest that moving the intertissue ADV-Bs to the target regions via the pressure gradient of US may directly damage tumor cells within the poorly perfused regions for physical therapy.
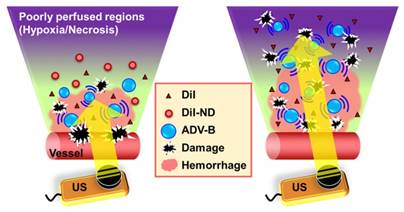
Therefore, we applied NDs to investigate the behaviors of intertissue ADV-B formation, movement and cavitation by intravital imaging. The distance of intertissue ADV-B movement was evaluated using various parameters of US sonication. To simulate the in vivo intertissue bioeffects, the interaction between cells and ADV-B movement were evaluated through in vitro cellular experiments. In order to further investigate the possibility that ADV-Bs could be formed or moved to the specific regions, we defined the poorly perfused regions within solid tumors by US imaging [38], and then triggered ADV-B formation and movement to the target regions. Histological assessments were used to demonstrate the intratumoral distribution of NDs and ADV-Bs in the poorly perfused regions with necrosis or hypoxia (Figure 1).
The concept of ADV-B movement into the poorly perfused regions in the intertissue by US stimulation.
Materials and Methods
Materials
The lipid materials 1, 2-dipalmitoyl-sn-glycero-3-phosphocholine (DPPC), 1,2-dioctadecanoyl-sn-glycero-3-phospho-(1'-rac-glycerol) (DSPG), and 1,2-distearoyl-sn-glycero-3-phosphoethanolamine-N-[methoxy(polyethylene glycol)-5000] (DSPE-PEG5000) were purchased from Avanti Polar Lipids (AL, USA). Red fluorescent dye DiI (excitation/emission: 549/656 nm; 1,1'-dioctadecyl-3,3,3',3'-tetramethylindocar-bocyanine perchlorate) and propidium iodide were purchased from Sigma-Aldrich (MO, USA). Perfluoropentane (C5F12; bulk boiling point of 29°C) was purchased from ABCR GmbH & Co. KG (Karlsruhe, Germany). The in vitro cellular experiments utilized Dulbeco's modified Eagle's medium (DMEM), fetal bovine serum (FBS), and 1% penicillin-streptomycin obtained from Gibco (NY, USA). For histological immunostain, rat-anti-mouse CD31, rabbit-anti-mouse HIF-1α, FITC-conjugated goat anti-rat IgG, and Dylight 350-congugated goat anti-rabbit IgG antibodies were purchased from GeneTex (CA, USA).
Characterization of DiI-NDs
Our homemade NDs were loaded with the red fluorescent dye DiI to observe the intratumoral distribution of NDs and ADV-Bs by histological assessment. The solution containing DPPC, DSPG, DSPE-PEG5000, and DiI (weight ratio of 10:4:4: 0.25) in 1 mL chloroform was evaporated for 24 h at room temperature to make the lipid film in a 2 mL sealed glass vial. To prepare the DiI-NDs, the lipid film was dissolved homogeneously in 1 mL of degassed phosphate-buffered saline (DPBS) by sonication bath (100 W; 2510, Branson, Danbury, CT, USA) at room temperature, and then 75 μL of perfluoropentane was added to make DiI-ND emulsion by a high-intensity sonicator (200 W; UTR200, Dr Hielscher Company, Teltow, Germany) for 20 min. Since the temperature of solution increased during high-intensity sonication, the vial had to be stored in an ice-bath for 5 min to cool down the temperature after sonication for 5 min. The perfluoropentane was encapsulated into NDs as much as possible without leaving any residue of liquid perfluoropentane on the bottom of vial. The differential centrifugation of 5000 rcf for 5 min and 1000 rcf for 1 min was used to remove liposomes and micro-sized droplets. Finally, the DiI-ND emulsion was stored at 4°C for stabilization. The size distribution of DiI-NDs was measured with a NanoSight LM10 device (Malvern Instruments, Worcestershire, UK) with a detection range of 10 nm to 2 µm, and the micron distribution of DiI-NDs was determined using a Coulter counter (Multisizer 3, Beckman Coulter, Fullerton, CA, USA) with a detection range of 0.7 µm to 20 µm. The morphology of the DiI-NDs was visualized by cryotransmission electron microscope (Tecnai F20, Philips, San Francisco, CA, USA). The efficiency of DiI loading was evaluated by a plate reader system (Tecan Infinite M200, Tecan Trading AG, Switzerland), and the original DiI-NDs emulsions before centrifugation were used to obtain the standard calibration line.
In order to observe the formation of ADV-Bs after DiI-ND vaporization, a high-speed camera (FASTCAM SA4, Photron, Tokyo, Japan) mounted on an acousto-optical system was used to record serial optical images at 20 kfps (Figure 2A). The details of the experimental setup were described in our previous study [39]. Diluted DiI-NDs emulsions (80×) were infused into a 200 μm cellulose tube (Spectrum Labs, Rancho Dominguez, CA, USA) placed in the center of the optical field. The flow was fixed to avoid ADV-Bs washing away immediately after ADV. A sonication system with a 2-MHz high-intensity focused ultrasound (HIFU) transducer, which generated a 5000-cycle single pulse with various acoustic peak negative pressures from 5 to 10 MPa, was used to optimize the US parameters for ADV-B formation and visualization. Because small-sized droplets are difficult to vaporize, a long pulse duration was used to reduce the threshold of ADV [40-41].
(A) The acousto-optical system is used to observe the in vitro and in vivo behaviors of ADV-Bs in a cellular tube, window chamber model, and cell dish. (B) Image enhancement after ADV-B formation in an agarose phantom and solid tumor model induced by US sonication is monitored and guided by the US imaging system. After US sonication, both window chamber and solid tumor models show hemorrhage and petechiae in the post-US photos.
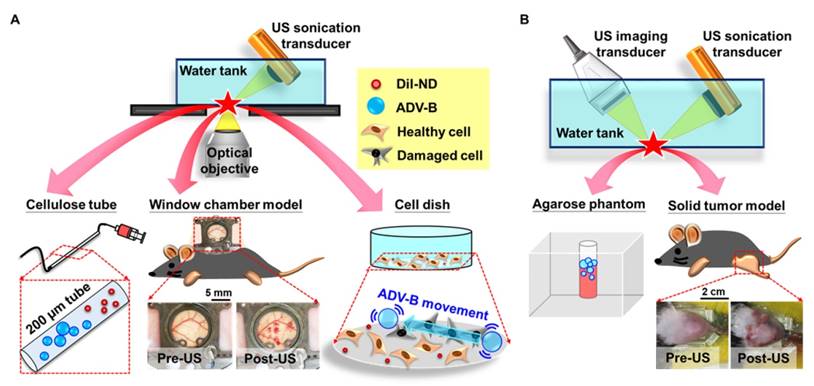
Moreover, a commercial 7-MHz US imaging system was used to evaluate the contrast enhancement of ADV-B formation and retention on US imaging (Figure 2B). A diluted DiI-NDs emulsion (80×) was added (1 mL) to a cylindrical chamber in an agarose phantom that was constructed with a concentration of 3 wt%. The 2-MHz sonication system was regulated according to the above parameters. The pulse repetition frequency of 18 Hz was set so that DiI-NDs were stimulated once by US with respect to the flow velocity. The sonication time was 1 min and then US images were recorded for 10 min. In the control group of US only, DPBS was added and samples were sonicated with 10 MPa to reveal there was no contrast enhancement when the cylindrical chamber did not have DiI-NDs. The ND group was used to determine the stability of DiI-NDs at 37°C without US sonication. The samples of DiI-NDs before experiments and ADV-Bs after experiments were collected to measure the size distributions by dynamic light scattering (Malvern Zetasizer Nano ZS, Malvern Instruments, UK), respectively. Finally, US images were processed and analyzed using MATLAB (The MathWorks, Natick, MA, USA) to quantify the contrast enhancement in each of the groups.
Intertissue Behavior of ADV-Bs During US Stimulation
Twenty-five male C57BL/6JNarl mice (6-10 weeks in age, mean weight of 30 g) were obtained from the National Laboratory Animal Center (Taipei, Taiwan). Animal experiments were approved by the animal experiment committee at National Tsing Hua University (approval number: 10044) following the guidelines of the Institutional Animal Care Committee.
In order to evaluate the intertissue behaviors of ADV-Bs during US stimulation, we used the window chamber model (N=6) to directly observe intravital images under the acousto-optical system (Figure 2A). The detail setup of the intravital imaging system was described in our previous studies [11, 26]. Mice were infused with 3×10¹² DiI-NDs by retro-orbital injection, and the formation, movement and cavitation were assessed using the corresponding parameters of the US sonication system (Table 1). The high acoustic pressure of 10 MPa and long pulse length of 5000-cycle were used to induce vascular disruption and visualization of ADV-B formation in vivo. An acoustic pressure of 5 MPa, which was lower than the ADV threshold, was used to observe intertissue ADV-B movement and cavitation without generating new ADV-Bs. To evaluate the intertissue ADV-B movement, the long pulse lengths of 100, 1000, and 5000 cycles were used to generate the acoustic pressure gradient and measure the distance of ADV-B movement. The pulse repetition frequency of 1 Hz was regulated to record the behaviors of ADV-Bs during US sonication by intravital imaging. The short acoustic pulses of 3-cycle were used to avoid obvious ADV-B movement for the evaluation of ADV-B cavitation. Finally, intravital images were analyzed by ImageJ software (NIH, Bethesda, MD, USA) to measure the distance of intertissue ADV-B movement.
Parameters of US for intravital imaging experiments.
| Behaviors of ADV-Bs | Formation | Movement | Cavitation |
|---|---|---|---|
| Peak negative pressure (MPa) | 10 | 5, 10 | 5 |
| Cycles | 5000 | 100, 1000, 5000 | 3 |
| Pulse repetition frequency (Hz) | Singe pulse | 1 | 1 |
| Sonication time (s) | --- | 10 | 10 |
The Bioeffects on Tumor Cells under ADV and ADV-B Movement
Intravital images showed the possibility of intertissue ADV-B formation, movement, and cavitation, so we evaluated the cellular bioeffects during ADV and ADV-B movement. Previous studies have demonstrated that bubble cavitation induces sonoporation to disrupt cell membranes and increase cell permeability for drug and gene uptake [18, 42], so the bioeffects of ADV-B cavitation are not discussed in this study. Murine astrocytoma tumor (ALTS1C1) cells were cultured in DMEM medium and maintained in a humidified incubator under standard conditions (37 °C, 5% CO2). Thereafter, 3×10⁵ suspended cells were replated on a circular cover glass (diameter of 25 mm; Deckglaser, Germany) in a 6-cm cell dish overnight and observed under the acousto-optical system (Figure 2A). In this study, propidium iodide (PI; final concentration 30 μg/mL) was used to determine the damage to the cell membrane after ADV. Since PI is a live-cell impermeable model drug, it can only pass through a disrupted cell membrane to bind to DNA and RNA and become fluorescent [17, 43]. In order to prevent the violent mechanical forces induced by ADV from blowing cells out of the optical view, 1×10¹⁰ DiI-NDs were added to the cell dish for a 10 min incubation to obtain a ratio of one DiI-ND per 2-3 cells. The acousto-optical system was modified for cellular experiments to enable light penetration through the center of a 5-MHz focused circular US transducer for bright and fluorescent image collection. With the formation of ADV-Bs from DiI-NDs, vaporization might not be visualized due to the sonication parameters of 3-cycle single pulse with 12 MPa, so some submicron-sized DiI-NDs were picked to observe the ADV-B formation, and then the ADV-Bs were moved using a 2 MPa, 50-cycle, 0.2 Hz pulse repetition frequency. The short pulse length of ADV-B formation was adjusted to avoid cells and prevent ADV-Bs blowing away after US stimulation. Image collection of bright and fluorescent images with a time interval of 5 s was used to reveal the cell morphology and fluorescent enhancement after ADV and ADV-B movement. In this study, the cell experiments were used to emulate the interaction between cells and extracellular ADV or ADV-B movement as DiI-NDs or ADV-Bs immediately leaking into tissue after vascular disruption. Thus, the co-incubation time was only 10 min for DiI-ND precipitation without cellular uptake [11, 44-45].
Intertissue ADV-B Movement within Solid Tumors
We evaluated the possibility of intertissue ADV-B movement within solid tumors using US B-mode imaging and histological assessments. When tumors grew to 10-15 mm in diameter after implantation of 2×10⁶ ALTS1C1 cells, tumor-bearing mice (N=19) were injected with MBs (1.4-3.0×10⁷ MBs per mouse) and analyzed by US imaging to identify the regions in the solid tumors with poor perfusion. The fabrication of homemade MBs with a mean size of 0.2-0.7 μm has been previously described [45]. The experimental groups contained (1) only US (N=3); whole tumor sonication without DiI-NDs injection; (2) DiI-NDs (N=3): passive accumulation of DiI-NDs by the EPR effect; (3) DiI-NDs+US (N=3); DiI-ND and ADV-B penetration via vascular disruption induced by ADV; (4) DiI-NDs+US+movement (N=10); intertissue ADV-B formation and movement to the poorly perfused regions by multiple US stimulations. The injection dosage was about 3×10¹² DiI-NDs per mouse.
Whole tumor sonication of 2-MHz HIFU was used to scan from side to side with 7-MHz US imaging system guidance (Figure 2B). Before tumor sonication, the initial and MB perfusion images were collected to show the tumor contour and poorly perfused regions. Thirty minutes after MB intravenous injection, the pre-ADV images were recorded to demonstrate there was no enhancement induction from the remaining MBs and DiI-NDs intravenous injection. The parameters of HIFU for tumor sonication were employed with a 10 MPa, 5000-cycle, and 18 Hz pulse repetition frequency. After whole tumor sonication, the post-ADV images revealed the enhancement of ADV-Bs within tumors. Finally, the stable existing ADV-Bs around the poorly perfused regions were moved to the non-enhancement regions by US stimulation. The post-movement images were collected every minute for 10 min to evaluate the image enhancement within poorly perfused regions after ADV-B movement.
In order to indicate the enhancement regions with MB perfusion or presence of ADV-Bs on US images, the subtracted images based on the initial images were analyzed and labeled a different color using MATLAB software. The gray level intensity of US images was calculated to quantify the image enhancement within tumors relative to the initial images. Moreover, the ADV-B movement was determined by comparing the image enhancement in the poorly perfused regions during US stimulation.
Histological Assessments
Tumors were removed 24 hours after US sonication for histological assessments. Tissue sections (thickness of 20 µm) were stained with hematoxylin and eosin (H&E), CD31, and HIF-1α to indicate tissue damage, vessel pattern (green), and hypoxic cells (blue), respectively. The intratumoral distribution of DiI-NDs and ADV-Bs was evaluated using the red fluorescence properties of DiI. Immunohistochemical staining of CD31 and HIF-1α was performed by incubating the tumor tissue with primary antibodies (dilutions of 1:100) and fluorescent secondary antibody (dilutions of 1:100), respectively [26]. The correlation of intratumoral distribution between DiI, CD31, and HIF-1α was evaluated to demonstrate that US sonication triggered ADV-B movement to the poorly perfused regions.
Statistical Evaluation
The quantitative results are shown as the mean and standard deviation (mean±SD). All the experimental groups were repeated with more than three independent samples. For comparisons within the two individual groups, the paired two-tailed Student's t-test was used to establish the statistically significant differences when the p value was <0.05 using SPSS 13.0 (SPSS Inc., IBM, Armonk, NY, USA).
Results
Characterization of DiI-NDs
This study used lipid-shell NDs with the fluorescent dye DiI to provide in vivo visualization of DiI-ND and ADV-B distribution. The mean size of the DiI-NDs was 359±107 nm with a concentration of (1.2±0.5)×1014 DiI-NDs/mL within the distribution range of 140 to 800 nm by Nanosight (Figure 3A). In addition, the measurement results from a Coulter counter demonstrated the size distribution of DiI-NDs was smaller than 1 μm after differential centrifugation. Because the detection range of Coulter counter is 0.7 to 20 μm, the detection of DiI-NDs with the size larger than 600 nm shows lower concentration than that by NanoSight. The cryotransmission electron microscope image showed the morphology of DiI-NDs contained mono-layer lipid shells and condensed perfluoropentane. The loading efficiency of DiI was 26.3±9.2% with the initial DiI dosage of 62.5 μg.
(A) The size distribution and cryotransmission electron microscope image of DiI-NDs. (B) High speed images of ADV-B formation by 5000-cycle single pulse with various acoustic pressures. (C) The US imaging, size distribution, and quantification of enhancement for ADV-Bs († p<0.01).
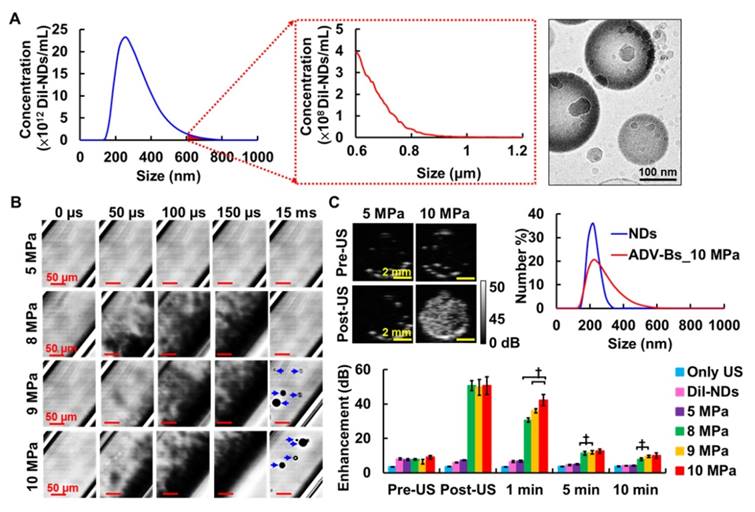
High-speed images enabled visualization of ADV-B formation with various acoustic pressures in vitro (Figure 3B). There was no ADV occurrence or ADV-B formation after US stimulation with 5 MPa. In the groups with 8, 9, and 10 MPa, the black shadows produced at 50 μs during the ADV process might be the non-visualized ADV-Bs and gaseous perfluoropentane. The formation of ADV-Bs was visualized in the 9 and 10 MPa groups; the higher efficiency of ADV-B production increased the probability of ADV-B coalescence to create large stable ADV-Bs (diameters from 10 to 30 μm). Because of the high acoustic pressures and long cycle number, the cellulose tube was shaken during the observation and gradually stabilized after 15 ms.
The contrast enhancement of ADV-B formation was revealed by US images and evaluated according to the in vitro stability of ADV-Bs (Figure 3C). In the comparison with pre- and post-US images, there were no significant enhancements in the US only, DiI-NDs, and 5 MPa groups (each p>0.05). The enhancement of ADV-Bs at post-US, 1, 5, and 10 min was 50.6±2.9, 30.7±1.2, 11.3±1.0, and 7.9±0.7 dB in the 8 MPa group; 49.7±4.6, 36.0±1.2, 11.8±1.0, and 9.5±0.6 dB in the 9 MPa group; and 50.7±5.1, 42.3±3.3, 12.6±1.2, and 10.0±1.5 dB in the 10 MPa group, respectively. Although there was no significant difference in the post US images between 8, 9, and 10 MPa (p>0.05), the highest enhancement of 10 MPa at 1 min showed more ADV-B retention than that at 8 and 9 MPa (p<0.01). Compared to the DiI-NDs (ranging from 150 to 300 nm), the size distribution of ADV-Bs after 10 MPa sonication showed the curve was shifted to the large size range from 150 to 600 nm. Since the stable formation and retention of ADV-Bs was proportional to the acoustic pressure due to the efficiency of ADV and ADV-B coalescence, the subsequent in vivo experiments were performed at an acoustic pressure of 10 MPa with 5000-cycle.
Formation, Movement, and Cavitation of Intertissue ADV-Bs
Intravital images under the window chamber model revealed various behaviors of intravascular and intertissue ADV-Bs during US stimulation. The locations with a clear vessel pattern before ADV-B formation were used to determine if the ADV-Bs were intravascular or intertissue (Figure 4A). Bright-field images showed ADV-Bs were produced within the uninjured vessel pattern, which was defined as intravascular ADV-B formation. On the other hand, a visualized ADV-B appeared in the tissue after subsequent US stimulation since the DiI-NDs penetrate the tissue through vascular disruption and EPR effect.
Intravital images for (A) intravascular and intertissue ADV-B formation, (B) intertissue ADV-Bs movement, (C) distance per pulse of intertissue ADV-B movement (* p<0.05, † p<0.01), and (D) intravascular and intertissue ADV-B cavitation. The arrows indicate new ADV-Bs formation.
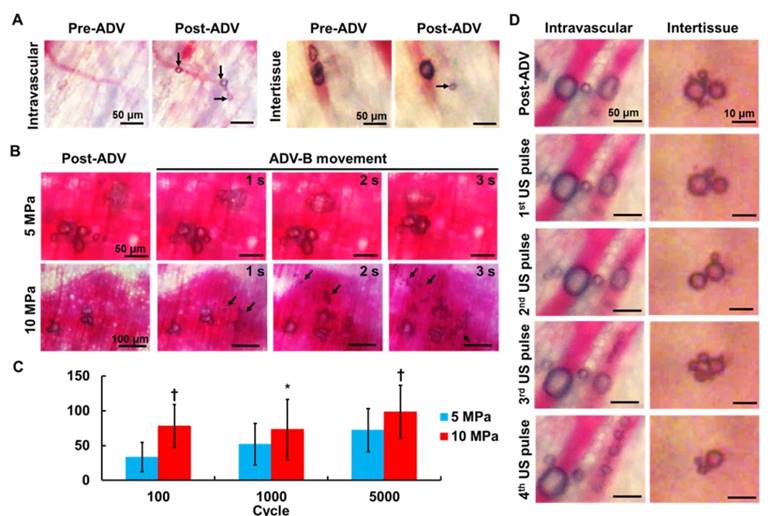
Figure 4B shows the intertissue ADV-B movement by 5000-cycle US pulses, and some ADV-Bs coalesced to form big ADV-Bs that moved according to the pressure gradients (Supplemental Movie S1 and S2). In a comparison with different acoustic pressures, ADV-Bs were shown to be moving both at 5 and 10 MPa, but produced new intertissue ADV-Bs only at 10 MPa. The distance per pulse of ADV-B movement was directly proportional to the acoustic pressures and number of cycles (Figure 4C). These results demonstrate that US parameters can be adjusted to simultaneously produce intertissue ADV-B formation and movement, especially for 5000-cycles with 10 MPa.
The cavitation of ADV-Bs was observed with low acoustic pressure of 5 MPa and 3-cycle to avoid new ADV-B formation and ADV-B movement. Intravascular ADV-Bs were split into numerous small ADV-Bs during US stimulation without vessel rapture (Figure 4D, Supplemental Movie S3). In the tissue, ADV-Bs coalesced and split repeatedly under US pulses to show the ability of intertissue ADV-B cavitation (Supplemental Movie S4). In this study, we used intravital imaging to directly prove that intertissue ADV-Bs could stably form, move to specific regions, and induce cavitation when triggered by US.
Cellular Bioeffects with ADV and ADV-B Movement
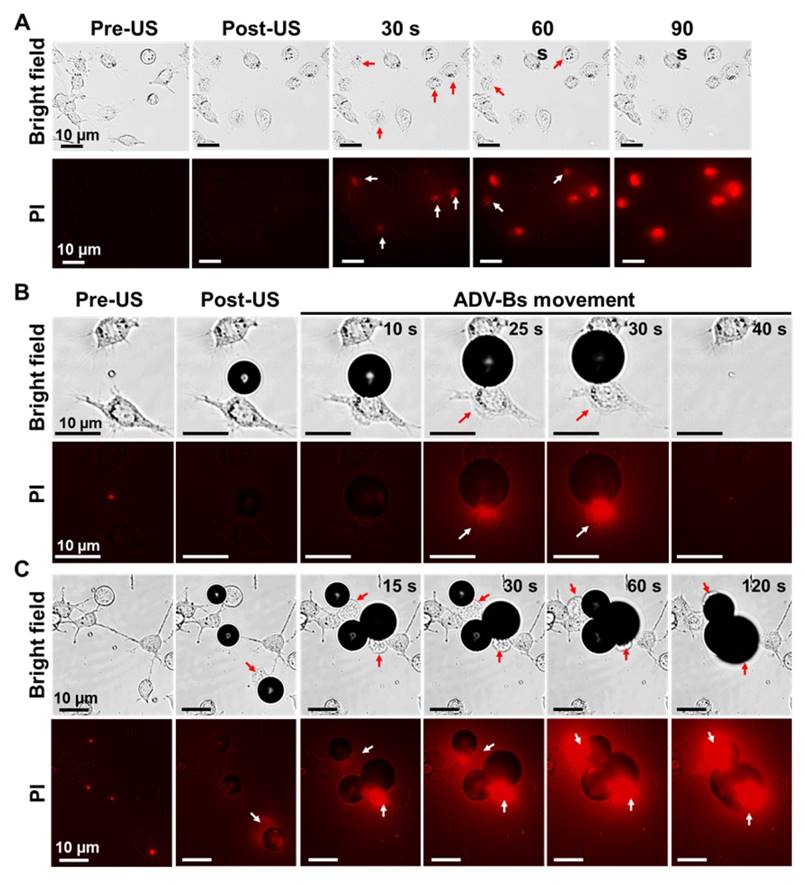
In order to evaluate the bioeffects during intertissue ADV and ADV-B movement, we performed in vitro cellular experiments with PI. Although no ADV-Bs existed after short single-pulsed US stimulation, some cells were blown away from the field of view and the intracellular fluorescent intensity of PI gradually increased to demonstrate the damage of cell membranes induced by ADV (Figure 5A, Supplemental Movie S5). The cases of cells with submicron-sized DiI-NDs enabled visualization of ADV-Bs around the cells, which was used to observe the interaction between cells and ADV-B movement. In Figure 5B, an ADV-B formed between two cells and gradually grew through the diffusion of gases from the medium to touch one of the cells (Supplemental Movie S6). Because the cell can stick to the ADV-B, the cell was moved together with ADV-B triggered by US stimulation. The pulling force between the cover glass, cell, and ADV-B could damage cell membrane, resulting in obvious fluorescence enhancement at 25 s. Finally, the cell and ADV-B were blown out of the field of view at 40 s. The other case in Figure 5C shows three ADV-Bs surrounding and shoving a cell at 15 s; the PI diffused into the cell through the damaged membrane as shown by the fluorescence (Supplemental Movie S7). Since DiI has been widely used in cellular experiments to provide cellular morphology by means of fluorescence imaging [19, 46] and the results of NDs cell viability, DiI-NDs would not perform any cytotoxicity. The above results show that ADV and ADV-B movement can induce cell membrane damage; some cells detached from the cover glass and stuck to the ADV-Bs, moving away from the original location when the ADV-Bs moved. These in vitro cellular results suggest that tissue is damaged during ADV-B formation and movement.
Cellular bioeffects induced by ADV and ADV-B movement. (A) Cells were blown away and PI diffusion after ADV. Cells were damaged by ADV-B (B) pulling and (C) shoving. The arrows indicate damaged cells with PI diffusion.
Intratumoral ADV-B Movement
In this study, we assessed intratumoral vascular distribution using MB perfusion images, and the non-enhanced areas after MB infusion were considered poorly perfused regions (Figure 6A). The post-ADV images showed the image enhancement produced by ADV-Bs after whole tumor sonication and specifically revealed the non-enhanced regions without ADV-Bs, which were at the same location as the poorly perfused regions defined by MB images. The poorly perfused regions showed ADV-Bs in the post-movement images, and the ratio of gray level intensity within the tumors increased 0.73±0.66 over that in the post-ADV images (Figure 6B). In further evaluation of the image enhancement of poorly perfused regions during US-triggered ADV-B formation and movement, we found the ratio of gray level intensity increased over time with a mean increased ratio of 1.47±0.24 (Figure 6C). The corresponding US images are shown in Figure 5D, where the image enhancement in the poorly perfused regions gradually increased during US stimulation. Since the surrounding tissue received multiple US stimulations to move and produce ADV-Bs into poorly perfused regions, the time sequence images revealed high enhancement induced by accumulation of multiple ADV-Bs. The enhancement of US images provided evidence that ADV-Bs can be moved away from vessels and into poorly perfused regions.
(A) The US enhancement images of solid tumors in the DiI-NDs+US+movement group. The post-movement image shows enhancement of ADV-B accumulation in the poorly perfused region (dotted circles). (B) The ratios of gray level within tumors in various experimental groups († p<0.01). (C) The ratios of gray level within the poorly perfused regions and (D) corresponding US images for four tumor-bearing mice during ADV-B formation and movement. The dotted circles indicate the poorly perfused regions defined by MB perfusion imaging.

Histological Assessment
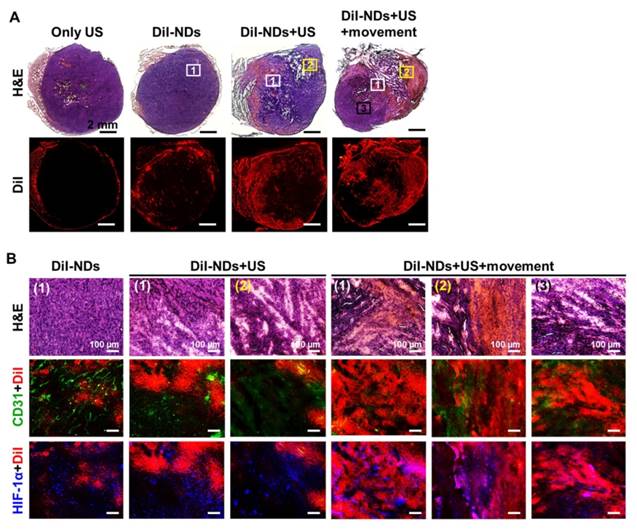
Whole tumor images revealed tissue necrosis and damage with H&E staining and the distribution of DiI-NDs and ADV-Bs by red fluorescence of DiI (Figure 7A). In the DiI-NDs group, intratumoral distribution of DiI mainly accumulated in the tumor periphery by the EPR effect. The obvious tissue necrosis and damage were observed in the DiI-NDs+US and DiI-NDs+US+movement groups, and the tissue surrounding the necrosis regions revealed hemorrhage and large accumulation of DiI. In a comparison with the DiI-NDs+US group, the distribution of DiI covered more necrotic regions in the DiI-NDs+US+movement group. Merged images of CD31+DiI and HIF-1α+DiI showed the intratumoral distribution between vessels, hypoxic cells, DiI-NDs and ADV-Bs (Figure 7B). The intact tumor tissue with a clear vessel pattern in the DiI-ND group showed hypoxic cells distributed mainly around the absent vessel areas. Images of the DiI-NDs+US group revealed unclear vessel pattern and hypoxic cells due to necrosis and vascular disruption, and indicated a slight demarcation for DiI distribution at the junction between damaged tissue and necrotic regions. According to the ADV-B formation and movement after US stimulation, both damaged and necrotic tissue had an accumulation of DiI in the DiI-NDs+US+movement group. Therefore, the US enhancement imaging and histological assessment showed that DiI-NDs and ADV-Bs triggered by US might leak into the poorly perfused regions within solid tumors.
(A) Histological images of whole tumors with H&E staining and DiI indicate tissue necrosis and the distribution of DiI-NDs and ADV-Bs, respectively. The squares with number are the locations of high magnification images below. (B) The intratumoral distribution of necrosis and hemorrhage, DiI-NDs and ADV-Bs, vessels, and hypoxic cells are shown in the H&E, DiI (red), CD31 (green), and HIF-1α (blue) images, respectively.
Discussion
Therapeutic applications of US have been developed to combine with MBs or droplets for tumor therapy [9-10, 47]. NDs contain high Laplace pressure that restricts the stability of ADV-B formation [40], so most ADV-Bs shrink or condense back into their liquid form if they do not coalesce together to form big ADV-Bs [48]. Although the long pulse duration disrupts some ADV-Bs, it could produce larger ADV-Bs that can be easily observed under optical and US imaging [32, 39]. Our homemade DiI-NDs with diameters of 359±107 nm formed stable ADV-Bs with a mean size of 13.9±8.7 μm (range from 5 to 30 μm) in vitro after 5000-cycle single pulse with 10 MPa. After vascular disruption or the EPR effect, some ADV-Bs formed in direct contact with vascular endothelial cells and tissue. Furthermore, the movement and cavitation of intertissue ADV-Bs were analyzed real-time under intravital imaging by US triggering. The complex and dense condition of tissue might not restrict the behaviors of DiI-NDs and ADV-Bs when they are stimulated with enough acoustic power.
During US stimulation, the mechanical forces from the shear stream and liquid jets during bubble oscillation, cavitation, and burst change the biological mechanisms of adjacent cells [18, 49]. The in vitro cellular experiments showed that live cells are impermeable to the dye PI, which diffuses into cells and present as red fluorescence to indicate cell membrane damage after ADV. Not only does ADV induce cell damage, the morphology of the cell membrane is also altered when cells are shoved during ADV-Bs movement. The liquid-to-gas process of ADV interacting with cells may proceed lipid fusion between cell membrane and lipid-shell of ADV-Bs. Previous study showed that lipid exchange and/or lipid particle fusion occurred after lipid-coated particles binding and close apposition to the target cell surface [50]. When the ADV-Bs adhered to cells, the cell membrane might be disrupted by the ADV-Bs movement. Seda et al. demonstrated that the probability of cell damage increases with increasing ADV-B formation [21]. Hence, the specific regions of ADV-B formation, movement, and cavitation in tumor tissue might cause various cellular bioeffects; the improvement in apoptosis, membrane permeability, and drug uptake assists in the inhibition of tumor proliferation.
Although the coalescence of ADV-Bs formed from DiI-NDs has been shown in vitro and in vivo, there is little know about the process of intertissue ADV-B movement pushing ADV-Bs together to create larger ADV-Bs or bubble clouds. The greater ADV-Bs and bubble clouds are unmovable and kept in a steady state in the tissue under US stimulation, probably due to an insufficient pressure gradient and the solid stress from tumor microenvironments [4, 34]. On the other hand, gas embolism would occur if larger ADV-Bs get stuck in the vessels [51]. Therefore, ADV-B movement might induce tumor cell or vessel death, so the bioeffect of ADV-Bs sticking in tissue should be further investigated.
Conclusion
In this study, we demonstrated the stable formation, movement, and cavitation of ADV-Bs in tissue. Theranostic applications of ADV-Bs revealed that they can assist in defining and monitoring the probable locations of tumor necrosis or hypoxia by US imaging during treatment in poorly perfused regions. Since the mechanical force induced by ADV and ADV-Bs could damage cells, the behaviors of intertissue ADV-Bs allow movement away from vessels and direct attack on tumor cells. This physical strategy might provide a way to overcome the treatment limitations of poorly perfused regions within solid tumors. We expected these direct physical damages by intertissue ADV-Bs. We expected these direct physical damages by intertissue ADV-Bs could compensate the tumor resistance resulting from heterogeneous drug distribution, hypoxia, or abnormal bio-mechanism in chemotherapy and radiotherapy.
Supplementary Material
Additional File 1Movie S1.
Movie S2.
Movie S3.
Movie S4.
Movie S5.
Movie S6.
Movie S7.
Acknowledgements
The authors gratefully acknowledge the support of the Ministry of Science and Technology, Taiwan under Grant No. 105-2627-M-007-009, 105-2221-E-007-055 and 105-2119-M-182-001, National Tsing Hua University (Hsinchu, Taiwan) under Grant No. 105N522CE1, and Chang Gung Memorial Hospital (Linkou, Taiwan) under Grant No. CIRPD2E0051.
Competing Interests
The authors have declared that no competing interest exists.
References
1. Folkman J. Anti-angiogenesis: new concept for therapy of solid tumors. Ann Surg. 1972;175:409-16
2. Folkman J. Angiogenesis in psoriasis: therapeutic implications. J Invest Dermatol. 1972;59:40-3
3. Vaupel P. The role of hypoxia-induced factors in tumor progression. Oncologist. 2004;9(Suppl 5):10-7
4. Nakamura Y, Mochida A, Choyke PL, Kobayashi H. Nanodrug Delivery: Is the Enhanced Permeability and Retention Effect Sufficient for Curing Cancer? Bioconjug Chem. 2016;27:2225-38
5. Fang J, Nakamura H, Maeda H. The EPR effect: Unique features of tumor blood vessels for drug delivery, factors involved, and limitations and augmentation of the effect. Adv Drug Deliv Rev. 2011;63:136-51
6. Shannon AM, Bouchier-Hayes DJ, Condron CM, Toomey D. Tumour hypoxia, chemotherapeutic resistance and hypoxia-related therapies. Cancer Treat Rev. 2003;29:297-307
7. Vaupel P, Harrison L. Tumor hypoxia: causative factors, compensatory mechanisms, and cellular response. Oncologist. 2004;9(Suppl 5):4-9
8. Rapisarda A, Melillo G. Role of the hypoxic tumor microenvironment in the resistance to anti-angiogenic therapies. Drug Resist Updat. 2009;12:74-80
9. Kang ST, Yeh CK. Ultrasound microbubble contrast agents for diagnostic and therapeutic applications: current status and future design. Chang Gung Med J. 2012;35:125-39
10. Zhou Y. Application of acoustic droplet vaporization in ultrasound therapy. J Ther Ultrasound. 2015;3:20
11. Ho YJ, Yeh CK. Concurrent anti-vascular therapy and chemotherapy in solid tumors using drug-loaded acoustic nanodroplet vaporization. Acta Biomater. 2017;49:472-85
12. Rapoport N. Drug-Loaded Perfluorocarbon Nanodroplets for Ultrasound-Mediated Drug Delivery. Adv Exp Med Biol. 2016;880:221-41
13. Lin CY, Tseng HC, Shiu HR, Wu MF, Chou CY, Lin WL. Ultrasound sonication with microbubbles disrupts blood vessels and enhances tumor treatments of anticancer nanodrug. Int J Nanomedicine. 2012;7:2143-52
14. Todorova M, Agache V, Mortazavi O, Chen B, Karshafian R, Hynynen K. et al. Antitumor effects of combining metronomic chemotherapy with the antivascular action of ultrasound stimulated microbubbles. Int J Cancer. 2013;132:2956-66
15. Skyba DM, Price RJ, Linka AZ, Skalak TC, Kaul S. Direct in vivo visualization of intravascular destruction of microbubbles by ultrasound and its local effects on tissue. Circulation. 1998;98:290-3
16. Hwang JH, Tu J, Brayman AA, Matula TJ, Crum LA. Correlation between inertial cavitation dose and endothelial cell damage in vivo. Ultrasound Med Biol. 2006;32:1611-9
17. Skachkov I, Luan Y, van der Steen AF, de Jong N, Kooiman K. Targeted microbubble mediated sonoporation of endothelial cells in vivo. IEEE Trans Ultrason Ferroelectr Freq Control. 2014;61:1661-7
18. De Cock I, Zagato E, Braeckmans K, Luan Y, de Jong N, De Smedt SC. et al. Ultrasound and microbubble mediated drug delivery: acoustic pressure as determinant for uptake via membrane pores or endocytosis. J Control Release. 2015;197:20-8
19. Kang ST, Yeh CK. Intracellular acoustic droplet vaporization in a single peritoneal macrophage for drug delivery applications. Langmuir. 2011;27:13183-8
20. Vlaisavljevich E, Durmaz YY, Maxwell A, Elsayed M, Xu Z. Nanodroplet-mediated histotripsy for image-guided targeted ultrasound cell ablation. Theranostics. 2013;3:851-64
21. Seda R, Li DS, Fowlkes JB, Bull JL. Characterization of Bioeffects on Endothelial Cells under Acoustic Droplet Vaporization. Ultrasound Med Biol. 2015;41:3241-52
22. Kang ST, Lin YC, Yeh CK. Mechanical bioeffects of acoustic droplet vaporization in vessel-mimicking phantoms. Ultrason Sonochem. 2014;21:1866-74
23. Sheeran PS, Matsunaga TO, Dayton PA. Phase-transition thresholds and vaporization phenomena for ultrasound phase-change nanoemulsions assessed via high-speed optical microscopy. Phys Med Biol. 2013;58:4513-34
24. Chen H, Hwang JH. Ultrasound-targeted microbubble destruction for chemotherapeutic drug delivery to solid tumors. J Ther Ultrasound. 2013;1:10
25. Lai P, Tarapacki C, Tran WT, El Kaffas A, Lee J, Hupple C. et al. Breast tumor response to ultrasound mediated excitation of microbubbles and radiation therapy in vivo. Oncoscience. 2016;3:98-108
26. Ho YJ, Chang YC, Yeh CK. Improving Nanoparticle Penetration in Tumors by Vascular Disruption with Acoustic Droplet Vaporization. Theranostics. 2016;6:392-403
27. Kripfgans OD, Orifici CM, Carson PL, Ives KA, Eldevik OP, Fowlkes JB. Acoustic droplet vaporization for temporal and spatial control of tissue occlusion: a kidney study. IEEE Trans Ultrason Ferroelectr Freq Control. 2005;52:1101-10
28. Rapoport NY, Kennedy AM, Shea JE, Scaife CL, Nam KH. Controlled and targeted tumor chemotherapy by ultrasound-activated nanoemulsions/microbubbles. J Control Release. 2009;138:268-76
29. Rapoport N, Nam KH, Gupta R, Gao Z, Mohan P, Payne A. et al. Ultrasound-mediated tumor imaging and nanotherapy using drug loaded, block copolymer stabilized perfluorocarbon nanoemulsions. J Control Release. 2011;153:4-15
30. Ji G, Yang J, Chen J. Preparation of novel curcumin-loaded multifunctional nanodroplets for combining ultrasonic development and targeted chemotherapy. Int J Pharm. 2014;466:314-20
31. Rapoport N, Kennedy AM, Shea JE, Scaife CL, Nam KH. Ultrasonic nanotherapy of pancreatic cancer: lessons from ultrasound imaging. Mol Pharm. 2010;7:22-31
32. Williams R, Wright C, Cherin E, Reznik N, Lee M, Gorelikov I. et al. Characterization of submicron phase-change perfluorocarbon droplets for extravascular ultrasound imaging of cancer. Ultrasound Med Biol. 2013;39:475-89
33. Chen H, Li X, Wan M, Wang S. High-speed observation of cavitation bubble clouds near a tissue boundary in high-intensity focused ultrasound fields. Ultrasonics. 2009;49:289-92
34. Dayton PA, Allen JS, Ferrara KW. The magnitude of radiation force on ultrasound contrast agents. J Acoust Soc Am. 2002;112:2183-92
35. Dayton P, Klibanov A, Brandenburger G, Ferrara K. Acoustic radiation force in vivo: a mechanism to assist targeting of microbubbles. Ultrasound Med Biol. 1999;25:1195-201
36. Acconcia C, Leung BY, Manjunath A, Goertz DE. The Effect of Short Duration Ultrasound Pulses on the Interaction Between Individual Microbubbles and Fibrin Clots. Ultrasound Med Biol. 2015;41:2774-82
37. Bader KB, Gruber MJ, Holland CK. Shaken and stirred: mechanisms of ultrasound-enhanced thrombolysis. Ultrasound Med Biol. 2015;41:187-96
38. Elie N, Kaliski A, Peronneau P, Opolon P, Roche A, Lassau N. Methodology for quantifying interactions between perfusion evaluated by DCE-US and hypoxia throughout tumor growth. Ultrasound Med Biol. 2007;33:549-60
39. Kang ST, Huang YL, Yeh CK. Characterization of acoustic droplet vaporization for control of bubble generation under flow conditions. Ultrasound Med Biol. 2014;40:551-61
40. Fabiilli ML, Haworth KJ, Fakhri NH, Kripfgans OD, Carson PL, Fowlkes JB. The role of inertial cavitation in acoustic droplet vaporization. IEEE Trans Ultrason Ferroelectr Freq Control. 2009;56:1006-17
41. Lo AH, Kripfgans OD, Carson PL, Rothman ED, Fowlkes JB. Acoustic droplet vaporization threshold: effects of pulse duration and contrast agent. IEEE Trans Ultrason Ferroelectr Freq Control. 2007;54:933-46
42. Lentacker I, De Cock I, Deckers R, De Smedt SC, Moonen CT. Understanding ultrasound induced sonoporation: definitions and underlying mechanisms. Adv Drug Deliv Rev. 2014;72:49-64
43. van Rooij T, Skachkov I, Beekers I, Lattwein KR, Voorneveld JD, Kokhuis TJ. et al. Viability of endothelial cells after ultrasound-mediated sonoporation: Influence of targeting, oscillation, and displacement of microbubbles. J Control Release. 2016;238:197-211
44. Zhang S, Li J, Lykotrafitis G, Bao G, Suresh S. Size-Dependent Endocytosis of Nanoparticles. Adv Mater. 2009;21:419-24
45. Chithrani BD, Ghazani AA, Chan WCW. Determining the size and shape dependence of gold nanoparticle uptake into mammalian cells. Nano Lett. 2006;6:662-8
46. Gao H, Yang Z, Zhang S, Cao S, Shen S, Pang Z. et al. Ligand modified nanoparticles increases cell uptake, alters endocytosis and elevates glioma distribution and internalization. Sci Rep. 2013;3:2534
47. Rapoport NY, Nam KH, Gao Z, Kennedy A. Application of Ultrasound for Targeted Nanotherapy of Malignant Tumors. Acoust Phys. 2009;55:594-601
48. Reznik N, Shpak O, Gelderblom EC, Williams R, de Jong N, Versluis M. et al. The efficiency and stability of bubble formation by acoustic vaporization of submicron perfluorocarbon droplets. Ultrasonics. 2013;53:1368-76
49. Chen H, Kreider W, Brayman AA, Bailey MR, Matula TJ. Blood vessel deformations on microsecond time scales by ultrasonic cavitation. Phys Rev Lett. 2011;106:034301
50. Partlow KC, Lanza GM, Wickline SA. Exploiting lipid raft transport with membrane targeted nanoparticles: a strategy for cytosolic drug delivery. Biomaterials. 2008;29:3367-75
51. Muth CM, Shank ES. Gas embolism. N Engl J Med. 2000;342:476-82
Author contact
![]() Corresponding author: Department of Biomedical Engineering and Environmental Sciences, National Tsing Hua University, No. 101, Section 2, Kuang-Fu Road, Hsinchu, Taiwan 30013 Tel: +886-3-571-5131 ext. 34240; Fax: +886-3-571-8649 E-mail address: ckyehnthu.edu.tw
Corresponding author: Department of Biomedical Engineering and Environmental Sciences, National Tsing Hua University, No. 101, Section 2, Kuang-Fu Road, Hsinchu, Taiwan 30013 Tel: +886-3-571-5131 ext. 34240; Fax: +886-3-571-8649 E-mail address: ckyehnthu.edu.tw