Impact Factor
- Issue 14; 2026
- Issue 13; 2026
- Issue 12; 2026
- Issue 11; 2026
- Issue 10; 2026
- Volume 16; 2026
- Advance Articles
- Past Issues
- Cover Images
- Cover Suggestion
- Index & Coverage
- Special Issues
Introduction
Materials and Methods
Results
Discussion
Supplementary Material
Abbreviations
Acknowledgements
References
International Journal of Biological Sciences
International Journal of Medical Sciences
 Global reach, higher impact

Theranostics 2017; 7(6):1463-1476. doi:10.7150/thno.18217 This issue Cite
Research Paper
Spectroscopic Photoacoustic Molecular Imaging of Breast Cancer using a B7-H3-targeted ICG Contrast Agent
Katheryne E. Wilson1, Sunitha V. Bachawal1, Lotfi Abou-Elkacem1, Kristen Jensen2, Steven Machtaler1, Lu Tian3, Jürgen K. Willmann1 ![]()
1. Department of Radiology, Molecular Imaging Program at Stanford, Stanford University, School of Medicine, Stanford, California, USA;
2. Departments of Pathology, Stanford University, School of Medicine, Stanford, California, USA;
3. Department of Health Research and Policy, Stanford University, School of Medicine, Stanford, California, USA.
Received 2016-11-5; Accepted 2017-1-11; Published 2017-4-3
Abstract

Purpose: Breast cancer imaging methods lack diagnostic accuracy, in particular for patients with dense breast tissue, and improved techniques are critically needed. The purpose of this study was to evaluate antibody-indocyanine green (ICG) conjugates, which undergo dynamic absorption spectrum shifts after cellular endocytosis and degradation, and spectroscopic photoacoustic (sPA) imaging to differentiate normal breast tissue from breast cancer by imaging B7-H3, a novel breast cancer associated molecular target.
Methods: Quantitative immunohistochemical staining of endothelial and epithelial B7-H3 expression was assessed in 279 human breast tissue samples, including normal (n=53), benign lesions (11 subtypes, n=129), and breast cancers (4 subtypes, n=97). After absorption spectra of intracellular and degraded B7-H3-ICG and Isotype control-ICG (Iso-ICG) were characterized, sPA imaging in a transgenic murine breast cancer model (FVB/N-Tg(MMTVPyMT)634Mul) was performed and compared to imaging of control conditions [B7-H3-ICG in tumor negative animals (n=60), Iso-ICG (n=30), blocking B7-H3+B7-H3-ICG (n=20), and free ICG (n=20)] and validated with ex vivo histological analysis.
Results: Immunostaining showed differential B7-H3 expression on both the endothelium and tumor epithelium in human breast cancer with an area under the ROC curve of 0.93 to differentiate breast cancer vs non-cancer. Combined in vitro/in vivo imaging showed that sPA allowed specific B7-H3-ICG detection down to the 13 nM concentration and differentiation from Iso-ICG. sPA molecular imaging of B7-H3-ICG showed a 3.01-fold (P<0.01) increase in molecular B7-H3-ICG signal in tumors compared to control conditions.
Conclusions: B7-H3 is a promising target for both vascular and epithelial sPA imaging of breast cancer. Leveraging antibody-ICG contrast agents and their dynamic optical absorption spectra allows for highly specific sPA imaging of breast cancer.
Keywords: Photoacoustic Imaging, Breast Cancer, Molecular Imaging, Spectroscopic, Indocyanine Green
Introduction
Breast cancer is the second leading cause of cancer deaths in women (1). In 2016 in the United States alone, ~249,260 new cases have been diagnosed, with ~40,890 patients dying of the disease (1). Mammography is the first line imaging test to detect breast cancer; however, in women with dense breast tissue, its sensitivity is limited to 33-54% (2-4). In these patients, ultrasound is the next imaging technique and has shown to detect 0.3 to 7.7 additional cancers per 1000 women imaged (2,5,6). However, ultrasound suffers from a low positive predictive value (between 5.6 and 8.7% (5,7)), causing additional health care cost of 2.8 billion dollars per year by under- or over-diagnosing the disease (8). Therefore, noninvasive methods to distinguish benign from malignant lesions are critically needed.
Photoacoustic imaging is a complementary molecular imaging modality that can be combined with standard ultrasound in the same breast imaging exam (9-16), using short (<10 ns) pulses of laser light to induce localized, optical absorption-based thermal expansion within the tissues generating acoustic transients detected with standard ultrasound equipment. Images of optical absorption are generated at ultrasonic resolutions at depths up to 5 cm in human tissues (17-19). Photoacoustic imaging signal is typically dominated by optical absorption from the endogenous absorbers melanin and oxygenated and deoxygenated hemoglobin (17,18), making imaging other chromophores, endogenous or exogenous, challenging due to high tissue background signal. Spectroscopic photoacoustic (sPA) imaging has become a useful strategy to deconvolve photoacoustic signal originating from separate photoabsorbers based on a priori knowledge of their wavelength-dependent optical absorption spectra and relative concentrations within the tissue (9,20-22), allowing suppression of background signal from endogenous absorbers so that exogenous agents specific to molecular targets can be better visualized, which could aid in differentiation of focal breast lesions.
Exogenous contrast agents for photoacoustic imaging comprise substances with high optical absorption within the desired wavelength range, typically plasmonic nanoparticles and dyes (11,23,24). However, there are concerns over the potential cytotoxic effects of long-term nanoparticle accumulation currently limiting clinical approval and use (23,25). Small biomolecule-based contrast agents such as FDA-approved methylene blue and indocyanine green (ICG) may allow for increased and more uniform accumulation within tumors due to their size and ability to bind to both endothelial and epithelial cell surface receptors. When combined with a targeting moiety, such as an antibody, they can be used for molecular photoacoustic imaging.
ICG is a near infrared fluorescent dye currently used for several clinical imaging applications [e.g., measuring cardiac output and liver function, ophthalmic angiography, and to intraoperatively guide tumor resection (26)]. ICG provides excellent, stable optical absorption, due to its low fluorescence quantum efficiency (27-29). Interestingly, the optical absorption spectrum of ICG changes significantly depend on the environment, concentration, and protein-bound status including binding to antibodies, due to alteration in electron orbital energy levels that switch ICG from radiative to nonradiative emission (27,30), which can be leveraged to generate activatable imaging probes (28,31-33). It has been shown that upon binding to specific cell surface markers, antibody-bound ICG is endocytosed and the antibody-ICG bond is degraded resulting in unquenching and significantly increased fluorescence of the ICG dye (27,33-35). However, both specific and nonspecific antibodies accumulate within tumor tissues (36-40) due to altered interstitial pressures, ineffective lymph drainage, long blood half-lives, and cell mediated pathways such as the Fc receptors and neonatal Fc receptor (FcRN), which decreases specificity of molecular imaging using an antibody-ICG contrast agent (41-45). Therefore, to enhance specificity to the molecularly-targeted contrast agent, we hypothesized that antibody-ICG conjugates will also undergo optical absorption spectral shifts upon binding to a molecular target expressed on tumor cells such as B7-H3 (see below) with subsequent endocytosis and cleavage of the ICG-antibody bond, while nonspecific antibody-ICG conjugates will not undergo this degradation. If the absorption spectrum changes sufficiently upon binding to its molecular target we can then harness sPA imaging, which has increased imaging depth and resolution compared to fluorescence imaging, to detect these shifts. sPA imaging of antibody-ICG agents would then become a highly specific and sensitive method to detect only contrast agents bound to their specific molecular target and, therefore, distinguishable from blood pool agent, nonspecific agent, and the imaging signal form endogenous chromophores.
Recently, our group has identified the B7-H3 receptor (also known as CD276) as a promising breast cancer ultrasound molecular imaging target as it is differentially expressed on the neovasculature of cancer versus normal breast tissue and benign breast lesions (46). If B7-H3 is differentially expressed not only on the breast cancer neovasculature but also on stroma/tumor cells, which is examined in our current study, it may be a promising and ample molecular imaging target for B7-H3-targeted ICG which can, due to its size, not only bind to the tumor vasculature but also diffuse into the extravascular compartment and bind on the tumor stroma/cells.
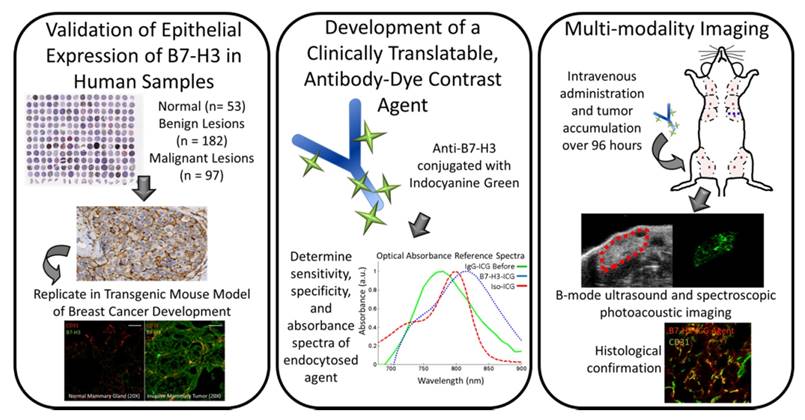
The purpose of this study was several fold (Figure 1): first, to quantify the expression of B7-H3 on both the endothelium and epithelium in several breast cancer subtypes compared to normal mammary tissues and benign and precursor lesions derived from patient samples; second, to determine if sPA imaging can detect the absorption spectrum shift ICG undergoes when antibody-ICG contrast agent undergoes specific receptor-mediated endocytosis with subsequent cleavage of the ICG-antibody bond; and third, to assess the feasibility of sPA molecular imaging using B7-H3-targeted ICG in a transgenic mouse model of breast cancer.
Study overview. This study comprises three parts: 1) Examining B7-H3 endothelial and epithelial expression on human tissue samples, including normal, benign and precursor lesions, and four subtypes of invasive breast carcinomas; 2) The development, characterization, and testing of an antibody-dye (B7-H3-ICG) contrast agent which undergoes detectable shifts in optical absorbance in its free and endocytosed states; 3) Using sPA imaging combined with B7-H3-ICG to image B7-H3 expression noninvasively with high sensitivity and specificity and confirming agent localization ex vivo. Scale bar represents 100 µm and is consistent between micrographs.
Materials and Methods
Figure 1 summarizes the overall study design.
Immunohistochemical Staining of B7-H3 Expression in Human Breast Tissues
Using a HIPPA compliant and IRB-approved protocol, human breast tissue samples representing a range of normal breast tissue, benign and precursor breast lesions, and four types of breast cancer were collected retrospectively. In total, 279 samples were collected, including 53 normal breast tissues, 182 benign or precursor tissues, and 97 breast cancer tissues. The tissue samples obtained were either from tissue microarray cases constructed from patient resection tissues after characterization by a dedicated breast pathologist or whole tissue samples (n=39) of breast cancer obtained from diagnostic large core needle biopsies. Immunohistochemical staining and scoring of collected human samples was performed using anti-human B7-H3 antibody (AF1027, at 1:200 dilution; R&D systems, MN) on 5 µm sections of paraffin-embedded breast tissues using the Leica Bond Max automated platform (Leica Microsysytems Inc., IL) in conjunction with the use of a heat induced epitope retrieval program using an epitope retrieval solution (2, ER2; Leica Microsysytems Inc., IL) at pH 9.0. A dedicated breast pathologist scored all immunohistochemically stained sections using two parameters, one for staining intensity and another for percent positive tumor tissue. B7-H3 staining intensity was scored between 0 to 3 (0 = no staining; 1 = weak; 2 = moderate; and 3 = strong tissue staining) and percentage positive tumor tissue, inclusive of all tissue components (vessels, stroma, cytoplasm, fibroblast like cells), was scored between 0 and 4 (0 = no positive staining; 1 = 1-10%; 2 = 11-33%; 3 = 34-66%; and 4 = 67-100% of positive staining on tumor tissue in the field of view). The results obtained by these two parameters were then multiplied together, yielding a single value defined as the IHC Score ranging from 0-12.
Synthesis and Characterization of Anti-B7-H3-Antibody Conjugated ICG and Control Agent
B7-H3-targeted antibody-dye and isotype control antibody-dye conjugation reactions were carried out in 0.1 M phosphate buffered saline (PBS) buffer (pH 7.4) at room temperature for 2 h protected from light. After affinity purification using a protein A purification kit (Abcam Inc.), 100 µg of B7-H3-targeted antibody per batch [Abcam Inc., [EPNCIR122] (ab134161) [or 100 µg of isotype control nonspecific antibody [Abcam Inc. [EPR25A] (ab172730)], both IgG isotypes, per batch in 200 µl of PBS was incubated with a 20 times molar equivalent of either ICG-NHS (Intrace Medical, Co.) or AlexaFluor® 633 NHS Ester (ThermoFisher Scientific, Co.) in 50 μl dimethyl sulfoxide (DMSO) to form bonds via NHS ester labeling of amino groups on the Lysine peptides on the antibodies. Labeled antibodies were separated from free ICG dye using a Sephadex™ PD-10 gel filtration column as a visible fraction. Protein concentrations were determined through spectrophotometric analysis at 280 and 560 nm with correction factor. Ab-dye conjugates were concentrated to 0.33 mg/ml of PBS using 30,000 Da molecular weight cutoff filters centrifuged at 2,500 xg for 5 minutes.
Dye/Ab binding ratio was determined through mass spectrometry and spectrophotometric analysis of absorbance. B7-H3 antibody and, after conjugation, B7-H3-ICG were purified for mass spectroscopic analysis using µC18 ZipTip® Pipette Tips (EMD Millipore Co.). Tip resin was activated with HPLC-grade acetonitrile and was equilibrated with 0.1% Trifluoroacetic acid (TFA) with three washes. Next, 10 µg of B7-H3 antibody or B7-H3-ICG in 20 µl of 0.1% TFA was passed through the resin a total of 8 times to ensure optimal protein binding. After sample binding, the resin was washed three times with 0.1% TFA to desalt and purify the samples. Finally, the samples were eluted into 2 µl sinapinic acid (SPA) and dotted onto the mass spectroscopy plate. TOF-MALDI mass spectroscopic analysis was performed using an AB SCIEX TOF/TOF™ 5800 equipped with a CovalX high mass detector. Calibration was performed using 5 pM BSA and the system was operated with a mass range of 20,000 to 200,000 m/z with a 1 sec scan time. Masses are peak averages ± standard deviation of 6 scans reported from the doubly charged peak of the antibody and antibody-dye conjugate. Dividing the difference in peak averages by the mass of a single ICG-NHS dye molecule (810 Da) gives the average number of dyes bound to a single antibody. Absorption (Abs) of the antibody-dye conjugate was measured at 280 and 800 nm using a spectrophotometer. The ICG/Ab ratio was calculated as (Abs800/ εDye)/((Abs280-Abs800*0.052)/εProtein), where εDye is the molar extinction coefficient of ICG at 800 nm (22,884 L/mol*cm), εProtein is the molar extinction coefficient of antibody proteins (203,000 L/mol*cm), and 0.052 is the correction factor for ICG absorption at 280 nm (47).
Specificity of the B7-H3-AF633 conjugate was measured using flow cytometry. AF-633-NHS was substituted for ICG at the same binding ratio and linkage chemistry to allow detection by the flow cytometer. Miles Sven 1 (MS1) endothelial cells transfected to express human B7-H3 (MS1B7-H3) were treated with B7-H3-AF633 and Iso-AF633 and analyzed by flow cytometry. Briefly, 5 × 10⁵ cells were seeded into T25 flasks and treated with 2X µg B7-H3-AF633 or Iso-AF633 for 24 h in complete growth DMEM media. After the treatment, the cells were washed with PBS three times. Cells were subsequently trypsinized and collected by centrifugation at 400 xg for 5 min. Cold PBS was used for resuspension and cells were kept on ice until analysis using imaging flow cytometry. Using images of 5000 cells, the fluorescence intensities of B7-H3-AF633 and Iso-AF633 were acquired. The measured median fluorescence intensity data was analyzed using FlowJo software. Labeled antibody was stored at 4°C in PBS.
Cell Culture
Murine vascular endothelial MS1 cells expressing B7-H3 (MS1B7-H3) (48) and MS1 wildtype cells were grown in DMEM containing 10% fetal bovine serum and 0.4 mg/ml G418 in a 5% CO2 humidified atmosphere and subcultured prior to confluence using trypsin.
Live Cell Imaging to Assess Intracellular Uptake and Location of B7-H3-Dye and Iso-Dye Conjugates
To examine the intracellular pathways of B7-H3-dye and Iso-dye (degradation or recycling), live cell imaging experiments were performed. LysoTracker™ Green and CellLight™ Lysosomes-GFP were purchased from Invitrogen (Carlsbad, CA). To be able to visualize the antibody conjugates using available confocal microscopy filter sets, ICG dye was substituted for Alexa Fluor® 633 (AF633) at the same binding ratio. Conjugation of AF633 to antibodies followed the same procedure as the ICG conjugation. For B7-H3-AF633 and Iso- AF633 uptake studies, MS1B7-H3 cells were seeded on chambered coverglass culture dishes (Nunc™ Lab-Tek™ II Chambered Coverglass) at a density of 5 × 10⁴ cells/dish. On day two of culture, the cells were rinsed with PBS and the media replaced with incubation buffer (serum-free DMEM with 1% P/S). To label early endosomes and lysosomes, the cells were incubated with CellLight™ Early Endosomes-GFP (10 µL) or Lysosomes-GFP (LysoTracker™ Green, 75 nM), respectively, prior to addition of B7-H3-AF633 or Iso-AF633 (5 μg/dish) at 37°C for 1 h. After incubation, unbound B7-H3-AF633 and Iso-AF633 were removed with a gentle PBS wash and the media replaced prior to imaging. For assessment of distribution and colocalization of B7-H3-AF633 and Iso-AF633 with LysoTracker™ and CellLight™ Lysosomes-GFP in live cells, dishes were imaged while at 37°C and in a 5% CO2 environment at 630X using a Zeiss LSM 510 Meta NLO imaging system equipped with Argon and HeNe lasers and mounted on a vibration-free table for confocal fluorescence microscopy. Fiji software (LOCI, University of Wisconsin-Madison) was used to optimize image brightness and contrast.
Sensitivity of Spectroscopic Photoacoustic Imaging in Detecting B7-H3-targeted ICG in Mice
Murine vascular endothelial cells (MS1B7-H3) which stably express human B7-H3 were used to assess the minimum detectable concentration of B7-H3-targeted ICG using sPA and fluorescence imaging. 0.6 x 10⁶ MS1B7-H3 cells were plated in two six-well cell culture plates incubated at 37℃ with 5% CO2. Varying amounts (0, 0.1, 0.25, 0.5, 1.0, or 2.5 μg) of B7-H3-ICG or Iso-ICG were incubated with the cells for 24 h. Cells were rinsed in triplicate with PBS to remove free antibody-dye agent. Cells were dissociated from the plate with 0.5% trypsin for 4 min and collected into 2 ml Eppendorf tubes. Suspensions were spun at 300 x g for 5 min, supernatant was removed, and tubes with cell pellets were placed on ice. Immediately before subcutaneous injection into the flank of two nude mice, 50 µl of Matrigel were added to the cell pellets and thoroughly mixed resulting in maximum possible agent concentrations of 0, 13.3, 33.3, 66.5, 133, or 332.5 nM. Immediately after subcutaneous injection, each inoculated cell suspension underwent fluorescence imaging (ex 675/30 nm and em 720/20) using an IVIS Spectrum (Xenogen) and multiwavelength photoacoustic imaging from 680-950 nm using the Vevo LAZR (VisualSonics, Toronto, Canada). ROIs were drawn over each cell inoculation to determine signal levels. Imaging signals were plotted against concentration to determine the lowest detectable concentration of agent.
Antibody-ICG Reference Absorption Spectrum Inference after Intracellular Uptake
Using the same experimental setup used for the sensitivity study, the reference spectrum of intracellularly cleaved B7-H3-ICG to be used with the spectroscopic classification algorithm was determined. The average intensity of PA signal of the 333 nM cell inclusions was plotted versus wavelength and normalized. Using the reference spectrum, spectroscopic analysis was completed on the images of the inclusions with a previously described algorithm (9). sPA analysis was then used to reanalyze the molecular B7-H3 ICG signal detectable in the cell inoculations and the sPA molecular imaging signal was plotted against concentration to determine the lowest detectable concentration of B7-H3-ICG.
Murine Model of Breast Cancer Development
All experiments involving animals were approved by the Institutional Administrative Panel on Laboratory Animal Care at Stanford University. A transgenic mouse model of breast cancer (FVB/N-Tg(MMTVPyMT)634Mul) was used that spontaneously develops invasive breast carcinomas between 6 and 12 weeks of age in each mammary gland. Mice have 10 mammary glands each, and by age 12 weeks all 10 mammary glands harbor invasive breast cancer (49). All tumors had a maximum diameter of 3 - 10 mm as assessed by ultrasound imaging. Normal mammary glands from normal litter mates that were negative for the transgene were used as controls. Throughout the imaging studies, mice were anesthetized with 2% isoflurane in oxygen flowing at 2 L/min. Heart rate, ECG, and respiration rate were monitored using an Advanced Physiological Monitoring Unit, and the body temperature was maintained at 37 ºC with the use of a heated stages and pre-warmed ultrasound gel.
In Vivo sPA Molecular Imaging
The VevoLAZR (21 MHz transducer, lateral and axial resolution of 165 and 74 µm respectively, 10 mJ/cm2 average fluence, 10 ns pulse width, 20 Hz pulse repetition frequency) was used to obtain transverse, single-plane, multiwavelength photoacoustic images (680-900 nm, 10 nm increments) at the maximal gland diameter using co-registered B-mode ultrasound images for gland localization. The transducer surface was maintained at 9 mm from the surface of the skin coupled with clear, colorless gel to maintain even light illumination throughout the gland and to keep imaging consistency between time points. B-mode ultrasound images were used as reference to maintain consistent imaging planes between imaging time points. Fluorescence images were collected using the IVIS Spectrum Preclinical Imaging System (PerkinsElmer) in epifluorescence mode equipped with 710/30 nm and 820/20 nm filters for excitation and emission, respectively.
Animals with breast cancer in all 10 glands (at age 12 weeks) were intravenously injected through one of the tail veins with 33 µg of B7-H3-ICG (n=8, 80 glands), 33 µg Iso-ICG (n=3, 30 glands), or 3.0 µg free ICG (n=2, 20 glands). To further confirm binding specificity of B7-H3-ICG, two animals (20 glands) underwent sPA imaging after 100 µg of B7-H3 blocking antibody was injected 24 h before injection of the standard 33 µg dosage of B7-H3-ICG to effectively block the B7-H3 receptor. Age-matched, transgene negative, control mice without mammary tumors (n=6, 60 glands) were also injected with 33 µg of B7-H3-ICG. B-mode ultrasound and multiwavelength photoacoustic images were obtained before and at 24, 48, 72, and 96 hours after intravenous contrast agent injections as described above. Animals injected with free ICG underwent a shortened imaging schedule (before, 0.5, 0.75, 1, 2, and 24 h after injection) with fluorescence imaging due to rapid ICG clearance from circulation, prohibiting sPA imaging.
Analysis of In Vivo Imaging Data
B7-H3-targeted sPA imaging signal was measured using a MATLAB-based linear least squares error classification algorithm that has been described in detail elsewhere (9,22,50). Briefly, co-registered B-mode ultrasound images guided region of interest (ROI) selection over the entire mammary gland. Then, wavelength dependent changes in signal amplitude were compared to the known optical absorption properties of ICG and oxygenated and deoxygenated hemoglobin using linear least square regression to determine the relative concentrations of each photoabsorber within the ROI.
Molecular B7-H3 signal was calculated as the relative concentration within the ROI multiplied by the ratio of pixels classified as containing B7-H3 compared to the before injection signal.
For imaging of free ICG, quantitative measurements of fluorescence signal were made using Living Image Software 4.0 (PerkinElmer). Fixed sized ROIs were placed over each mammary gland guided by co-registered photographs and average radiant efficiency (p/sec//cm2/sr/µW/cm2) was measured. For each time point, background blood pool signal was measured with an ROI over the sternum. Fluorescence signal ratios were calculated as the radiant efficiency in the mammary gland over the background signal.
Immunofluorescence Staining of B7-H3 Expression in Murine Mammary Tissues
B7-H3 expression in the transgenic animal model was confirmed with ex vivo histopathological and immunofluorescence staining. At the end of the imaging protocols, all mice were euthanized, and mammary glands were excised and immediately frozen in optimal cutting temperature (OCT) compound. Frozen tissue sections (10 μm) were rinsed with PBS for 5 minutes to remove the OCT and were permeabilized with 0.5% Triton in PBS for 15 minutes with subsequent blocking with 5% BSA, 5% goat and donkey serum in PBS for 1 h at room temperature. Sections were then co-incubated with rabbit anti-mouse B7-H3 and rat anti-mouse CD31 antibodies (Abcam Inc.) overnight at 4°C at a dilution of 1:50 and 1:100, respectively, and were visualized by using AlexaFluor-488 conjugated goat anti-rabbit or AlexaFluor-546 anti-rat secondary antibodies (1:300), respectively (Invitrogen, Grand Island, NY). Fluorescent images were acquired with a confocal microscope (LSM 510 Meta confocal microscope, Carl Zeiss) at a magnification of 200x.
Histopathological Analysis of Murine Mammary Tissue
After imaging, select mammary tissues were excised, formalin-fixed and paraffin-embedded. Tissue sections (10 μm) of all the tissues were stained with Hematoxylin and Eosin (H&E) via standard protocol. One breast pathologist blinded to the imaging finding rendered histological diagnosis of breast cancer versus normal tissue. Normal mammary tissue was comprised of primary fatty tissues inclusive of a few, well-organized, ductal epithelial cells. Cancer was defined as extensive proliferation of breast tissue into a solid mass with little or no fatty tissue in the mammary gland (49).
Histological Confirmation of ICG Localization in Murine Breast Cancer
To confirm B7-H3-ICG and Iso-ICG accumulation in breast cancer, an Odyssey® CLx -1100 (LI-OCR, USA) near infrared fluorescence imager was used to detect ICG signal in tissue sections. B7-H3-ICG and Iso-ICG (33 µg) were injected into additional MMTV-PyMT transgenic mice with either normal mammary glands (n=5 mice) or glands containing breast cancer (n=5 mice). After 96 h, animals were euthanized and glands were immediately collected and frozen in OCT. Tissue sections (15 µm thickness) of 5 different glands of each condition (normal and breast cancer) were rinsed in PBS for 5 min to remove OCT, and then fixed for 5 min in 4% PFA. Slides were then imaged on the Odyssey® CLx with 21 µm resolution and 685 nm and 785 nm excitation wavelengths. Images were batch-adjusted for contrast and brightness using Fiji software (LOCI, University of Wisconsin-Madison) and quantified using the mean corrected total gland fluorescence and standard deviation as described previously (51).
Statistical Analysis
Statistical differences in B7-H3 expression in various subtypes in patient samples was analyzed using the Mann-Whitney test. Receiver operating curves (ROC) were used to determine the diagnostic accuracy of B7-H3 in differentiating cancer versus non-cancerous breast lesions. All in vivo sPA measurements were summarized as means and the associated 95% confidence intervals. P-values were determined by taking a log transformation of the imaging signal values and performing a One-Sampled Wilcoxon Rank Sum test to compare between time points. Statistical differences in ICG accumulation as measured with a near-infrared fluorescence scanner were presented as means ± standard deviation. All statistical analysis was performed using Prism GraphPad (Version 6.04) software. A two-sided P-value of less than 0.05 was considered indicative of a statistically significant difference between values.
Results
B7-H3 Expression in Human Breast Tissues
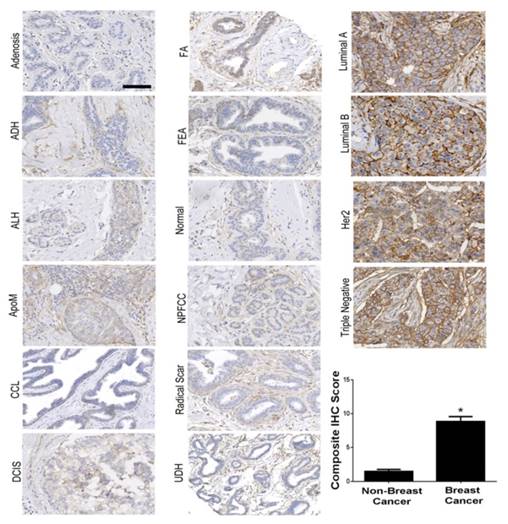
B7-H3 expression was assessed on both the breast cancer neovasculature and tumor epithelium and stroma in four major subtypes of human breast cancer (n=97), normal tissue (n=53), and 11 different benign and precursor breast pathologies (n=129; Supplemental Table 1). B7-H3 expression was identified on the vascular endothelium, the tumor epithelium, within the cytoplasm of tumor cells, and on fibroblast like cells within the stroma. Overall, B7-H3 expression was significantly (P<0.001) higher in breast cancer (mean composite score 8.8) compared to normal tissue, benign, and precursor lesions (mean composite score, 1.4; Figure 2). Individual composite scores for all benign and malignant subtypes are shown in Supplementary Table 1. Receiver operating characteristic (ROC) analysis indicated that B7-H3 epithelial immunostaining could distinguish breast cancer from normal tissue, benign and precursor lesions with an area under the ROC curve (AUC) of 0.93 (0.90-0.96) for all tissue samples.
Immunohistochemical (IHC) analysis of B7-H3 expression in human breast tissues. Micrographs showing representative staining results for B7-H3 (brown) from normal breast tissues, various benign and precursor breast pathologies, and four subtypes of invasive breast carcinomas obtained from biopsy or surgical resection. The boxplot summarizes the composite IHC scores on B7-H3-stained tissues from nonmalignant and malignant tissues showing a statistically significant difference of the means between the groups. *P<0.001; error bars = standard deviations, Scale bar = 100µm.
B7-H3 Antibody-ICG and Control Agent Conjugation and Characterization
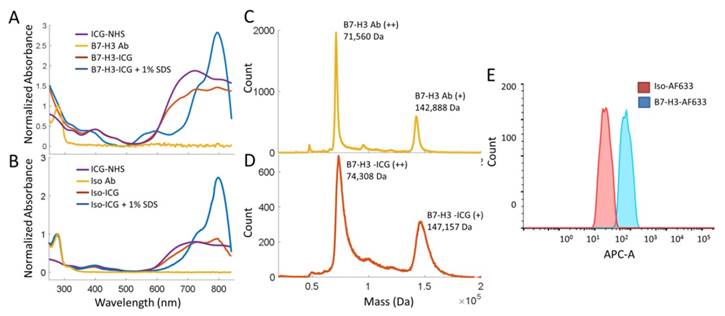
Synthesis and characterization of the B7-H3-targeted antibody-ICG contrast agent and controls were performed through mass spectrometry, spectrophotometry, and flow cytometry. B7-H3-ICG and Iso-ICG (as well as B7-H3-AF633 and Iso-AF633) were shown to have on average 7-8 ICG dye molecules per antibody by mass spectrometric and spectrophotometric analysis. The attachment of AFF633 to the B7-H3 antibody at the same molar ratio and chemical reaction as ICG-NHS did not alter the binding specificity of the antibody to B7-H3 compared to an Isotype antibody as demonstrated by flow cytometry (Figure 3). Spectrophotometric analysis of the Ab-AF633 agents is shown in Supplemental Figure 1.
Characterization of B7-H3 Antibody-ICG Dye Conjugates. A. Absorbance spectra of both the B7-H3 antibody and ICG-NHS before conjugation, the B7-H3-ICG conjugate, and the B7-H3-ICG conjugate in 1% SDS for unquenched absorption signal. Antibody and conjugates are normalized at 280 nm. Dye is normalized to the antibody-dye conjugate at 400 nm. B. Absorbance spectra of both the isotype control antibody and ICG-NHS before conjugation, the Iso-ICG conjugate, and the Iso-ICG conjugate in 1% SDS for unquenched absorption signal. Antibody and conjugates are normalized at 280 nm. Dye is normalized to the antibody-dye conjugate at 400 nm. The specific (B7-H3) and isotype control antibody conjugates show similar absorbance spectra before cellular internalization degradation. C. Mass spectroscopic analysis of the B7-H3 antibody before dye conjugation. The doubly charged peak averages 71560 ± 80 Da. D. Mass spectroscopic analysis of the B7-H3 antibody after ICG dye conjugation. The doubly charged peak averages 74308 ± 187 DA. The difference represents the average binding of approximately 7 ICG dye molecules concurrent with spectrophotometric analysis. However, the broadening of the peak at full width half maximum suggests this is a variable amount. E. Flow cytometry confirmed binding of AF633-NHS to the anti-B7-H3 antibody and that conjugation does not prevent specific binding of B7-H3-AF633 (blue, AF633 substituted for ICG to allow for visible range detection) to MS1B7-H3 cells as compared to Iso-AF633 (red).
Live Cell Imaging of Cellular B7-H3-Antibody Uptake and lntracellular Localization
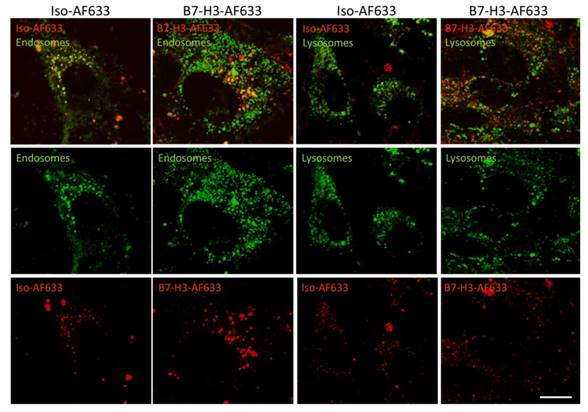
Live cell confocal imaging at a magnification of 630X was performed to monitor cellular uptake of AF633 fluorescently-labeled anti-B7-H3 antibody and isotype control antibody into early endosomes and lysosomes (Figure 4). Cells showed co-localization of B7-H3-AF633 in both early endosomes and lysosomes while Iso-AF633 showed co-localized signal only with early endosomes, suggesting that B7-H3-targeted antibody, but not control antibody, entered a degradation pathway upon cellular uptake.
Live-Cell Confocal Imaging of B7-H3-AF633 Endocytosis and Degradation. B7-H3 expressing cells stained with endosomal or lysosomal tracker (green) and co-incubated with Iso-AF633 or B7-H3-AF633 shown in red (AF633 is substituted for ICG to allow visualization with confocal microscopy) with both combined (first row) and individual channel images (second and third row). Iso-AF633 is almost exclusively colocalized (yellow) with early endosomes inside the cell (left column), while B7-H3-AF633 shows partial colocalization (second column). Iso-AF633 has little to no colocalization (yellow) with lysosomes (third column), while B7-H3-AF633 shows partial colocalization (last column). These micrographs suggest that B7-H3-dye undergoes intracellular degradation while Iso-dye is recycled without degradation, causing spectral shifts in ICG, allowing highly specific sPA detection of B7-H3-ICG compared to the isotype control agent. Scale bar represents 15 µm.
Determination of a sPA Reference Spectrum of Intracellular B7-H3-ICG vs Iso-ICG
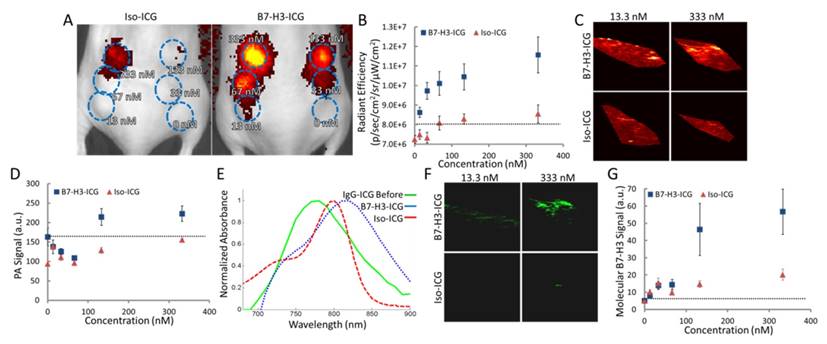
After live-cell imaging suggested B7-H3 antibody enters into lysosomes which then frees the dye from B7-H3-AF633 while Iso-dye likely stays intact, we assessed the specific optical reference spectrum of intracellularly free versus bound ICG by examining the PA signal obtained over multiple wavelengths from cells incubated with increasing concentrations of B7-H3-ICG and Iso-ICG and injected subcutaneously into mice (Figure 5A and B). Photoacoustic imaging performed at 800 nm (the peak of ICG optical absorption) was only able to visualize injected cells incubated with B7-H3-ICG between concentrations of 133 and 332.5 nM; cells incubated with Iso-ICG could not be visualized (Figure 5C and D) over background endogenous signal. By plotting the PA signal intensity of the cell inoculations, we found the optical peak of intracellular B7-H3-ICG was 825 nm, while the peak from intracellular Iso-ICG was 800 nm (Figure 5E). Next, using the reference spectrum for internalized and degraded B7-H3-ICG from Figure 5E, the sPA B7-H3 molecular imaging signal was processed using the sPA algorithm and representative sPA B7-H3 images are shown in Figure 5F and quantified in Figure 5G. Compared to single wavelength photoacoustic imaging, sPA imaging was specific to B7-H3-ICG, shown by the suppression of Iso-ICG signal, and showed increased sensitivity to B7-H3-ICG signal detecting concentrations as low as 13.3 nM.
Determining Sensitivity of and Reference Spectrum for Fluorescence and sPA Imaging. A. Fluorescent image of mice with six subcutaneous inoculates each of MS1B7-H3 cells incubated with Iso-ICG or B7-H3-ICG in diminishing concentrations (blue ROIs). B. Fluorescence signal intensity over subcutaneous cell inoculations. Fluorescence is able to detect 13.3 nM B7-H3-ICG. C. Single wavelength photoacoustic images of cell inoculations. Only the inoculation of cells incubated 333 nM B7-H3-ICG shows average signal distinguishable from background signal (quantified in E). D. Photoacoustic imaging signal intensities at a single wavelength (800 nm) are only able to detect the two highest concentrations of B7-H3-ICG incubated with cells. E. Plotting average photoacoustic signal intensity within an ROI over the cell inclusions shows relative absorbance spectra, which differ in peak wavelength and shape. F. Using the determined reference spectrum from E with the sPA algorithm, molecular B7-H3 signal can be specifically distinguished from the multiwavelength photoacoustic images. G. sPA molecular imaging is capable of detecting B7-H3-ICG at 13.3 nM.
sPA Molecular Imaging of B7-H3 in Vivo
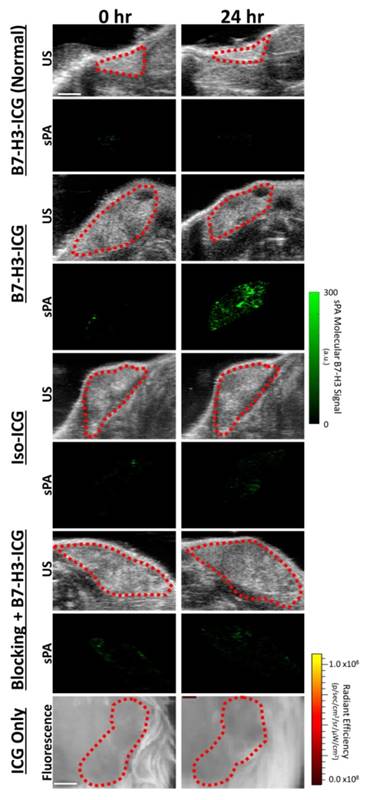
To assess feasibility of B7-H3-targeted sPA using an antibody-dye contrast agent to image B7-H3 expression in a transgenic model of breast cancer, animals underwent sPA imaging before, and 24, 48, 72, and 96 h after injection of B7-H3-ICG or control agents (representative images in Figure 6 and Supplementary Figure S2). Data provided here are combined from all time points for each imaging condition. After injection of B7-H3-ICG, glands with invasive breast carcinomas showed an average 3.01 (2.63, 3.38; P<0.01) fold increase in molecular B7-H3 signal compared to baseline signal before agent administration. None of the experimental control conditions when considering combined time points 24-96 h [Iso-ICG: 1.24 (1.08, 1.40), blocked B7-H3-ICG: 1.22 (0.97, 1.48), and free ICG in tumor positive mice: 1.08 (1.06, 1.10), or B7-H3-ICG in tumor negative mice: 1.13 (1.03, 1.23)] showed statistically significant increase (P>0.05) in molecular B7-H3 signal compared to baseline signal (individual time points are quantified in Figure 7 and Supplementary Table S2).
Ultrasound and sPA Molecular Imaging of B7-H3. Representative B-mode ultrasound and sPA molecular images of the B7-H3-ICG accumulation in mice with normal mammary glands and breast cancer, of B7-H3-ICG in mice with breast cancer after a blocking injection of 100 µg of anti-B7-H3 antibody 24 h previously, of mice with breast cancer injected with Iso-ICG, and of mice with breast cancer injected with ICG alone (fluorescence imaging due to imaging time constraints). B-mode ultrasound images were used to select the desired ROI (red dash lines) over the mammary gland to be used with the sPA imaging algorithm. Only sPA molecular imaging of B7-H3 shows substantial accumulation within mammary tumors. Scale bar in in ultrasound and sPA images represents 2 mm and in fluorescence imaging represents 1 mm. Representative images of other time points can be found in Supplementary Figure S2.
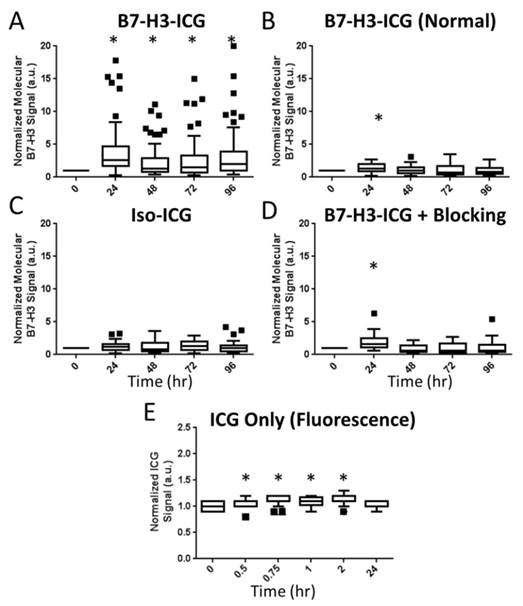
Summary Boxplots of sPA Data. Boxplots representing all data points at all time points for all experimental conditions. Data are presented numerically in Supplemental Table 1. sPA B7-H3 molecular signal is only detectable in the positive test condition (A. B7-H3-ICG in a tumor positive animal as compared to B. B7-H3-ICG in normal mammary glands, C. Iso-ICG, D. B7-H3-ICG in animals which have had B7-H3 receptors blocked with additional B7-H3 antibody, and E. Free ICG - note the shorter imaging time frame). The difference in signal demonstrates the specificity of sPA imaging for B7-H3-ICG compared to Iso-ICG based on the change in absorbance spectrum after endocytosis. sPA data is normalized to zero as the data are compared to the 0 h time point B7-H3 signal, while fluorescence data (free ICG) are normalized to one using an intra-time point comparison to background signal. Statistical significance (P<0.01) compared to the 0 h time point is denoted with and asterisks (*). Boxplots follow Tukey rules.
After imaging, breast tissues were excised and histopathological and immunofluorescence staining confirmed overexpression of B7-H3 in breast cancer compared to normal breast tissue (Supplementary Figure S3).
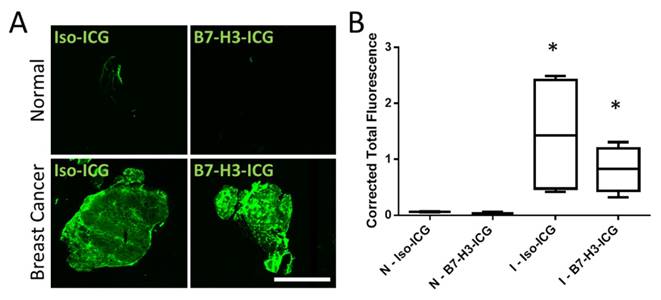
To further confirm that both B7-H3-ICG and Iso-ICG accumulate within tumor tissues and to highlight sPA imaging specificity to endocytosed and degraded B7-H3-ICG, ICG was directly visualized by using a near-infrared fluorescent imager. As expected, ICG signal was detected in breast cancer after injection of both B7-H3-ICG and Iso-ICG with corrected total fluorescence values of 0.82 ± 0.40 and 1.44 ± 1.06 respectively, while normal mammary glands did not show ICG accumulation with corrected total fluorescence values of 0.08 ± 0.03 and 0.04 ± 0.02 respectively (Figure 8).
NIR Fluorescent Scans of ICG in Invasive Mammary Carcinomas. Accumulation of ICG was confirmed through near-infrared imaging of tissue sections. A) Normal mammary gland tissues with circulating B7-H3-ICG and Iso-ICG show no accumulation of ICG. Mammary glands containing breast cancer with circulating B7-H3-ICG and Iso-ICG show accumulation of ICG. These images help to confirm the specificity of sPA to B7-H3-ICG versus Iso-ICG. Scale bar represents 4 mm. B) Boxplots of corrected total gland fluorescence signal from ICG within normal (N) glands and gland with invasive breast carcinoma (I) (n = 5) from each condition after 96 h circulation with B7-H3-ICG or Iso-ICG. Glands with invasive tumors show significantly higher (P < 0.05) ICG signal compared to normal glands but are not statistically significantly different from each other.
Discussion
The results of our study are several folds. First, we show for the first time that the B7-H3 protein can be used to distinguish between human breast cancer and non-breast cancer tissue with high diagnostic accuracy due to both vascular and epithelial cell expression. Second, we synthesized a molecularly-specific antibody dye contrast agent for dual fluorescent and sPA molecular imaging that showed differential uptake in breast cancer versus normal mammary tissue in a transgenic mouse model of breast cancer closely recapitulating human disease. Third, our in vitro, in vivo, and ex vivo studies suggest sPA is capable of detecting a shift in optical absorption spectrum of ICG that occurs during cellular endocytosis and subsequent degradation of the B7-H3-ICG agent, allowing for highly specific differentiation between freely circulating B7-H3-ICG, nonspecific control agents, endogenous photoabsorbers and B7-H3-ICG that has found its molecular target.
Currently ultrasound is being used as a second line imaging method for breast cancer imaging to help compensate for the low sensitivity of mammography, especially in women with dense breast tissues. However, ultrasound suffers from low specificity and therefore a complimentary technique would be helpful to improve its accuracy in breast cancer imaging. Photoacoustic imaging, a complementary modality to ultrasound using similar hardware, has recently been shown capable of imaging at clinical depths relevant to breast imaging (13,16,52).
Previously, B7-H3 has been found to be a specific marker on the neovasculature of breast cancer (46). Our current study represents the first results describing B7-H3 expression on epithelial cells of human breast cancer. Abundant expression in the extravascular compartment provides an optimal target for photoacoustic molecular imaging combined with small molecule contrast agents due to the ample binding sites allowing for maximal accumulation of molecularly-specific, small-molecule contrast agents. Here we show only minimal, if any, expression of B7-H3 on 11 different types of benign and precursor lesions in human tissues and strong expression in the four most common subtypes of malignant breast lesions.
The development of a molecularly-specific contrast agent for sPA molecular imaging was a key aim of this study. Commercially available ICG conjugated with an NHS ester group allowed for a rapid and straight forward synthesis, which can be purified due to its visible band in a size exclusion column, and concentrated using a molecular weight cutoff centrifugal filter. Mass spectrometric and spectrophotometric analysis confirmed an average of 7-8 ICG molecules per antibody; however the breadth of the mass spectrometry peak suggests a range in binding ratios. The initial absorbance spectrum was similar for both B7-H3-ICG and the nonspecific control, Iso-ICG. The specificity of B7-H3-AF633 (AF633 substituted for ICG under the same binding conditions) to allow visualization) was not changed by conjugation with ICG as shown by flow cytometry.
Next, we performed in vitro experiments to confirm our hypothesis that 1), the intracellular degradation of B7-H3-ICG would provide a sufficient shift in the optical absorption spectrum of ICG to allow for sPA molecular imaging detection, and 2), that this shift would allow differentiation between endogenous background signal, contrast agent blood-pool signal, and nonspecific agent tumor accumulation, resulting in a highly specific and sensitive molecular imaging methodology. First, the intracellular destination of B7-H3-AF633 (substituted for ICG) and Iso-AF633 were examined using live-cell confocal imaging. B7-H3-dye followed a pathway for cellular degradation, while the Iso-dye followed an intracellular recycling pathway. Therefore, B7-H3-ICG and Iso-ICG should have different optical absorption spectra after tumor accumulation and cellular internalization because of their differing intracellular pathways. Second, sensitivity of sPA imaging for B7-H3-ICG was assessed. Single wavelength photoacoustic imaging was only able to visualize the two highest concentrations of B7-H3-ICG over background signal. However, after applying the sPA molecular imaging algorithm to the cell inoculations, it was not only possible to differentiate between the molecularly-targeted and non-targeted contrast agents, but also to detect the lowest concentration of B7-H3-ICG incubated with cells with high sensitivity (13 nM). sPA molecular imaging provided not only high sensitivity but also high specificity to likely endocytosed B7-H3-ICG and, therefore, was able to differentiate B7-H3-ICG from intact Iso-ICG.
sPA molecular imaging of B7-H3-ICG was then performed to detect and differentiate breast carcinomas from normal tissues. The amount of B7-H3-ICG used per animal for this study (33 µg) approximately represents a one-third of antibody typically used for therapeutic purposes in clinics (53). A transgenic mouse model of breast cancer development that closely recapitulates human disease was used, and IHC staining confirmed expression of B7-H3 in breast cancer but not in normal mammary tissues. sPA showed a more than three-fold higher signal in breast cancer than in normal mammary glands using B7-H3-ICG. The specificity of the technique was demonstrated on ex vivo near-infrared fluorescent scans of tumor sections showing strong accumulation of both B7-H3-ICG and control Iso-ICG in breast cancer. Even though similar amounts of B7-H3-ICG and Iso-ICG were present in the tumors, sPA molecular imaging was able to suppress ICG signal from Iso-ICG based on the shift of optical absorption that occurs during cellular degradation of B7-H3-ICG.
We acknowledge several limitations of our study. First, the linear least square error-based spectroscopic B7-H3 recognition algorithm has several known limitations (22,54), the largest of which is that this model tries to summarize complex light-tissue interactions using simplified empirical equations representing photoacoustic signal generation within tissues based on the assumed optical absorption spectra within tissues. The dynamic optical absorption spectrum of ICG changes drastically based on environment, concentration, and protein bound status, however a priori knowledge of this spectrum had to be determined for accurate classification of molecular B7-H3-ICG. We approximated this spectrum through combined in vitro/in vivo experiments in order to distinguish between degraded and intact B7-H3-ICG. However, the spectrum is likely not representative for different applications. Other regression methods, such as mean square error, or classification methods not dependent on a priori optical absorption knowledge, such as machine learning techniques, could improve differentiation of B7-H3-ICG signal. Furthermore, there are no mouse models of benign lesions available, preventing assessment of B7-H3-ICG imaging in benign lesions, such as fibroadenomas, in mice. Finally, photoacoustic imaging was performed in two dimensions only, allowing for potential error in realigning imaging planes between experimental time points, though great care was taken to ensure planes remained constant.
In conclusion, our study suggests that B7-H3 is a highly specific marker of human breast cancer with minimal expression on the endothelium and epithelium in normal tissues, benign, and precursor lesions. The abundant endothelial and epithelial expression provides ample binding sites for B7-H3-ICG and allows differentiation between breast cancer and normal breast tissue in mice by sPA imaging.
Supplementary Material
Supplementary figures and tables.
Abbreviations
DCIS: Ductal carcinoma in situ; ROI: region of interest; ROC: receiver operating characteristic; AUC: area under the curve; hematoxylin-eosin (H&E). ADH: Atypical ductal hyperplasia; ALH: Atypical lobular hyperplasia; ApoM: Apocrine metaplasia; CCL: Columnar cell lesion; DCIS: Ductal carcinoma in situ; FA: Fibroadenoma; FEA: Flat epithelial atypia; NPFCC: Non-proliferative fibrocystic changes; UDH: Usual ductal hyperplasia; Her2: Human epidermal growth factor receptor type 2 positive cancer; Luminal A: estrogen receptor and/or progesterone receptor positive cancer; Luminal B: estrogen receptor and/or progesterone receptor positive and Her2 positive cancer; Triple negative: estrogen, progesterone and Her2 negative cancer.
Acknowledgements
We thank Dr. Tim Doyle (Small Animal Imaging Facility-Sci3) and Dr. Andrew Olson (Stanford Neuroscience Microscopy Service), and Dr. Eben Rosenthal for equipment use. Thank you to Dr. Michelle James, Dr. Kenneth Lau, and Emily Johnson for their help with mass spectrometry.
Grant Support
This study was supported by NIH R21EB022214 grant (JKW), NIH R01 CA155289 grant (JKW), and NIH R25 CA118681 training grant (KEW). The Vevo LAZR was upgraded under grant NIH 1-S10-OD01034401. Stanford Neuroscience Microscopy Service was supported by NIH NS069375.
Competing Interests
The authors have declared that no competing interest exists.
References
1. Cancer Facts & Figures 2016 [cited 2016 Mar 21]. American Cancer Society I. http://www.cancer.org/research/cancerfactsstatistics/cancerfactsfigures2016/
2. Kolb TM, Lichy J, Newhouse JH. Comparison of the Performance of Screening Mammography, Physical Examination, and Breast US and Evaluation of Factors that Influence Them: An Analysis of 27,825 Patient Evaluations. Radiology. 2002;225(1):165-75
3. Mandelson MT. Breast Density as a Predictor of Mammographic Detection: Comparison of Interval- and Screen-Detected Cancers. J Natl Cancer Inst. 2000;92(13):1081-7
4. Boyd NF, Guo H, Martin LJ, Sun L, Stone J, Fishell E. et al. Mammographic Density and the Risk and Detection of Breast Cancer. N Engl J Med. 2007;356(3):227-36
5. Berg WA, Blume JD, Cormack JB, Mendelson EB, Lehrer D, Böhm-Vélez M. et al. Combined screening with ultrasound and mammography vs mammography alone in women at elevated risk of breast cancer. JAMA. 2008;299(18):2151-63
6. Scheel JR, Lee JM, Sprague BL, Lee CI, Lehman CD. Screening ultrasound as an adjunct to mammography in women with mammographically dense breasts. Am J Obstet Gynecol. 2015;212(1):9-17
7. Hooley RJ, Greenberg KL, Stackhouse RM, Geisel JL, Butler RS, Philpotts LE. Screening US in patients with mammographically dense breasts: initial experience with Connecticut Public Act 09-41. Radiology. 2012;265(1):59-69
8. Sprague BL, Stout NK, Schechter C, van Ravesteyn NT, Cevik M, Alagoz O. et al. Benefits, harms, and cost-effectiveness of supplemental ultrasonography screening for women with dense breasts. Ann Intern Med. 2015;162(3):157-66
9. Wilson KE, Bachawal S V, Tian L, Willmann JK. Multiparametric spectroscopic photoacoustic imaging of breast cancer development in a transgenic mouse model. Theranostics. 2014;4(11):1062-71
10. Li R, Wang P, Lan L, Lloyd FP, Goergen CJ, Chen S. et al. Assessing breast tumor margin by multispectral photoacoustic tomography. Biomed Opt Express. 2015;6(4):1273-81
11. Zackrisson S, van de Ven SMWY, Gambhir SS. Light in and sound out: emerging translational strategies for photoacoustic imaging. Cancer Res. 2014;74(4):979-1004
12. Wilson KE, Wang TY, Willmann JK. Acoustic and Photoacoustic Molecular Imaging of Cancer. J Nucl Med. 2013;54(11):1851-4
13. Heijblom M, Piras D, Xia W, van Hespen JCG, Klaase JM, van den Engh FM. et al. Visualizing breast cancer using the Twente photoacoustic mammoscope: what do we learn from twelve new patient measurements? Opt Express. 2012;20(11):11582-97
14. Zalev J, Clingman B, Smith RJ, Herzog D, Miller T, Stavros AT. et al. Clinical feasibility study of combined opto-acoustic and ultrasonic imaging modality providing coregistered functional and anatomical maps of breast tumors. Proceedings of SPIE - The International Society for Optical Engineering. 2013:858103-9
15. Kruger RA, Lam RB, Reinecke DR, Del Rio SP, Doyle RP. Photoacoustic angiography of the breast. Med Phys. 2010;37(11):6096-100
16. Kitai T, Torii M, Sugie T, Kanao S, Mikami Y, Shiina T. et al. Photoacoustic mammography: Initial clinical results. Breast Cancer. 2014;21(2):146-53
17. Wang L V, Wu H-I, Masters BR. Biomedical Optics, Principles and Imaging. New Jersey, USA: Wiley-Interscience. 2008
18. Beard P. Biomedical photoacoustic imaging. Interface Focus. 2011;1(4):602-31
19. Zhou Y, Wang D, Zhang Y, Chitgupi U, Geng J, Wang Y. et al. A Phosphorus Phthalocyanine Formulation with Intense Absorbance at 1000 nm for Deep Optical Imaging. Theranostics. 2016;6(5):688-97
20. Sethuraman S, Amirian JH, Litovsky SH, Smalling RW, Emelianov SY. Spectroscopic intravascular photoacoustic imaging to differentiate atherosclerotic plaques. Opt Express. 2008;16(5):3362-7
21. Mallidi S, Larson T, Tam J, Joshi PP, Karpiouk A, Sokolov K. et al. Multiwavelength Photoacoustic Imaging and Plasmon Resonance Coupling of Gold Nanoparticles for Selective Detection of Cancer. Nano Lett. 2009;9(8):2825-31
22. Kim S, Chen Y-S, Luke GP, Emelianov SY. In vivo three-dimensional spectroscopic photoacoustic imaging for monitoring nanoparticle delivery. Biomed Opt Express. 2011;2(9):2540-50
23. Luke GP, Yeager D, Emelianov SY. Biomedical applications of photoacoustic imaging with exogenous contrast agents. Ann Biomed Eng. 2012;40(2):422-37
24. Yang X, Stein EW, Ashkenazi S, Wang L V. Nanoparticles for photoacoustic imaging. Wiley Interdiscip Rev Nanomed Nanobiotechnol. 2009;1(4):360-8
25. Khlebtsov N, Dykman L. Biodistribution and toxicity of engineered gold nanoparticles: a review of in vitro and in vivo studies. Chem Soc Rev. 2011;40(3):1647-71
26. Boni L, David G, Mangano A, Dionigi G, Rausei S, Spampatti S. et al. Clinical applications of indocyanine green (ICG) enhanced fluorescence in laparoscopic surgery. Surg Endosc. 2015;29(7):2046-55
27. Ogawa M, Kosaka N, Choyke PL, Kobayashi H. In vivo molecular imaging of cancer with a quenching near-infrared fluorescent probe using conjugates of monoclonal antibodies and indocyanine green. Cancer Res. 2009;69(4):1268-72
28. Cherrick GR, Stein SW, Leevy CM, Davidson CS. Indocyanine green: observations on its physical properties, plasma decay, and hepatic extraction. J Clin Invest. 1960;39:592-600
29. Byrd BD, Heintzelman DL, McNally-Heintzelman KM. Absorption properties of alternative chromophores for use in laser tissue soldering applications. Biomed Sci Instrum. 2003;39:6-11
30. Lyu Y, Fang Y, Miao Q, Zhen X, Ding D, Pu K. Intraparticle Molecular Orbital Engineering of Semiconducting Polymer Nanoparticles as Amplified Theranostics for in Vivo Photoacoustic Imaging and Photothermal Therapy. ACS Nano. 2016;10(4):4472-81
31. Optical Properties Spectra. Prahl S. http://omlc.org/spectra/
32. Sano K, Ohashi M, Kanazaki K, Ding N, Deguchi J, Kanada Y. et al. In vivo photoacoustic imaging of cancer using indocyanine green-labeled monoclonal antibody targeting the epidermal growth factor receptor. Biochem Biophys Res Commun. 2015;464(3):820-5
33. Nakajima T, Mitsunaga M, Bander NH, Heston WD, Choyke PL, Kobayashi H. Targeted, activatable, in vivo fluorescence imaging of prostate-specific membrane antigen (PSMA) positive tumors using the quenched humanized J591 antibody-indocyanine green (ICG) conjugate. Bioconjug Chem. 2011;22(8):1700-5
34. Kobayashi H, Choyke PL. Target-cancer-cell-specific activatable fluorescence imaging probes: Rational design and in vivo applications. Acc Chem Res. 2011;44(2):83-90
35. Harari D, Yarden Y. Molecular mechanisms underlying ErbB2/HER2 action in breast cancer. Oncogene. 2000;19(53):6102-14
36. Mach J-P, Chatal J-F, Lumbroso J-D, Buchegger F, Forni M, Ritschard J. et al. Tumor Localization in Patients by Radiolabeled Monoclonal Antibodies against Colon Carcinoma. Cancer Res. 1983;43(11):5593-600
37. Zalutsky MR, Moseley RP, Coakham HB, Coleman RE, Bigner DD. Pharmacokinetics and Tumor Localization of 131I-Labeled Anti-Tenascin Monoclonal Antibody 81C6 in Patients with Gliomas and Other Intracranial Malignancies. Cancer Res. 1989;49(10):2807-13
38. Juweid M, Neumann R, Paik C, Perez-Bacete MJ, Sato J, van Osdol W. et al. Micropharmacology of Monoclonal Antibodies in Solid Tumors: Direct Experimental Evidence for a Binding Site Barrier. Cancer Res. 1992;52(19):5144-53
39. Eccles SA, Purvies HP, Styles JM, Hobbs SM, Dean CJ. Pharmacokinetic studies of radiolabelled rat monoclonal antibodies recognising syngeneic sarcoma antigens. II. Effect of host age and immune status. Cancer Immunol Immunother. 1989;30(1):13-20
40. Netti PA, Hamberg LM, Babich JW, Kierstead D, Graham W, Hunter GJ. et al. Enhancement of fluid filtration across tumor vessels: Implication for delivery of macromolecules. Proc Natl Acad Sci U S A. 1999;96(6):3137-42
41. Maeda H, Wu J, Sawa T, Matsumura Y, Hori K. Tumor vascular permeability and the EPR effect in macromolecular therapeutics: a review. J Control Release. 2000;65(1-2):271-84
42. Prabhakar U, Maeda H, Jain RK, Sevick-Muraca EM, Zamboni W, Farokhzad OC. et al. Challenges and key considerations of the enhanced permeability and retention effect for nanomedicine drug delivery in oncology. Cancer Res. 2013;73(8):2412-7
43. Torchilin V. Tumor delivery of macromolecular drugs based on the EPR effect. Adv Drug Deliv Rev. 2011;63(3):131-5
44. Kuo TT, Baker K, Yoshida M, Qiao S-W, Aveson VG, Lencer WI. et al. Neonatal Fc receptor: from immunity to therapeutics. J Clin Immunol. 2010;30(6):777-89
45. Roopenian DC, Akilesh S. FcRn: the neonatal Fc receptor comes of age. Nat Rev Immunol. 2007;7(9):715-25
46. Bachawal S V, Jensen KC, Wilson KE, Tain L, Lutz AM, Willmann JK. Breast cancer detection by B7-H3 targeted ultrasound molecular imaging. Cancer Res. 2015;75(12):2501-9
47. Schaafsma BE, Mieog JSD, Hutteman M, van der Vorst JR, Kuppen PJK, Löwik CWGM. et al. The clinical use of indocyanine green as a near-infrared fluorescent contrast agent for image-guided oncologic surgery. J Surg Oncol. 2011;104(3):323-32
48. Lutz AM, Bachawal S V, Drescher CW, Pysz MA, Willmann JK, Gambhir SS. Ultrasound molecular imaging in a human CD276 expression-modulated murine ovarian cancer model. Clin Cancer Res. 2014;20(5):1313-22
49. Cardiff RD. Validity of mouse mammary tumour models for human breast cancer: comparative pathology. Microsc Res Tech. 2001;52(2):224-30
50. Luke GP, Emelianov SY. Label-free Detection of Lymph Node Metastases with US-guided Functional Photoacoustic Imaging. Radiology. 2015;277(2):435-42
51. Burgess A, Vigneron S, Brioudes E, Labbé J-C, Lorca T, Castro A. Loss of human Greatwall results in G2 arrest and multiple mitotic defects due to deregulation of the cyclin B-Cdc2/PP2A balance. Proc Natl Acad Sci U S A. 2010;107(28):12564-9
52. Kruger RA, Kuzmiak CM, Lam RB, Reinecke DR, Del Rio SP, Steed D. Dedicated 3D photoacoustic breast imaging. Med Phys. 2013;40(11):113301
53. Keizer RJ, Huitema ADR, Schellens JHM, Beijnen JH. Clinical pharmacokinetics of therapeutic monoclonal antibodies. Clin Pharmacokinet. 2010;49(8):493-507
54. Luke GP, Nam SY, Emelianov SY. Optical wavelength selection for improved spectroscopic photoacoustic imaging. Photoacoustics. 2013;1(2):36-42
Author contact
![]() Corresponding author: Jürgen K. Willmann, M.D., Department of Radiology and Molecular Imaging Program at Stanford, School of Medicine, Stanford University, 300 Pasteur Drive, Room H1307, Stanford, CA 94305-5621 P: 650-723-5424 Fax: 650-723-1909 Email: willmannedu
Corresponding author: Jürgen K. Willmann, M.D., Department of Radiology and Molecular Imaging Program at Stanford, School of Medicine, Stanford University, 300 Pasteur Drive, Room H1307, Stanford, CA 94305-5621 P: 650-723-5424 Fax: 650-723-1909 Email: willmannedu