Impact Factor
- Issue 14; 2026
- Issue 13; 2026
- Issue 12; 2026
- Issue 11; 2026
- Issue 10; 2026
- Volume 16; 2026
- Advance Articles
- Past Issues
- Cover Images
- Cover Suggestion
- Index & Coverage
- Special Issues
Introduction
Materials and Methods
Results
Discussion
Abbreviations
Supplementary Material
Acknowledgements
References
International Journal of Biological Sciences
International Journal of Medical Sciences
 Global reach, higher impact

Theranostics 2017; 7(6):1422-1436. doi:10.7150/thno.17666 This issue Cite
Research Paper
[18F]GE-180 PET Detects Reduced Microglia Activation After LM11A-31 Therapy in a Mouse Model of Alzheimer's Disease
Michelle L. James1,2* ![]() , Nadia P. Belichenko2*, Adam J. Shuhendler1, Aileen Hoehne1, Lauren E. Andrews1, Christina Condon2, Thuy-Vi V. Nguyen2, Vladimer Reiser3, Paul Jones4, William Trigg4, Jianghong Rao1, Sanjiv S. Gambhir1, Frank M. Longo2
, Nadia P. Belichenko2*, Adam J. Shuhendler1, Aileen Hoehne1, Lauren E. Andrews1, Christina Condon2, Thuy-Vi V. Nguyen2, Vladimer Reiser3, Paul Jones4, William Trigg4, Jianghong Rao1, Sanjiv S. Gambhir1, Frank M. Longo2 ![]()
1. Department of Radiology, Stanford University, Stanford, 94305, USA;
2. Department of Neurology and Neurological Sciences, Stanford University, Stanford, 94305, USA;
3. GE Healthcare, Life Sciences, Marlborough, MA 01752, USA;
4. GE Healthcare, Amersham HP7 9LL, United Kingdom.
*These authors contributed equally to this work
Received 2016-9-21; Accepted 2017-2-8; Published 2017-3-24
Abstract

Microglial activation is a key pathological feature of Alzheimer's disease (AD). PET imaging of translocator protein 18 kDa (TSPO) is a strategy to detect microglial activation in vivo. Here we assessed flutriciclamide ([18F]GE-180), a new second-generation TSPO-PET radiotracer, for its ability to monitor response to LM11A-31, a novel AD therapeutic in clinical trials. AD mice displaying pathology were treated orally with LM11A-31 for 3 months. Subsequent [18F]GE-180-PET imaging revealed significantly lower signal in cortex and hippocampus of LM11A-31-treated AD mice compared to those treated with vehicle, corresponding with decreased levels of TSPO immunostaining and microglial Iba1 immunostaining. In addition to detecting decreased microglial activation following LM11A-31 treatment, [18F]GE-180 identified activated microglia in AD mice with greater sensitivity than another second-generation TSPO radiotracer, [18F]PBR06. Together, these data demonstrate the promise of [18F]GE-180 as a potentially sensitive tool for tracking neuroinflammation in AD mice and for monitoring therapeutic modulation of microglial activation.
Keywords: Alzheimer's disease, [18F]GE-180, flutriciclamide, neuroinflammation, PET, TSPO, LM11A-31.
Introduction
Alzheimer's Disease (AD) is a rapidly growing global health issue [1]. In 2016, the total cost of caring for AD patients, in the United States alone, was estimated to be $236 billion. By 2050 this figure is projected to grow to approximately $1.1 trillion [2]. At present, there are no approved disease-modifying treatments to slow or halt the progression of this disease. Although we are beginning to understand more about the pharmacological requirements for treating AD, every new drug that has been developed over the past decade has failed to achieve predetermined endpoints in mild-to-moderate AD clinical trials [3-7]. One possible reason for these disappointing results is the relatively small role that appropriate biomarkers have played in both preclinical and clinical drug discovery and development.
While there have been sizeable efforts toward the development of amyloid- and tau-based biomarkers that are relevant to both mouse models and patients (e.g., cerebrospinal fluid, blood, imaging), translational endpoints that mirror the significant neuroinflammatory aspect of AD remain limited. Increasing evidence suggests that neuroinflammation is an important early event in the pathophysiology of AD [8, 9], playing both beneficial and detrimental roles, ranging from trophic support, amyloid clearance and tissue remodeling, to increased production of neurotoxic pro-inflammatory cytokines. Multiple studies have shown that neuroinflammation is present at the pre-plaque stage of pathology [10, 11] and that it could be a prelude to AD [12]. Additionally, it seems that early anti-inflammatory intervention can profoundly impact the incidence and progression of AD [11,13,14]. Due to the complex nature and nuanced role of neuroinflammation in different stages of AD, specific imaging techniques to visualize and track neuroinflammation non-invasively could potentially provide critical insights that will help improve understanding and also serve to monitor the effects of therapeutic interventions.
Positron emission tomography (PET) imaging of the translocator protein 18 kDa (TSPO) is a strategy used to detect neuroinflammation non-invasively in vivo [15]. TSPO, formerly known as the peripheral benzodiazepine receptor (PBR), was initially characterized as a high affinity binding site for diazepam, and is believed to be involved in transporting cholesterol from the outer to inner mitochondrial membrane (i.e., the rate limiting step of steroid biosynthesis) [16]. While TSPO is densely distributed in most peripheral organs and only moderately expressed in the healthy brain, it is upregulated under neuroinflammatory conditions. The predominant cell type expressing TSPO at regions of central nervous system pathology are activated microglia. TSPO-PET imaging can therefore serve as a useful index of microglial activation, and thus neuroinflammation. There are several TSPO radiotracers available [17], however each have their limitations. For example, TSPO radioligand [11C]PK11195 has been used extensively for the last few decades, and although it has provided unprecedented in vivo information concerning microglial activation in AD [18][19][20], its poor brain permeability, high plasma protein binding, and short half-life due to its carbon-11 radiolabel (t½ = 20 min) have limited its overall clinical utility [21]. Second generation TSPO-PET radiotracers have been developed with higher affinities and some with longer half-lives (i.e., radiolabeled with fluorine-18, t½ = 110 min) compared to [11C]PK11195. A few of these second generation radiotracers have demonstrated promise for detecting alterations in TSPO in AD patients (i.e., [18F]DPA-714 [22], [11C]DPA-713 [23], and [11C]PBR28 [24][25][26]). Moreover, clinical trials have been performed to assess the utility of [18F]DPA-714 and [18F]PBR06 for detecting neuroinflammation in AD patients, however the results are yet to be reported. One limitation of using second generation TSPO radiotracers for clinical studies is their apparent inter- and intra-subject variability due to a polymorphism in the gene encoding TSPO - giving rise to low-affinity, mixed-affinity, and high-affinity binders [27]. This phenomena, while not observed in rodents or non-human primates, necessitates genotyping patients prior to a TSPO-PET scan to help with quantitation of ligand binding [28].
Flutriciclamide ([18F]GE-180) is a new fluorine-18 labeled, second-generation, TSPO-specific radioligand [29] with high affinity (Ki = 0. 87 nM), excellent in vivo target-to-background binding, and encouraging first-in-man imaging data [30]. Recent studies directly comparing [18F]GE-180 with [11C]PK11195 in a rat model of stroke [31] and lipopolysaccharide (LPS)-induced acute neuroinflammation demonstrated that [18F]GE-180 has a 1.5-fold higher signal-to-background ratio compared to [11C]PK11195 and a significantly higher binding potential (BPin vivo= 0.92 ± 0.07 versus 0.47 ± 0.06) for detecting microglial activation [32]. Since [18F]GE-180 has a higher TSPO affinity compared to [11C]PK11195 (Ki = 9 nM), [11C]DPA-713 (Ki = 4.7 nM), [18F]DPA-714 (Ki = 7 nM), and [11C]PBR28 (5-6 fold higher than PK11195 - i.e., Ki ~ 1.5 nM) [33], it has the potential to afford images with higher binding signal. Additionally, [18F]GE-180 belongs to a structurally distinct class of tricyclic compounds (Fig. S1) compared to the aforementioned TSPO tracers (which are either isoquinoline carboxamides, phenoxyphenyl acetamides, or pyrazolopyrimidines), and could therefore offer unique insights in the field of TSPO imaging. Although [18F]GE-180 has been compared to [11C]PK11195 and second generation TSPO radiotracers in rodent models of inflammation [31, 32, 34], there have been no direct head-to-head comparisons between [18F]GE-180 and other TSPO-PET radiotracers in AD mouse models or patients. Such studies will help determine which second generation TSPO-PET tracer is the most sensitive for detecting subtle alterations in neuroinflammation in the context of AD. Moreover, there are no reports investigating TSPO-PET radiotracers of any form for their ability to monitor AD therapeutics in vivo.
The first aim of this study was to evaluate [18F]GE-180 alongside another fluorine-18 labeled second generation TSPO radiotracer, [18F]PBR06, in the same mouse model of AD in order to compare their sensitivity for visualizing microglial activation in this disease model. The second aim was to assess the utility of in vivo TSPO-PET imaging for monitoring response to (2S,3S)-2-amino-3-methyl-N-[2-(4-morpholinyl)ethyl]-pent-anamide dihydrochloride (LM11A-31), a novel therapeutic under Phase II clinical evaluation for AD treatment. LM11A-31 is an orally bioavailable, small molecule, p75 neurotrophin receptor ligand that has been shown to reduce the hyperphosphorylation and misfolding of tau, decrease neurite degeneration, and attenuate microglial activation [35] in a well-characterized mouse model of AD [36]. Results from this study are critical for determining the sensitivity and potential utility of [18F]GE-180-PET as a translatable imaging biomarker for detecting neuroinflammation-related AD pathology and therapeutic response.
Materials and Methods
Study Design
We selected the Thy1-hAPPLond/Swe (APPL/S) mouse model of AD for the current studies since it is a well-characterized model of AD pathology [37] that we have previously used to evaluate novel therapeutics, including LM11A-31, at different stages of disease, albeit without in vivo imaging endpoints [36,38]. In this mouse model, mature amyloid plaques occur in the frontal cortex as early as 3-4 months of age, and in the hippocampus at 5-7 months [37]. Our earlier work (involving imaging APPL/S mice without a therapeutic component) demonstrated that [18F]PBR06 can detect elevated microglial activation in APPL/S mice as young as 9-10 months using ex vivo autoradiography [39]. Due to this, we began our head-to-head PET imaging comparison studies in APPL/S mice of a similar age. Likewise, we designed the therapy monitoring studies based upon our previous experiments with LM11A-31 in APPL/S mice of similar ages (i.e., we aimed to commence therapy after pathology was present), while also considering which age we might be able to detect differences in TSPO-PET signal between APPL/S and wild-type mice. A minimum of 5-6 experimental replicates were recorded for all [18F]GE-180 dynamic PET data, including blocking studies with PK11195. Six to seven animals per group were used for the head-to-head comparison studies and seven to eleven animals were used for therapy-monitoring studies involving PET imaging and ex vivo autoradiography, calculated with 90% power and a 5% significance level. For therapy monitoring studies, APPL/S and wild-type littermates were randomized into vehicle or LM11A-31 treatment groups according to their baseline [18F]GE-180 PET signal (uptake in cortex and hippocampus) such that there were no significant differences in those parameters between different treatment groups. All experiments and analyses were performed blind to genotype and test compound.
General
If not otherwise stated, chemicals were purchased from commercial sources and used without further purification. Radiochemical yields and doses for animal studies were measured using CRC-15 PET dose calibrator (Capintec). PET imaging of mice was performed using a microPET/CT hybrid scanner (Inveon, Siemens) and MR imaging was performed using a 7 Tesla (7T) Varian Magnex Scientific MR scanner. The PET system can deliver ~1.5-2.0 mm spatial resolution, and a maximum field of view of 10cm x 30cm. OSEM3D/MAP reconstruction yields uniform spatial resolution in all directions, with an average FWHM of 1.656 ± 0.06mm. All PET images were reconstructed using 2 iterations of 3-dimensional ordered subsets expectation maximization algorithm (12 subsets) and 18 iterations of the accelerated version of 3D-MAP (i.e., FASTMAP) - matrix size of 128 × 128 × 159. Attenuation correction derived from the CT image was applied to the PET dataset.
Animals
All experiments involving animals were in accordance with protocols approved by the Institutional Animal Care and Use Committee of Stanford University and were performed based on the NIH Guide for the Care and Use of Laboratory Animals. As stated in the Study Design section, we used the Thy1-hAPPLond/Swe (APPL/S) mouse model of AD, transgenic line 41 mice over-expressing human APP751 containing the London (V717I) and Swedish (K670M/N671L) mutations under the control of the Thy1 promoter, which is expressed postnatally [37]. Mice were maintained on a C57BL/6J background and housed individually under a 12-hour light/dark schedule with ad libitum access to food and water. The presence or absence of the mutant APP transgene is referred to as APPL/S and wild-type (wild-type), respectively. All APPL/S and wild-type mice used for these studies were age-matched. The mean weights of mice (at age 8.5-10.0 months) in each treatment group ± standard deviation were as follows: wt-vehicle = 32.47 ± 4.01g; APPL/S-vehicle = 30.14 ± 4.63g; wt-LM11A-31 = 33.61 ± 3.53g; APPL/S-LM11A-31 = 30.51 ± 3.26g. There were no significant differences in weight between these four groups as determined by one-way ANOVA. Upon study completion, mice aged 8.5-10.0 months old were deeply anesthetized with 2.0-3.0% isoflurane gas and transcardially perfused with 50 mL saline (i.e., 0.9% sodium chloride solution). A subset of brains were processed for autoradiography and immunohistochemistry - i.e., half of each brain was taken for ex vivo autoradiography and the other half was used for histological studies, so that autoradiography and immunostaining could be performed using brain tissue from the exact same mice. For immunohistochemistry, half-brains were post-fixed with 4% paraformaldehyde in 0.1 M PBS, PH 7.4 for 24 hours at 4 °C, then cryoprotected in 30% sucrose in 0.1 M PBS for 48 hours.
Treatment with P75 Ligand, LM11A-31
LM11A-31 [2-amino-3-methyl-pentanoic acid (2-morpholin-4-yl-ethyl)-amide] is an isoleucine derivative (MW 243.3); for pharmacological characterization and structure see [35,40]. LM11A-31 was synthesized by Ricerca Biosciences (Painesville, OH) at >97% purity as assessed by liquid chromatography/mass spectroscopy. Bioactivity was assessed by increased hippocampal neuron survival cell culture as previously described [40]. APPL/S and wild-type littermates were randomized into vehicle or LM11A-31 treatment groups according to their baseline [18F]GE-180 PET signal, as described in the Study Design section of this manuscript. LM11A-31 was administered at 50 mg/kg/day once daily, 6 days a week (for 3 months), in sterile water by oral gavage following a 4-hour fasting period. Vehicle-treated mice received equivalent volume per weight of sterile water following same schedule. Male mice were treated via oral gavage beginning at 5.5-7.0 months of age for a total of 3 months.
Radiosynthesis
[18F]GE-180 was synthesized via nucleophilic aliphatic substitution as previously described [29]. Minor modifications include the use of a TRACERlab FXF-N automated module for synthesis and the addition of ascorbic acid (0.1 mg/mL) to aqueous HPLC solvent to prevent radiolysis. The overall synthesis time was 72 min and radiochemical purity was 99.8 ± 0.2%, while the non-decay-corrected radiochemical yield and specific radioactivity was 13.8 ± 1.4% and 125 ± 22 GBq/μmol at EOB (n = 12), respectively. [18F]PBR06 was synthesized as previously described [41], with a non-decay-corrected radiochemical yield, radiochemical purity, and specific radioactivity of 2.34 ± 0.42%, 97.8 ± 0.7% and 147.81 ± 12.43 GBq/μmol at EOB (n = 3), respectively.
In Vivo Imaging Studies
Brain MR images were acquired to provide an anatomical reference frame to enable accurate identification of regions of interest (ROIs) - cortex and hippocampus - and for visualization of PET images in the context of brain structures. Mice were scanned with a dedicated small animal 7T Magnex Scientific MR scanner with custom-designed pulse sequences and radiofrequency (RF) coils using standard methods. For each MR scan, mice were anesthetized using isoflurane gas (2.0-3.0% for induction and 1.5-2.5% for maintenance). Coronal brain images were acquired using T2-weighted fast spin echo sequences (TE/TR 58.5 ms / 4,000 ms), 9 NEX, a 256 × 256 matrix, 3 cm field-of-view, slice thickness of 500 µm, and a total imaging time of 19 min.
For PET imaging, mice were anesthetized using isoflurane gas (2.0-3.0% for induction and 1.5-2.5% for maintenance). A CT image was acquired just before each PET scan to provide an anatomic reference frame for the respective PET data. Acquisition of dynamic PET data was commenced just prior to intravenous administration of [18F]GE-180 (5.5-7.5 MBq) and acquired in list mode format over 60 min. The resulting data was sorted into 0.5-mm sinogram bins and 19 time frames for image reconstruction (4 × 15 s, 4 × 60 s, 11 × 300 s). Blocking studies involved pre-treating 8.5-10 month old APPL/S mice with PK11195 (1 mg/kg, Sigma Aldrich) 10 min prior to radioligand administration. Static PET scans (10 min) were acquired 50 min after intravenous administration of [18F]GE-180 (5.5-7.5 MBq). For [18F]PBR06 PET imaging studies, we used our previously reported optimized timing and acquisition/analysis protocols (i.e., 10 min static scans were acquired 40 min after tracer administration) [39]. PET and CT image files were co-registered and analyzed with VivoQuant image analysis software (version 2.0, inviCRO). For VivoQuant analyses, a 3-dimensional mouse brain atlas was fitted inside the skull of each mouse (as per their CT image) and radioactivity concentrations were obtained using automated ROIs for cerebellum, cortex, corpus callosum, hippocampus, hypothalamus, midbrain, medulla, olfactory, pallidum, pons, striatum, thalamus, ventricles, and white matter (Fig. S2). Cortex, hippocampus, and thalamus, were further segmented into slices so that we could obtain ROIs for specific parts of these structures - i.e., caudal-thalamus (cThal) versus rostral-thalamus (rThal), and predefined regions of cortex (sections 8-11, i.e., between bregma +1.70 and +0.38) and hippocampus (sections 6-9. i.e., between bregma -1.58 and -1.82 respectively) corresponding with our pre-defined immunohistochemistry quantitation. % ID/g values were calculated for each ROI using the decay-corrected dose for each mouse at time of PET scan. Signal-to-background ratios were determined by dividing the uptake in cortex or hippocampus by uptake in the rThal. The rThal served as a reference region due to negligible TSPO staining and relative low PET signal in this region, which did not vary significantly between wild-type and APPL/S mice.
Ex Vivo Autoradiography
Following final PET/CT scans, n = 7 mice per treatment group were perfused with 0.9% sodium chloride solution (50 mL), brain tissue was embedded in optimal-cutting temperature compound (OCT, Tissue-Tek), and coronal sections (20 μm) were obtained for ex vivo autoradiography. Autoradiography was conducted using previously described methods [42] and anatomy of brain sections was confirmed by Nissl staining (cresyl violet acetate; Sigma Aldrich) using standard techniques. For quantitation of autoradiography images, five sections per mouse were analyzed. For each section, one region was drawn within the somatosensory cortex, thalamus, and hippocampus (between bregma +1.70 and -1.82 - corresponding to brain regions used for PET image analysis), resulting in a mean signal intensity value for each brain region within each section (normalized to area of region). For each mouse, the mean signal intensities (i.e., mean radiotracer uptake) of cortex and hippocampus were normalized to the mean signal intensity of rThal (region containing negligible TSPO). See Fig. S3 for evidence of negligible TSPO staining in rostral thalamus of 8.5-10 month old wild-type and APPL/S mice.
Plasma Free Fraction (fP)
Determination of the plasma free fraction (fP) for [18F]GE-180 in 8.5-10 month old mice (n = 4 APPL/S-veh, n = 6 wild-type-veh, n = 4 APPL/S-LM11A-31, n = 5 wild-type-LM11A-31) was performed at room temperature with ultrafiltration units, according to previously described methods [43].
Immunostaining and Quantitation
Free-floating 50 μm coronal sections were collected through the entire brain using Microm HM 450 sliding microtome (Thermo Scientific). For immunostaining following standard protocols, the following antibodies were used: rabbit anti-Iba1 (Wako; 1:2000) and rabbit anti-TSPO (Epitomics; 1:500). For visualization, sections were immersed in Vectastain Elite ABC kit (Vector Laboratories) followed by 0.05% 3,3-diaminobenzidine (Sigma) in TBS with 0.03% H2O2. All staining was performed in one single large batch and included all animals in this study (i.e., all four treatment groups were processed at the same time; wt-veh, wt-C31, APP-veh, and APP-C31).
For image acquisition of TSPO and Iba1-labelled microglia, digitized images were captured with Zeiss AxioImager M2 light microscope using Microlucida software v 11.03.1 and the exact same settings for all samples. For assessment of the cortex comprising the primary and secondary somatosensory areas of one hemisphere between bregma 1.70-0.38 mm according to the Franklin and Paxinos 3rd edition mouse brain atlas, four coronal sections per mouse were analyzed (n = 8-10 mice per genotype-treatment group). In each section, two adjacent non-overlapping 10x fields (sample field 550um x 425um) were analyzed for a total of 8 fields per mouse. The same sample fields were analyzed for both Iba1 and TSPO stains. The average pixel intensity of TSPO staining was determined by UN-SCAN-IT software v6.1 (Silk Scientific Corporation). To reduce any variability during intensity quantification, background subtraction was used in UN-SCAN-IT and included subtracting the background region value for each image quantified to ensure the results were due to intensity differences rather than differences in background staining. To quantify percent area occupied by Iba1-labelled microglia from digitized images, histogram thresholding in ImageJ v 1.47 software was used. The thresholding was set manually to distinguish between dense immunostaining distinct from the background. For each mouse, a total of eight field values were averaged to yield one value measurement per mouse. For analysis of hippocampal Iba1 or TSPO burden, one 10x field covering the majority of the hippocampus in one hemisphere (sample field 550um x 425um) between bregma -1.58 and -1.82 mm was analyzed per section, for a total of four sections per mouse (n = 8-10 mice per genotype-treatment group). The same quantification methods were used for both cortex and hippocampal measurements of average pixel intensity for TSPO staining and percent area occupied by Iba1-labelled microglia. For each mouse, a total of four hippocampal field values were averaged to yield one value measurement per mouse. All staining, acquisition and analysis was performed by experimenter blind to animal genotype and treatment.
Statistical Analysis
The Wilcoxon-Mann-Whitney test was used to determine whether there were significant differences in cortical/hippocampal uptake between wild-type-veh and APPL/S-veh mice and APPL/S-veh and APPL/S-LM11A-31 mice for both PET and autoradiography data. The Student's t-test was used to determine whether there were significant differences between blocked versus unblocked dynamic PET imaging data, and fP data for each group of mice. We used Spearman's rank correlation to assess the relationship between TSPO/Iba1 staining and [18F]GE-180-PET signal in cortex and hippocampus. Statistical analyses of data were performed using PRISM version 6.0d and significance was set at p<0.05. All data are presented as mean ± SEM. The outlier criterion was established as 2 standard deviations (STDEV) from the average. No outliers were observed in these studies.
Results
[18F]GE-180 enables detection of microglial activation in APP/LS mice with greater sensitivity than [18F]PBR06
Prior to comparing [18F]GE-180 with [18F]PBR06 (Fig. 1), we assessed the uptake and kinetics of [18F]GE-180 via dynamic PET/CT imaging of 8.5-10 month old APPL/S mice (n = 6) and age-matched littermates (n = 6). APPL/S mice of this age are known to exhibit amyloid plaques and neuroinflammation in both cortex and hippocampus [37]. Time activity curves generated from these dynamic imaging studies (Fig. 2A) showed markedly higher [18F]GE-180 accumulation in cortex and hippocampus of APPL/S mice compared to age-matched wild-types (25 ± 1.74% higher uptake at 50-60 min post-injection, p=0.0042), and significant attenuation of PET signal in APPL/S mice (n = 4) pre-treated with 1 mg/kg of the blocking agent PK11195 (69% reduction at 50-60 min post-injection, p=0.001). These results demonstrate that [18F]GE-180 has suitable specificity and sensitivity (signal-to-background) for detecting alterations in TSPO, and therefore microglial activation, in APPL/S mice of this age.
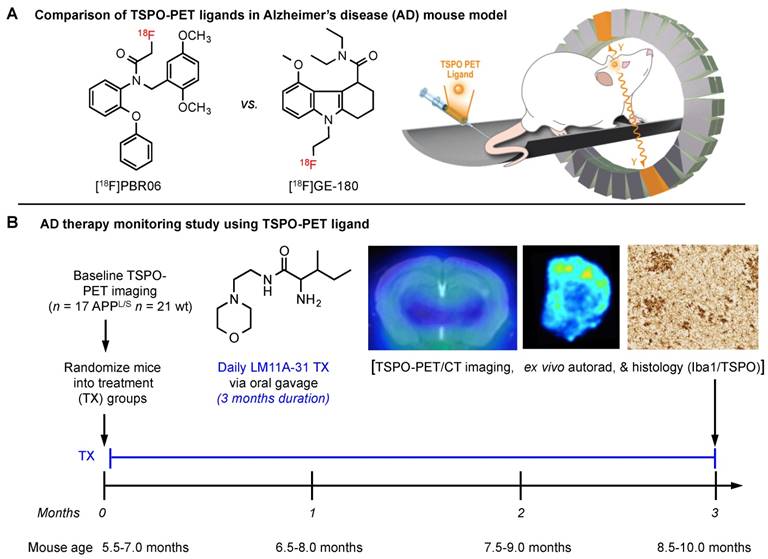
Schematic representation of experimental approach. (A) Head-to-head comparison of two second generation PET radiotracers targeting the translocator protein 18 kDa (TSPO) - i.e., [18F]PBR06 and [18F]GE-180 - in a mouse model of Alzheimer's disease (AD). The same 8.5-10 month old APPL/S mice and wild-type (wild-type) littermates were imaged with [18F]PBR06 and [18F]GE-180, 2 days apart. (B) Timeline and study design for evaluating TSPO-PET as an imaging biomarker strategy to monitor response to a novel AD therapeutic (i.e., LM11A-31) currently in clinical trials. Based on findings from the head-to-head comparison study, the most sensitive TSPO-PET ligand was selected for therapy monitoring studies. Baseline PET imaging of APPL/S mice with pathology and wild-type littermates (5.5-7 months of age) was performed just prior to commencing treatment with LM11A-31, and again at the conclusion of the study after mice had been treated daily with LM11A-31 for 3 months. Ex vivo autoradiography and histology were conducted immediately following the final PET imaging time-point. TSPO and Iba1 immunostaining were performed to investigate the relationship between TSPO-PET signal and levels of target (i.e., TSPO and activated microglia).
[18F]GE-180 is more sensitive than [18F]PBR06 for detecting elevated levels of microglial activation in APPL/S mice. (A) Time activity curves show the accumulation of [18F]GE-180 in cortex and hippocampus of 8.5-10 month old APPL/S (n = 6) and wild-type mice (n = 6), and in APPL/S mice pre-treated with PK11195 (1 mg/kg) (n = 4). (B) Graphs from head-to-head comparison studies depict uptake (% injected dose per gram, % ID/g) of either [18F]PBR06 or [18F]GE-180 in the same 8.5-10 month old APPL/S (n = 7) versus wild-type mice (n = 6). *p-value <0.05.
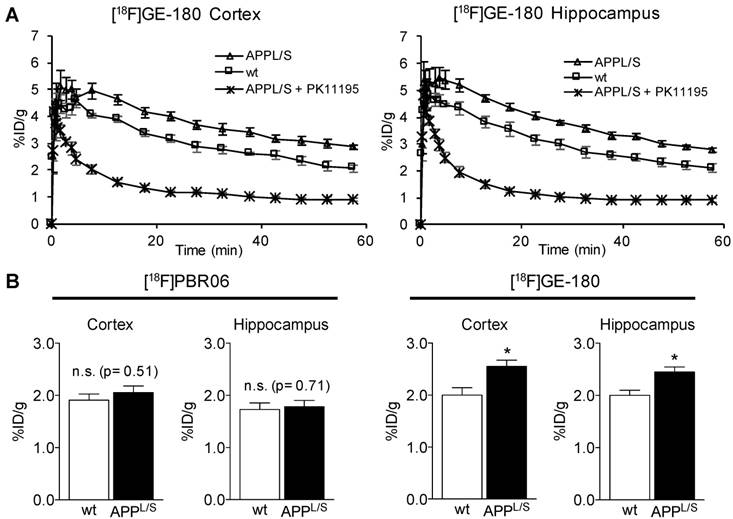
Next, we compared the sensitivity of [18F]GE-180 with that of another second generation TSPO radiotracer [18F]PBR06. A cohort of n = 7 APPL/S mice and n = 6 wild-type mice (8.5-10 months old) were imaged with each radiotracer 2 days apart. We observed increased [18F]GE-180-PET signal in cortex and hippocampus of APPL/S mice compared to age-matched wild-types, indicating that [18F]GE-180 was able to detect elevated microglial activation in 8.5-10 month old APPL/S mice (cortex: 2.56 ± 0.12 vs 2.00 ± 0.14 % injected dose per gram [ID/g], 21.9% difference, p=0.024, and hippocampus: 2.45 ± 0.10 vs 2.00 ± 0.10 % ID/g, 18.4% difference, p=0.012) (Fig. 2B). However, there was no significant difference in cortical or hippocampal accumulation of [18F]PBR06 between APPL/S and wild-type mice at this age (cortex: 2.06 ± 0.13 vs 1.91 ± 0.12 % ID/g, 7% difference, p=0.51, and hippocampus: 1.78 ± 0.12 vs 1.73 ± 0.13 % ID/g, 3% difference, p=0.71). These results demonstrate the high sensitivity of [18F]GE-180 compared to [18F]PBR06 for detecting TSPO alterations in these mice. PET images from this head-to-head study are shown in the supplemental (Fig. S4).
The rostral thalamus is a suitable pseudo-reference region for TSPO-PET imaging of AD mice
To accurately measure subtle alterations in TSPO density in the brain with PET imaging, absolute quantitation using an input function or selection of a suitable reference region is usually required. The former involves arterial blood sampling or an image-derived input function using the left ventricle [44,45], whereas the latter requires identification of a region in the brain containing negligible levels of TSPO. Another consideration for the reference region approach is that radiotracer uptake and actual levels of TSPO in the reference structure should not differ between comparison groups. Since arterial blood sampling in mice is immensely challenging and TSPO is highly expressed in normal rodent and human myocardium, a reference region approach is preferred. To identify a suitable reference region in the brain of APPL/S and age-matched wild-type mice, we conducted an unbiased investigation of [18F]GE-180 uptake in 15 different brain regions in both wild-type and APPL/S mice using an automated 3D brain atlas tool within VivoQuant image analysis software (Fig. 3A-B). After comparing [18F]GE-180 uptake in all brain regions automatically defined by the 3D atlas, we found the thalamus to have the lowest relative uptake and no significant difference between wild-type and APPL/S mouse groups (p=0.33), thus highlighting its suitability as a candidate reference region for studies with these mice. Subsequent immunohistochemical analysis revealed very low levels of TSPO staining throughout the entire thalamus of wild-type mice, some TSPO staining in the caudal thalamus (cThal) of APPL/S mice, and very low levels of staining in the rostral thalamus (rThal) of APPL/S mice (Fig. 3C). Plots of [18F]GE-180 uptake (% ID/g) in the rThal and cThal of wild-type and APPL/S mice (Fig. 3D) revealed no significant genotype difference in rThal uptake (p=0.53) and a trend toward higher [18F]GE-180 uptake in the cThal of APPL/S mice (p=0.09). We also assessed the kinetics of [18F]GE-180 in the rostral thalamus over the course of a 60-minute dynamic scan and confirmed that there were no significant differences between uptake in APPL/S mice and wild-types between 10-60 min (Fig. S5). Taken together, these data demonstrate that the rThal can serve as a suitable pseudo-reference region for [18F]GE-180-PET imaging of APPL/S and wild-type mice. Since the rThal is not completely devoid of TSPO, but instead contains very low levels of TSPO, it is considered a pseudo-reference region.
Identification of the rostral thalamus as a suitable pseudo-reference region for [18F]GE-180 in APPL/S and wild-type mice. (A) [18F]GE-180 uptake in cerebellum, hypothalamus, medulla, midbrain, olfactory, pons, striatum, and thalamus of wild-type (n = 6) and APPL/S mice (n = 7) aged 8.5-10 months. Uptake values are shown as percent injected dose per gram (% ID/g). (B) Brain regions of interest (ROIs) defined using a segmented 3D mouse brain atlas and VivoQuant image analysis software after co-registering brain atlas to PET/CT data. ROI for the rostral thalamus (rThal) is shown in dark blue in four consecutive coronal brain slices used for analysis. Cortex (grey), corpus callosum (apricot), ventricles (light blue), white matter (red), striatum (pink), pallidum (yellow), and hypothalamus (green), are also shown. (C) Representative 20x pictures of TSPO immunostaining in rThal and caudal thalamus (cThal), (D) [18F]GE-180 uptake (% ID/g) in rThal and cThal, and (E) PET uptake ratio values determined by dividing % ID/g in cortex or hippocampus by % ID/g in rThal. Standard error of mean (SEM) is shown. *p<0.05, **p<0.01.
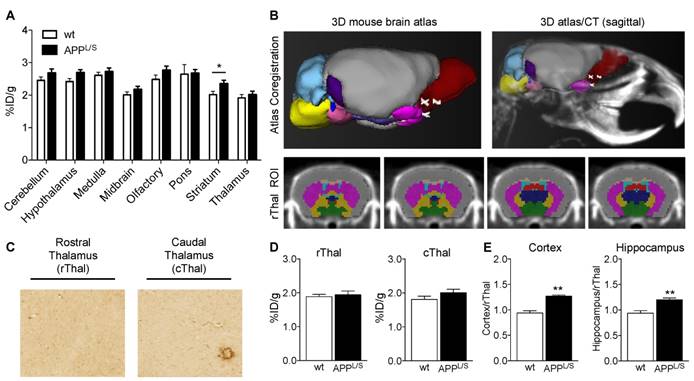
Next, we employed the use of the rThal as a pseudo-reference region - i.e., we divided cortical and hippocampal % ID/g values by rThal % ID/g values for each mouse (Fig. 3E). The effect sizes between wild-type and APPL/S mice for the uptake ratios were slightly higher than that observed for % ID/g values (i.e., cortex/rThal: 26% vs. 25%; hippocampus/rThal: 22% vs. 21%), while the standard deviations and coefficient of variance for APPL/S mice were lower (Table. S1). These results suggest that using the rThal as a reference region, provides greater sensitivity and lower variability than % ID/g values, and thus further validate its use for subsequent [18F]GE-180-PET studies of APPL/S mice. For comparison, we plotted the uptake of [18F]PBR06 in the same brain regions shown for [18F]GE-180 (Fig. S6) and found that the thalamus also had the lowest relative uptake and no significant difference between wild-type and APPL/S mouse groups (p=0.33), thus highlighting its suitability as a pseudo-reference region for [18F]PBR06 in these mice. When rThal is employed as a reference region for [18F]PBR06, there is a small yet significant genotype difference in cortical and hippocampal uptake - i.e., cortex/rThal: 1.32 ± 0.03 vs 1.16 ± 0.03 % ID/g, 12.7% difference, p=0.0047, and hippocampus/rThal: 1.14 ± 0.02 vs 1.04 ± 0.02 % ID/g, 8.8% difference, p=0.0047). Although this demonstrates that [18F]PBR06 can detect elevated microglial activation in these mice after applying a suitable reference region, [18F]GE-180 can detect this same biological event with greater than 2-fold higher sensitivity compared to [18F]PBR06 (cortex: 12.7% genotype difference versus 26.0%, hippocampus: 8.8% genotype difference versus 19.5%).
[18F]GE-180-PET and ex vivo autoradiography detect reduced microglial activation in AD mice treated with LM11A-31
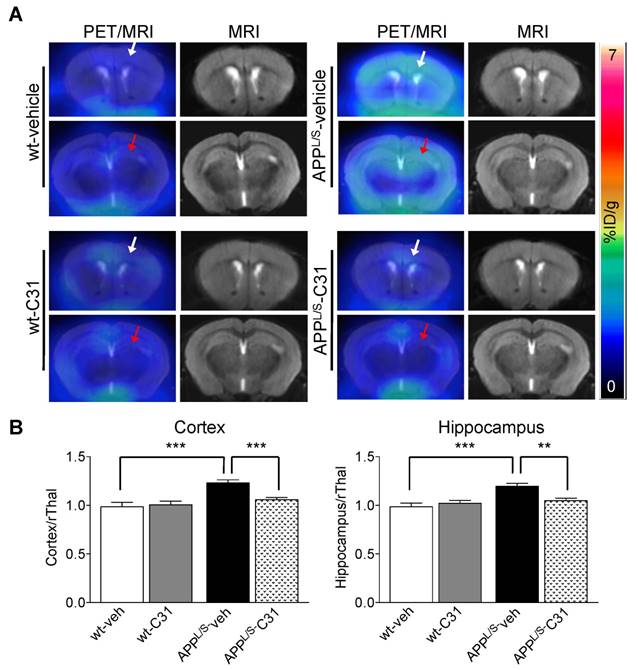
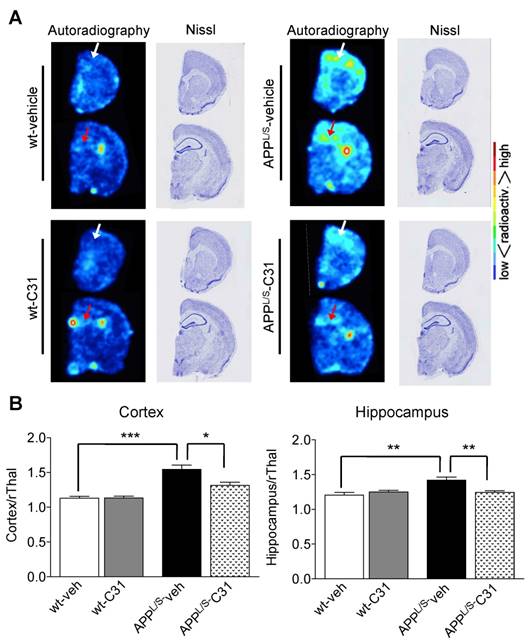
Before commencing once daily oral gavage treatment of APPL/S and wild-type mice aged 5.5-7.0 months, with either LM11A-31 (50 mg/kg) or vehicle (veh), baseline [18F]GE-180-PET scans were acquired for each mouse. Baseline imaging revealed significantly higher uptake in cortex and hippocampus of 5.5-7.0 month old APPL/S compared to wild-type mice (p=0.029), corresponding with pathology known to be present in these brain regions of APPL/S mice this age [36,37] (Fig. S7). Baseline % ID/g values were then used to randomize mice into four treatment groups - i.e., APPL/S-LM11A-31 (n = 8), APPL/S-veh (n = 9), wild-type-LM11A-31 (n = 11), and wild-type-veh (n = 10) - such that there were no significant differences in cortical or hippocampal [18F]GE-180 uptake between treatment groups. After 3 months of daily oral treatment, all mice were imaged again and the resulting [18F]GE-180-PET data revealed significantly elevated radiotracer uptake in both cortex and hippocampus of vehicle-treated APPL/S compared to wild-type-veh mice, now aged 8.5-10 months, indicative of the progression of AD in the disease model (cortex/rThal: 1.23 ± 0.03 vs 0.99 ± 0.05; hippocampus/rThal: 1.19 ± 0.03 vs 0.98 ± 0.04, p=0.001) (Fig. 4). Additionally there was a significant treatment effect in APPL/S mice treated with LM11A-31 as evidenced by decreased accumulation of [18F]GE-180 in cortex and hippocampus of these mice compared to vehicle-treated APPL/S mice (cortex/rThal: 1.06 ± 0.02 vs 1.23 ± 0.03, p=0.0022; hippocampus/rThal: 1.05 ± 0.02 vs 1.19 ± 0.03, p=0.0059). Graphs showing % ID/g values are shown in Fig. S8.
[18F]GE-180-PET detects a significant drug effect in AD mice treated with LM11A-31 (C31). (A) Representative coronal brain PET/MR images of APPL/S and wild-type mice that have been treated with either C31 or vehicle (veh). Images visually depict increased PET signal in cortex and hippocampus of APPL/S-veh mice (n = 9) compared to age-matched wild-type littermates (n = 10) and APPL/S mice treated with C31 (n = 8). White and red arrows point to cortex and hippocampus respectively. (B) Quantitation of [18F]GE-180 uptake in cortex and hippocampus using the rostral thalamus (rThal) as a reference region. Error bars are standard error of mean (SEM). **p-value <0.01, ***p-value <0.005.
Next we examined whether the plasma free fraction (fP), and therefore the percentage of [18F]GE-180 available for binding, varied between 8.5-10 month old wild-type and APPL/S mice treated with either vehicle or LM11A-31. No significant differences in fP were found between treatment groups (i.e., APPL/S-veh: 15.2 ± 0.01%, wild-type-veh: 16.5 ± 0.02%, APPL/S-LM11A-31: 16.3 ± 0.02%, wild-type-LM11A-31: 17.0 ± 0.02%, n = 4-6 per group), indicating that neither genotype nor LM11A-31 treatment affected [18F]GE-180 plasma protein binding in APPL/S and wild-type mice of this age (Fig. S9).
To further investigate the accumulation of [18F]GE-180 in specific brain regions we performed ex vivo autoradiography using 20 μm-thick coronal brain sections from these same mice after their final PET scans (n = 7 per group). The high spatial resolution of autoradiography combined with the anatomical information provided by Nissl staining of the same sections enabled clear visualization of [18F]GE-180 accumulation in cortex and hippocampus of APPL/S mice (Fig. 5). In support of the in vivo PET results, quantitative ex vivo brain autoradiography showed elevated [18F]GE-180 accumulation in APPL/S-veh mice in regions known to contain activated microglia (cortex/rThal: 1.54 ± 0.06 vs 1.13 ± 0.03, p=0.0012; hippocampus/rThal: 1.42 ± 0.04 vs 1.21 ± 0.04, p=0.005), and a significant reduction of radiotracer uptake in APPL/S mice treated with LM11A-31 (cortex/rThal: 1.31 ± 0.05 vs 1.54 ± 0.06, p=0.015; hippocampus/rThal: 1.25 ± 0.02 vs 1.42 ± 0.04, p=0.0087). We also observed uptake in a region corresponding to the choroid plexus for both wild-type and APPL/S mice, qualitatively similar to our previously reported TSPO autoradiography studies with these mice [39]. The choroid plexus is known to contain moderate levels of TSPO in healthy human and rodent brains [46], with these levels elevated in certain diseases [47], and thus could be an important brain region to consider when monitoring the progression of AD and also for quantifying therapeutic response in AD patients.
[18F]GE-180 ex vivo autoradiography of 8.5-10 month old APPL/S and wild-type mice following 3 months treatment with LM11A-31 (C31) or vehicle. (A) Representative autoradiography images and Nissl staining of the same brain sections show a similar pattern of uptake to that observed in [18F]GE-180-PET/MR images. White and red arrows point to cortex and hippocampus respectively. (B) Mean signal intensity for specific brain regions normalized to rostral thalamus (rThal) for all four groups of mice (n = 7 per group). *p-value <0.05, **p-value <0.01, ***p-value <0.005.
[18F]GE-180 signal correlates with reduced levels of TSPO and microglia in mice treated with LM11A-31
In order to assess whether [18F]GE-180 signal correlated with levels of activated microglia and TSPO, we performed immunohistochemistry (Fig. 6) using harvested brain tissue from the same 8.5-10 month old mice used for PET imaging and autoradiography. Quantitation of percent cortical/hippocampal area occupied by Iba1 staining (microglial marker) showed increased levels of activated microglia in APPL/S-veh compared to wild-type-veh mice (p=0.021, n = 7-8 per group), and significantly less activated microglia in APPL/S-LM11A-31 mice compared to APPL/S-veh (p=0.0001, n = 8). Likewise, the intensity of TSPO staining in cortex/hippocampus was found to be significantly greater in APPL/S-veh compared to wild-type-veh (p=0.0001, n = 7-8 per group) and APPL/S-LM11A-31 mice (p=0.0001, n = 8 per group).
LM11A-31 (C31) attenuates microglial activation in cortex and hippocampus of APPL/S mice. Representative 10x images of TSPO and Iba1 staining in cortex and hippocampus from 8.5-10 month old APPL/S and wild-type mice, treated daily via oral gavage for 3 months with LM11A-31 (C31) or vehicle (veh). Scale bar = 250 μm. Quantitation of mean pixel intensity or percent cortical/hippocampal area occupied for TSPO and Iba1 staining respectively (n = 7-8 per group). *p-value <0.05, **p-value <0.01, ***p-value <0.005.
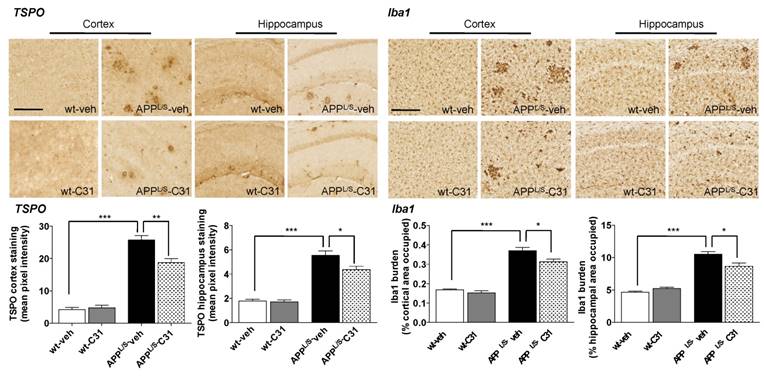
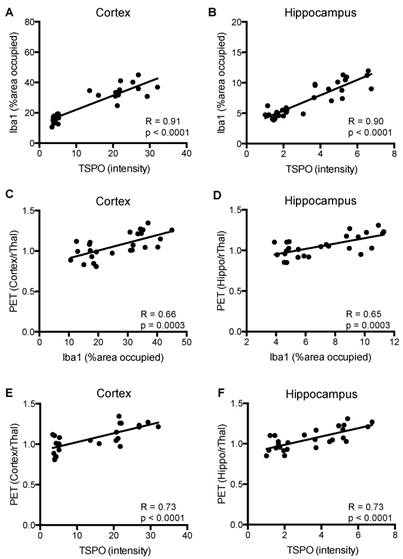
Figure 7 shows a strong correlation between TSPO and Iba1 staining in cortex and hippocampus (R=0.90-0.91, p=0.0001), and between [18F]GE-180-PET uptake ratios and TSPO staining (R=0.73, p=0.0001) of APPL/S-veh, APPL/S-LM11A-31, wild-type-veh, and wild-type-LM11A-31 mice (n = 7-8 per group). Additionally, there was a moderate correlation between PET uptake ratios and Iba-1 staining for both cortex and hippocampus (R=0.65-0.66, p=0.0003).
Correlation between the levels of microglial activation, TSPO, and [18F]GE-180 brain-PET signal in 8.5-10 month old APPL/S and wild-type mice after treatment. Correlation between Iba1 and TSPO immunostaining in (A) cortex, and (B) hippocampus (n = 7-8 per group). Correlation between Iba1 immunostaining and PET signal in (C) cortex, and (D) hippocampus (n = 6-7 per group). Correlation between TSPO immunostaining and PET signal in (E) cortex, and (F) hippocampus (n = 6-7 per group).
Discussion
AD is the most common neurodegenerative disorder, and its prevalence is expected to triple by 2050. At present, there is no approved therapeutic that can halt or reverse disease progression, and all efforts to develop and translate such treatments to the clinic have been unsuccessful thus far. Possible reasons for these disappointing results include the limited number of translatable biomarkers useful in both mouse models and humans, and the relatively small role that appropriate biomarkers have played in the drug development process.
Increasing evidence suggests that microglial activation takes place early in AD, before the formation of amyloid plaques, and serves as a third rail in the development of this disease [48]. Additionally, genome-wide association studies (GWAS) of late onset AD highlight a dominant role for microglial malfunction in increasing risk of AD. Moreover, a recent TSPO-PET study reported by Hamelin and colleagues demonstrated that neuroinflammation is present at the prodromal stage of AD and that it may even play a protective role in these early stages - due to the high TSPO-PET signal in slow decliners versus rapid decliners observed in this study [22]. Together, these data highlight the importance of developing and evaluating therapeutics that modulate microglial responses, and also support the need for a non-invasive technique for tracking microglial activation longitudinally in AD. In the current work, we set out to evaluate the TSPO PET agent [18F]GE-180 for its ability to detect microglial activation at different stages of disease progression and monitor response to LM11A-31 in a well-established AD mouse model.
Although both [18F]GE-180 and [18F]PBR06 have ~10-fold higher affinity (i.e., Ki < 1 nM)[33] for TSPO compared to PK11195 (Ki = 9nM), results from our studies demonstrate that [18F]GE-180 is significantly more sensitive than [18F]PBR06 at detecting changes in TSPO density and activated microglia in APPL/S mice. That is, [18F]GE-180 was able to detect increased microglial activation in APPL/S mice aged 8.5-10 months with greater than 2-fold higher sensitivity compared to [18F]PBR06 (cortex: 12.7% genotype difference for [18F]PBR06 versus 26.0% for [18F]GE-180, hippocampus: 8.8% genotype difference for [18F]PBR06 versus 19.5% for [18F]GE-180). One possible reason for this difference in sensitivity might be due to the high lipophilicity of [18F]PBR06 (LogD7.4 = 4.10)[49] compared to [18F]GE-180 (LogD7.4 = 2.95)[29], likely resulting in a higher degree of non-specific binding for [18F]PBR06 and therefore lower signal-to-background. Another explanation for this disparity may be due to differences in how and where these two radiotracers bind and interact with various conformational and/or oligomeric states of TSPO in different diseases [50]. Since our data indicated that [18F]GE-180 is more sensitive than [18F]PBR06, we elected to move forward with [18F]GE-180 for evaluation in therapy monitoring studies.
To minimize unwanted intra-/inter-subject and PET scanner variability, and maximize one's ability to robustly detect small group differences, the selection of an appropriate reference region for PET image analysis is critical. Previous studies have reported the use of the striatum or cerebellum as possible reference regions for TSPO-PET studies of AD patients and mice [25,51]. In our studies, however, we determined that the cerebellum had high uptake of [18F]GE-180 and that accumulation in the striatum varied significantly between wild-type and APPL/S mice - thus negating the use of these structures as reference regions. Our unbiased analysis of [18F]GE-180 uptake in 15 different mouse brain structures identified the rostral thalamus as a region that contained relatively low radiotracer uptake that did not vary between APPL/S and wild-type mice. Interestingly, Lemere and colleagues also found the thalamus to be a suitable reference region (via immunohistological analyses) for their TSPO-PET studies in a different AD mouse model (APP-PS1), however they used a small region of the caudal thalamus for PET uptake ratio calculations [52]. Our histological analyses revealed that the caudal thalamus contained slightly higher levels of TSPO in APPL/S mice compared to wild-types, whereas there was no difference in TSPO levels in the rostral thalamus (between the ages of 5.5-10 months - i.e., the stages of disease evaluated in this study). We systematically defined the rostral thalamus as a suitable pseudo-reference region according to both PET imaging data and immunohistochemistry analyses. The combination of these two approaches yielded a reference region and subsequent uptake ratio values that robustly removed unwanted intra-/inter-subject variance but not the effects of the disease and/or its progression. Further studies will be needed to validate the use of the rostral thalamus as a reference region at later stages of disease (i.e., after 10 months) in APPL/S mice.
Results from our therapy monitoring studies demonstrate the ability of [18F]GE-180 to not only detect a response to LM11A-31 (i.e., reduction in microglial activation) with high sensitivity and specificity, but to also identify alterations in microglial activation in living AD mice at different stages of disease. We observed significantly higher uptake of [18F]GE-180 in the cortex and hippocampus of APPL/S mice as early as 5.5-7.0 months of age compared to wild-type littermates, and an even greater level of radiotracer uptake in APPL/S mice 8.5-10.0 months of age. Although the differences detected were small (i.e., 12-13% for younger APPL/S mice and 21-26% for older APPL/S mice), they are in line with the magnitude of brain regional differences reported for TSPO-PET imaging of AD patients compared to healthy controls using other TSPO radiotracers [26]. Autoradiographic analysis of brain sections following perfusion (i.e., after removing unbound/intravascular radioactivity from the brain) further confirmed elevated binding of [18F]GE-180 in cortex and hippocampus of APPL/S mice compared to wild-types, and a significantly lower signal in the same brain regions of APPL/S mice treated with LM11A-31. Both PET and autoradiography data was corroborated by immunohistochemistry results showing that TSPO and Iba1 expression were elevated in the cortex and hippocampus of APPL/S-veh mice compared to wild-type-veh, wild-type-LM11A-31, and APPL/S-LM11A-31 mouse groups.
To date, there have been a very limited number of studies involving therapy monitoring with TSPO-PET ligands, and in fact our current study appears to be the first report of using in vivo TSPO-PET imaging for monitoring response to an AD therapeutic. Roberts and colleagues reported an ex vivo autoradiography study whereby the tritiated TSPO radioligand [3H]DPA-713 was assessed for its ability to detect response to a PPARγ agonist in TASTPM mice [53]. Although there was no in vivo PET imaging, and the therapeutic response in this study was not significant (histologically or otherwise), the authors emphasized the potential of TSPO radioligands for assessing anti-inflammatory therapeutics before translation to AD patients.
Our future studies will involve assessing the use of [18F]GE-180 for monitoring alterations in microglial activation after treatment with different therapeutics that directly or indirectly affect neuroinflammation in mouse models of AD - for example, minocycline [11], non-steroidal anti-inflammatories [13], and/or prostaglandin EP2 receptor antagonists [54, 55]. In addition, since [18F]GE-180 has already been approved for human use and has undergone favorable first-in-man studies, [18F]GE-180-PET could serve as a surrogate endpoint in upcoming clinical trials of LM11A-31 in AD patients. In these studies, we will assess how well the [18F]GE-180-PET signal correlates with cognitive status and other biomarkers. We plan to implement the optimized scanning protocol (90 min) and kinetic modeling strategy (reversible two-tissue compartment model) reported by Fan and colleagues in their paper detailing the first human PET study with [18F]GE-180 [56]. As part of these future studies, we will compare [18F]GE-180 with additional second generation TSPO-PET tracers reported to detect alterations in TSPO and therefore glial activation in AD patients at different stages of disease - i.e., [18F]DPA-714 [22], [11C]DPA-713 [23], [11C]PBR28 [24]. Comparison between [18F]GE-180 and other second generation TSPO PET tracers in AD subjects will be of particular interest since Feeney and coworkers recently demonstrated that [18F]GE-180 did not appear to have a dependency on the single nucleotide polymorphism (i.e., there were no differences in volume of distribution across the various brain regions between mixed-affinity binders and high affinity binders) in healthy controls [57] - presenting a possible advantage of [18F]GE-180 over other second generation tracers. Further studies using [18F]GE-180 in low affinity binders as well as patients with neuroinflammatory conditions of various ages are required to understand its clinical utility for providing a quantitative and specific measure of TSPO expression.
In summary, we have shown that [18F]GE-180 enables sensitive detection of microglial activation in APPL/S mice at different stages of disease, and that this radiotracer can be used as a non-invasive measure of reduced neuroinflammation after treatment with LM11A-31. This technique has potential for providing insight into the anatomical distribution and clinical time course of microglial activation in the development of AD, which could ultimately lead to the design and development of more effective therapeutics. Moreover, [18F]GE-180-PET shows promise as a translatable imaging biomarker for therapy monitoring. This work sets the stage for possibly implementing [18F]GE-180-PET in future planned AD clinical trials of therapeutics that affect neuroinflammation - to help select appropriate patient populations and serve as a clinical endpoint.
Abbreviations
AD: Alzheimer's disease; TSPO: translocator protein 18kDa; [18F]GE-180: flutriciclamide; LM11A-31 (C31): (2S,3S)-2-amino-3-methyl-N-[2-(4-morpholinyl)ethyl]-pent-anamide dihydrochloride; PET: positron emission tomography; PBR: peripheral benzodiazepine receptor; BP: binding potential; % ID/g: percent injected dose per gram; cThal: caudal thalamus; rThal: rostral thalamus; veh: vehicle; fP: plasma free fraction; MS: multiple sclerosis; APPL/S: Thy1-hAPPLond/Swe mutant APP transgene; HPLC: high performance liquid chromatography; UV: ultraviolet; 7T: 7 Tesla; wt: wild-type; PBS: phosphate buffered saline; tR: retention time; ROI: region of interest; RF: radiofrequency; GE: general electric; IRW: inveon research workstation; OCT: optimal-cutting temperature; TBS: Tris-buffered saline; STDEV: standard deviation; SEM: standard error of mean.
Supplementary Material
Supplementary figures and tables.
Acknowledgements
We would like to thank Thomas Liguori from InviCRO for his technical assistance with VivoQuant image analysis software. From the SCi3 Small Animal Imaging Facility (SAIF) we thank Dr. Timothy Doyle for his assistance with PET/CT imaging, Dr. Laura Pisani for her help with MRI, and Dr. Frezghi Habte for advice concerning image analysis. From the Radiochemistry Facility at Stanford, we would like to thank Dr. Frederick Chin and Natasha Arksey for their kind assistance with the radiosynthesis of [18F]PBR06. WT, VR and PAJ are employees of GEHC and GEHC provided materials for the preparation of [18F]GE-180. GEHC did not fund this work, however, they do provide research grants at Stanford University to multiple investigators in the general area of biomedical imaging.
Funding
This project was supported by funding from NIA (R21 RAG050249A) to M.L.J. and F.M.L., in addition to Dolby Family Ventures (F.M.L.), the Jean Perkins Foundation (F.M.L.), the Horngren Family (F.M.L.), the Greg and Nancy Serrurier Family (F.M.L), and Rivet Revolution, LLC (F.M.L).
Competing interests
Dr. Longo is listed as an inventor on patents relating to LM11A-31, which are assigned to UNC and UCSF. Dr. Longo is eligible for royalties distributed by the assigned universities. Dr. Longo has financial interest in PharmatrophiX, a company focused on the development of small molecule ligands for neurotrophin receptors, which has licensed several of these patents.
References
1. Association A. 2015 Alzheimer's disease facts and figures. Alzheimer's Dementia. 2015;11:332-84
2. Alzheimer's Association. Changing the Trajectory of Alzheimer's Disease: How a Treatment by 2025 Saves Lives and Dollars. 2015.
3. Doody RS, Raman R, Farlow M, Iwatsubo T, Vellas B, Joffe S. et al. A Phase 3 Trial of Semagacestat for Treatment of Alzheimer's Disease. N. Engl. J. Med. 2013;369:341-50
4. Salloway S, Sperling R, Fox NC, Blennow K, Klunk W, Raskind M. et al. Two phase 3 trials of bapineuzumab in mild-to-moderate Alzheimer's disease. N. Engl. J. Med. 2014;370:322-33
5. Von Bernhardi R. Immunotherapy in Alzheimer's disease: Where do we stand? Where should we go? J. Alzheimer's Dis. 2010;19:405-21
6. Schneider LS, Mangialasche F, Andreasen N, Feldman H, Giacobini E, Jones R. et al. Clinical trials and late-stage drug development for Alzheimer's disease: An appraisal from 1984 to 2014. J. Intern. Med. 2014;275:251-83
7. Berk C, Sabbagh MN. Successes and failures for drugs in late-stage development for alzheimer's disease. Drugs and Aging. 2013;10:783-92
8. Krstic D, Knuesel I. Deciphering the mechanism underlying late-onset Alzheimer disease. Nat. Rev. Neurol. 2013;9:25-34
9. Heneka MT, Carson MJ, Khoury J El, Landreth GE, Brosseron F, Feinstein DL. et al. Neuroinflammation in Alzheimer's disease. Lancet Neurol. 2015;4:388-405
10. Ferretti MT, Cuello AC. Does a pro-inflammatory process precede Alzheimer's disease and mild cognitive impairment? Curr. Alzheimer Res. 2011;8:164-74
11. Ferretti M, Allard S, Partridge V, Ducatenzeiler A, Cuello AC. Minocycline corrects early, pre-plaque neuroinflammation and inhibits BACE-1 in a transgenic model of Alzheimer's disease-like amyloid pathology. J. Neuroinflammation. 2012;9:62
12. Krstic D, Madhusudan A, Doehner J, Vogel P, Notter T, Imhof C. et al. Systemic immune challenges trigger and drive Alzheimer-like neuropathology in mice. J. Neuroinflammation. 2012;9:151
13. McGeer PL, McGeer EG. NSAIDs and Alzheimer disease: Epidemiological, animal model and clinical studies. Neurobiol. Aging. 2007;28:639-47
14. Krause DL, Müller N. Neuroinflammation, microglia and implications for anti-inflammatory treatment in Alzheimer's disease. Int. J. Alzheimers. Dis. 2010:2010
15. Chen MK, Guilarte TR. Translocator protein 18 kDa (TSPO): molecular sensor of brain injury and repair. Pharmacol. Ther. 2008;118:1-17
16. Papadopoulos V, Baraldi M, Guilarte TR, Knudsen TB, Lacapère JJ, Lindemann P. et al. Translocator protein (18 kDa): new nomenclature for the peripheral-type benzodiazepine receptor based on its structure and molecular function. Trends Pharmacol. Sci. 2006;27:402-9
17. Luus C, Hanani R, Reynolds A, Kassiou M. The development of PET radioligands for imaging the translocator protein (18 kDa): What have we learned? J. Label. Compd. Radiopharm. 2010;53:501-10
18. Venneti S, Lopresti BJ, Wang G, Hamilton RL, Mathis C a, Klunk WE. et al. PK11195 labels activated microglia in Alzheimer's disease and in vivo in a mouse model using PET. Neurobiol. Aging. 2009;30:1217-26
19. Schuitemaker A, Kropholler MA, Boellaard R, van WM, Kloet RW, van TF. et al. Microglial activation in Alzheimer's disease: an (R)-[11C]PK11195 positron emission tomography study. Neurobiol. Aging. 2013;34:128-36
20. Edison P, Archer HA, Gerhard A, Hinz R, Pavese N, Turkheimer FE. et al. Microglia, amyloid, and cognition in Alzheimer's disease: An [11C](R)PK11195-PET and [11C]PIB-PET study. Neurobiol. Dis. 2008;32:412-9
21. Chauveau F, Boutin H, Van Camp N, Dollé F, Tavitian B. Nuclear imaging of neuroinflammation: a comprehensive review of [11C]PK11195 challengers. Eur. J. Nucl. Med. Mol. Imaging. 2008;35:2304-19
22. Hamelin L, Lagarde J, Dorothé G, Leroy C, Labit M, Comley RA. et al. Early and protective microglial activation in Alzheimer's disease: a prospective study using 18F-DPA-714 PET imaging. Brain. 2016:1252-64
23. Yokokura M, Terada T, Bunai T, Nakaizumi K, Takebayashi K, Iwata Y. et al. Depiction of microglial activation in aging and dementia: Positron emission tomography with [11C]DPA713 versus [11C](R)PK11195. J. Cereb. Blood Flow Metab. 2017;37:877-889
24. Kreisl WC, Lyoo CH, Liow J-S, Wei M, Snow J, Page E. et al. 11C-PBR28 binding to translocator protein increases with progression of Alzheimer's disease. Neurobiol. Aging. 2016;44:53-61
25. Lyoo CH, Ikawa M, Liow JS, Zoghbi SS, Morse CL, Pike VW. et al. Cerebellum Can Serve As a Pseudo-Reference Region in Alzheimer Disease to Detect Neuroinflammation Measured with PET Radioligand Binding to Translocator Protein. J. Nucl. Med. 2015;56:701-6
26. Kreisl WC, Lyoo CH, McGwier M, Snow J, Jenko KJ, Kimura N. et al. In vivo radioligand binding to translocator protein correlates with severity of Alzheimer's disease. Brain. 2013;136:2228-38
27. Owen DRJ, Gunn RN, Rabiner EA, Bennacef I, Fujita M, Kreisl WC. et al. Mixed-affinity binding in humans with 18-kDa translocator protein ligands. J. Nucl. Med. 2011;52:24-32
28. Guo Q, Owen DR, Rabiner EA, Turkheimer FE, Gunn RN. Identifying improved TSPO PET imaging probes through biomathematics: The impact of multiple TSPO binding sites in vivo. Neuroimage. 2012;60:902-10
29. Wadsworth H, Jones P a, Chau W-F, Durrant C, Fouladi N, Passmore J. et al. [18F]GE-180: a novel fluorine-18 labelled PET tracer for imaging translocator protein 18 kDa (TSPO). Bioorg. Med. Chem. Lett. 2012;22:1308-13
30. Trigg W, Buckley C, Heurling K, Sherwin P, Brooks D, Sridharan S. et al. Evaluation of [18F]GE-180 PET imaging in relapsing-remitting multiple sclerosis patients: a first-in-human study. ECTRIMS Online Libr. 2015:115715 Abstract: P453
31. Boutin H, Murray K, Pradillo J, Maroy R, Smigova A, Gerhard A. et al. 18F-GE-180: a novel TSPO radiotracer compared to 11C-R-PK11195 in a preclinical model of stroke. Eur. J. Nucl. Med. Mol. Imaging. 2015;42:503-11
32. Dickens AM, Vainio S, Marjamäki P, Johansson J, Lehtiniemi P, Rokka J. et al. Detection of microglial activation in an acute model of neuroinflammation using PET and radiotracers 11C-(R)-PK11195 and 18F-GE-180. J. Nucl. Med. 2014;55:466-72
33. Ory D, Celen S, Verbruggen a, Bormans G. PET radioligands for in vivo visualization of neuroinflammation. Curr Pharm Des. 2014;20:5897-913
34. Sridharan S, Lepelletier FX, Trigg W, Banister S, Reekie T, Kassiou M. et al. Comparative Evaluation of Three TSPO PET Radiotracers in a LPS-Induced Model of Mild Neuroinflammation in Rats. Mol. Imaging Biol. Molecular Imaging and Biology. 2016:1-13
35. Knowles JK, Simmons DA, Nguyen TV V, Vander Griend L, Xie Y, Zhang H. et al. A small molecule p75NTR ligand prevents cognitive deficits and neurite degeneration in an Alzheimer's mouse model. Neurobiol. Aging. 2013;34:2052-63
36. Nguyen TV V, Shen L, Vander Griend L, Quach LN, Belichenko NP, Saw N. et al. Small molecule p75NTR ligands reduce pathological phosphorylation and misfolding of tau, inflammatory changes, cholinergic degeneration, and cognitive deficits in APPL/S transgenic mice. J. Alzheimer's Dis. 2014;42:459-83
37. Rockenstein E, Mallory M, Mante M, Sisk A, Masliaha E. Early formation of mature amyloid-beta protein deposits in a mutant APP transgenic model depends on levels of abeta(1-42). J. Neurosci. Res. 2001;66:573-82
38. Simmons DA, Knowles JK, Belichenko NP, Banerjee G, Finkle C, Massa SM. et al. A small molecule p75NTR ligand, LM11A-31, reverses cholinergic neurite dystrophy in Alzheimer's disease mouse models with mid- to late-stage disease progression. PLoS One. 2014;9:e102136
39. James ML, Belichenko NP, Nguyen T-V V, Andrews LA, Ding Z, Liu H. et al. PET Imaging of Translocator Protein (18 kDa) in a Mouse Model of Alzheimer's Disease Using N-(2,5-Dimethoxybenzyl)-2-18F-Fluoro-N-(2-Phenoxyphenyl)Acetamide. J. Nucl. Med. 2015;56:311-6
40. Massa SM, Xie Y, Yang T, Harrington AW, Kim ML, Yoon SO. et al. Small, nonpeptide p75NTR ligands induce survival signaling and inhibit proNGF-induced death. J. Neurosci. 2006;26:5288-300
41. Lartey FM, Ahn G-O, Shen B, Cord K-T, Smith T, Chua JY. et al. PET Imaging of Stroke-Induced Neuroinflammation in Mice Using [18F]PBR06. Mol. Imaging Biol. 2014;16:109-17
42. James ML, Shen B, Zavaleta CL, Nielsen CH, Mesangeau C, Vuppala PK. et al. New positron emission tomography (PET) radioligand for imaging σ-1 receptors in living subjects. J. Med. Chem. 2012;55:8272-82
43. Gandelman MS, Baldwin RM, Zoghbi SS, Zea-Ponce Y, Innis RB. Evaluation of ultrafiltration for the free-fraction determination of single photon emission computed tomography (SPECT) radiotracers: beta-CIT, IBF, and iomazenil. J. Pharm. Sci. 1994;83:1014-9
44. Zanotti-Fregonara P, Chen K, Liow J-S, Fujita M, Innis RB. Image-derived input function for brain PET studies: many challenges and few opportunities. J. Cereb. Blood Flow Metab. 2011;31:1986-98
45. de Geus-Oei L-F, Visser EP, Krabbe PFM, van Hoorn BA, Koenders EB, Willemsen AT. et al. Comparison of Image-Derived and Arterial Input Functions for Estimating the Rate of Glucose Metabolism in Therapy-Monitoring 18F-FDG PET Studies. J. Nucl. Med. 2006;47:945-9
46. Cymerman U, Pazos A, Palacios JM. Evidence for species differences in “peripheral” benzodiazepine receptors: an autoradiographic study. Neurosci. Lett. 1986;66:153-8
47. Hirvonen J, Kreisl WC, Fujita M, Dustin I, Khan O, Appel S. et al. Increased in vivo expression of an inflammatory marker in temporal lobe epilepsy. J. Nucl. Med. 2012;53:234-40
48. Mhatre SD, Tsai CA, Rubin AJ, James ML, Andreasson KI. Microglial Malfunction: The Third Rail in the Development of Alzheimer's Disease. Trends Neurosci. 2015;38:621-36
49. Briard E, Shah J, Musachio J. Synthesis and evaluation of a new 18F-labeled ligand for PET imaging of brain peripheral benzodiazepine receptors. J. Labeled Compd. Radiopharm. 2005:48 (abstract)
50. Jaremko L, Jaremko M, Becker S, Zweckstetter M. Toward the functional oligomerization state of tryptophan-rich sensory proteins. Protein Sci. 2014;23:1154-60
51. Maeda J, Zhang M-R, Okauchi T, Ji B, Ono M, Hattori S. et al. In vivo positron emission tomographic imaging of glial responses to amyloid-beta and tau pathologies in mouse models of Alzheimer's disease and related disorders. J. Neurosci. 2011;31:4720-30
52. Liu B, Le KX, Park M, Wang S, Belanger AP, Dubey X. et al. In Vivo Detection of Age- and Disease-Related Increases in Neuroinflammation by 18F-GE180 TSPO MicroPET Imaging in Wild-Type and Alzheimer's Transgenic Mice. J. Neurosci. 2015;35:15716-30
53. Roberts JC, Friel SL, Roman S, Perren M, Harper A, Davis JB. et al. Autoradiographical imaging of PPARγ agonist effects on PBR/TSPO binding in TASTPM mice. Exp. Neurol. 2009;216:459-70
54. Johansson JU, Pradhan S, Lokteva L a, Woodling NS, Ko N, Brown HD. et al. Suppression of Inflammation with Conditional Deletion of the Prostaglandin E2 EP2 Receptor in Macrophages and Brain Microglia. J. Neurosci. 2013;33:16016-32
55. Jiang J, Quan Y, Ganesh T, Pouliot W a, Dudek FE, Dingledine R. Inhibition of the prostaglandin receptor EP2 following status epilepticus reduces delayed mortality and brain inflammation. Proc. Natl. Acad. Sci. 2013;110:3591-6
56. Fan Z, Calsolaro V, Atkinson RÁ, Femminella GD, Waldman A, Buckley C. et al. Flutriciclamide (18F-GE180) PET: first in human PET study of novel 3rd generation in vivo marker of human translator protein. J. Nucl. Med. 2016;57:1753-9
57. Feeney C, Scott G, Raffel J, Roberts S, Coello C, Jolly A. et al. Kinetic analysis of the translocator protein positron emission tomography ligand [18F]GE-180 in the human brain. Eur. J. Nucl. Med. Mol. Imaging. 2016;43:2201-10
Author contact
![]() Corresponding authors: Frank M Longo, Department of Neurology and Neurological Sciences,
Stanford University School of Medicine, CA, 94305, USA. E-mail: flongoedu; Phone 650 724-3172;
Fax 650 723-7434. Michelle L James, Department of Radiology, Stanford University School of Medicine, CA, 94305, USA E-mail: mljamesedu; Phone 650-721-3324; Fax 650-723-8649.
Corresponding authors: Frank M Longo, Department of Neurology and Neurological Sciences,
Stanford University School of Medicine, CA, 94305, USA. E-mail: flongoedu; Phone 650 724-3172;
Fax 650 723-7434. Michelle L James, Department of Radiology, Stanford University School of Medicine, CA, 94305, USA E-mail: mljamesedu; Phone 650-721-3324; Fax 650-723-8649.