Impact Factor
- Issue 14; 2026
- Issue 13; 2026
- Issue 12; 2026
- Issue 11; 2026
- Issue 10; 2026
- Volume 16; 2026
- Advance Articles
- Past Issues
- Cover Images
- Cover Suggestion
- Index & Coverage
- Special Issues
Introduction
Materials and methods
Results and Discussion
Conclusion
Supplementary Material
Acknowledgements
References
International Journal of Biological Sciences
International Journal of Medical Sciences
 Global reach, higher impact

Theranostics 2017; 7(5):1290-1302. doi:10.7150/thno.18557 This issue Cite
Research Paper
Design of Tumor Acidity-Responsive Sheddable Nanoparticles for Fluorescence/Magnetic Resonance Imaging-Guided Photodynamic Therapy
Feng Fan1*, Yue Yu2*, Fei Zhong3*, Meng Gao2*, Tianmeng Sun4, Jiaxin Liu5, Huimao Zhang5, Haisheng Qian1, Wei Tao1, Xianzhu Yang1 ![]()
1. School of Biological and Medical Engineering, Hefei University of Technology, Hefei, Anhui 230009, China;
2. Division of Gastroenterology, Affiliated Provincial Hospital, Anhui Medical University, Anhui 230001, China;
3. Department of Oncolog, the First Affiliated Hospital of Anhui Medical University, Hefei 230022, China;
4. The First Hospital and Institute of Immunology, Jilin University, Changchun 130061, P. R. China;
5. Department of Radiology, The First Hospital of JiLin University, Changchun, 130061, P. R. China.
* These authors contributed equally to this work.
Received 2016-11-30; Accepted 2016-12-17; Published 2017-3-7
Abstract

Imaging-guided cancer therapy, which integrates diagnostic and therapeutic functionalities into a single system, holds great promise to enhance the accuracy of diagnosis and improve the efficacy of therapy. Specifically, for photodynamic therapy (PDT), it is highly desirable to precisely focus laser light onto the tumor areas to generate reactive oxygen species (ROS) that are cytotoxic tumor cells and avoid light-associated side effects. Herein, a distinct three-layer nanostructured particle with tumor acidity-responsiveness (S-NP) that encapsulates the photosensitizer chlorin e6 (Ce6) and chelates Gd3+ is successfully developed for fluorescence/magnetic resonance (MR) dual-model imaging-guided precision PDT. We show clear evidence that the outer PEG layer significantly prolongs circulation time, and the inner poly(ε-caprolactone) (PCL) core can physically encapsulate Ce6. More interestingly, the middle layer of the S-NP, acting as a molecular fence to keep Ce6 in the circulation system, was dismantled by the slightly acidic tumor microenvironment. Afterwards, the PEG shell is deshielded from the S-NP at the tumor tissue, resulting in improved cell uptake, enlarged MR signal intensity, rapid release of Ce6 within tumor cells, and elevated PDT efficacy. Our results suggest that tumor-acidity-responsive nanoparticles with fine design could serve as a theranostic platform with great potential in imaging-guided PDT treatment of cancer.
Keywords: sheddable nanoparticles, tumor acidity-responsive, photodynamic therapy, magnetic resonance imaging
Introduction
Photodynamic therapy (PDT), based on the principle of generating cytotoxic reactive oxygen species (ROS) to induce cell apoptosis and tissue destruction under light activation by photosensitizers, has emerged as an efficient medical tool for treating various cancers [1-4]. Compared with traditional cancer treatments (e.g., chemotherapy and radiotherapy), PDT causes lower nonspecific toxicity to normal tissues or organs because the ROS are generated only under specific wavelengths of light (non-ionizing and not harmful), and the photosensitizers are usually not toxic in the dark, which makes PDT very attractive for tumor treatment [5-8]. In 1978, Dougherty et al. first reported that patients were successfully treated with PDT using a hematoporphyrin derivative [4]. Since then, clinical interest in PDT has led to extensive investigations, and PDT is clinically approved for the treatment of bladder cancer, lung cancer, esophageal cancer, head/neck cancer, gastric cancer, etc [9, 10]. Despite great progress, treatment of cancer with PDT still has several limitations. On one hand, the highly hydrophobic properties of most photosensitizers and inefficient tumor accumulation have hampered its therapeutic efficacy [11-14]. On the other hand, precisely focusing the laser light on the tumor areas to efficiently generate ROS and avoid the light-associated side effects is highly desired [15-19].
The combination of PDT and nanotechnology has received significant attention in recent years [20-22]. Nanomaterials are capable of efficiently carrying photosensitizers through physical encapsulation or chemical conjugation, and improve the accumulation of photosensitizers in tumor tissue by an “enhanced permeability and retention” (EPR) effect [23-28]. Moreover, diagnostic agents can be simultaneously integrated into the same nanoparticles, achieving real-time and precise PDT for treatment of cancer [29-31]. Such imaging-guided PDT using the nanomaterials has shown great promise in the optimization of therapeutic efficiency [32-37]. For instance, Liu et al. demonstrated that PDT based on upconversion nanoparticles can effectively destroy 4T1 murine breast cancer tumor under the guidance of upconversion luminescence and MR dual-modal imaging [29]. In another example, Cai and co-workers demonstrated that fluorescence/photoacoustic imaging-guided precision phototherapy completely suppressed the growth of tumors, and no tumor recurrence was observed after treatment [38].
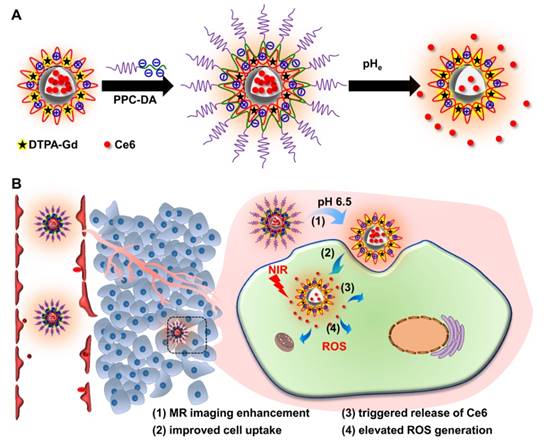
In our previous work, we reported a tumor acidity-triggered sheddable nanoparticle for significantly improved accumulation of platinum drug in tumor tissue and complete inhibition of tumor growth [39]. In this work, we re-design our system and try to realize tumor acidity-targeted imaging-guided PDT for treatment of pancreatic cancer. The cationic amphiphilic diblock polymer PCL45-b-PAEP35-Cya/DTPA was synthesized and used to fabricate the photosensitizer Ce6 and Gd3+-loaded cationic nanomicelle ⊕NPCe6&(DTPA-Gd). Then, the tumor acidity-responsive PEGylated anionic diblock polymer PPC-DA was introduced onto the surface of positively charged ⊕NPCe6&(DTPA-Gd) at optimized weight ratios through electrostatic interaction (Figure 1A). The obtained tumor acidity-responsive nanoparticle S-NP comprises three distinct layers of nanostructures. The inner PCL core can physically encapsulate Ce6 and maintain the nanostructure, and the outer PEG layer efficiently allows the nanoparticles to escape immunological recognition and significantly prolong circulation of the carried Ce6 and Gd3+. The middle layer, which consists of the cationic block of polymer PCL45-b-PAEP35-Cya/DTPA and anionic block of PPC-DA, responds to the extracellular pH of tumor tissue (pHe) but not to the pH of normal blood [40]. Thus, it acts as a molecular fence to keep the photosensitizer Ce6 in the hydrophobic core in the circulation. After accumulation in the tumor tissue, this middle layer will be dismantled by the slightly acidic tumor microenvironment, and then the PEG shell is deshielded, which is accompanied by improved cellular uptake, enlarged MR signal intensity, and rapid release of Ce6 within tumor cells (Figure 1B). Utilizing this re-designed tumor acidity-responsive S-NP, fluorescence/MR imaging-guided PDT is comprehensively evaluated in a human pancreatic tumor model, achieving superior therapeutic outcomes with a shrinking tumor volume.
(A) Schematic illustration of the preparation of the Ce6- and Gd3+-loaded pHe-responsive nanoparticles S-NP. (B) Schematic illustration of the tumor acidity-responsive nanoparticles S-NP for fluorescence/MR imaging-guided PDT. The S-NP showed a prolonged circulation due to the outer PEG layer, and retained the photosensitizer Ce6, avoiding leakage into blood during circulation. After accumulation in the tumor tissue, the middle layer of S-NP was dismantled by the slightly acidic tumor microenvironment, and then the PEG shell was deshielded, thus enlarging MR signal intensity, improving cell uptake, and triggering the release of Ce6, resulting in the efficiently fluorescence/MR imaging-guided PDT.
Materials and methods
Materials and general characterizations
Diethylenetriaminepentaacetic dianhydride (DTPA), GdCl3•6H2O, Cysteamine hydrochloride (Cya), succinic anhydride (SA), dimethylmaleic anhydride (DA) and 2,2-Dimethoxy-2-phenylacetophenone (DMPA) were purchased from Aladdin Chemical Co., Ltd. (Shanghai, China). 3-(4,5-Dimethylthiazol-2-yl)-2,5-diphenyl tetrazolium bromide (MTT) was obtained from Sigma-Aldrich. Fetal bovine serum (FBS) and Dulbecco's Modified Eagle Medium (DMEM) were obtained from Invitrogen (Carlsbad, NM). Photosensitizer chlorin e6 (Ce6) was purchased from J&K Chemical Ltd (Shanghai, China). The synthesis and characterization of diblock copolymer PCL45-b-PAEP35-Cya/DTPA were described in the supporting information (Figure S1). The diblock copolymer of tumor acidity-responsive polymer PPC-DA and cyclic phosphate monomer ally ethylene phosphate (AEP) were synthesized by a similar method described previously [40, 41] and described in the supporting information (Figure S2).
Nuclear magnetic resonance (NMR) spectra were recorded in deuterated reagent (such as, CDCl3 or DMSO-d6) with a Agilent VNMRS 600 MHz NMR spectrometer (California, USA). The size and size distribution of nanoparticle in aqueous solution were measured by dynamic light scattering (DLS) carried out on a Brookhaven NanoBrook-90 Plus (Brookhaven Instrument Corporation, New York, USA) apparatus with a solid laser (35 mW, 640 nm) and 90° collecting optics. The concentration of Ce6 was determined using a UV-Vis spectrometer (UV-2802 PC, UNICO Instruments) at a wavelength of 405 nm wavelengths. The morphology of the nanoparticle was examined by JEM-2100F transmission electron microscopy (TEM) at an accelerating voltage of 200 kV.
Preparation of the pHe-responsive sheddable nanoparticle S-NP
The cationic amphiphilic diblock polymer PCL45-b-PAEP35-Cya/DTPA was firstly used to fabricate the photosensitizer Ce6- and Gd3+-loaded cationic nanomicelle ⊕NPCe6&(DTPA-Gd) (supporting information). Then, an aqueous solution of PPC-DA (1.0 mL, 2.0 mg/mL in water) was added to an aqueous solution of ⊕NPCe6&(DTPA-Gd) (1.0 mL, 1 mg/mL in water), and the solution was allowed to stand at room temperature for 15 min before use. Nanoparticles prepared by⊕NPCe6&(DTPA-Gd) and insensitive PPC-SA at a weight ratio of 1/2 (denoted as unS-NP) was used as a control. According to the results of UV-Vis spectrum and inductively coupled plasma mass spectrometry, the Ce6 and Gd3+ content of S-NP and unS-NP were 1.62% and 1.08%, respectively.
Stability of S-NP and unS-NP
FBS (0.5 mL, 1 mg/mL) was gently added to the nanoparticle solution (0.5 mL, 1 mg/mL) of the ⊕NPCe6&(DTPA-Gd), S-NP, and unS-NP. After incubation for different times, the diameters of nanoparticles were monitored by DLS as described above.
Zeta potential change of S-NP and unS-NP in different pH conditions
The nanoparticle unS-NP or S-NP (1.0 mg/mL) were incubated in phosphate buffer saline (PBS, 0.01 M) at pH 6.5 or 7.4 at 37 ºC. At designated time intervals, an aliquot of the nanoparticles solution was withdrawn, and the zeta potential was measured.
In vitro release of Ce6 from S-NP and unS-NP
To monitor the release profile of Ce6, S-NP and unS-NP were suspended in PBS (0.02 M, pH 7.4 or, pH 6.5). The final Ce6 concentration was 50.0 μg/mL. The solution (1.0 mL) was transferred into the dialysis membrane tubing (MWCO 14,000 Da) at 37 °C with gentle shaking (80 rpm). At predetermined intervals, the external PBS was collected and replaced by the fresh buffer. The collected solution was lyophilized for high-performance liquid chromatography (HPLC) analyses to determine the concentration of Ce6.
T1 Relaxivity Measurement
The longitudinal relaxation rates (1/T1) of the S-NP, unS-NP, and the small molecule contrast agent DTPA-Gd at varying Gd3+ concentrations were measured using a clinical whole-body MR imaging system (3.0 T, Philips, Netherlands), in combination with a coil for small animals at 37 °C. The S-NP and unS-NP were firstly incubated at 37 oC for 30 min, and then T1-weighted MR images of these nanoparticles were obtained using T1-weighted pulse sequences. The echo time (TE) was set as 30 ms, while the repetition time (TR) was set as 600 ms. The signal intensity of the samples was measured on the obtained T1-weighted MR images, and the relaxivity values were calculated via linear least-squares fitting of 1/relaxation time (s-1) vs the Gd3+ concentration (mM).
Analyses of cellular uptake of Ce6 after treatment with S-NP or unS-NP in different pH conditions
Pancreatic cancer cells, BxPC-3, were cultured with RPMI 1640 containing 10% fetal bovine serum. To measure the cellular uptake of Ce6, cells were seeded in 24-well plates (5.0×10⁴ cells/well) and incubated at 37 °C for 24 h. Then, the medium was replaced with 0.5 mL of RPMI 1640 medium (pH 7.4 or 6.5) containing free Ce6, S-NP or unS-NP at an equivalent Ce6 concentration of 1.0 μg/mL. After further incubation for 2 h or 4 h, the cells were washed three times with PBS, trypsinized, and collected for FACS analyses (FACS Calibur flow cytometer, BD Biosciences, USA). For quantitatively detection of the cellular uptake of Ce6, after incubation with these nanoparticles for 2 h or 4 h at different pH values, the cells were washed with PBS, trypsinized, and lysed with 1% Triton X-100 in PBS (250 µL) at 37 °C for 30 min, followed by three freeze-thaw cycles. And then, the concentration of Ce6 in the cell lysates was determined by HPLC analyses, using a Waters HPLC system consisting of a Waters 1525 binary pump, a Waters 2487 UV/visible detector, a 1500 column heater and a Symmetry C18 column. The UV/visible detector was set at 405 nm and linked to Breeze software for data analysis. HPLC grade ammonium acetate buffer (0.05 M, pH 5.5) with methanol at a ratio of 38:62 (v/v) was used as the mobile phase at 30 ºC with a flow rate of 0.7 mL/min. Linear calibration curves for concentrations in the range of 1.0-32.0 μg/mL were constructed using the peak areas by linear regression analysis. The concentration of Ce6 in the solution was calculated based the standard curve.
For microscopic observations, BxPC-3 cells (5.0×10⁴ cells/well) were seeded on coverslips in a 24-well plate and incubated for 24 h. The medium was replaced with RPMI 1640 medium (pH 7.4 or 6.5) containing free Ce6, unS-NP or S-NP at an equivalent concentration of 20.0 μg/mL. After incubation at 37 °C for 2 h at either pH 7.4 or 6.5, BxPC-3 cells were washed twice with PBS and fixed with 4% formaldehyde for 15 min at room temperature. The cytoskeleton and cell nuclei were stained with Alexa Fluor 488 phalloidin (Invitrogen, Carlsbad, USA) and DAPI according to the manufacturer's instructions. Then, the cellular uptake of Ce6 was visualized using a confocal laser scanning microscope (CLSM 710, Carl Zeiss Inc., Jena, Germany).
In vitro phototoxicity assays of the S-NP in different pH conditions
BxPC-3 cells were seeded into 96-well plates (5.0×10³ cells/well) and incubated for 24 h. Then, the medium was replaced with 100 μL of RPMI 1640 medium (pH 7.4 or 6.5) containing serial concentrations of S-NP or unS-NP. Free Ce6, at the equivalent concentrations, was used as a control. After incubation for 4 h, the medium was replaced with fresh medium, and the cells were irradiated with a near-infrared laser (660 nm, 0.5 W/cm2) for 20 min. Finally, all the groups were further incubated at 37 °C for 12 h. MTT assay and live/dead staining were used to measure the cell viability according to the standard protocol, respectively.
Generation of intracellular ROS in different pH conditions
To detect the generation of intracellular ROS, BxPC-3 cells were seeded in 24-well plates (1.0×10⁵ cells/well) at 37 °C. After incubation for 24 h, the medium was replaced with 0.5 mL of RPMI 1640 medium (pH 7.4, pH 6.5) containing S-NP or unS-NP at a Ce6 concentration of 20 μg/mL. Free Ce6, at the equivalent concentrations, was used as a control. After further incubation for 4 h, the medium was replaced with fresh medium, and the cells were irradiated with a near-infrared laser (660 nm, 0.5 W/cm2) for 20 min. Then, the detection reagent DCFH-DA was used to detect intracellular ROS according to the standard protocol.
Animals and tumor model
Balb/C nude mice (4-5 weeks) and ICR mice (5-6 weeks) were purchased from the Beijing HFK Bioscience Co., Ltd. All animals received care in compliance with the guidelines outlined in the Guide for the Care and Use of Laboratory Animals. The procedures were approved by the Hefei University of Technology Animal Care and Use Committee. To establish a BxPC-3 tumor model, Balb/C nude mice (4~5 weeks) were injected with 5×10⁶ cells with 20% BD gel into the right side of the back. After the tumor volume reached 100 mm3, the mice were used for subsequent experiments.
Pharmacokinetics, biodistribution and accumulation of S-NP in vivo
ICR mice were randomly divided into three groups. S-NP, unS-NP, and free Ce6 were intravenously injected into ICR mice through the tail vein at a Ce6 dose of 2.5 mg/kg (n = 3 per group). At predetermined time points, the blood was collected from the retro-orbital plexus of the mice eye, then placed in heparinized tubes and centrifuged to obtain plasma. The concentration of Ce6 in the plasma of each group was measured by HPLC. The pharmacokinetics parameters were calculated by DAS 3.0 using the non-compartmental model. Pharmacokinetic parameters, such as plasma clearance (Cl) and the area under the blood concentration curve (AUC), were calculated by non-compartmental data analysis of blood concentrations.
Following intravenous injection of different formulations into nude mice bearing BxPC-3 xenografts, the in vivo fluorescence distribution in tumor-bearing mice was detected at predetermined time points by a Xenogen IVIS® Lumina system (Caliper Life Sciences, USA). At 48 h post-injection, the mice were sacrificed, and the solid tumor tissues were collected, washed with PBS, and imaged by the Xenogen IVIS Lumina system.
In vivo MR imaging
Tumor-bearing mice were administered via the tail vein an injection of these formulations at a dose of 70 μmol Gd/kg, respectively. At predetermined time points, T1-weighted images were obtained using the MR imaging system as described above, in combination with a coil for small animals. In all animals, T1-TSE (turbo spin-echo, TSE) images with conventional k-space reading were obtained in the coronal and axial orientations. The sequences used were TSE T1 coronal (5% dist. factor, FOV 50 mm, slice thickness 0.5 mm, TR 600 ms, TE 30 ms, two averages) and TSE T1 axial (5% dist. factor, FOV 50 mm, slice thickness 2.0 mm, TR 632 ms, TE 30 ms, six averages). All image data were transferred to a remote computer (picture archiving and communication system. PACS) for analysis.
Tumor suppression study
The BxPC-3 tumor-bearing mice were randomized into six groups, and administered via the tail vein an injection of S-NP, unS-NP, or free Ce6 at an equivalent Ce6 dose of 2.5 mg/kg (n = 5 per group). At 24 h post-injection, partial groups were exposed to near-infrared light (660 nm, 0.5 W/cm2) for 30 min at the tumor site. The mice injected with S-NP and unS-NP without irradiation treatment were used as the controls.
The tumor volume was calculated by using the following formula: Vtumor= (a×b2)/2, where a and b represented the maximum length and the minimal width of tumors, respectively. At 18 days post-injection, mice were sacrificed, and the tumors tissues were excised to measure the wet weight. The tumor and main organs were fixed in 4% formaldehyde and embedded in paraffin. Then, the slices were prepared and stained with hematoxylin and eosin (H&E). In addition, the tumor sections were acquired for immunohistochemical staining for the proliferating cell nuclear antigen (PCNA) and the terminal transferase dUTP nick-end labeling (TUNEL) assay.
Statistical Analysis
The statistical significance of treatment outcomes was assessed using the Student's t-test; p < 0.05 was considered statistically significant in all analyses (95% confidence level).
Results and Discussion
Preparation and Characterization of Ce6 and Gd3+-loaded pHe-responsive nanoparticles S-NP
To prepare the pHe-responsive nanoparticles, S-NP, for fluorescence/MR imaging-guided photodynamic therapy, cationic amphiphilic diblock polymer PCL45-b-PAEP35-Cya/DTPA was synthesized (see the supporting information and Figure S1) to fabricate the Ce6 and Gd3+ ions-loaded cationic nanomicelle ⊕NPCe6&(DTPA-Gd). Then, the PEGylated anionic polymer PPC-DA or PPC-SA was inducted onto the surface of the positively charged nanoparticles, ⊕NPCe6&(DTPA-Gd), at different weight ratios through electrostatic interaction. As shown in Figure S3A, the size of the obtained nanoparticles was ca. 2500 nm when the weight ratio of PPC-DA or PPC-SA to ⊕NPCe6&(DTPA-Gd) was 0.5/1. When the weight ratio increased to 1/1 or above, the nanoparticle size was maintained at ca. 140 nm. Additionally, the zeta potential decreased as the cationic PPC-DA/⊕NPCe6&(DTPA-Gd) weight ratio increased due to the efficient surface coating by the anionic polymer PPC-DA or PPC-SA, and maintained ca. -20.0 mV when the ratio was 2/1 or above (Figure S3B). Thus, it is believed that, at the weight ratio of 2/1, the amount of anionic polymer PPC-DA or PPC-SA is sufficient to cover the cationic surface of the ⊕NPCe6&(DTPA-Gd). When the weight ratio was higher than 2/1, the size and zeta potentials was almost no change, indicating that excess cationic polymer may be present in these formulations. Therefore, the nanoparticles at the weight ratio of 2/1 for PPC-DA/⊕NPCe6&(DTPA-Gd) and PPC-SA/⊕NPCe6&(DTPA-Gd) were prepared for subsequent usage and were denoted as S-NP and unS-NP, respectively.
The average size of the obtained S-NP and unS-NP was ca. 140 nm (Figure 2A), which was further confirmed by transmission electron microscopy images, in which the nanoparticles exhibited a compact and spherical morphology (Figure 2B). It is expected that the outer PEG layer would minimize nonspecific interactions between serum proteins and S-NP and unS-NP. To demonstrate this, the S-NP, unS-NP, and ⊕NPCe6&(DTPA-Gd) were incubated in 10% fetal bovine serum (FBS), and then, size changes were determined. It was found that the sizes of unS-NP and S-NP showed almost no increase (Figure S4). In contrast, rapid particle aggregation and precipitation was observed for the cationic nanomicelle ⊕NPCe6&(DTPA-Gd), resulting in an inability to perform the subsequent experiment. This phenomenon demonstrated that the outer PEG layer significantly improved the stability of S-NP, which potentially extended the blood circulation of nanoparticles and enhanced accumulation in the tumor following systemic in vivo administration.
(A-B). Size distributions (A) and TEM images (B) of Ce6 and Gd3+-loaded nanoparticles S-NP and unS-NP. (C). Zeta potential changes of S-NP and unS-NP as a function of incubation time at pH 7.4 and pH 6.5. (D) Ce6 release profiles from unS-NP and S-NP at pH 7.4 and pH 6.5. (E) T1-weighted MR images of S-NP in aqueous solution with varying Gd3+ concentrations at pH 7.4 and pH 6.5. (F). Water proton longitudinal relaxation rate (1/T1) of S-NP and unS-NP in aqueous solution as a function of Gd3+ concentration. The small molecule DTPA-Gd complex was used as a control.
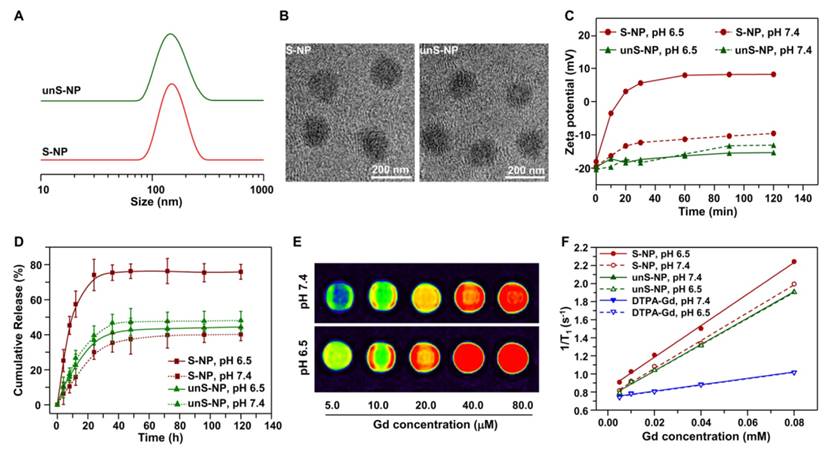
Our previous results demonstrated that PPC-DA is a tumor acidity-responsive polymer in which the amide bonds are cleaved under slightly acidic conditions, such as at pH 6.5, and is thus converted to a cationic polymer bearing amino groups (Figure S5) [40]. Therefore, the middle layer, which comprises the cationic block of polymer PCL45-b-PAEP35-Cya/DTPA and anionic block of PPC-DA, would be dismantled, resulting in deshielding of the PEG shell at pHe for S-NP. To demonstrate this, we monitored changes in the zeta potential of S-NP at pH 6.5, and the unS-NP was used as a control. As shown in Figure 2C, the zeta potential of the S-NP increased quickly and reached 7.9 mV within 20 min; however, the negative zeta potential of the nanoparticles was maintained at pH 7.4. In contrast, the zeta potentials of unS-NP exhibited negligible change at both pH 7.4 and pH 6.5, retaining a negative zeta potential. These results confirmed that the PEG shell of the S-NP was deshielded at the pHe, which is consistent with the previous results.
We next examined the effect of deshielding of the PEG shell on the release of the photosensitizer Ce6. As shown in Figure 2D, approximately 45% of the Ce6 was released by 120 h from unS-NP at either pH 7.4 or 6.5, and the pH value exhibited a negligible effect on the release rate. However, it is interesting that nearly 80% of the Ce6 was released from the S-NP at pH 6.5 within 24 h, while only 44% of the Ce6 was released at pH 7.4. This phenomenon was not observed in our previously reported results. It could be that the middle layer, consisting of a monolayer of polyion complexes, acted as a molecular fence to keep the photosensitizer Ce6 in the hydrophobic core. Thus, the enhanced release of Ce6 was manipulated by deshielding the PEG layer at pHe. Note that the free Ce6 more efficiently generated ROS than the S-NP and unS-NP at the same concentration (Figure S6). Thus, the enhanced release of Ce6 by deshielding the PEG layer at pHe can produce more ROS when exposed to the 660-nm laser.
To demonstrate the MR imaging contrast performance of S-NP, the longitudinal relaxation rates (1/T1) at different concentrations of Gd3+ were examined, and the typical T1 weighted spin-echo MR images are shown in Figure 2E. It was clearly observed that S-NP at pH 6.5 with the same Gd3+ concentration exhibited more prominent enhancement in MR signals when compared to those at pH 7.4, which is interesting. Furthermore, the relaxation rates of S-NP, unS-NP and free DTPA-Gd aqueous solutions were plotted as a function of their Gd3+ concentration at pH 7.4 and 6.5. As shown in Figure 2F, the nanoparticles S-NP, unS-NP, and DTPA-Gd exhibited a T1 relaxivity (r1) of 15.46 mM-1 s-1, 14.49 mM-1 s-1, and 3.54 mM-1 s-1, respectively, at pH 7.4. In contrast, the relaxivity of S-NP at pH 6.5 slightly increased to 17.45 mM-1 s-1, while the T1 relaxivity of unS-NPs and DTPA-Gd was nearly unaffected by the pH value. The MR contrast was enhanced at pH 6.5 for the S-NP. This could be because deshielding the PEG layer gave water molecules more access to the open coordination site of DTPA-Gd, which is also advantageous for the enhancement of T1 relaxivity.
Enhanced uptake of Ce6 in BxPC-3 Cells by deshielding the PEG Layer of S-NP
As demonstrated in Figure 1, deshielding the PEG layer of the S-NP at pH 6.5 enhanced cellular internalization by tumor cells. To demonstrate this, we incubated the S-NP and unS-NP with BxPC-3 cells for 2 h at pH 7.4 and 6.5, and then, the cells were harvested, and the intracellular Ce6 fluorescence was detected by flow cytometry at various time points. As shown in Figure 3A and 3B, after incubation with S-NPs at pH 6.5 for either 2 or 4 h, much stronger intracellular Ce6 fluorescence signals were observed compared to cells cultured with S-NP at pH 7.4. In contrast, the internalization of unS-NP by BxPC-3 cells was not significantly affected by pH (Figure S7), and similar mean fluorescence intensities were detected at both pH values.
(A-B). Flow cytometric analyses of BxPC-3 cells after incubation with S-NP at different pH value for 2 h (A) and 4 h (B). (C). Confocal laser scanning microscopy observation of BxPC-3 cells incubated with S-NP or unS-NP at different pH values. Cell nuclei and the cytoskeleton were stained with DAPI (Blue) and Alexa Fluor 488 phalloidin (Green), respectively. (D) Quantification of Ce6 content in BxPC-3 cells after incubating with S-NP, unS-NP, or free Ce6 at different pH values for 2 h and 4 h. The scale bar was 10 μm.
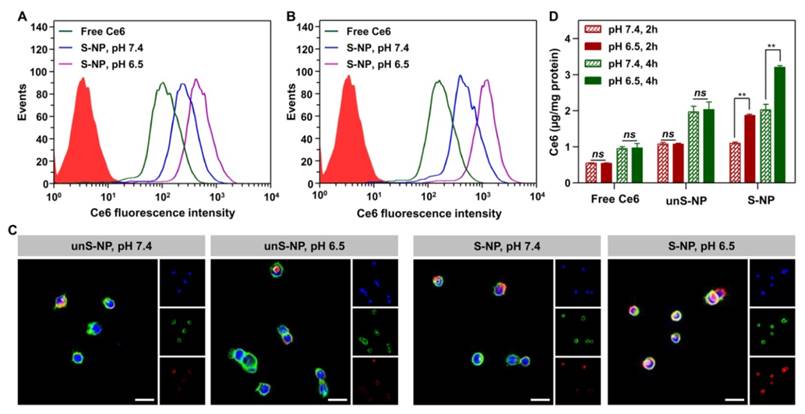
Confocal laser scanning microscopy (CLSM) analysis was further used to evaluate the cellular uptake in different pH conditions. The cells were cultured with S-NPs or unS-NP at pH 7.4 or 6.5, and free Ce6 was used as the control. After 2 h of incubation, the cytoskeleton F-actin and the cell nuclei were counter-stained with Alexa Fluor and DAPI, respectively. As shown in Figure 3C, it was clearly demonstrated that cells cultured with S-NP at pH 6.5 exhibited the most intense red fluorescence within BxPC-3 cells, in contrast to the cells cultured with S-NP at pH 7.4 or with unS-NP at both pH values. These results showed that the S-NP was capable of delivering more Ce6 into BxPC-3 cells due to the ability of the S-NP to deshield the PEG layer at pHe.
The above results were also confirmed by quantitatively determining the intracellular concentration of Ce6 using HPLC method. As shown in Figure 3D, after incubation with S-NP at pH 6.5 for 2 h or 4 h, the amount of intracellular Ce6 was approximately 1.7-fold and 1.6-fold higher, respectively, than that of treatment at pH 7.4, whereas the amount of intracellular Ce6 was not affected by incubation with unS-NP at different pH values, reaching a similar level to that obtained by incubation of S-NP at pH 7.4 at both time points.
In vitro cytotoxicity of the pH-responsive micelles S-NP
The enhanced delivery of Ce6 into BxPC-3 cells at pHe could be accompanied by an improved phototherapy efficacy to kill cancer cells [42, 43]. To demonstrate this, we further used an MTT assay to detect the phototherapy efficacy of these formulations. After exposure to a 660-nm laser (0.5 mW/cm2, 20 min), the cell viability in the presence of these formulations decreased in a dose-dependent manner (Figure 4A). As expected, S-NP at pH 6.5 led to the lowest cell viability among the treatments at the same concentration of Ce6. More specifically, for BxPC-3 cells treated with S-NPs at pH 6.5, more than 80% of the cancer cells were destroyed at a Ce6 dose of 0.375 μg/mL, while ca. 50% of BxPC-3 cells were still alive after treatment with S-NP at pH 7.4. In contrast, BxPC-3 cells treated with unS-NP did not exhibit significantly different cell viabilities at pH 6.5 (46.0%) and pH 7.4 (45.4%). It is worth noting that all these formulations showed negligible cytotoxicity without irradiation, even at the highest concentration (Figure S8).
(A). The cytotoxicity performance of S-NP, unS-NP, and free Ce6 performance in BxPC-3 cells under 660-nm laser irradiation. (B). Fluorescence images of live/dead staining of BxPC-3 cells after treatment with S-NP, unS-NP, and free Ce6 at different pH conditions under 660-nm laser irradiation.
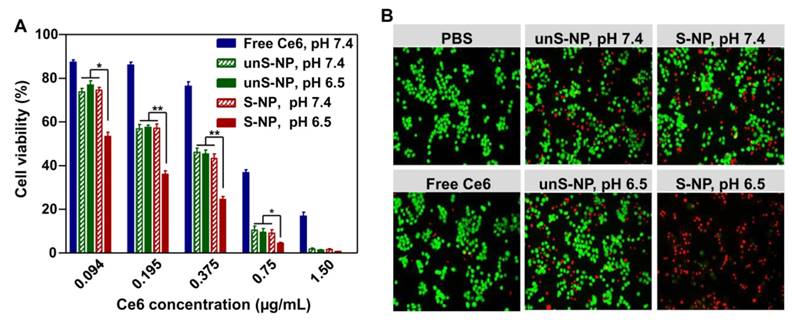
In accordance with the result of the MTT assay, after treatment with these formulations at a Ce6 dose of 0.5 μg/mL and 660-nm laser irradiation, the cell viability was further analyzed by live/dead staining. As shown in Figure 4B, delivery of Ce6 by S-NP at pH 6.5 more effectively killed BxPC-3 cells than at pH 7.4. Similarly, a comparable number of dead cells were observed for unS-NP carrying Ce6 at pH 6.5 and pH 7.4.
The above results indicated the superior anticancer activity of the S-NP at pH 6.5 under 660-nm laser irradiation, and the reason is very attractive. It is well known that generation of ROS is the major mechanism to induce cytotoxicity to cancer cells in PDT [5, 44-46]. To investigate the reason, intracellular ROS were first detected by the reactive oxygen species assay kit DCFH-DA [47, 48]. As shown in Figure S9, cells treated with unS-NP at either pH 7.4 or 6.5 and then irradiated by a 660 nm laser exhibited a slight green fluorescence, indicating that only a small amount of ROS were produced inside the BxPC-3 cells. Additionally, similar green fluorescence was detected in the BxPC-3 cells treated with S-NP at pH 7.4. In contrast, the strongest intracellular fluorescence was investigated for cells treated with S-NP at pH 6.5, resulting in the superior anticancer activity. Based on the above results shown in Figure 2 and Figure 3, it can be summarized that the middle layer of the S-NP was dismantled at pH 6.5, resulting in deshielding of the PEG layer and enhanced release of Ce6. Deshielding of the PEG layer significantly enhanced cellular uptake of Ce6, and thus, more Ce6 was delivered into BxPC-3 cells. Moreover, enhanced release of Ce6 within BxPC-3 cells led to more efficient production of ROS under 660-nm laser irradiation. Thus, superior anticancer activity of S-NP at pH 6.5 under 660-nm laser irradiation was observed.
In Vivo Fluorescence/MR Imaging-Guided Tumor Accumulation of nanoparticles
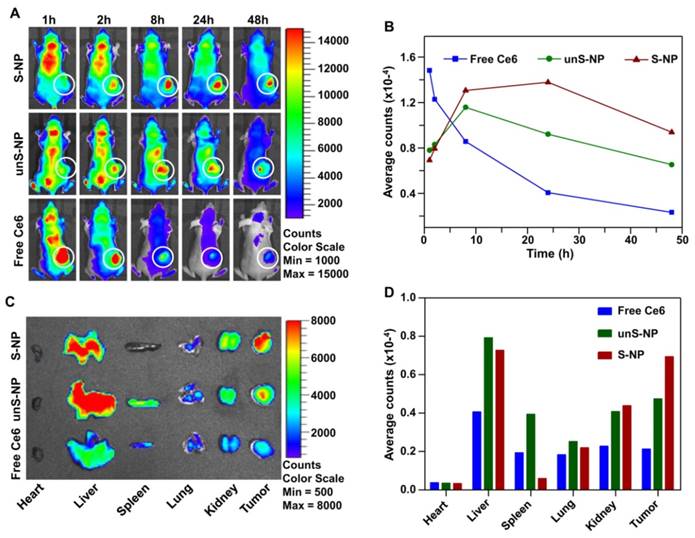
After circulating into tumor tissue, the PEG layer of S-NP could be deshielded by the tumor acidity, which would efficiently enhance cellular internalization of the S-NP by tumor cells and subsequently improve accumulation of the nanoparticles in tumors. To demonstrate this, we utilized the fluorescence signal of Ce6 to evaluate the accumulation of S-NP at the tumor site. The S-NP, unS-NP, and free Ce6 were injected intravenously into mice bearing BxPC-3 tumors, and then the Ce6 fluorescence signal in the tumor site was determined by a Xenogen IVIS® Lumina system. For the free Ce6 group, the strongest fluorescence signals were observed at 1 h post-injection (Figure 5A) and then continuously decreased in the tumor site. Interestingly, mice treated with S-NP or unS-NP showed a time-dependent Ce6 fluorescence intensity in the tumor site for the first 8 h. Subsequently, the Ce6 fluorescence signals of the unS-NP group were gradually reduced, while the signals were almost constant for the S-NP group, even up to 24 h. Quantitative data obtained from region-of-interest (ROI) analysis of the fluorescence images further confirmed this phenomenon (Figure 5B). Additionally, 48 h post-injection, the mice were sacrificed, and the tumor tissue was collected for Xenogen IVIS® Lumina system analysis. As shown in Figure 5C and 5D, the mice treated with S-NP exhibited the strongest Ce6 fluorescence at tumor sites when compared with the mice administered unS-NP or free Ce6.
(A-B). Fluorescence images of BxPC-3 xenograft-bearing mice after intravenous (i.v.) injection of S-NP, unS-NP, and free Ce6 at different times. The tumor sites are denoted by white circles. (B) Quantification of Ce6 fluorescence in the tumor tissue (white circle) as performed in (A) by the total counts. (C) Ex vivo images of major organs, such as heart, liver, spleen, lung, kidney, and tumors excised at 48 h post-injection. (D) Quantification of Ce6 fluorescence in the major organs, as performed in (C) by the average counts.
In addition, in vivo MR imaging was also performed at different time points after injection of S-NP and unS-NP, and free DTPA-Gd was used as a control. As shown in Figure 6A, it was clearly demonstrated that the T1-weighted MR signals gradually emerged in the tumors of mice treated with S-NP, and the strongest MR signals were observed at 24 post-injection when compared with the unS-NP or free DTPA-Gd group. The result of MR imaging was consistent with the fluorescence imaging, demonstrating that the S-NP were capable of increasing accumulation and retention at the tumor tissue.
(A) T1-weighted tumor contrast enhancement after i.v. injection of S-NP, unS-NP, and free DTPA-Gd. (B) Plasma Ce6 concentration vs time after intravenous injection of these formulations. (C) Pharmacokinetic parameters of these formulations after intravenous administration.
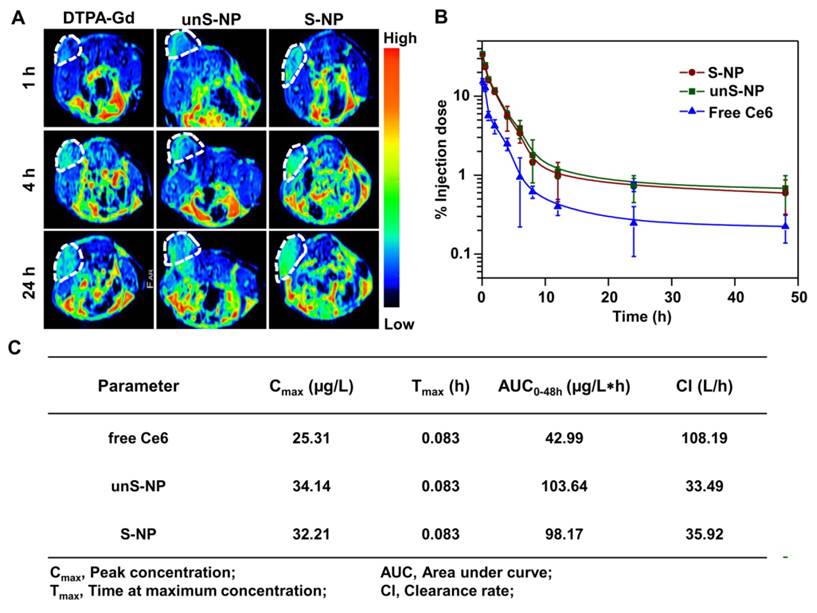
To reveal the reason that S-NP exhibited the highest accumulation and retention of Ce6 at the tumor site, we evaluated the pharmacokinetics of these formulations following intravenous injection and analyzed the Ce6 content in plasma according to our previously reported method [49]. As shown in Figure 6B, the concentrations of Ce6 in plasma of mice that were administered S-NP and unS-NP were very similar at all time points. In addition, the area under the curve (AUC), and total plasma clearance (CLz) showed no significant differences for both nanoparticles (Figure 6C). This could be because the S-NP and unS-NP possessed similar size, shape, zeta potential, and colloid stability in serum. The similar pharmacokinetic properties of S-NP and unS-NP ensured that a comparable amount of Ce6 was circulated into the tumor interstitium. For S-NP, the tumor acidity deshielded the PEG layer, resulting in efficient cellular uptake by BxPC-3 cells. However, the PEG layer of unS-NP hindered internalization at the tumor tissue, and the nanoparticles were gradually eliminated by the lymphatic system. Therefore, the highest Ce6 accumulation in tumor tissue was observed at 24 post-injection of S-NP.
In vivo antitumor efficacy
Encouraged by the efficient detection in tumor tissue by fluorescence/MR imaging and the high tumor accumulation of S-NP, we further evaluated the PDT efficiency of the nanoparticles on BxPC-3 tumor-bearing mice. Under the guidance of fluorescence and MR dual-modal imaging, the whole tumor tissue was precisely irradiated with 660-nm laser light 24 h post-injection, and mice were intravenously injected with S-NP and unS-NP; mice not treated with laser irradiation were used as the control. As illustrated in Figure 7A, treatment with the S-NP and unS-NP without 660-nm laser irradiation did not show tumor growth inhibition in comparison to PBS. Delivery of Ce6 with unS-NP only slightly inhibited tumor growth, while treatment with S-NP and 660-nm laser irradiation at the same dose led to the most significant inhibition of tumor growth, and the volume of the tumor was reduced approximately 30% compared to the original size. Inspection of the tumor weight among all of these formulations also indicated that the S-NP plus 660-nm laser irradiation group showed remarkably improved antitumor efficiency (Figure 7B). It is worth noting that no significant body weight loss was observed for any of the groups (Figure S10) because these formulations did not exhibit noticeable toxicity to mice during the treatment. Moreover, the histological analyses by hematoxylin and eosin (H&E) staining of the main organs after treatment also did not show obvious biological toxicity (Figure S11).
(A) The BxPC-3 tumor growth curves of different groups of mice after the various treatments indicated. (B) Weights of the BxPC-3 tumor masses excised after the last measurement. Data are presented as the mean ± SD, n = 5. (C, D) H&E, TUNEL and PCNA analyses of tumor tissues after treatment. PCNA-positive proliferating cells are stained brown, and the TUNEL-positive apoptotic cells are stained green. **p< 0.01.
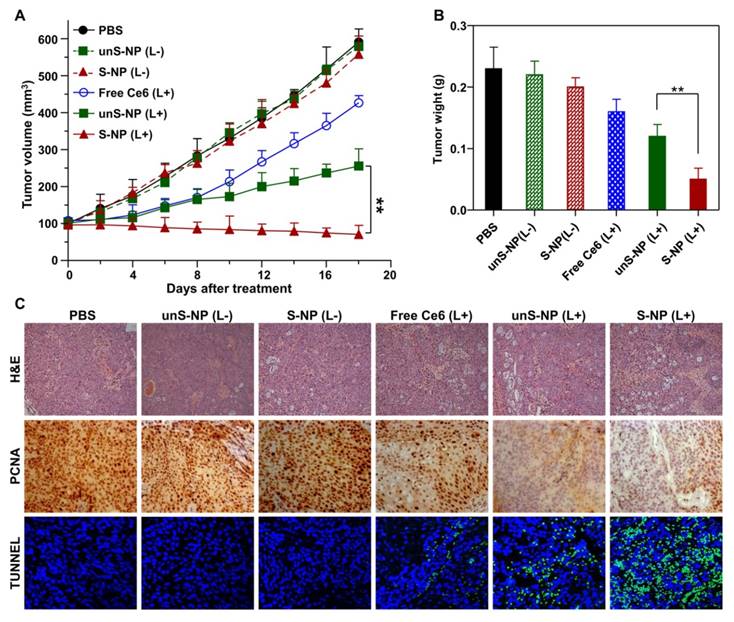
Moreover, cell proliferation and apoptosis in the tumor tissues were analyzed by immunohistochemical staining after the treatment. As shown in Figure 7C, administration of S-NP showed the highest efficacy in reducing the percentage of proliferating PCNA-positive tumor cells and increasing the number of TUNEL-positive tumor cells, confirming that delivery of Ce6 by S-NP could achieve superior anticancer efficacy under 660-nm laser irradiation.
Conclusion
In summary, we developed a three-layer nanostructured particle, S-NP, with tumor acidity-responsiveness for fluorescence/MR dual-model imaging-guided PDT treatment of cancer. The outer PEG layer of the S-NP significantly prolonged circulation time, and the inner PCL core physically encapsulated Ce6. The middle layer of the S-NP, with tumor acidity-responsiveness, acted as a molecular fence to keep Ce6 in the circulation and was dismantled following accumulation at tumor tissue. Then, the PEG shell was deshielded from the S-NP, resulting in improved cellular uptake, enlarged MR signal intensity, and rapid release of Ce6 within tumor cells. Thus, a significantly improved in vivo PDT therapeutic effect was observed using our S-NP, suggesting that nanoparticles with a tumor acidity-responsive PEG layer have potential for in vivo imaging-guided PDT treatment of cancer.
Supplementary Material
Supplementary figures.
Acknowledgements
This work was supported by the National Natural Science Foundation of China (51473043, 21304028, 81422026, and 81571798) and the Fundamental Research Funds for the Central Universities (2014HGCH0014).
Competing Interests
The authors have declared that no competing interest exists.
References
1. Celli JP, Spring BQ, Rizvi I, Evans CL, Samkoe KS, Verma S. et al. Imaging and photodynamic therapy: mechanisms, monitoring, and optimization. Chem Rev. 2010;110:2795-838
2. Lovell JF, Liu TWB, Chen J, Zheng G. Activatable photosensitizers for imaging and therapy. Chem Rev. 2010;110:2839-57
3. Bhaumik J, Mittal AK, Banerjee A, Chisti Y, Banerjee UC. Applications of phototheranostic nanoagents in photodynamic therapy. Nano Res. 2015;8:1373-94
4. Dolmans D, Fukumura D, Jain RK. Photodynamic therapy for cancer. Nat Rev Cancer. 2003;3:380-7
5. Castano AP, Demidova TN, Hamblin MR. Mechanisms in photodynamic therapy: part one-photosensitizers, photochemistry and cellular localization. Photodiagnosis Photodyn Ther. 2004;1:279-93
6. Lim CK, Heo J, Shin S, Jeong K, Seo YH, Jang WD. et al. Nanophotosensitizers toward advanced photodynamic therapy of cancer. Cancer Lett. 2013;334:176-87
7. Agostinis P, Berg K, Cengel KA, Foster TH, Girotti AW, Gollnick SO. et al. Photodynamic therapy of cancer: an update. CA-Cancer J Clin. 2011;61:250-81
8. Huang P, Xu C, Lin J, Wang C, Wang XS, Zhang CL. et al. Folic acid-conjugated graphene oxide loaded with photosensitizers for targeting photodynamic therapy. Theranostics. 2011;1:240-50
9. Brown SB, Brown EA, Walker I. The present and future role of photodynamic therapy in cancer treatment. Lancet Oncol. 2004;5:497-508
10. Wang XB, Hu JM, Wang P, Zhang SL, Liu YC, Xiong WL. et al. Analysis of the in vivo and in vitro effects of photodynamic therapy on breast cancer by using a sensitizer, sinoporphyrin sodium. Theranostics. 2015;5:772-86
11. Bechet D, Couleaud P, Frochot C, Viriot ML, Guillemin F, Barberi-Heyob M. Nanoparticles as vehicles for delivery of photodynamic therapy agents. Trends Biotechnol. 2008;26:612-21
12. Ding F, Li H-J, Wang J-X, Tao W, Zhu Y-H, Yu Y. et al. Chlorin e6-encapsulated polyphosphoester based nanocarriers with viscous flow core for effective treatment of pancreatic cancer. ACS Appl. Mat. Interfaces. 2015;7:18856-65
13. Wang J, Tan X, Pang X, Liu L, Tan F, Li N. MoS2 quantum dot@polyaniline inorganic-organic nanohybrids for in vivo dual-modal imaging guided synergistic photothermal/radiation therapy. ACS Appl Mater Interfaces. 2016;8:24331-8
14. Tan X, Pang X, Lei M, Ma M, Guo F, Wang J, Yu M, Tan F, Li N. An efficient dual-loaded multifunctional nanocarrier for combined photothermal and photodynamic therapy based on copper sulfide and chlorin e6. Int J Pharmaceut. 2016;503:220-8
15. Han K, Lei Q, Wang SB, Hu JJ, Qiu WX, Zhu JY. et al. Dual-stage-light-guided tumor inhibition by mitochondria-targeted photodynamic therapy. Adv Funct Mater. 2015;25:2961-71
16. Han K, Zhang WY, Zhang J, Lei Q, Wang SB, Liu JW. et al. Acidity-triggered tumor-targeted chimeric peptide for enhanced intra-nuclear photodynamic therapy. Adv Funct Mater. 2016;26:4351-61
17. Han K, Wang SB, Lei Q, Zhu JY, Zhang XZ. Ratiometric biosensor for aggregation-induced emission-guided precise photodynamic therapy. ACS Nano. 2015;9:10268-77
18. Spring BQ, Sears RB, Zheng LZ, Mai ZM, Watanabe R, Sherwood ME. et al. A photoactivable multi-inhibitor nanoliposome for tumour control and simultaneous inhibition of treatment escape pathways. Nat Nanotechnol. 2016;11:378 -+
19. Tian JW, Ding L, Xu HJ, Shen Z, Ju HX, Jia L. et al. Cell-specific and pH-activatable rubyrin-loaded nanoparticles for highly selective near-infrared photodynamic therapy against cancer. J Am Chem Soc. 2013;135:18850-8
20. Tian B, Wang C, Zhang S, Feng LZ, Liu Z. Photothermally enhanced photodynamic therapy delivered by nano-graphene oxide. ACS Nano. 2011;5:7000-9
21. Lin TY, Li YP, Liu QQ, Chen JL, Zhang HY, Lac D. et al. Novel theranostic nanoporphyrins for photodynamic diagnosis and trimodal therapy for bladder cancer. Biomaterials. 2016;104:339-51
22. Jang B, Choi Y. Photosensitizer-conjugated gold nanorods for enzyme-activatable fluorescence imaging and photodynamic therapy. Theranostics. 2012;2:190-7
23. Huang P, Lin J, Wang XS, Wang Z, Zhang CL, He M. et al. Light-triggered theranostics based on photosensitizer-conjugated carbon dots for simultaneous enhanced-fluorescence imaging and photodynamic therapy. Adv Mater. 2012;24:5104-10
24. Qian CG, Yu JC, Chen YL, Hu QY, Xiao XZ, Sun WJ. et al. Light-activated hypoxia-responsive nanocarriers for enhanced anticancer therapy. Adv Mater. 2016;28:3313-20
25. Park SY, Baik HJ, Oh YT, Oh KT, Youn YS, Lee ES. A smart polysaccharide/drug conjugate for photodynamic therapy. Angew Chem-Int Edit. 2011;50:1644-7
26. Lai CW, Wang YH, Lai CH, Yang MJ, Chen CY, Chou PT. et al. Iridium-complex-functionalized Fe3O4/SiO2 core/shell nanoparticles: A facile three-in-one system in magnetic resonance imaging, luminescence imaging, and photodynamic therapy. Small. 2008;4:218-24
27. Rong PF, Yang K, Srivastan A, Kiesewetter DO, Yue XY, Wang F. et al. Photosensitizer loaded nano-graphene for multimodality imaging guided tumor photodynamic therapy. Theranostics. 2014;4:229-39
28. Yue CX, Zhang CL, Alfranca G, Yang Y, Jiang XQ, Yang YM. et al. Near-infrared light triggered ROS-activated theranostic platform based on Ce6-CPT-UCNPs for simultaneous fluorescence imaging and chemo-photodynamic combined therapy. Theranostics. 2016;6:456-69
29. Wang C, Cheng L, Liu YM, Wang XJ, Ma XX, Deng ZY. et al. Imaging-guided pH-sensitive photodynamic therapy using charge reversible upconversion nanoparticles under near-infrared light. Adv Funct Mater. 2013;23:3077-86
30. Gong H, Dong ZL, Liu YM, Yin SN, Cheng L, Xi WY. et al. Engineering of multifunctional nano-micelles for combined photothermal and photodynamic therapy under the guidance of multimodal imaging. Adv Funct Mater. 2014;24:6492-502
31. Wang C, Tao HQ, Cheng L, Liu Z. Near-infrared light induced in vivo photodynamic therapy of cancer based on upconversion nanoparticles. Biomaterials. 2011;32:6145-54
32. Ling D, Park W, Park SJ, Lu Y, Kim KS, Hackett MJ. et al. Multifunctional tumor pH-sensitive self-assembled nanoparticles for bimodal imaging and treatment of resistant heterogeneous tumors. J Am Chem Soc. 2014;136:5647-55
33. Li ZW, Wang C, Cheng L, Gong H, Yin SN, Gong QF. et al. PEG-functionalized iron oxide nanoclusters loaded with chlorin e6 for targeted, NIR light induced, photodynamic therapy. Biomaterials. 2013;34:9160-70
34. Wang TT, Wang DG, Yu HJ, Wang MW, Liu JP, Feng B. et al. Intracellularly acid-switchable multifunctional micelles for combinational photo/chemotherapy of the drug-resistant tumor. ACS Nano. 2016;10:3496-508
35. Lin J, Wang SJ, Huang P, Wang Z, Chen SH, Niu G. et al. Photosensitizer-loaded gold vesicles with strong plasmonic coupling effect for imaging-guided photothermal/photodynamic therapy. ACS Nano. 2013;7:5320-9
36. Liu K, Liu XM, Zeng QH, Zhang YL, Tu LP, Liu T. et al. Covalently assembled NIR nanoplatform for simultaneous fluorescence imaging and photodynamic therapy of cancer cells. ACS Nano. 2012;6:4054-62
37. Benachour H, Seve A, Bastogne T, Frochot C, Vanderesse R, Jasniewski J. et al. Multifunctional peptide-conjugated hybrid silica nanoparticles for photodynamic therapy and MRI. Theranostics. 2012;2:889-904
38. Sheng ZH, Hu DH, Zheng MB, Zhao PF, Liu HL, Gao DY. et al. Smart human serum albumin-indocyanine green nanoparticles generated by programmed assembly for dual-modal imaging-guided cancer synergistic phototherapy. ACS Nano. 2014;8:12310-22
39. Yang XZ, Du XJ, Liu Y, Zhu YH, Liu YZ, Li YP. et al. Rational design of polyion complex nanoparticles to overcome cisplatin resistance in cancer therapy. Adv Mater. 2014;26:931-6
40. Du JZ, Du XJ, Mao CQ, Wang J. Tailor-made dual pH-sensitive polymer-doxorubicin nanoparticles for efficient anticancer drug delivery. J Am Chem Soc. 2011;133:17560-3
41. Yang XZ, Du JZ, Dou S, Mao CQ, Long HY, Wang J. Sheddable ternary nanoparticles for tumor acidity-targeted siRNA delivery. ACS Nano. 2012;6:771-81
42. Yoon HY, Koo H, Choi KY, Lee SJ, Kim K, Kwon IC. et al. Tumor-targeting hyaluronic acid nanoparticles for photodynamic imaging and therapy. Biomaterials. 2012;33:3980-9
43. Gong H, Cheng L, Xiang J, Xu H, Feng LZ, Shi XZ. et al. Near-infrared absorbing polymeric nanoparticles as a versatile drug carrier for cancer combination therapy. Adv Funct Mater. 2013;23:6059-67
44. Tian JW, Ding L, Ju HX, Yang YC, Li XL, Shen Z. et al. A multifunctional nanomicelle for real-time targeted imaging and precise near-infrared cancer therapy. Angew Chem-Int Edit. 2014;53:9544-9
45. Zhen ZP, Tang W, Guo CL, Chen HM, Lin X, Liu G. et al. Ferritin nanocages to encapsulate and deliver photosensitizers for efficient photodynamic therapy against cancer. ACS Nano. 2013;7:6988-96
46. Kim S, Tachikawa T, Fujitsuka M, Majima T. Far-red fluorescence probe for monitoring singlet oxygen during photodynamic therapy. J Am Chem Soc. 2014;136:11707-15
47. Spagnuolo G, D'Anto V, Cosentino C, Schmalz G, Schweikl H, Rengo S. Effect of N-acetyl-L-cysteine on ROS production and cell death caused by HEMA in human primary gingival fibroblasts. Biomaterials. 2006;27:1803-9
48. Cossarizza A, Ferraresi R, Troiano L, Roat E, Gibellini L, Bertoncelli L. et al. Simultaneous analysis of reactive oxygen species and reduced glutathione content in living cells by polychromatic flow cytometry. Nat Protoc. 2009;4:1790-7
49. Ding F, Li HJ, Wang JX, Tao W, Zhu Yan-Hua, Yu Y. et al. Chlorin e6-encapsulated polyphosphoester based nanocarriers with viscous flow core for effective treatment of pancreatic cancer. ACS Appl Mater Interfaces. 2015;7:18856-65
Author contact
![]() Corresponding author: Xianzhu Yang, School of Biological and Medical Engineering, Hefei University of Technology, Hefei, Anhui 230009, China; E-mail: yangxzedu.cn
Corresponding author: Xianzhu Yang, School of Biological and Medical Engineering, Hefei University of Technology, Hefei, Anhui 230009, China; E-mail: yangxzedu.cn