Impact Factor
- Issue 14; 2026
- Issue 13; 2026
- Issue 12; 2026
- Issue 11; 2026
- Issue 10; 2026
- Volume 16; 2026
- Advance Articles
- Past Issues
- Cover Images
- Cover Suggestion
- Index & Coverage
- Special Issues
Introduction
Material and methods
Results and Discussion
Conclusion
Supplementary Material
Acknowledgements
References
International Journal of Biological Sciences
International Journal of Medical Sciences
 Global reach, higher impact

Theranostics 2017; 7(5):1245-1256. doi:10.7150/thno.18187 This issue Cite
Research Paper
A Programmed Nanoparticle with Self-Adapting for Accurate Cancer Cell Eradication and Therapeutic Self-Reporting
Yingping Luo1, Liwei Huang1, Ye Yang1, Xianfei Zhuang1, Siyao Hu1, Huangxian Ju2, Bo-Yang Yu1 ![]() , Jiangwei Tian1
, Jiangwei Tian1 ![]()
1. State Key Laboratory of Natural Medicines, Jiangsu Key Laboratory of TCM Evaluation and Translational Research, Department of Complex Prescription of TCM, China Pharmaceutical University, Nanjing 211198, P.R. China
2. State Key Laboratory of Analytical Chemistry for Life Science, School of Chemistry and Chemical Engineering, Nanjing University, Nanjing 210093, P.R. China
Received 2016-11-2; Accepted 2017-1-16; Published 2017-3-6
Abstract

To achieve the best therapeutic efficacy and good prognosis, the drugs necessitate tailored profiles of excellent spatiotemporal control and therapeutic monitoring. Here we introduce a programmed theranostic nanoparticle with self-adapting properties for tumor-specific systemic treatment, including stealthy surface to prolong circulation time in blood, surface charge-reversion for tumor targeting, receptor-mediated internalization to increase intracellular accumulation, “proton sponge effect” for controllable drug release and escape from endo/lysosome. Encouragingly, in the process of drug-induced apoptosis, the therapeutic efficacy can be reported by fluorescence imaging in vivo, in situ and in real time. Therefore, this work provides a new paradigm for design of programmed theranositc nanomedicine and offers promising prospects for precise tumor treatment.
Keywords: cancer, programmed nanoparticle, drug release, self-adapting, therapeutic self-reporting
Introduction
State-of-the-art theranostic nanomedicine is a promising strategy for accomplishment of precise cancer treatment [1, 2]. An ideal theranostic nanomedicine must present multiple excellent properties including stability in blood after intravenous injection and being stealthy to prevent clearance by reticuloendothelial system [3], effective accumulation in tumor tissue and cellular internalization, controllable drug release, and rapid endo/lysosomal escape to avoid drug degradation by highly acidic environment or rich enzymes of lysosome [4, 5]. Moreover, the drug-induced tumor cell death should be self-reported in real-time, which contributes to the convenient adjustment of dosage regimen for avoiding undesirable under- and over-treatment [6]. Finally, the components of nanocarriers should be biocompatible and biodegradable to mitigate undesirable side effects. Only when a nanosystem efficiently and sequentially integrates all of the aforementioned functionalities into a single system, can it achieve the best therapeutic efficiency and good prognosis. These concerns encourage us to develop a programmed theranostic nanomedicine.
Spurred by the recent progress in field of nanomedicine, various stimuli-responsive nanoplatforms [7] based on magnetic nanoparticles [8], quantum dots [9], gold vesicles [10], upconversion nanoparticles [11] and graphene oxide nanosheets [12] have shown encouraging treatment prospects for drug delivery in controlled and visualized fashions. However, the inorganic or metallic nature of the most nanomaterials raises great biosafety concern owing to the potential toxicity to normal cells. To solve this problem, polymer-based materials [13] such as lipids [14], block copolymers [15] and polypeptides [16] with good biocompatibility are desired, because they are typically nontoxic and degraded naturally into safe materials in the body over the time. So many stimuli-responsive and polymer-based nanoplatforms have been constructed for tumor imaging, targeted delivery and controllable release of drug [17-22]. In addition, the therapeutic self-monitoring could be achieved simultaneously to further enhance the anticancer efficacy [23-25]. Given the critical roles of caspase-3 in cell-death process, various caspase-3 activatable imaging reagents [26], including 19F magnetic resonance imaging probe [27], positron emission tomography tracer [28], quantum dot sensor [29] and fluorescence probe [30], have been developed for reporting the apoptotic information. These approaches offer good opportunity to easily investigate treatment-to-effect correlations. However, none of these previously reported nanoplatforms possesses all of the necessary attributes in one system, having driven the further design of novel programmed theranostic nanosystems to eradicate malignant tumor.
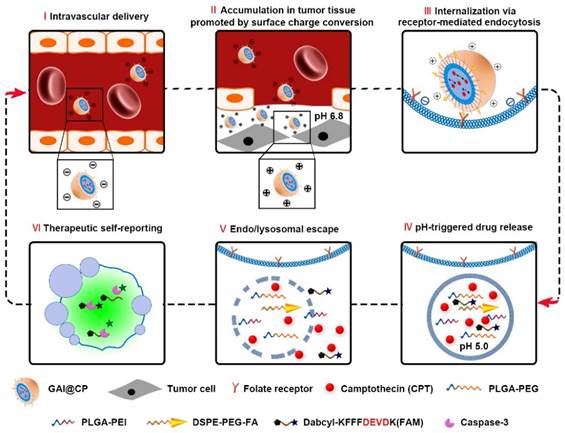
This work reports a programmed theranostic nanoparticle (GAI@CP, Scheme 1) to integrate all of the necessary attributes by using a newly designed nanoassembly composed of poly [lactic-co-glycolic acid-b-(ethylene glycol)-2000] (PLGA-PEG), 1, 2-distearoyl-sn-glycero-3-phosphoethanolamine-N-[folate (poly ethylene glycol)-2000] (DSPE-PEG-FA) and poly (lactic-co-glycolic acid-b-ethyleneimine-600) (PLGA-PEI) to encapsulate camptothecin (CPT) as an anticancer drug and a caspase-3 activatable fluorescent peptide (Dabcyl-KFFFDEVDK-FAM, FRET-Pep). The fluorescence of Dabcyl-KFFFDEVDK-FAM is turn-off due to the fluorescence resonance energy transfer (FRET) effect and can be turn-on upon reaction with caspase-3, an important downstream protease in apoptosis [31]. The hydrophobic block PLGA composes the inner core of GAI@CP and encapsulates CPT and FRET-Pep. Owing to the presence of PEG and FA, GAI@CP is stable in the blood and negatively charged. Once accumulated in the tumor tissue by passive targeting, the surface charge of GAI@CP is translated to be positive due to the protonation of PEI in the acidic microenvironment of tumor tissue (pH 6.8), which enhances the interaction between the cytomembrane and GAI@CP. By virtue of FA, GAI@CP can further bind to folate receptor (FR)-overexpressed tumor cells and be uptaken via active targeting into the endo/lysosome (pH 5.0). Then, the PEI with rich amines in GAI@CP is capable of sequestering protons, resulting in the rupture of GAI@CP and succedent CPT and FRET-Pep release. Meanwhile, the endo/lysosomal membrane become permeable due to the “proton sponge effect” of PEI [32], which leads to the escape of CPT and FRET-Pep from endo/lysosome into cytoplasm. In the CPT-induced apoptotic process, the FRET-Pep is specifically cleaved by active caspase-3 to generate bright fluorescence of FAM for high-contrast apoptotic imaging. Therefore, the GAI@CP synchronously achieves accurate tumor cell eradication and therapeutic self-reporting.
Schematic illustration of programed GAI@CP for accurate tumor cell eradication and therapeutic self-reporting.
Material and methods
Materials and reagents
CPT was purchased from TCI Tokyo Chemical Industry Co., Ltd. (TCI, Japan). PLGA-PEI and PLGA-PEG were purchased from Jinan Daigang Biomaterial Co., Ltd. (Shandong, China). DSPE-PEG-FA was obtained from Avanti (Alabaster, AL, USA). LysoTracker® Green, hoechst 33342, acridine orange (AO) and propidium iodide (PI) were obtained from Invitrogen (Carlsbad, CA, USA). MTT Cell Proliferation and Cytotoxicity Assay Kit and Annexin V-FITC/propidium iodide (PI) Cell Apoptosis Kit were obtained from KeyGen Biotech. Co., Ltd. (Nanjing, China). Human caspase-3 recombinant protein (active form, 25 units) was purchased from Millipore (Billerica, MA, USA). Caspase-3 inhibitor Z-DEVD-FMK was purchased from BioVision (San Francisco, USA). Dabcyl-KFFFDEVDK-FAM (FRET-Pep) was synthesized by Shanghai Ziyubio Co., Ltd. (Shanghai, China). Ethylenediaminetetra-acetic acid (EDTA), 3-[(3-cholamidopropyl)-dimethylammonio]-1-propanesulfonic acid (CHAPS), glycerol (99%), dithiothreitol (DTT) and N-2-hydroxyethylpiperazine-N'-2-ethanesulfonic acid (HEPES) were acquired from Sigma-Aldrich (St. Louis, MO, USA). Cyanine7 (Cy7) was obtained from Okeanos Tech Co., Ltd. Double distilled water was prepared using a Millipore Simplicity System (Millipore, Bedford, USA).
Characterization
Absorption spectra were recorded on an UV-2550 UV-VIS spectrophotometer (Shimadzu Company, Japan). Fluorescence spectra were measured on an F-7000 spectrofluorometer (Hitachi, Japan). The size of GAI@CP was obtained by dynamic light scattering (DLS) at 25 °C by means of a 90 Plus/BI-MAS equipment (Brookhaven, USA). The morphology of the GAI@CP was characterized at a JEOL JEM-200CX transmission electron micro-scope (TEM) operated at 200 kV. Zeta potential measurement was performed at 25 °C on a Zetasizer (Nano-Z, Malvern, UK). MTT assay was performed using microplate reader (Biotek, USA). Confocal fluorescence imaging of cells was performed on a confocal laser scanning microscope (CLSM, LSM700, Zeiss, Germany). Flow cytometric assay was performed using MACSQuant Analyzer 10 (Miltenyi Biotec, Germany).
Synthesis of GAI@CP
GAI@CP nanoparticles were prepared via self-assembly of PLGA-PEI, PLGA-PEG, DSPE-PEG-FA, CPT and FRET-Pep, using a single-step sonication method with some modifications [33]. Briefly, 1.6 mg CPT, 0.2 mg FRET-Pep, 4 mg PLGA-PEI and 5 mg PLGA-PEG were dissolved in 2 mL DMSO. The mixture was added dropwise into 8 mL double distilled water containing 1 mg DSPE-PEG-FA under sonication using an ultrasonics processor (KQ-300E, China) for 5 min. Afterward, the solution was kept stirring for 4 h with protection from light at room temperature. The product was purified by repeated ultrafiltration (Mn= 30 kDa, Millpore) at 4000 g for 30 min and rinsing with double distilled water to remove unencapsulated CPT and FRET-Pep. The final product, GAI@CP, was dispersed in double distilled water and stored in refrigerator at 4 °C. Similar procedures were used to prepare the GI@CP (without FA), GA@CP (without PEI) and GAI@P (without CPT). GAI@CP/Cy7, GA@CP/Cy7 and GI@CP/Cy7 were prepared by co-encapsulating Cy7 into the nanoparticles.
Release of CPT from GAI@CP
The drug release profile of GAI@CP was studied by monitoring the CPT concentration in dialysis chambers. Briefly, GAI@CP was placed into a 30 kDa dialysis chambers, which were dialyzed in 50 mL of pH 5.0 (the endosomal pH of tumor cell), 6.8 (the pH of tumor tissue) and 7.4 (the physiological pH) citrate buffer containing 10% fetal bovine serum (FBS), stirring inside an incubator shaker at 37 °C respectively. The drug release was assumed to start as soon as dialysis chambers were placed into the reservoirs. The release reservoirs were kept under constant stirring, and at various time points, 300 μL of the solution in the release reservoirs was taken out for characterization and the entire release medium was replaced with fresh medium. The concentration of CPT releases from GAI@CP was measured by UV-VIS spectrophotometer at 371 nm using a calibration curve prepared under the same condition. The drug loading content (LC) and encapsulation efficiency (EE) were then assessed as follows [34]: LC (%) = (weight of loaded drug/ weight of drug-loaded nanoparticles) × 100. EE (%) = (mass of loaded drug/mass of feed drug) × 100.
Fluorescence response and selectivity of GAI@CP to caspase-3
For caspase-3 detection, the FRET-Pep was dissolved in a minimal volume of DMSO. 50 μL FRET-Pep solution was incubated with human caspase-3 recombinant protein (final concentrations: 0, 0.5, 1.0, 1.5, 2.5, 4.0, 6.0 U mL-1) in 450 μL assay buffer (pH 7.4, 50 mM HEPES, 10 mM DTT, 100 mM NaCl, 1 mM EDTA, 0.1% w/v CHAPS, 10% v/v glycerol) for different time at 37 °C. In the first control experiment, the FRET-Pep solution was incubated without 4.0 U mL-1 caspase-3. In another control experiment, 80 μM caspase-3 inhibitor Z-DEVD-FMK was pre-added into FRET-Pep solution. To evaluate the therapeutic self-reporting effect of GAI@CP, 1 mL GAI@CP in pH 7.4 or 5.0 citrate buffer were stiring in the dark for 8 h. Then the solution was centrifuged by filtration (30 kDa, 4000 g, 30 min). 200 μL filtrate were added into 300 μL reaction buffer containing caspase-3 (final concentration was 4.0 U mL-1) and incubated at 37 °C. After 1 h, the resulting solution was subjected to fluorescence measurements. The excitation wavelength was 450 nm and the emission wavelengths were in the range from 460 to 650 nm with both excitation and emission slits of 5 nm.
Cell culture
Human cervical carcinoma HeLa cell line, human lung carcinoma A549 cell line and human umbilical vein endothelial HUVEC cell line were obtained from KeyGEN Biotech Co. Ltd. (Nanjing, China). All cell lines were cultured in Dulbecco's modified Eagle's medium (DMEM) containing 10% FBS, 100 μg mL-1 streptomycin and 100 U mL-1 penicillin at 37 °C in a humidified incubator containing 5% CO2 and 95% air. The medium was replenished every other day and the cells were subcultured after reaching confluence. Cell numbers were determined with a Petroff-Hausser cell counter (USA).
Cytotoxicity assay
The cytotoxicity assay, based on the standard methyl thiazolyl tetrazolium (MTT) assay, was carried out on HeLa cell lines. Briefly, HeLa cells were first seeded to 96-well plates at a seeding density of 5 × 10³ cells per well in 100 μL complete medium, which was incubated at 37 °C for 24 h. After rinsing with PBS, HeLa cells were incubated with 200 μL culture media containing serial concentrations of GAI@CP for 24 h. Then, 20 μL of 5 mg mL-1 MTT solution in pH 7.4 PBS was added to each well. After 4-h incubation, the medium containing unreacted MTT was removed carefully, and 150 μL DMSO was added to each well to dissolve the produced blue formazan. After shaking for 10 min, the optical density (OD) at a wavelength of 550 nm was measured with microplate reader (Biotek, USA). The cell viability was then calculated as follows: Cell viability (%) = ((OD value of treatment group - OD value of blank group)/ (OD value of control group - OD value of blank group)) × 100.
In vitro targetable effect assay
To investigate the targetable effect of GAI@CP, the in vitro antitumor activity assay was based on the MTT assay in HeLa cell lines, A549 cell lines and HUVEC cell lines. Both the HeLa cells and A549 cells were seeded into 96-well plates at a seeding density of 5 × 10³ cells per well while the seeding density of HUVEC cells was 1 × 10⁴. Cells were incubated with 200 μL culture media containing GAI@CP (3.0 µM CPT equiv.) for 24 h, and experimental procedure were the same as mentioned in Cytotoxicity Assay.
Western blot analysis
The cells were lysed with RIPA lysis buffer after washing with the ice-cold PBS. Then the whole cell lysates were centrifuged at 12,000 rpm for 10 minutes at 4 °C, and protein concentrations were analyzed by the BCA method (Beyo-time Institute of Biotechnology, Shanghai, China). Equal amounts of proteins (35 µg) were loaded onto a 12.5% SDS-PAGE and transferred to PVDF membranes (Millipore Corporation) by electroblotting. The membranes were blocked with 3% BSA in TBS/T and stained with primary antibodies against caspase-3 (Cell Signaling Technology) and β-actin (Bio-world Technology) with dilution of 1:1000 overnight at 4 °C. Membranes were then probed with peroxidase-conjugated secondary antibody at a 1: 8000 dilution (Bio-world Technology). The antigen-antibody complexes were then detected with ECL reagent, visualized by ChemiDocTM MP System (Bio-Rad), and analyzed using Image LabTM Software (version 4.1; Bio-Rad).
Confocal fluorescence imaging assays
To explore the cellular uptake of nanoparticles, GAI@CP/Cy7 were used for cellular uptake experiment by confocal fluorescence imaging. HeLa cells were seeded into 35-mm confocal dishes (Glass Bottom Dish) at a density of 1 × 10⁴ per dish and incubated for 24 h at 37 °C. The medium was then replaced with fresh serum-free culture medium containing GAI@CP/Cy7 (3.0 µM CPT equiv.) and incubated at 37 °C for different times. Before imaging, the cells were washed with PBS and further incubated with 1.0 μM LysoTracker® Green and 1.0 μM Hoechst 33342 for 15 min. The fluorescence of cells was visualized with a CLSM at stationary parameters including the laser intensity, exposure time and objective lens. Cy7 was excited with a 633 nm helium-neon laser and emission was collected from 650 to 700 nm. LysoTracker® Green was excited at 488 nm with an argon ion laser and the emission was collected from 505 to 535 nm. Hoechst 33342 was excited with a violet 405 nm laser diode and the emission was collected from 420 to 480 nm.
For therapeutic self-reporting assay of the nanoparticles, HeLa cells were incubated with GAI@CP (3.0 µM CPT equiv.) for various times, then washed with PBS and further stained with 1.0 μM PI for 15 min. PI was excited at 532 nm with a helium-neon laser and the emission was collected from 580 to 620 nm. FRET-Pep was excited at 488 nm with an argon ion laser and the emission was collected from 505 to 535 nm. CPT was excited with a violet 405 nm laser diode and the emission was collected from 420 to 480 nm.
For other control experiments and imaging specificity assays, HeLa cells were randomly divided into six groups for the following treatments: group 1, incubation with PBS; group 2, FA block; group 3, incubation with GI@CP; group 4, incubation with GAI@C; group 5, incubation with GAI@P; group 6, incubation with CPT. The concentration of nanoparticles or drug was 3.0 µM CPT equiv. After 24-h incubation, the cells were washed with PBS and further incubated with 1.0 μM PI for 15 min. Confocal fluorescence imaging was performed to visualize the intracellular FRET-Pep, PI or CPT fluorescence.
Flow cytometric assay
For flow cytometric assay, Hela cells were seeded into 6-well plates with a density of 1 × 10⁵ cells per well and incubated in complete medium for 24 h at 37 °C. Then, HeLa cells were administrated with different nanoparticle at an equivalent CPT dosage of 3 µM. The different treatment groups of HeLa cells were trypsinized, harvested, rinsed with PBS and resuspended, and subjected to flow cytometric assay using MACSQuant Analyzer 10. All experiments detected at least 10,000 cells and the data were analyzed with FCS Express V3.
Animals and tumor model
Specific pathogen-free female BALB/c nude mice, 5-6 weeks of age, were purchased from Shanghai Laboratory Animal Center, Chinese Academy of Sciences (SLACCAS) and bred in an axenic environment. All animal operations were in accord with institutional animal use and care regulations approved by the Model Animal Research Center of China Pharmaceutical University. HeLa tumor model was established by subcutaneous injection of HeLa cells (1 × 10⁶) into the selected positions of the nude mice. During treatment, mice were anesthetized with 2.5% isoflurane in oxygen delivered at a flow rate of 1.5 L min-1. Tumors were then allowed to grow to 4-5 mm in diameter.
Pharmacokinetic study
In order to measure the CPT levels in plasma, we administered Wister rats with GAI@CP and CPT at a dose of 5 mg CPT per kg body weight (three mice per group) into tail vein at a volume of 200 μL (PBS). At designated times (0.5, 1, 2, 4, 8, 12 and 24 h) after the intravenous injection, the blood samples were collected into blood collection tubes immediately. After centrifugation of blood samples at 3000 g at 4 °C for 10 min, 300 μL aliquot of plasma was taken and exposed to 300 μL mixture of 200 μL methyl alcohol and 1% acetic acid. After centrifugation at 12000 g for 10 min, the supernatant was subjected to fluorescence analysis.
In vivo fluorescence imaging
In order to monitor the distribution and targeting in vivo, we administered BALB/c nude mice bearing HeLa tumor with GAI@CP/Cy7, GA@CP/Cy7 and GI@CP/Cy7 at a dose of 2.5 mg CPT per kg body weight into tail vein at a volume of 100 μL (PBS). Then, the mice were anesthetized by isoflurane for fluorescence imaging at the monitoring times (4, 8, 16, 24 and 48 h). Fluorescence signals were detected by in vivo fluorescence imaging system with excitation at 640 nm and emission at 710 nm. In an attempt to evaluate the tissue distributions of GAI@CP/Cy7, the mice were sacrificed at 48 h post-injection. Major organs including heart, liver, spleen, lung, kidney, stomach, intestine and muscle and tumor were excised, followed by washing the surface with physiological saline several times for ex vivo imaging and semiquantitative analyses.
In vivo study of antitumor efficacy
For investigating the antitumor effect in vivo, HeLa tumor-bearing mice were subjected to six different treatments: group 1, intravenous injection of PBS; group 2, intravenous injection of GAI@P; group 3, intravenous injection of GAI@CP; group 4, intravenous injection of GI@CP; group 5, intravenous injection of GA@CP; group 6, intravenous injection of CPT. Each formulation was administrated into the tail vein at a volume of 100 μL at a dose of 2.5 mg CPT per kg body weight every 3 days for 15 days. The tumor sizes were measured by a vernier caliper before each injection. The tumor volume was calculated using length × width2 × 0.5, and the relative tumor volumes were calculated using (V-V0 )/V0 (V0 was the initiated tumor volume before treatment and V was the tumor volume of each treatment). The relative body weight were calculated using (W-W0)/ W0 (W0 was the initiated mouse body weight before treatment and W was the body weight of each treatment).
For histological analysis, the mice were sacrificed after complete treatment of 15 days. Tumors and the major organs (heart, liver, spleen, lung, kidney, stomach, large intestine and muscle) were dissected from the mice and fixed in 4% (v/v) formalin saline overnight. The tissues were embedded in paraffin and cut at 5 μm thickness. The tumor sections were stained with hoechst and the organs sections were stained with hematoxylin and eosin (H&E) for histopathological evaluation.
In vivo therapeutic self-reporting
For therapeutic self-monitoring, HeLa tumor-bearing mice were intravenously injected with GAI@CP, GA@CP or GI@CP (2.5 mg kg-1 CPT equiv.). The therapeutic self-evaluation was performed in vivo by observing the fluorescence change at different time points (8, 16, 24 and 48 h) with Living Imaging System (excitation, 488 nm; emission, 505-535 nm).
Results and Discussion
Characterization and properties of GAI@CP
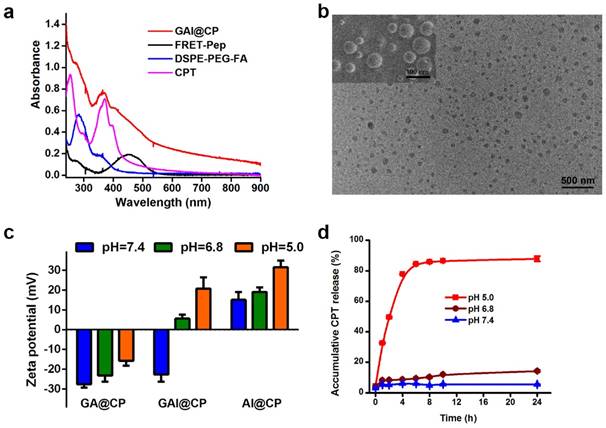
The self-assembly of nanoparticle with PLGA-PEG, DSPE-PEG-FA and PLGA-PEI was fine-tuned in terms of the zeta potential, size, polydispersity index (PDI), LC and EE (Table S1). The optimum nanoassembly was obtained at a PLGA-PEG: DSPE-PEG-FA: PLGA-PEI weight ratio of 5:1:4 with a zeta potential of -22.59 ± 3.69 mV and hydrodynamic diameter of 73.82 ± 4.94 nm. At this condition, the LC and EE of nanoparticle was 13.49 ± 0.01% and 97.43 ± 0.07%, respectively, which was calculated via absorbance standard curve of CPT (Figure S1). The absorption spectrum of GAI@CP showed the characteristic peaks of FRET-Pep at 460 nm, CPT at 371 nm and DSPE-PEG-FA at 280 nm (Figure 1a). The GAI@CP also showed a characteristic fluorescence emission peak of CPT at 450 nm (Figure S2), and a 15-nm redshift compared with free CPT was observed which could be attributed to the confinement of CPT in GAI@CP [35]. The transmission electron microscopy (TEM) and the scanning electron microscope (SEM) images demonstrated that GAI@CP was spherical morphology and well dispersed (Figure 1b). In addition, the PDI of GAI@CP was smaller than 0.05 (Table S1), further displaying the highly monodisperse property of GAI@CP. Among the three nanoparticles including GA@CP (without PEI), GAI@CP and AI@CP (without PEG), GAI@CP exhibited a surface charge reversion from -22.59 ± 3.69 mV at pH 7.4 to +5.56 ± 2.01 mV at pH 6.8, and further increased to be +20.66 ± 5.75 mV at pH 5.0 (Figure 1c). The surface charge reversion could be attributed to the protonation of imine rich PEI under acidic condition. On the contrary, no surface charge reversion was observed for GA@CP with -27.55 ± 1.75 mV at pH 7.4 and -15.72 ± 2.50 mV at pH 5.0, and for AI@CP with +15.04 ± 3.90 mV at pH 7.4 and +31.42 ± 3.41 mV at pH 5.0. The results suggested that both PEI and PEG played important roles in the surface charge reversion upon pH decrease. Moreover, GAI@CP and GA@CP maintained size stability in the presence of 10% fetal bovine serum (FBS) at pH 7.4 (Figure S3) due to the protein-resistance characteristic of PEG [36], while the size of AI@CP increased rapidly owing to the electrostatic adhesion between positively charged AI@CP and negatively charged proteins. The CPT release from GAI@CP was investigated at different pH values. The accumulative release rate was slow with only 14.26% at pH 6.8 and 5.28% at pH 7.4 after 24-h incubation (Figure 1d). However, when the pH decreased to be 5.0, the accumulative release percentage of CPT reached to be 85.78% after 8-h incubation, indicating pH-responsive CPT release of GAI@CP. At pH 5.0, about 80% CPT was released from AI@CP after incubation for 6 h while the release rate of GA@CP was about 56% even incubated for 24 h (Figure S4). Less than 10% of CPT was released from AI@CP and GA@CP at pH 7.4 after incubation for 24 h. All these results demonstrated the critical role of PEI in the pH-controllable CPT release of GAI@CP.
Characterization and property of GAI@CP. (a) UV-VIS absorption spectra of GAI@CP, FRET-Pep, DSPE-PEG-FA and CPT. (b) TEM and SEM (inset) images of GAI@CP. (c) Zeta potentials of GA@CP, GAI@CP and AI@CP at different pH values. (d) Accumulative release of CPT from GAI@CP at pH 7.4, 6.8 and 5.0 in citrate buffer containing 10% FBS, respectively.
Fluorescence response to caspase-3
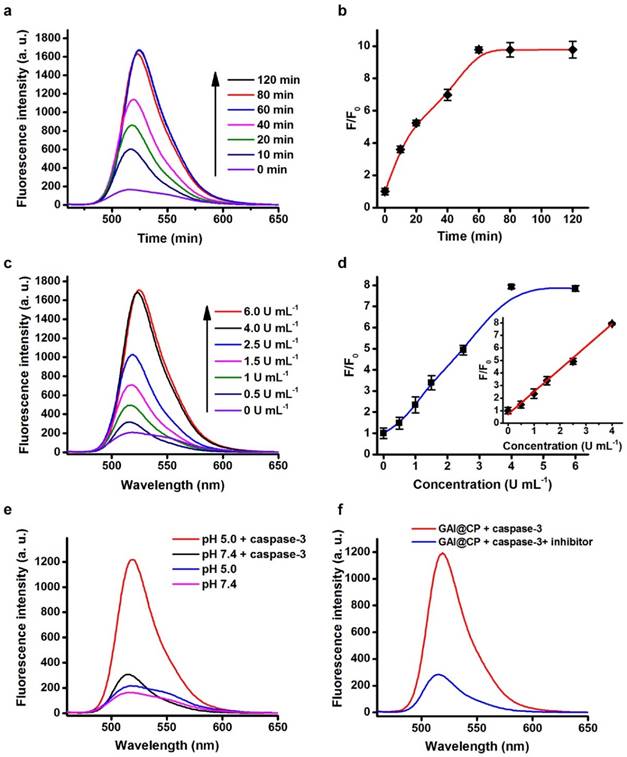
Fluorescence assays were performed to test the validity of FRET-Pep for the response to caspase-3 activity. Upon addition of caspase-3 to the FRET-Pep solution, the fluorescence of FRET-Pep recovered gradually under 488 nm excitation (Figure 2a) and the emission intensity at 520 nm reached a plateau at 60 min (Figure 2b). The fluorescence intensity at 520 nm enhanced linearly over the caspase-3 concentration range from 0.5 to 4.0 U mL-1 (Figure 2c) with the linear correlation coefficient of 0.998 (Figure 2d). After FRET-Pep was encapsulated in the nanoparticle, the fluorescence of FRET-Pep did not recovery in the presence of caspase-3 at pH 7.4 (Figure 2e), suggesting that the nanoparticle as a barrier hindered the reaction between FRET-Pep and caspase-3. However, when the pH was adjusted to be 5.0, significant fluorescence recovery of FRET-Pep was detected in the presence of caspase-3 due to the disassembly of GAI@CP induced by acidic environment. Furthermore, no obvious fluorescent alteration was obtained after adding inhibitor-inactivated caspase-3 at pH 5.0 (Figure 2f), which confirmed the specific fluorescence response of GAI@CP to caspase-3.
Fluorescence response to caspase-3. (a) Fluorescence emission spectra of FRET-Pep incubated with 4.0 U mL-1 caspase-3 for 0, 10, 20, 40, 60, 80 and 120 min. (b) Plots of fluorescence intensity at 520 nm vs. incubation time of FRET-Pep with 4.0 U mL-1 caspase-3. (c) Fluorescence emission spectra of FRET-Pep after incubation with 0, 0.5, 1.5, 2.5, 4.0 and 6.0 U mL-1 caspase-3 for 60 min. (d) Plot of fluorescence intensity at 520 nm vs. caspase-3 concentration. Fluorescence emission spectral response of GAI@CP to 4.0 U mL-1 caspase-3 (e) at pH 5.0/7.4 and (f) in the absence or presence of 80 μM Z-DEVD-FMK as caspase-3 inhibitor at pH 5.0 after incubation for 24 h.
In vitro cytotoxicity evaluation.
Both free CPT and GAI@CP proved to be effective in killing human cervical carcinoma HeLa cells with 50% growth inhibition concentration (IC50) of 5.0 and 1.2 μM (CPT equiv.), respectively (Figure S5). The cell viability of GAI@P (without CPT) remained 91.80 ± 3.68% (Figure S6) indicated that nanocarrier had minimal toxicity and enjoyed superior biocompatibility toward cultured cells. The GAI@CP treated group of HeLa cells exhibited much higher cytotoxicity than GI@CP (without FA) group and FA block group (adding 10 μM FA for 30 min before incubation with GAI@CP) (Figure 3a), which suggested that FA played an essential role for GAI@CP in active targeting and killing FR high-expressed tumor cells. This result was further validated by incubating HeLa cells, human lung carcinoma A549 cells and human umbilical vein endothelial HUVEC cells with GAI@CP. Because of the low- or no-expression of FR on membrane of A549 cells [37] or HUVEC cells [38], the cell viability of these two groups were 52.55% and 99.47%, respectively, while GAI@CP group killed 63.15% of HeLa cells in the same condition (Figure 3b), indicating the therapeutic selectivity of GAI@CP to FR high-expressed tumor cells.
In vitro targeted drug delivery, rapid endo/lysosomal escape and therapeutic self-reporting. (a) MTT assays for HeLa cells incubated with GAI@CP and GI@CP for 24 h, and FA block group was pre-blocked by FA for 30 min and then incubated with GAI@CP for 24 h. (b) MTT assays for HeLa, A549 and HUVEC cells incubated with GAI@CP for 24 h. (c) Confocal fluorescence images of AO staining to study lysosomal disruption of HeLa cells treated with PBS as control, GA@CP and GAI@CP, respectively. Scale bars: 10 μm. (d) MTT assays for HeLa cells incubated with CPT, GA@CP and GAI@CP for different times as indicated. Data are means ± SD (n ≥ 3, *P < 0.05, **P < 0.01 using a one-way ANOVA). (e) Confocal fluorescence images of HeLa cells stained with PI after incubated with GAI@CP and GAI@C for 24 h. Scale bars: 10 μm. (f) Flow cytometric assays of HeLa cells treated with GAI@CP, GA@CP, GI@CP and GAI@P for 24 h, respectively.
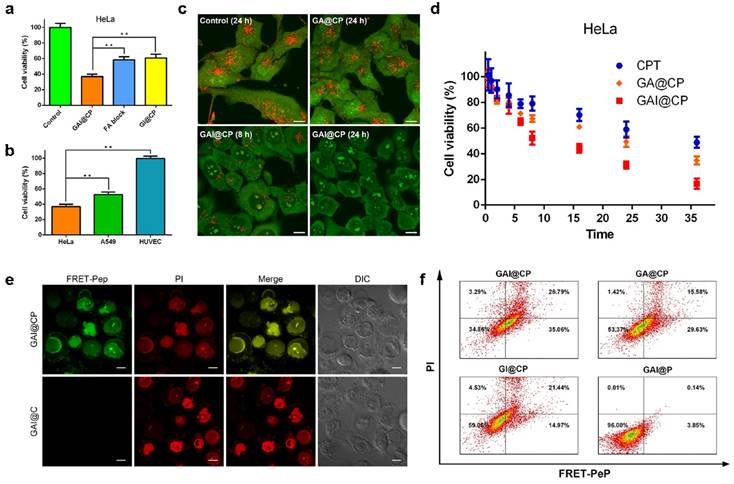
In absence of PEI, the cell viability of GA@CP treated HeLa cells was much higher than that of GAI@CP (Figure S6), which could be explained that the “proton sponge effect” of PEI promoted the drug escape from endo/lysosome and accelerate tumor cell apoptosis. To verify this hypothesis, HeLa cells were incubated with a near-infrared Cyanine7 (Cy7) labeled GAI@CP (GAI@CP/Cy7) for different time and carried out with confocal fluorescence imaging. The red Cy7 fluorescence was appeared in lysosome after incubation for 2 h (Figure S7). Lysosomal disruption could be observed after 8-h incubation and Cy7 fluorescence diffused to cytoplasm and then the whole cell after 24-h incubation. In addition, AO was used as an indicator to investigate the lysosomal integrity [39]. HeLa cells incubated with GA@CP for 24 h displayed bright red fluorescence which was similar with the untreated control group (Figure 3c), indicating a good lysosomal integrity. However, the red fluorescence of AO was remarkably decreased for the cells incubated with GAI@CP for 8 h, and almost disappeared for 24 h, manifesting that the presence of PEI in GAI@CP led to lysosomal breakdown.
To study whether this function of endo/lysosomal escape would accelerate tumor cell apoptosis, HeLa cells were incubated with CPT, GA@CP and GAI@CP (3.0 μM CPT equiv.) for different times. The incubation time of the cell viability decreased to be 50% for CPT, GA@CP and GAI@CP was approximately 36, 24 and 8 h (Figure 3d), respectively, suggesting that endo/lysosomal escape of CPT induced by PEI accelerated tumor cell apoptosis.
In vitro therapeutic self-reporting
The western blot study revealed that the expression of activated caspase-3 was noticeably increased for the GAI@CP treated HeLa cells (Figure S8), confirming that the activated caspase-3 could be used as the marker for therapeutic self-reporting. HeLa cells were incubated with GAI@CP and then co-stained with propidium iodide (PI), a commercial membrane-impermeable dye for indicating late stage apoptosis [40]. After incubation for 2 h, blue CPT fluorescence was obtained in nucleus (Figure S9). The green FRET-Pep fluorescence appeared after incubation for 6 h, suggesting the activation of caspase-3. At this time point, PI fluorescence was negligible which indicated that the cells were in the stage of early apoptosis. After 24-h incubation, the apoptotic fluorescence of both FRET-Pep and PI was obvious and merged well, demonstrating the capability of therapeutic self-reporting by GAI@CP. On the contrary, although the morphology of the treated cells was not intact observed from differential interference contrast (DIC) image and the PI fluorescence was bright, no green fluorescence of FRET-Pep was detected in the GAI@C group in absence of FRET-Pep (Figure 3e), which certified the necessary of FRET-Pep for self-assessment of therapeutic efficacy. For the GI@CP or FA block group, the apoptotic fluorescence of FRET-Pep and PI was much weaker than that of GAI@CP group (Figure S10a). In addition, the GAI@CP treated A549 or HUVEC cells did not show distinct apoptotic fluorescence (Figure S10b) due to the low or no expression of FR. The absence of PEI (GA@CP) also led to weak apoptotic fluorescence (Figure S11). These results confirmed the capability of GAI@CP for therapeutic self-reporting and the important roles of FA and PEI for cancer therapy.
Flow cytometry was further employed to examine the function of therapeutic self-reporting using the dual fluorescence of FRET-Pep/PI. The cell populations at different phases of cell death could be defined as viable (FRET-Pep-/PI-), early apoptotic (FRET-Pep+/PI-), late-stage apoptotic (FRET-Pep+/PI+) and necrotic (FRET-Pep-/PI+) cells. Compared to the GAI@CP group with a cell mortality of 65.14%, the cell mortality of GA@CP group and GI@CP group was 46.63% and 40.94%, respectively (Figure 3f). The lower cell mortality was owing to the lack of PEI-induced endo/lysosomal escape or FA targeting. The ignorable cell mortality of 4% verified the nontoxicity and good biocompatibility of GAI@P nanocarrier. Moreover, in the absence of FRET-Pep, the GAI@C, GA@C, GI@C or GAI group stained with commercial Annexin V-FITC/PI displayed similar cell mortality with that of above-mentioned group (Figure S12), demonstrating the reliable and receivable function of GAI@CP for therapeutic self-reporting via detecting FRET-Pep fluorescence.
In vivo tumor therapy and therapeutic self-reporting
In vivo fate of GAI@CP was investigated after systemic administration to disclose the merits of programmed theranostic property. The plasma drug concentration versus time profiles after intravenous injection of CPT and GAI@CP at a single dose of 5 mg kg-1 to Wister rats were shown in Figure S13, and the pharmacokinetic parameters were listed in Table S2. Compared with free CPT having an area under the curve (AUC) of 364.69 μg h/L and an elimination half-life (t1/2Beta) of 7.51 h, GAI@CP displayed increased AUC of 930.69 μg h/L (2.55 fold) and enlarged t1/2Beta of 36.84 h (4.91 fold), which indicated that GAI@P significantly prolonged the blood circulation time and increased the stability of CPT because of the stealthy surface. Subsequently, GAI@CP and control groups of GA@CP and GI@CP were labeled with Cy7 to directly visualize the accumulation in tumor by vivo fluorescence imaging. After intravenous injection for 4 h into the HeLa tumor-bearing BALB/c nude mice, the tumor tissue in the GAI@CP-treated mouse could be distinguished from the surrounding normal tissues. The ratio of fluorescence at tumor to normal tissue increased gradually and reached a maximum at 24 h postinjection, and a high fluorescence contrast could be maintained even 48 h after injection (Figure 4a). Comprehensive analysis of each group at all monitoring time points suggested that GAI@CP was more favorable for the CPT accumulation in solid tumors compared with GA@CP and GI@CP, which could be attributed to the PEI-induced surface charge reversion and FA-mediated targeting effect. Ex vivo imaging (Figure S14a) and semiquantitative analysis (Figure S14b) of GAI@CP distribution clearly showed that Cy7 fluorescence was mainly located at the tumor tissue over other organs, indicating the outstanding capability of GAI@CP for targeted drug delivery. The relative weak fluorescence was also detected in liver, indicating that GAI@CP could be excreted out in a hepatobiliary pathway. The elimination of GAI@CP from the body was further confirmed by observing strong Cy7 fluorescence in faeces in intestines (Figure S15), which reduced the potential side effects in body.
In vivo fluorescence imaging, therapy and therapeutic self-reporting with GAI@CP. (a) Real-time in vivo images by monitoring Cy7 fluorescence of subcutaneous HeLa tumor-bearing mice after intravenous injection of GAI@CP/Cy7, GA@CP/Cy7 and GI@CP/Cy7. (b) Relative tumor volume changes of subcutaneous HeLa tumor-bearing mice after intravenous injection of PBS, GAI@P, GAI@CP, GI@CP, GA@CP and CPT, respectively. The dose of nanoparticle was 2.5 mg kg-1 CPT equiv. Data are means ± SD (n = 12, *P < 0.05, **P < 0.01 using a one-way ANOVA). In vivo therapeutic monitoring of FRET-Pep fluorescence (c) and semi-quantitative analysis of fluorescent intensity at tumor sites (d) on subcutaneous HeLa tumor-bearing mice after intravenous injection of GAI@CP, GA@CP and GI@CP, respectively. (e) Fluorescence images of tumor slice for apoptotic assays after treated with PBS, GAI@CP, GI@CP, GA@CP, CPT and GAI@P over 15 d, respectively. Scale bars: 50 μm.
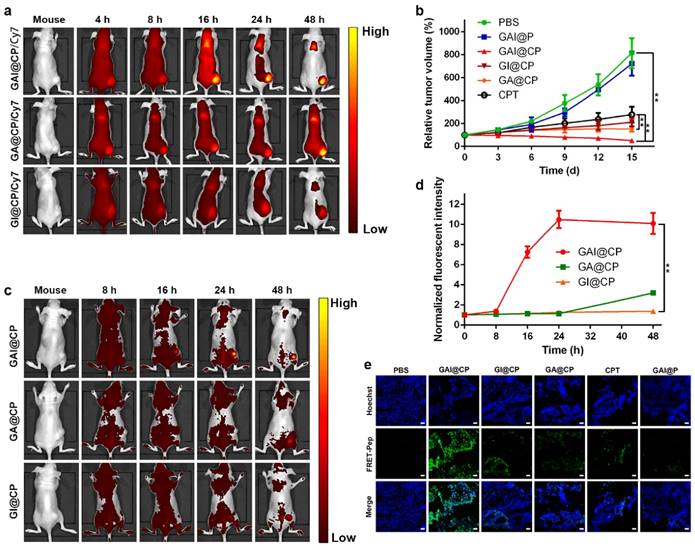
The therapeutic efficacy to tumor of GAI@CP was evaluated by monitoring tumor volume changes in HeLa tumor-bearing mice. The GAI@P had no obvious effect on tumor growth of mice compared to the PBS-administered mice as a negative control (Figure 4b). For GAI@CP group, the tumor growth was significantly suppressed, and the inhibition rate was much higher than that of the other groups including GI@CP, GA@CP, GAI@P and CPT (Figure S16). The GA@CP (without PEI) and GI@CP (without FA) showed much lower therapeutic effect, revealing the necessities of charge-tunable property with PEI and targetable effect with FA. Tumor growth inhibition of GAI@CP exceeded CPT group, indicating that GAI@CP remarkably improved antitumor efficiency of CPT. Moreover, no noticeable body weight loss during 15-d treatment (Figure S17) and no organ damage was observed from hematoxylin and eosin (H&E) stained organ slices (Figure S18) for the GAI@CP-administered mice, further suggesting the negligible side effects of GAI@CP for in vivo tumor therapy.
To better clarify the effectiveness of GAI@CP for therapeutic self-reporting in vivo, HeLa tumor-bearing BALB/c nude mice were intravenously injected with GAI@CP, GA@CP or GI@CP and performed in vivo fluorescence imaging. The apoptotic FRET-Pep fluorescence at the tumor site could be detected after 16-h treatment (Figure 4c) and the intensity increased along with time for the GAI@CP-treated mice (Figure 4d). However, the FRET-Pep fluorescence of GA@CP or GI@CP group was much weaker in the tumor site even after 48-h postinjection due to lack of PEI or FA, showing the viability of GAI@CP for in vivo targeted treatment and therapeutic self-reporting. Encouragingly, the theranostic capability of GAI@CP was further proved by fluorescence images of tumor slice stained with Hoechst (Figure 4e). It was concluded that GAI@CP achieved maximum antitumor effects and self-evaluation of therapy in vivo. Although the background fluorescence
was also detected in the mouse body due to the visible excitation and emission wavelength of fluorescein (400-700 nm), the fluorescence intensity of tumor region was strong enough for apoptotic imaging. This work should substantially broaden the prospect to further develop a near-infrared (700-1000 nm) nanotheranostics for precise tumor treatment.
Conclusion
This work reports the successful development of a programmed nanoparticle with self-adapting function to integrate all of the theranostic steps into one single system for precise cancer cell eradication and therapeutic self-reporting (Figure S19). The newly designed nanoparticle has well-defined nanostructures and surface charge reversible property, which enables the nanoparticle to be negatively charged at physiological pH to prolong blood circulation time and be positively charged at acidic condition to increase the accumulation in tumor tissue. The presence of FA assists cellular internalization via FR-mediated endocytosis pathway for enhanced drug accumulation in tumor cells. After endocytosis, “proton sponge effect” of PEI induces the endo/lysosomal disintegration to achieve drug escape from endo/lysosome, which promotes the combination of drug with targets and accelerates the tumor apoptosis. More importantly, the nanoparticle can rapid response to activated caspase-3 in the apoptotic process to achieve visualized therapeutic reporting for precise tumor treatment. We anticipate that the proposed nanoparticle offers a new paradigm for the construction of novel programmed theranostic nanosystems and contributes to development of precision medicine.
Supplementary Material
Supplementary figures and tables.
Acknowledgements
This research was supported by National Natural Science Foundation of China (21505161), Natural Science Foundation of Jiangsu Province (BK20150701), Program for Changjiang Scholars and Innovative Research Team in University (IRT1193), State Key Laboratory of Analytical Chemistry for Life science (SKLACLS1415) and the Research Innovation Program for Graduates of Jiangsu Province (KYLX16_1186). The authors acknowledge the Cellular and Molecular Biology Center of China Pharmaceutical University for assistance with confocal fluorescence imaging and we are grateful to Xiao-Nan Ma for her technical help.
Competing Interests
The authors have declared that no competing interest exists.
References
1. Muthu MS, Leong DT, Mei L, Feng SS. Nanotheranostics-application and further development of nanomedicine strategies for advanced theranostics. Theranostics. 2014;4:660-77
2. Choi KY, Liu G, Lee S, Chen X. Theranostic nanoplatforms for simultaneous cancer imaging and therapy: current approaches and future perspectives. Nanoscale. 2012;4:330-42
3. Sun CY, Shen S, Xu CF, Li HJ, Liu Y, Cao ZT. et al. Tumor acidity-sensitive polymeric vector for active targeted siRNA delivery. J. Am. Chem. Soc. 2015;137:15217-24
4. Casey JR, Grinstein S, Orlowski J. Sensors and regulators of intracellular pH. Nat. Rev. Mol. Cell Bio. 2010;11:50-61
5. Blanco E, Shen H, Ferrari M. Principles of nanoparticle design for overcoming biological barriers to drug delivery. Nat. Biotechnol. 2015;33:941-51
6. Zhang L, Lei J, Ma F, Ling P, Liu J, Ju H. A porphyrin photosensitized metal-organic framework for cancer cell apoptosis and caspase responsive theranostics. Chem. Commun. 2015;51:10831-4
7. Blum AP, Kammeyer JK, Rush AM, Callmann CE, Hahn ME, Gianneschi NC. Stimuli-responsive nanomaterials for biomedical applications. J. Am. Chem. Soc. 2015;137:2140-54
8. Kolosnjaj-Tabi J, Lartigue L, Javed Y, Luciani N, Pellegrino T, Wilhelm C. et al. Biotransformations of magnetic nanoparticles in the body. Nano Today. 2016;11:280-4
9. Liao WC, Riutin M, Parak WJ, Willner I. Programmed pH-responsive microcapsules for the controlled release of CdSe/ZnS quantum dots. ACS Nano. 2016;10:8683-9
10. Fan C, Bian T, Shang L, Shi R, Wu LZ, Tung CH. et al. pH-Responsive reversible self-assembly of gold nanoparticles into nanovesicles. Nanoscale. 2016;8:3923-5
11. Tsang MK, Bai G, Hao J. Stimuli responsive upconversion luminescence nanomaterials and films for various applications. Chem. Soc. Rev. 2015;44:1585-607
12. Tian J, Ding L, Wang Q, Hu Y, Jia L, Yu JS. et al. Folate receptor-targeted and cathepsin B-activatable nanoprobe for in situ therapeutic monitoring of photosensitive cell death. Anal. Chem. 2015;87:3841-8
13. Stuart MA, Huck WT, Genzer J, Müller M, Ober C, Stamm M. et al. Emerging applications of stimuli-responsive polymer materials. Nat. Mater. 2010;9:101-13
14. Yao C, Wang P, Li X, Hu X, Hou J, Wang L. et al. Near-infrared-triggered azobenzene-liposome/upconversion nanoparticle hybrid vesicles for remotely controlled drug delivery to overcome cancer multidrug resistance. Adv. Mater. 2016;28:9341-8
15. Cabral H, Kataoka K. Multifunctional nanoassemblies of block copolymers for future cancer therapy. Sci. Technol. Adv. Mater. 2010;11:014109-18
16. Shen Y, Fu X, Fu W, Li Z. Biodegradable stimuli-responsive polypeptide materials prepared by ring opening polymerization. Chem. Soc. Rev. 2015;44:612-22
17. Du JZ, Sun TM, Song WJ, Wu J, Wang J. A tumor-acidity-activated charge-conversional nanogel as an intelligent vehicle for promoted tumoral-cell uptake and drug delivery. Angew. Chem. Int. Ed. 2010;49:3621-6
18. Li H, Fu Y, Zhang T, Li Y, Hong X, Jiang J. et al. Rational design of polymeric hybrid micelles with highly tunable properties to co-deliver microRNA-34a and vismodegib for melanoma therapy. Adv. Funct. Mater. 2015;25:7457-69
19. Sun Q, Sun X, Ma X, Zhou Z, Jin E, Zhang B. et al. Integration of nanoassembly functions for an effective delivery cascade for cancer drugs. Adv. Mater. 2014;26:7615-21
20. Zhang Z, Zhang X, Xu X, Li Y, Li Y, Zhong D. et al. Virus-inspired mimics based on dendritic lipopeptides for efficient tumor-specific infection and systemic drug delivery. Adv. Funct. Mater. 2015;25:5250-60
21. Hu X, Hu J, Tian J, Ge Z, Zhang G, Luo K. et al. Polyprodrug amphiphiles: hierarchical assemblies for shape-regulated cellular internalization, trafficking, and drug delivery. J. Am. Chem. Soc. 2013;135:17617-29
22. Liu G, Zhang G, Hu J, Wang X, Zhu M, Liu S. Hyperbranched self-immolative polymers (hSIPs) for programmed payload delivery and ultrasensitive detection. J. Am. Chem. Soc. 2015;137:11645-55
23. Kulkarni A, Rao P, Natarajan S, Goldman A, Sabbisetti VS, Khater Y. et al. Reporter nanoparticle that monitors its anticancer efficacy in real time. Proc. Natl. Acad. Sci. U. S. A. 2016;113:E2104-13
24. Kim K, Kim JH, Park H, Kim YS, Park K, Nam H. et al. Tumor-homing multifunctional nanoparticles for cancer theragnosis: Simultaneous diagnosis, drug delivery, and therapeutic monitoring. J. Control. Release. 2010;146:219-27
25. Hu X, Liu G, Li Y, Wang X, Liu S. Cell-penetrating hyperbranched polyprodrug amphiphiles for synergistic reductive milieu-triggered drug release and enhanced magnetic resonance signals. J. Am. Chem. Soc. 2015;137:362-8
26. Huang X, Lee S, Chen X. Design of “smart” probes for optical imaging of apoptosis. Am. J. Nucl. Med. Mol. Imaging. 2011;1:3-17
27. Yuan Y, Sun H, Ge S, Wang M, Zhao H, Wang L. et al. Controlled intracellular self-assembly and disassembly of 19F nanoparticles for MR imaging of caspase 3/7 in zebrafish. ACS Nano. 2015;9:761-8
28. Thukkani AK, Shoghi KI, Zhou D, Xu J, Chu W, Novak E. et al. PET imaging of in vivo caspase-3/7 activity following myocardial ischemia-reperfusion injury with the radiolabeled isatin sulfonamide analogue [18F] WC-4-116. Am. J. Nucl. Med. Mol. Imaging. 2016;6:110-9
29. Prasuhn DE, Feltz A, Blanco-Canosa JB, Susumu K, Stewart MH, Mei BC. et al. Quantum dot peptide biosensors for monitoring caspase 3 proteolysis and calcium ions. ACS Nano. 2010;4:5487-97
30. Liu Y, Hu Y, Guo Y, Ma H, Li J, Jiang C. Targeted imaging of activated caspase-3 in the central nervous system by a dual functional nano-device. J. Control. Release. 2012;163:203-10
31. Tajon CA, Seo D, Asmussen J, Shah N, Jun YW, Craik CS. Sensitive and selective plasmon ruler nanosensors for monitoring the apoptotic drug response in leukemia. ACS Nano. 2014;8:9199-208
32. Nel AE, Mädler L, Velegol D, Xia T, Hoek EM, Somasundaran P. et al. Understanding biophysicochemical interactions at the nano-bio interface. Nat. Mater. 2009;8:543-57
33. Tian J, Ding L, Xu HJ, Shen Z, Ju H, Jia L. et al. Cell-specific and pH-activatable rubyrin-loaded nanoparticles for highly selective near-infrared photodynamic therapy against cancer. J. Am. Chem. Soc. 2013;135:18850-8
34. Liang X, Gao J, Jiang L, Luo J, Jing L, Li X. et al. Nanohybrid liposomal cerasomes with good physiological stability and rapid temperature responsiveness for high intensity focused ultrasound triggered local chemotherapy of cancer. ACS Nano. 2015;9:1280-93
35. Rainò G, Stöferle T, Park C, Kim HC, Chin IJ, Miller RD. et al. Dye molecules encapsulated in a micelle structure: nano-aggregates with enhanced optical properties. Adv. Mater. 2010;22:3681-4
36. Pelaz B, del Pino P, Maffre P, Hartmann R, Gallego M, Rivera-Fernández S. et al. Surface functionalization of nanoparticles with polyethylene glycol: effects on protein adsorption and cellular uptake. ACS Nano. 2015;9:6996-7008
37. Tang Z, Li D, Sun H, Guo X, Chen Y, Zhou S. Quantitative control of active targeting of nanocarriers to tumor cells through optimization of folate ligand density. Biomaterials. 2014;35:8015-27
38. Lee KY, Seow E, Zhang Y, Lim YC. Targeting CCL21-folic acid-upconversion nanoparticles conjugates to folate receptor-alpha expressing tumor cells in an endothelial-tumor cell bilayer model. Biomaterials. 2013;34:4860-71
39. Chen H, Xiao L, Anraku Y, Mi P, Liu X, Cabral H. et al. Polyion complex vesicles for photoinduced intracellular delivery of amphiphilic photosensitizer. J. Am. Chem. Soc. 2014;136:157-63
40. Lecoeur H, Prévost MC, Gougeon ML. Oncosis is associated with exposure of phosphatidylserine residues on the outside layer of the plasma membrane: A reconsideration of the specificity of the annexin V/Propidium iodide assay. Cytometry. 2001;44:65-72
Author contact
![]() Corresponding authors: Bo-Yang Yu, Email: boyangyu59com; Jiangwei Tian, Email: jwtianedu.cn
Corresponding authors: Bo-Yang Yu, Email: boyangyu59com; Jiangwei Tian, Email: jwtianedu.cn