Impact Factor
 Global reach, higher impact
Theranostics 2017; 7(4):1026-1035. doi:10.7150/thno.18191 This issue Cite
Research Paper
Evaluation of a Novel Thermal Accelerant for Augmentation of Microwave Energy during Image-guided Tumor Ablation
William Keun Chan Park ![]() , Aaron Wilhelm Palmer Maxwell, Victoria Elizabeth Frank, Michael Patrick Primmer, Scott Andrew Collins, Grayson Luderman Baird, Damian Edward Dupuy
, Aaron Wilhelm Palmer Maxwell, Victoria Elizabeth Frank, Michael Patrick Primmer, Scott Andrew Collins, Grayson Luderman Baird, Damian Edward Dupuy
Department of Diagnostic Imaging, Rhode Island Hospital, The Warren Alpert Medical School of Brown University, Providence, Rhode Island, USA.
Received 2016-11-3; Accepted 2016-12-8; Published 2017-2-26
Abstract

The primary challenge in thermal ablation of liver tumors (e.g. hepatocellular carcinoma and hepatic colorectal cancer) is the relatively high recurrence rate (~30%) for which incomplete ablation at the periphery of the tumor is the most common reason. In an attempt to overcome this, we have developed a novel thermal accelerant (TA) agent capable of augmenting microwave energy from a distance normally unattainable by a single microwave ablation antenna. This cesium-based block co-polymer compound transforms from a liquid to a gel at body temperature and is intrinsically visible by computed tomography. Using an agarose phantom model, herein we demonstrate that both the rate and magnitude of temperature increase during microwave ablation were significantly greater in the presence of TA when compared with controls. These results suggest robust augmentation of microwave energy, and may translate into larger ablation zone volumes within biologic tissues. Further work using in vivo techniques is necessary to confirm these findings.
Keywords: Image-guided thermal ablation, microwave ablation, thermal accelerant, augmentation of microwave energy, non-radioactive cesium chloride, block-co-polymer, PLGA-PEG-PLGA, dipole moment, complex dielectric permittivity, dielectric constant, loss factor.
INTRODUCTION
Hepatocellular carcinoma (HCC) is the most prevalent primary liver malignancy in the world and the fifth most common cancer overall.1 According to recent World Health Organization statistics, there are approximately 745,000 new cases annually causing over 600,000 global deaths.2,3 In recent years, HCC incidence has significantly increased in the United States, which is likely—in part—due to the contemporaneous increase in prevalence of non-alcoholic fatty liver disease, the most common liver disorder among Western industrialized nations.4 Therapeutic options for HCC vary according to Barcelona Clinic Liver Cancer (BCLC) stage; early stage HCC is generally treated by surgical resection or transplantation, while intermediate and advanced stage HCC is treated by embolization, systemic chemotherapy agents such as sorafenib, or supportive care.5 Despite the number of potentially-curative therapies available, however, HCC is typically diagnosed late, and only a minority of patients in the United States meet rigorous transplant criteria.6 Accordingly, there is an urgent need for alternative therapies within this growing majority of patients.
In order to fill the gap in therapeutic options among non-surgical patients with early-stage HCC therapy, several minimally invasive, image-guided thermal ablation (IGTA) techniques have emerged, including radiofrequency (RF) and microwave (MW) ablation. Though unique in their mechanisms, both modalities achieve oncolysis by the local application of extreme temperature (greater than 60ºC), which yields irreversible cell injury, tumor apoptosis, coagulative necrosis, and the release of tumor antigens.7-9 IGTA offers several advantages over traditional surgical resection, including lower procedural mortality, increased preservation of surrounding parenchyma, and reductions in both length and cost of periprocedural hospitalization.3
Despite these advantages, however, IGTA remains a second-line therapy because of a relatively high rate of post-treatment local HCC tumor progression. While many factors likely contribute to this phenomenon, inadequate margins are considered the principal cause.3 With RF energy, for example, residual viable tumors cells were identified in 26% of patients following post-ablation liver explanation and histologic analysis in one series.9 The increased use of microwave ablation (MWA) has helped to mitigate some of the problems inherent to RF energy, including the heat-sink effect and inhomogeneous heating11,12 ; nevertheless, local tumor progression following IGTA treatment remains a fundamental concern, limiting its wider application.
To address this issue, we have designed a novel thermal accelerant (TA) compound with the goal of augmenting microwave energy delivery within biologic tissues so as to achieve cytotoxic temperatures at a distance currently unattainable by a single microwave antenna. The compound is derived from non-toxic materials, is intrinsically visible using computed tomography, and demonstrates temperature-dependent and reversible phase-transition properties. In this initial report, we investigate the biophysical properties of the thermal accelerant, as well as its effects on microwave energy augmentation using an in vitro tissue model.
MATERIALS AND METHODS
Preparation of the Thermal Accelerant Solution
The thermal accelerant compound was designed using commercially available non-radioactive CsCl (Sigma-Aldrich, St. Louis MO) and a polyethylene glycol-based reverse phase-transition block-co-polymer (AK88; Akina Inc., West Lafayette, IN). The TA solution was prepared by adding a CsCl solution (e.g., 250 mg CsCl in 0.5 mL) to the block-co-polymer (200 mg), and subsequent agitating the mixture at 4 oC until a transparent liquid. The resultant solution was then diluted up to 1 mL to make the TA solution (e.g. 250 mg CsCl in a 20% w/v block-co-polymer solution).
In Vitro Agarose Phantom Model
During this first phase of investigation, the capacity of TA to augment microwave energy delivery within biologic tissues was evaluated using an in vitro model. An agarose gel (Bio-Rad Laboratories, Inc., Hercules, CA) phantom was prepared by mixing agarose (15 g) and double-distilled, degassed water (1.5 liters) while heated. This combination was chosen because a similar construct made of ionized water (0.9% w/v NaCl solution) was found to lose the necessary structural integrity at elevated temperatures in initial trials (results not provided). Additionally, a non-saline construct was necessary so as to isolate the effect of microwave energy on TA, which contains ionic components.
Microwave Ablation
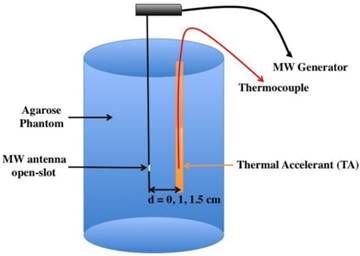
For the thermal ablation trials, a 915 MHz SynchroWave ST microwave antenna (Perseon Co., Salt Lake City, UT) or a 2.45 GHz SurBlate microwave antenna (Vison Medical USA Inc. Santa Clara C) was placed in the center of the phantom at a sufficient depth to minimize energy reflection (typically less than 3%). TA was deposited in parallel with the antenna as a continuous column (2-3 mm in diameter) at the height of the antenna slot where the microwave energy is transmitted (Figure 1). Serial temperature recordings were then made over 10 minutes at 15-second intervals using thermocouples connected to a PMD-MXT microprocessor-based temperature scanner (Harold G. Schaevitz Industries LLC, Troy MI).
In vitro phantom setup. Thermal accelerant and a thermocouple are placed within the agarose phantom parallel to the microwave antenna.
Thermal Accelerant Dose and Distance Trials
To assess the effect of TA dose on heating, temperature recordings were made within the agarose phantom during thermal ablation using TA concentrations of 0 mg/mL (control), 100 mg/mL and 250 mg/mL. To simultaneously evaluate the effect of distance from the microwave antenna, trials were conducted at each dose using distances of 0.5 cm, 1.0 cm, 1.5 cm, and 2.0 cm. A microwave power of 60W was in all trials, and each experimental condition was replicated three times. Under each condition, the time spent at or above a cytotoxic temperature of 60 ºC was determined.
Microwave Power Trials
To assess the effect of microwave power on heating, 500 μL of thermal accelerant at a dose of 250 mg/mL CsCl was placed within the agarose phantom and microwave energy was applied at powers of 25W, 45W, and 60W while temperature measurements were made. A distance of 1.5 cm was used in all trials, and each experimental condition was replicated three times. Under each condition, the time spent at or above a cytotoxic temperature of 60ºC was determined.
Microwave Frequency Trials
To assess the effect of microwave frequency on heating, 500 μL of thermal accelerant at a dose of 0 mg/mL and 250 mg/mL CsCl was placed within the agarose phantom and microwave energy was applied at frequencies of 915 MHz and 2,450 MHz while temperature measurements were made. A distance of 1.5 cm and power of 60W was used in all trials, and each experimental condition was replicated three times. Under each condition, the time spent at or above a cytotoxic temperature of 60 ºC was determined.
Biomedical Imaging Properties
To assess the CT imaging properties of the thermal accelerant agent, TA standards at varying concentrations (0 mg/mL, 10 mg/mL, 100 mg/mL and 1,000 mg/mL in a 20 (w/v)% polymer solution) were imaged using a GE Optima 580W CT scanner. A modified brain protocol was utilized: tube potential, 120 kV; tube current, 50 mA; rotation speed, 0.8s; pitch, 0.562:1; CDTI, 12.08 mGy; DLP, 193.88. Density measurements in Hounsfield units (HU) were made by region-of-interest analysis using OsiriX v7.0.3. (Pixmeo, Geneva, Switzerland).
Statistical Analysis
All analyses were conducted using SAS Software 9.4 (SAS Inc., Cary, NC). Temperature was modeled over time in seconds according to cesium chloride dosage (0 mg/mL, 100 mg/mL, 250 mg/mL), distance of the thermal accelerant from the microwave antenna (0.5 cm, 1.0 cm, 1.5 cm, 2.0 cm), microwave power (25W, 45W, 60W), and microwave frequency (915 MHz, 2450 MHz). General mixed modeling with classic sandwich estimation was used, where observations were nested within trials using PROC GLIMMIX. For purposes of replication and future power analyses, mean estimates are provided along with interval estimates calculated for 95% confidence. Significance was established a priori at 0.05.
RESULTS
Thermal Accelerant Dose and Distance Trials
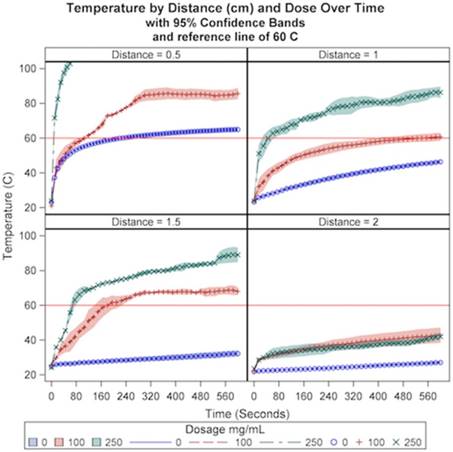
A significant interaction effect was observed for distance and dosage over time (p<.0001). A cytotoxic temperature of 60 ºC was achieved at all distances using a dosage of 250 mg/mL CsCl except for a distance of 2 cm, where no dosage achieved 60 ºC after ten minutes of microwave energy delivery. In addition, a temperature of 60 ºC was achieved at a distance of 0.5 cm and 1.5 cm when using a dosage of 100. As demonstrated in Figure 2, in general, closer distances and higher dosages result in both higher temperatures and more rapid temperature increase relative to greater distances and lower dosages. As can be seen in Table 1, these results suggest that a distance of 1-1.5 cm from the microwave antenna with a dosage of 250 mg/mL are favorable conditions with respect to duration of the ablation cycle at or above a cytotoxic temperature threshold of 60 ºC.
The relationship of CsCl dose and TA distance from the microwave antenna on temperature over a ten-minute ablation cycle at a constant power (60W).
Time to reach cytotoxic threshold of 60oC by distance and dosage
| Distance (cm) | Dosage (mg/mL) | Time (seconds) |
|---|---|---|
| 0.5 | 0 | N/A |
| 100 | 120 | |
| 250 | 10 | |
| 1.0 | 0 | N/A |
| 100 | 540 | |
| 250 | 60 | |
| 1.5 | 0 | N/A |
| 100 | 195 | |
| 250 | 75 | |
| 2.0 | 0 | N/A |
| 100 | N/A | |
| 250 | N/A |
N/A: not achieved
Microwave Power Trials
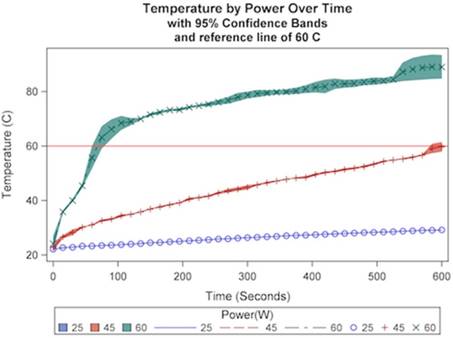
The relationship between temperature and microwave power was next examined at a constant distance of 1.5 cm and dosage at 250 mg/mL at 915 MHz. A significant interaction effect was observed for power with respect to time (p<.0001). As demonstrated in Figure 3, higher levels of power resulted in both higher temperatures and more rapid temperature increase relative to lower powers. A cytotoxic temperature of 60 ºC was achieved in 75 seconds at a power of 60W and 600 seconds at a power of 45W. A temperature of 60 ºC was not achieved at a power of 25W over the ten-minute ablation cycle. Additionally, the approximate linear rates of initial temperature increase were significantly greater at 60W compared with lower powers (p<.0001), and were significantly greater in the presence of TA compared with control (Table 2). As can be seen in Table 3, these results suggest a preferred ablation power of 60W.
The relationship of microwave power on temperature over a ten-minute ablation cycle at a constant dose (250 mg/mL) and distance (1.5 cm).
Observed rates of the temperature change by microwave power: TA v. Control
| P (W) | TA | Control | ||
|---|---|---|---|---|
| rate (ΔT/Δt oC/s) | intercept (oC) | rate (ΔT/Δt oC/s) | intercept (oC) | |
| 25 | 0.0115 | 22.7 | 0.00981 | 26.7 |
| 45 | 0.0527 | 28.1 | 0.00983 | 26.2 |
| 60 | 0.467 (0-60) 0.0389 (60-600) | 26.2 65.8 | 0.0107 | 25.8 |
Time to reach cytotoxic threshold of 60oC by power at constant distance and dose (1.5 cm, 250 mg/mL)
| Power (W) | MHz | Time (seconds) |
|---|---|---|
| 25 | 915 | N/A |
| 45 | 915 | 600 |
| 60 | 915 | 75 |
| 60 | 2450 | 465 |
| 90 | 2450 | 105 |
N/A: not achieved
Microwave Frequency Trials
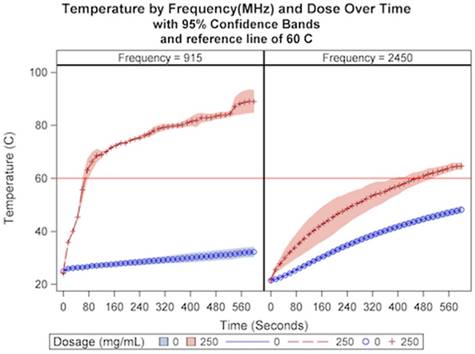
Subsequently, temperature was examined according to microwave frequency and cesium chloride dosage at a constant distance and power of 1.5 cm and 60W, respectively. A significant interaction effect was observed for frequency and dosage over time (p<.0001). As demonstrated in Figure 4, higher dosages and lower frequency resulted in both higher temperatures and more rapid temperature increase relative to lower dosages and higher frequency. At a dose of 250 mg/mL, a temperature of 60 ºC was achieved at a frequency of 915 MHz in 75 seconds and in 450 seconds at a frequency of 2.45 GHz. In the absence of thermal accelerant, 60 ºC was not achieved for either frequency. As can be seen in Table 4, the results suggest a preferred ablation frequency of 915MHz.
The relationship of CsCl dose and microwave frequency on temperature over a ten-minute ablation cycle at a constant distance (1.5 cm).
Time to reach cytotoxic threshold of 60oC by frequency and dosage at constant distance and power (1.5 cm, 60W)
| Frequency (MHz) | Dosage (mg/mL) | Time (seconds) |
|---|---|---|
| 915 | 0 | N/A |
| 100 | 195 | |
| 250 | 75 | |
| 2,450 | 0 | N/A |
| 100 | N/A | |
| 250 | 465 |
N/A: not achieved
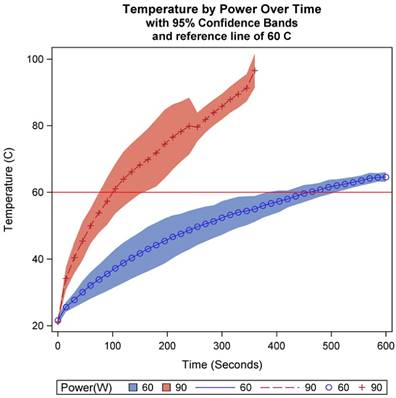
The relationship between temperature and microwave power was next examined at a constant distance of 1.5 cm and dosage at 250 mg/mL at 2.45 GHz. A significant interaction effect was observed for power with respect to time (p<.0001). As can be seen in Table 3 and Figure 5, power at 90W achieved a temperature of 60 ºC much faster than 60W, though as can be seen in Figure 4, frequency at 2.45 GHz caused the treatment temperature to be more variable relative to a frequency of 915 when TA was present.
The relationship of power on temperature at 2,450 MHz over a ten-minute ablation cycle at a constant dose (250 mg/mL) and distance (1.5 cm).
Biomedical Imaging Properties
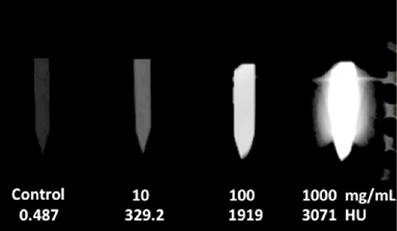
The degree of the radiographic density by computed tomographic imaging was found to be proportional to TA concentration. As demonstrated in Figure 6, there was a steady rise in Hounsfield units with increased cesium chloride content, ranging from 329.2 HU at a concentration of 10 mg/mL to 3071 HU at a concentration of 1000 mg/mL. When compared with saline, even the lowest concentration TA sample (10 mg/mL) yielded a discernible increase in radiodensity.
The CT density measurements of TA (10 mL of CsCl in 20% (w/v) polymer solutions) at various concentrations as compared with a saline control.
DISCUSSION
Thermal Accelerant (TA)
Tissue ablation by microwave (MW) energy primarily uses water molecules to generate heat. A water molecule is structurally bent (104.5o) due to two non-bonding electrons on the oxygen atom, and thus has an inherent dipole moment (1.85 D, D=Debye). Between the MW frequency range of 300 MHz- 30 GHz, water molecules synchronize to the alternating electrical field to cause collisions among themselves and this energy is in turn converted to heat. Most alkali and alkaline earth metal ions tend to have higher dipole moments (D > 7-11, e.g., NaCl, 9 D; KBr, 10.4 D; BaO, 7.9 D) than water. This suggests that these compounds can be more effective thermal accelerators of microwave energy compared to water. Among these ionic compounds, non-radioactive cesium chloride (CsCl) is particularly remarkable because of its high dipole moment (10.4 D) and the unique physicochemical and toxicological properties it provides to MW ablation. First, CsCl is highly soluble in water (1,865 kg/L at 20 oC and 2.7 kg/L at 100 oC), which means that a highly concentrated CsCl TA solution can be synthesized. Second, with its high atomic number Cs ions provide excellent contrast by CT imaging. Finally, CsCl is considered non-toxic (LD50 = 2,600 mg/kg oral; 910 mg/kg iv, rat). As a result, CsCl or equivalent ionic compounds can be used to augment applied microwave energy and be radiodense under CT imaging.
Injection of a simple aqueous solution containing ionic compounds cannot be reliably used as it is immediately diluted in highly perfused liver tissue once injected into the target area. To solve this problem, we have used a reverse phase-transition block-co-polymer as a carrier medium of CsCl (PLGA-PEG-PLGA, AK88).13,14 This safe, biodegradable, and biocompatible polymer solution (20 %(w/v) block-co-polymer containing CsCl (10-250 mg/mL)) turns into a gel in the range of 34-39 oC while remaining a liquid at ambient temperature. When exposed to increasing temperatures (> 60 oC) during thermal ablation, the polymer forms a precipitate, expelling water molecules out of the gel. As described in the literature13, the phase transition of the polymer involves complex molecular events. At ambient temperature, the PLGA components of the polymer interact intramolecularly to form a hairpin shape. The individual polymer molecules are hydrated fully at the 20% (W/V) composition, i.e., 2 g of polymer in 100 mL water. Once introduced into the body, the thermal energy is sufficient to create an intermolecular interaction of PLGA, rendering a gel formation. Above 60 oC, the intermolecular PLGA interactions expel water molecules from the polymer lattice to form two separate phases: a white polymeric precipitate and water.
CsCl is an ionic compound, and thus miscible with the aqueous polymer solution to allow the homogeneous distribution of CsCl and permit uniform heating within the target ablation space. With CT image guidance, the desired amount of the TA with a known CsCl concentration can be deposited at the boundary of a tumor mass or next to a large blood vessel to mitigate the heat sink effect. At body temperature the injected TA turns into a gel of predetermined ablation shape and volume. The TA gel is heated by MW energy transmitted through a linear antenna to reach tumoricidal temperature (> 60 oC) in the targeted area.
Behavior of Microwave Radiation in Water
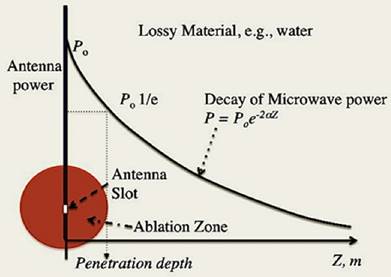
The behavior of electromagnetic radiation (microwave range 300MHz - 300 GHz) in water has been extensively studied.15, 16 In the medical microwave ablation of tumors, two specific frequencies are most popularly used: 915 MHz and 2,450 MHz. The microwave energy is delivered through an open slot as a focal point of an antenna tethered by a cable from the microwave generator. What follows is a brief, theoretical, description of the microwave energy emitted from the focal point into a dielectric lossy medium, i.e., water, as shown in Figure 7.
The relationship of the microwave power (P) in Eq. [1] and Eq. [2] with the penetration depth (dp) Eq. [4]. The decay curve obeys the Beer-Lambert-Bouguer's law: The attenuation factor (α) in Eq. [2] determines the slope of the curve, which is dependent on ε* in Eq. [3], the complex relative permittivity.
The average microwave power (P in watts) absorbed by a dielectric material (in this case, deionized pure water) is expressed as,
1
The power decreases exponentially with distance (Z) from the antenna, and the rate is dependent on the attenuation factor (α), which in turn depends on the dielectric properties of the medium. The attenuation factor (α) is expressed as,
2
where the real part  is described as the dielectric constant and represents the ability of the medium to be polarized by the external electric field, while the imaginary part
  (also known as the loss factor) quantifies the efficiency with which the electromagnetic energy is absorbed and converted to heat and
  .15
.15
Thus, the complex relative permittivity, ε*, can be expressed in terms of dielectric constant, which is defined as,
3
The equation [3] considers the total current as the vector sum of the charging current and the loss current; the angle δ as the phase difference (lag) between the electric field and the resultant (orientation) polarization of the material.15 The penetration depth of the microwave power is defined as the depth at which the power is reduced to 1/e of the initial power from the antenna (Figure 7). The penetration depth dp by microwave energy in a lossy material like water can be calculated by the equation [4].
4
where c is the speed of light (3 x 10⁸ m/s), and the ratio,  , is called a tangent of loss angle (δ, ι.ε.,
  ).
).
Effect of Microwave Power (P) on Temperature with TA: 915 MHz, 1.5 cm, and 10 minutes
Assuming that the phantom is equivalent to pure and ion-free water, and utilizing the already known dielectric properties of pure water: at 25 oC, the dielectric constant  = 78 and the loss factor
  =12.5, hence the ratio
  = 0.16, to obtain the attenuation factor, α=13.4 (see Eq. [2]). Subsequently, we can obtain the P values at 1.5 cm away from the microwave energy source using Eq. [1] and E2 can be solved with the P values using Eq. [5],
5
where f is frequency in Hz (915 x 106 s-1),  is free space permittivity (8.854 x 10⁻¹² F/m),
  is the loss factor at 25 oC (12.5) and
  is electric field intensity in V/m.
6
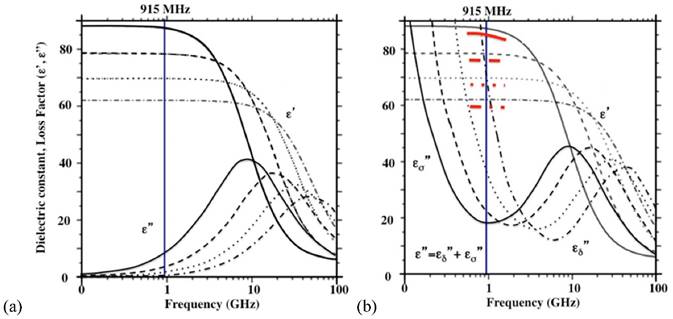
where Cp is the specific heat of the material in Jkg-1 oC-1, ρ is the density of the material in kg/m3, E is the electric field intensity in V/m, f is the frequency in Hz, Δt is the time duration in seconds, and ΔT is the temperature increase in the medium in oC. When the calculated rates are compared with what is observed as shown in Table 5, the range of rates are in agreement (≈10-3) as well as the trend in the increasing rate as the power: the calculated rates increase from 0.004 to 0.0096 (25W, 60W, respectively) appears to be steeper than those observed (from 0.00981 to 0.0107 at 25W, 60W, respectively). This discrepancy may be attributed to several assumptions made in the study: 1) 1% (w/v) agarose phantom is equivalent to pure water. The specific heat of pure water (4,186 J/kg oC) is assumed to be the same as that of the phantom; 2) the rateobs is determined by using the average temperature increase over a 10 minute period, as long as there is an appreciable linear relationship (r2 > 0.9); 3) the measured initial temperatures vary in the range of 21-26 oC; 4) heat exchange with the surrounding is negligible. The calculated rate assumes that the heat generated by the applied power is perfectly conserved. We suggest that the list above might have been reflected on the slower rateobs (ΔT/Δt) increase than ratecalc (ΔT/Δt) over power in pure water as shown in Table 2. The thermal accelerant (TA) solution shows a significantly higher rate (ΔT/Δt) compared to control at the same distance (at 25W 1.2 times, at 45W 5.4 times and at 60W 43.6 times, respectively). The TA rate increases as the power rises, which is consistent with Eq. [6]. The observation of the augmented heating of TA is largely attributable to the ion effect as TA contains 250 mg/mL of CsCl. As shown in Figure 8a, the dielectric properties of pure water are influenced by frequency and temperature.15, 16 At 915 MHz, the dielectric constant  decreases substantially as the temperature increases while the loss factor
  also decreases, but to a smaller extent. By comparison, the presence of an ionic compound in aqueous solution results in a decrease of the dielectric constant,
  and an increase of the loss factor
  . This attribute is qualitatively illustrated in Figure 8b assuming that the dielectric behavior of the CsCl solution is similar to that of the well-studied 0.5N aqueous NaCl solution.20
Comparison of observed rates and calculated based on Eq. [6]
| Po (W) | PTA (W) | ratecalc (ΔT/Δt oC/s) | rateobs (ΔT/Δt oC/s) |
|---|---|---|---|
| 25 | 16.7 | 0.00400 | 0.00981 |
| 45 | 26.8 | 0.00640 | 0.00983 |
| 60 | 40.1 | 0.00960 | 0.0107 |
Po = Power emitted from the antenna; PTA = Power that TA receives
The schematic dielectric properties (dielectric constant and loss factor ( ) of pure water (a) and an ionic solution (b; 0.5 N NaCl) affected by frequency and temperature change. Each curve represents a particular temperature: a solid line (0 oC); a broken line (25 oC); a dotted line (50 oC); a dotted-broken line (75 oC). Figure 8 is obtained by modifying the original plots as shown in references.17-19
The depression of  (red bands) of Figure 8b comes from the depleted dipoles of water molecules caused by solvating ions. The loss factor,
  of the salt solution is the sum of two components, i.e.,
  (static dielectric loss factor) and
  (ionic loss factor) while
  of pure water can be approximated by
  only. At 915 MHz (low frequency region), the ions are able to respond to the alternating electrical field to produce frictional heat. This predominates the molecular dynamics and results in a steep increase in the ionic loss factor
  . The loss factor,
  increases rapidly as the temperature is raised (Figure 8b). As in Eq. [6], power (P) increase is directly proportional to the increase in temperature, and thus the observed augmentation of microwave heating with TA is predominantly caused by the ionic loss factor
  .
.
Effect of Microwave Frequency on Temperature Increase with TA
We have examined the effect of frequency on the rate of temperature increase under the same ablation conditions (60W, 1.5 cm and 10 minutes) and the results are shown in Figure 4. In comparison to the experiment with the lower frequency (915MHz, 60W, 250 mg/mL TA, 10 min., 1.5 cm, Figure 2), the TA temperature profile is shifted downward. This observation is consistent with the  profile in Figure 8b: as we increase the frequency to 2.45 GHz, the corresponding intercept with the
  curve was lowered significantly. In contrast, for control, the
  curve increases when 915 MHz shifts to 2.45 GHz as shown in Figure 8a. The narrowed TA efficiency is recovered by increasing the power from 60W to 90W as depicted in Figures 4 and 5. Of note, the temperature variability with TA is much greater than the control in 2.45 GHz.
As shown earlier in Figure 3, it was observed that the rate ( ) of temperature change, after 1 minute, was lowered to 0.0394 from 0.467 at 60W. This appears to originate, at least in part, from the precipitation of the polymer at higher temperature (> 60-65 oC) by which the expelled water layer is diluted by the surrounding water molecules at lower temperature.
Effect of TA concentration on Temperature Increase
As described earlier, the loss factor,  becomes predominant in the low frequency region, < 1GHz as the dielectric constant,
  decreases as the temperature is elevated in an ionic solution. The loss factor can be expressed as,
7
where,and

where  and
and  are the relative permittivity at low frequencies (< 1 GHz) and at high frequencies, respectively.
  is the hydration number surrounding the ion, and C is the concentration of the ions.
  is the relaxation time (the time required water molecule to rotate) with the relationship,
  where
where  is viscosity and
  is absolute temperature. The maximum dielectric loss occurs when
  .
.  is the conductivity (SŸcm2).
Since the first term of Eq. [7] represents the static dielectric loss factor, we can assume that  is negligible in the low frequency region of Figure 8b. Then, the entire loss factor
  nearly becomes equivalent to the ionic loss factor
  that is directly proportional to the concentration of CsCl. If this relation is substituted to Eq. [6],
8
As shown in Table 6, the initial rates (ΔT/Δt) are 0.183 and 0.467 at 100 and 250 mg/mL, respectively. The ratio of the rates (ΔT/Δt 250/ ΔT/Δt 100), 2.55 appears to be close to the ratio of the concentrations, 2.5, suggesting that the above Eq. [8] is valid: the rate (ΔT/Δt) of the temperature increase appears to be directly proportional to the ion concentration, and in turn to the ionic loss factor  , and thus the loss factor
  in the frequency region of the measurements.
TA dosage and observed rates at 1.5 cm
| Po (W) | PTA (W) | C (mg/mL) | rateobs (ΔT/Δt, oC/s) |
|---|---|---|---|
| 60 | 40.1 | 100 | 0.183 |
| 60 | 40.1 | 250 | 0.467 |
Effect of Distance on Temperature Increase
The TA agent was placed at various distances (0.5, 1.0, 1.5 and 2.0 cm) and the temperature change was measured upon the application of the microwave energy: 60W, 915MHz for 10 minutes. The temperature readings are shown in Figure 2. The rate of the temperature increase was significantly higher than that of pure water, and shows a similar pattern, i.e., decrease of the rate as the distance increases. The augmentation of the energy by TA at each measured distance is apparent, which is mainly caused by the loss factor of CsCl, especially the ionic loss factor  . A simple rationale for the observed TA's acceleration of the rate can be provided by the behavior of the
  at 915 MHz in Figure 8b. The
  value increases dramatically as temperature rises. Therefore, the CsCl solution is not only effective in initial absorption of the energy at a distance, but also helps increase temperature more rapidly. At 1.5 cm, the temperature profile shows that TA can heat up rapidly and reach over 60 oC within a minute, while temperature increase of pure water remains minimal over 10 minutes. This aspect emphasizes that TA can be useful to target tumor cells located at the outer boundary of a tumor mass normally not reachable by a single antenna under the typical ablation conditions: 60W, 915 MHz, 10 minutes distance 1.5 cm from the antenna.
Thermal behavior of TA at 1.5 cm: 60W, 915 MHz, 10 minutes with 250 mg/mL CsCl)
At 1.5 cm, TA receives 40.1 W of power from the antenna as shown in Table 7. This is a snapshot of the energy distribution at 25 oC. As microwave energy is constantly delivered, the response of TA departs from the control. That is, CsCl, the ionic component of TA, responds by tumbling synchronously to the alternating electric field fueled by its intrinsic dipole moment to generate heat. As described earlier, an ionic solution behavior is largely dependent on the dielectric constant  and the loss factor
  As the temperature rises, the ionic loss factor
  of the TA solution increases the temperature dramatically (Figure 8b). After 10 minutes, the control temperature reaches 32.2 oC at 1.5 cm (46.3 and 64.9 oC at 1.0 and 0.5 cm, respectively) while the TA temperature was measured at 89 oC as shown in Figure 2. The heat generated by TA at 1.5 cm is transferred to the immediate surroundings through conduction to form a circular area; the net result, an extended ablation zone as shown in Figure 9.
Power emitted from antenna (Po) and Power that TA receives (PTA) at various distances
| Po (W) | d (cm) | PTA (W) |
|---|---|---|
| 60 | 0.5 | 52.5 |
| 60 | 1.0 | 45.9 |
| 60 | 1.5 | 40.1 |
A schematic depiction of a typical in vitro microwave ablation with TA (Left) and the temperature profile (right): 60W, 915 MHz, 1.5 cm, [CsCl] of TA = 250 mg/mL, and the ablation duration 10 minutes. The boiling point of pure water at the antenna was assumed.
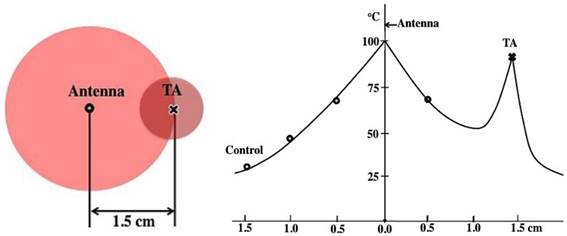
In summary, it has been demonstrated that the TA agent is a superb enhancer of microwave energy using the four parameters: microwave power, CsCl concentrations, frequency, and distance. In microwave ablation, TA can be used to create a thermally asymmetric “hot spot” from a distance that is normally unattainable by a single antenna.
CONCLUSION
Herein we provide an initial description of a novel thermal accelerant that is able to improve the distribution of microwave energy within an in vitro model of thermal ablation. The TA is readily visible under CT imaging, biphasic gel incorporation provides focal anatomical positioning and dose-dependent thermal kinetics, allow for cytotoxic hyperthermia to be achieved and sustained earlier and longer when compared to controls. Follow-up studies using an in vivo porcine model are planned.
COMPETING INTERESTS
The authors have declared that no competing interest exists.
References
1. Poulou LS, Botsa E, Thanou I, Ziakas PD, Thanos L. Percutaneous microwave ablation vs radiofrequency ablation in the treatment of hepatocellular carcinoma. World J Hepatol. 2015;7(8):1054-1063
2. Willatt J, Hannawa KK, Ruma JA, Frankel TL, Owen D, Barman PM. Image-guided in the treatment of hepatocellular carcinoma: A multidisciplinary perspective. World J Hepatol. 2015;7(2):235-244
3. Chu KF, Dupuy DE. Thermal ablation of tumors: biological mechanisms and advances in therapy. Nat Rev Cancer. 2014;14:199-208
4. Younossi ZM, Stepanova M, Afendy M. et al. Changes in the prevalence of the most common causes of chronic liver diseases in the United States from 1988 to 2008. Clin Gastroenterol Hepatol. 2011;9(6):524-530
5. Grandhi MS, Kim AK, Ronnekleiy-Kelly SM, Kamel IR, Ghasebeh MA, Pawlik TM. Hepatocellular carcinoma: From diagnosis to treatment. Surg Oncol. 2016;25(2):74-85
6. Belghiti J, Kianmanesh R. Surgical treatment of hepatocellular carcinoma. HPB (Oxford). 2005;7(1):42-9
7. Mizukoshi E, Yamashita T, Arai K, Sunagozaka H, Ueda T, Arihara F, Kagaya T, Yamashita T, Fushimi K, Kaneko S. Enhancement of tumor-associated antigen-specific T cell responses by radiofrequency ablation of hepatocellular carcinoma. Hepatology. 2013;57:1448-1457
8. Keisari Y, Hochman I, Confino H, Korenstein R, Kelson I. Activation of local and systemic anti-tumor immune responses by ablation of solid tumors with intratumoral electrochemical or alpha radiation treatments. Cancer Immunol Immunother. 2014;63:1-9
9. Lu DS, Yu NC, Raman SS, Limanond P, Lassman C, Murray K. Radiofrequency Ablation of Hepatocellular Carcinoma: Treatment Success as Defined by Histologic Examination of the Explanted Liver. Radiology. 2005;234(3):954-60
10. Lanuti M, Sharma A, Willers H, Digumarthy SR, Mathisen DJ, Shepard JA. Radiofrequency Ablation for Stage I Non-Small Cell Lung Cancer: Management of Locoregional Recurrence. Ann Thorac Surg. 2012;93(3):921-7
11. Correa-Gallego C, Fong Y, Gonen M, D'Angelica MI, Allen PJ, DeMatteo RP. A Retrospective Comparison of Microwave Ablation vs. Radiofrequency Ablation for Colorectal Cancer Hepatic Metastases. Ann Surg Oncol. 2014;21(13):258-264
12. Dodd GD 3rd, Dodd NA, Lanctot AC, Glueck DA. Effect of variation of portal venous blood flow on radiofrequency and microwave ablations in a blood-perfused bovine liver model. Radiology. 2013;267(1):129-36
13. Kim SY, Kim HJ, Lee KE, Han SS, Sohn YS, Jeong B. Reverse thermal gelling PEG-PTMC diblock copolymer aqueous solution. Macromolecules. 2007;40:5519-5525
14. Ninh C, Cramer M, Bettinger CJ. Photoresponsive hydrogel networks using melanin nanoparticle photothermal sensitizers. Biomater Sci. 2014;2(5):766-774
15. Komarov V, Wang S, Tang J. Permittivity and Measurements. In: (ed.) Schweigert BS, Decareau R. Encyclopedia of RF and Microwave Engineering. John Wiley & Sons, Inc. 2005:3693-3711
16. Chaplin M. http://www1.Isbu.ac.uk/water/microwave_water.html
17. Mudgett RE. Dielectric properties of foods. Microwaves in the Food Processing Industry. New York, USA: Academic Press. 1985
18. Roebuck BD, Goldblith SA. Dielectric properties of carbohydrayte-water mixtures at microwave frequencies. J Food Sci. 1972;37:199-204
19. Barba AA, d'Amore M. Relevance of Dielectric Properties in Microwave Assisted Processes. In: Costanzo S, ed. Microwave Materials Characterization. 2012;6:91-118
20. Chen T, Hefter G, Buchner R. Dielectric Spectroscopy of Aqueous Solutions of KCl and CsCl. J Phys Chem A. 2003;107(20):4025-4031
Author contact
![]() Corresponding author: William K C Park, Ph.D. Department of Diagnostic Imaging and Molecular Imaging Program at Rhode Island Hospital/ The Warren Alpert Medical School of Brown University, 55 Claverick St, Room 338, Providence, Rhode Island USA 02903 P: 401-444-5010 Fax: 401-444-8141 Email: William_keun_chan_parkedu.
Corresponding author: William K C Park, Ph.D. Department of Diagnostic Imaging and Molecular Imaging Program at Rhode Island Hospital/ The Warren Alpert Medical School of Brown University, 55 Claverick St, Room 338, Providence, Rhode Island USA 02903 P: 401-444-5010 Fax: 401-444-8141 Email: William_keun_chan_parkedu.