Impact Factor
- Issue 14; 2026
- Issue 13; 2026
- Issue 12; 2026
- Issue 11; 2026
- Issue 10; 2026
- Volume 16; 2026
- Advance Articles
- Past Issues
- Cover Images
- Cover Suggestion
- Index & Coverage
- Special Issues
Introduction
Materials and Methods
Results
Discussion
Abbreviations
Acknowledgements
Conflicts of interest
References
International Journal of Biological Sciences
International Journal of Medical Sciences
 Global reach, higher impact

Theranostics 2017; 7(2):285-294. doi:10.7150/thno.16282 This issue Cite
Research Paper
Visualization, Quantification and Characterization of Caerulein-Induced Acute Pancreatitis in Rats by 3.0T Clinical MRI, Biochemistry and Histomorphology
Ting Yin, Ronald Peeters, Yewei Liu, Yuanbo Feng, Xinyuan Zhang, Yansheng Jiang, Jie Yu, Steven Dymarkowski, Uwe Himmelreich, Raymond Oyen, Yicheng Ni ![]()
Department of Imaging & Pathology, Biomedical Sciences Group, KU Leuven, Herestraat 49, 3000 Leuven, Belgium
Received 2016-5-25; Accepted 2016-7-8; Published 2017-1-1
Abstract

Purpose: To investigate whether Caerulein-induced acute pancreatitis (AP) in rats could be noninvasively studied by clinical magnetic resonance imaging (MRI) techniques and validated by enzymatic biochemistry and histomorphology.
Materials and Methods: The study was approved by the institutional animal ethical committee. The AP was induced in 26 rats by intraperitoneal injections of Caerulein, as compared to 6 normal rats. T2-weighted 3D MRI, T2 relaxation measurement and contrast enhanced T1-weighted MRI were performed at 3 Tesla. Pancreatic volume and contrast ratio of pancreas against surrounding tissues were measured by MRI. Animals were scarified at 3, 8, 24 and 48-hr respectively for analyses of serum lipase and amylase levels, and biliopancreatic perfusion-assisted histomorphology.
Results: The AP could be observed on MRI 3-hr onwards after Caerulein-administration. T2 relaxation within the pancreas was prolonged due to high water content or edema. Increase of vascular permeability was indicated by T1 contrast enhancement. Both edema and vascular permeability gradually recovered afterwards (p<0.05/0.01), paralleled by declining serum enzyme levels (p<0.05). Microscopy revealed cell vacuolization and edema for early stage, and increased inflammatory cell infiltration and acinar cell loss after 24 and 48-hr.
Conclusion: Multiparametric MRI techniques at 3.0T could facilitate noninvasive diagnosis and characterization of Caerulein induced AP in rats, as validated by a novel ex vivo method.
Keywords: MR cholangiopancreatography, acute pancreatitis, Caerulein, rats.
Introduction
Acute pancreatitis (AP) is one of the most common and severe visceral disorders in patients worldwide (1, 2). Apart from laboratory tests, imaging diagnosis provides high sensitivity and specificity in assessing the grades of pancreatitis (3-5). Till now, there is no direct treatment against AP, clinical treatments mainly include aggressive hydration, analgesia and prevention of complications (1, 2, 4, 6). In order to investigate new therapeutic approaches for AP, rodents have been used as animal models for preclinical AP studies since decades ago (7-9), but without in vivo imaging.
Significant differences of the pancreas do exist between humans and rodents in not only their distinct dimensions but also their anatomic structures (10). Thus, clinical imaging techniques such as ultrasound, CT and MR cholangiopancreatography (MRCP) cannot be applied directly to rodent pancreatic imaging. Until now, due to a lack of specific markers, imaging the pancreas as an irregular lobulated organ in rodents remains extremely challenging. In previous studies, volumetric MR measurements were performed in post-mortem rodent models to reveal the anatomical relationship of rodent pancreas against adjacent organs (11, 12). However, in vivo imaging studies directly on rodent pancreas have been greatly hampered by the tiny size of pancreas and random motion artifact within abdomen. In some studies, instead of AP itself, only severe AP-associated renal or liver injuries as AP complications in rats were investigated by using contrast enhanced MRI (13, 14).
Caerulein is a cholecystokinin (CCK)-analogue that may cause acute pancreatitis by stimulating excessive exocrine pancreatic secretion through premature trypsinogen activation inside pancreatic acinar cells (15). Caerulein induced AP in rats is a well-established model in preclinical research, which shows similar structural changes characterized by edema, acinar cell loss and inflammatory cell infiltration, comparable to human AP (16-18). Although Caerulein induced AP has been used for decades in rodent pancreatitis studies and therapeutic investigations, none of those studies involved pancreatic imaging due to the difficulties in visualizing this organ of rodent species by both in vivo imaging and ex vivo dissection (12). Therefore, in this preclinical study, we sought to explore noninvasive MR imaging methods to investigate the Caerulein induced AP in rats, which may pave the path for further translational research using rodent models of pancreatitis.
Since both edema and vascular permeability changes are common features in AP of both rodents and humans (2, 19, 20), based on which imaging diagnoses are made in clinical patients, we chose these two features as the main starting points in our MRI studies. Briefly, in rat models of Caerulein-induced AP, T2 weighted 3D MRI sequences, T2 relaxation calculation and T1 contrast enhanced protocols were adapted for visualization of inflammatory pancreas and measurement of volumetric changes, which were validated by clinical serum indicators for pancreatitis and ex vivo biliopancreatic perfusion-assisted histomorphology.
Materials and Methods
All procedures were approved by the Animal Ethical Committee of our institute, and performed in accordance with the European standards for animal health and welfare.
Experimental design
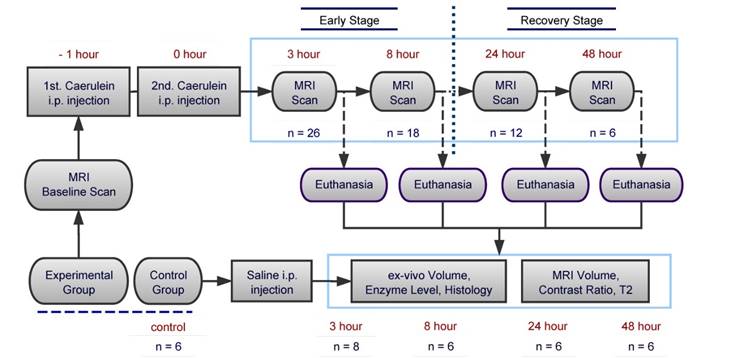
A total of 32 male Sprague-Dawley rats weighted between 300 to 400g were used in this study, 26 for the induction of AP and additional 6 normal rats as saline control group. Animals were maintained on a 12-hour light/dark cycle, and fasted for 5 hours prior to the experiment with free access to water. Experimental groups of animals were divided into 4 time points, which representing 2 stages of AP: 3-hr (n=8), 8-hr (n=6) for early stages, and 24-hr (n=6), 48-hr (n=6) for recovery stages. After baseline MRI scan, AP was induced by two intraperitoneal (i.p.) injections of Caerulein (Sigma-Aldrich, USA) at 50µg/kg with 1-hr interval. At the end of the second injection, animals went through MRI scans at 3, 8, 24 and 48-hr, then scarified at each time point for blood sampling and ex vivo histology exams, as compared to control animals. The overall experimental flow chart is shown in Figure 1.
Flow chart of experimental design for the study on Caerulein-induced acute pancreatitis in rats.
In vivo MRI
A 3.0T clinic MRI scanner (Magnetom Prisma, Siemens, Erlangen, Germany) was used for MR signal transmission, combined with a phase array wrist coil as receiver. MR compatible small animal physiological monitoring system (SA Instruments, Inc., Stony Brook, NY, USA) was applied for respiration gating. Animals were anesthetized by inhalation of isoflurane (mixed with oxygen and air). Two fat saturated T2-weighted 3D turbo spin-echo (TSE) based protocols (SPACE: 3D TSE with variable-flip-angle refocusing RF pulses; MRCP: 3D TSE based heavy T2-weighted MR cholangiopancreatography) with flow compensation were used for in vivo pancreatitis imaging, resulting in 0.39 mm isotropic resolution. To reduce scanning duration, partial-Fourier was applied in the slice-select direction for both 3D TSE protocols, together with parallel imaging acceleration (GRAPPA) approach. Standard 2D multi-echo spin-echo sequence was used to measure T2 relaxation of edematous tissue at early stage of pancreatitis, every second respiration signal was applied to trigger the MRI acquisition. In addition, non-gated T1-weighted 2D BLADE (periodically rotated overlapping parallel lines with enhanced reconstruction) TSE sequence was performed before and immediately after the intravenous injection of Gd-DOTA (Dotarem®, Guerbet, France) at the dose of 0.25 mmol/kg. 2D TSE protocol was localized based on SPACE images. Specific MRI parameters are summarized in table 1.
Detailed parameters for the applied MRI protocols.
| Sequence | SPACE | MRCP | T2 map | T1 BLADE TSE |
|---|---|---|---|---|
| Matrix | 192*192*120 | 198*192*60 | 154*192 | 192*192 |
| Resolution (mm) | 0.39*0.39*0.38 | 0.39*0.39*0.38 | 0.45*0.45*2 | 0.39*0.39*1 |
| Bandwidth (Hz/pixel) | 260 | 347 | 501 | 350 |
| TE (ms) | 134 | 256 | 25: 25: 600 | 45 |
| TR (ms) | 1500 | 2000 | 1500 | 400 |
| Fat saturation | On | On | Off | On |
| Flip angles (degree) | variable | 120 | 180 | 150 |
| Averages | 1.4 | 3.4 | 3 | 300% blade coverage |
| GRAPPA* | 2 | 3 | 2 | 2 |
| 3D Slice resolution | 75% | 50% | - | - |
| Excitation | Non-selective | Slab-selective | - | - |
| Scanning time | 11 min | 5 min 10 s | 6 min | 39 s |
* GRAPPA = Generalized Auto-calibrating Partially Parallel Acquisitions.
Data analysis
Pancreatic edematous regions on MRCP images were semi-automatically segmented by ITK-SNAP (v3.2.0, www.itksnap.org) software (21). After pre-processing using intensity threshold, active contour method with seed points was applied as automatic segmentation step, finally followed by manual correction from a trained user. Pancreatic volume on MRI was automatically calculated from refined segmentation. Sensitivity of pancreatitis tissue on MR images was defined as tissue contrast ratio between pancreas (A) and reference tissues (B: liver, spleen and muscle), and measured as (A-B)/(A+B) (22-24). For T1-weighted TSE images, a region of interest (ROI) of identifiable pancreatic tissue was delineated from post-contrast image, and the same ROI was applied to pre-contrast TSE image for tissue contrast estimation. Signal intensity measurements were performed in MeVisLab (MeVis Medical Solutions, Bremen, Germany). For early stage pancreatitis (3 and 8-hr), pixel-wised T2 map was generated using Matlab software (2014a, MathWorks, Natick, Massachusetts) by applying mono-exponential fitting via Levenberg-Marquardt method (implemented with the function lsqcurvefit).
Histology and biochemical analysis
Immediately after MRI scans for the designated time point, animals were anesthetized with i.p. injection of pentobarbital (Nembutal, Sanofi, Belgium) at a dose of 40 mg/kg. Blood samples were obtained from the inferior vena cava for blood enzyme analysis, with serum separated at 5000 rpm for 10 minutes and stored at - 30̊C until assaying. Animals were euthanized by a lethal dose of pentobarbital after blood draw. The common bile duct (CBD) was distally ligated in close vicinity to duodenal papilla, and pancreatically infused with 600 μl of 0.1% Evans Blue (EB) dye (Sigma-Aldrich, USA) through proximal CBD (10). Blue colored pancreas was then dissected from attachments, and the true pancreatic volume was measured in a graduated cylinder with the 600 μl volume of EB solution deducted. Formalin fixed pancreatic tissue was embedded in paraffin, cut into 5 µm sections and stained with hematoxylin-eosin (HE). Histomorphological changes including edema, cell vacuolization, inflammatory cell infiltration, and acinar cell loss were assessed under light microscope (Axioskop, Zeiss, Oberkoche, Germany) (7, 25). Serum level of lipase and amylase were chosen as pancreatitis indicators, and determined by clinical analyzers (Hitachi, Ltd, Tokyo, Japan). Control animals were i.p. injected with the same amount of normal saline and underwent the same procedures as experimental groups.
Statistical analyses
Data were presented as graphical summaries using the statistical analysis R (v3.1.1, https://cran.r-project.org) software (26). Measures were presented as boxplots, with whiskers defined by first and third quartiles and extreme values outside the whiskers. ANOVA was used for contrast ratio (two-way) and T2 relaxation data (one-way) comparison; enzyme levels and volumetric data multiple comparisons were analyzed with Dunn's test. p value lower than 0.05 was considered to indicate a significant difference. Rank correlation of measured imaging parameters and histologic parameters was analyzed with Spearman's rho test.
Results
Detection of early stage pancreatitis on MRI
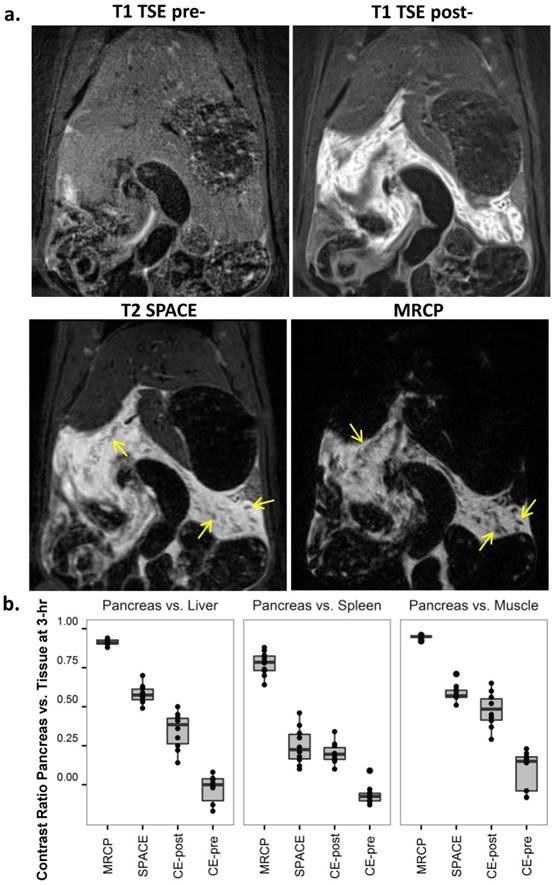
Three hours after the second Caerulein injection, pancreatic edema showed prominent signal on 3D MRCP, SPACE and 2D post-contrast T1 images (Fig. 2a). Hyperintense signal on MRCP and SPACE indicated high water content within the pancreas in rats with Caerulein induced AP, meanwhile pancreatic tissue showed relative hypointense wrapped by hyperintense tissue edema. Pancreatic region could not be identified before contrast agent injection on T1-TSE images, while hyperintense signal on post-contrast images indicated an increased vascular permeability within pancreatic interstitium. The contrast between diseased pancreas and normal liver, spleen and muscle is summarized in figure 2b. A contrast ratio close to 1 indicates the best contrast, while contrast ratio below 0 on pre-contrast TSE images represents a negative contrast due to pancreatic edema. In general, MRCP provided the best contrast for AP compared to other sequences (p<0.001) due to nearly nullified signals elsewhere. Meanwhile, 3D T2 weighted SPACE provided the best structural information within rat abdomen, which can be used as anatomical reference for the images with other sequences, whereas, 2D contrast enhanced images more specifically reveal the inflammatory pancreas exclusive of adjacent water-containing small intestines.
MRI diagnosis of acute pancreatitis (AP) at 3-hr after the induction of AP. a. MRI images: AP was indiscernible on baseline 2D T1-TSE image (upper left), but strongly enhanced after Gd-DOTA injection (upper right); T2 weighted SPACE (lower left) and 3D MRCP (lower right) clearly detected pancreatic edema as hyperintense regions, and pancreatic tissue showed relative hypointense wrapped by tissue edema (arrows). b. Contrast ratio between pancreas and reference tissues of the liver (left), spleen (mid) and muscle (right) after 3-hr of AP. MRCP provided the best contrast over the other sequences (p<0.001), while pre-contrast TSE images represented a negative contrast for pancreatic edema.
Development of acute pancreatitis within 8 hours
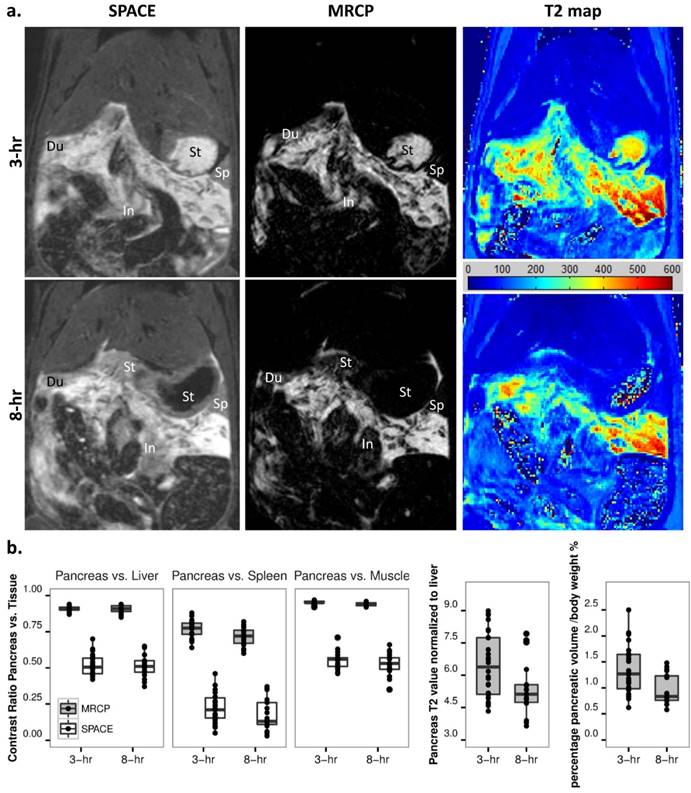
Early stage AP was monitored at 3 and 8-hr after pancreatitis induction. The pancreatic edema was gradually recovering at 8 hours compared to 3-hr after AP, as shown on MRCP images and calculated T2 maps (Fig. 3a). The boundaries between pancreas and surrounding gastrointestinal organs (e.g. duodenum, stomach and small intestines) could be more easily identified on MRCP compared with SPACE. The absorption of edema at 8-hr resulted in an ambiguous signal between small intestines and pancreas on SPACE images, suggesting that MRCP could provide better segmentation during early stage AP. Statistical outcomes of contrast ratios for the pancreas indicate a significant signal drop on MRCP data at 8 hours (Fig. 3b, p<0.01). To reduce variations among individuals and different scans, pancreatic T2 relaxation was normalized to the T2 value of liver, while pancreatic volume normalized to animal body weight. Both normalized T2 relaxation and segmented MRCP volume decreased from 3- to 8-hr (Fig. 3b, p<0.05 and p<0.01).
Development of acute pancreatitis within 8 hours. a. T2 MRI images: the extension of pancreatic edema gradually reduced at 8-hr (lower) compared to 3-hr (upper) after AP induction, as shown on SPACE (left), 3D MRCP (mid) and T2 maps (right). The boundaries between pancreas and surrounding gastrointestinal organs were clearer on MRCP compared to SPACE, especially after 8-hr of AP. Du: duodenum, In: small intestines, Sp: spleen, St: stomach. b. Statistical outcomes: an overall decrease of contrast ratio for pancreas on MRCP indicates a significant signal drop (p<0.01), meanwhile normalized T2 relaxation and pancreatic volume decreased after 8-hr of AP induction (p<0.05 and p<0.01).
Recovery of acute pancreatitis
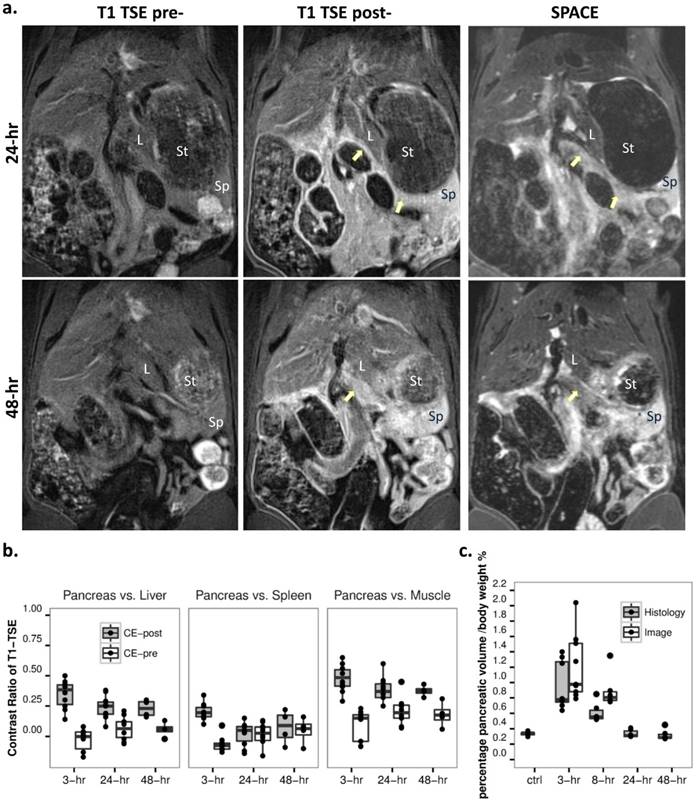
After 24 hours of Caerulein induced AP, most of pancreatic edematous fluid was absorbed (Fig. 4a). By tracking the pancreatic landmarks (common bile duct, splenic vein, etc.) and comparing signal from surrounding solid organs on 3D SPACE images, only portions of pancreatic body and tail above the splenic vein could be identified. No structural difference was noticed on SPACE images for both 24-hr and 48-hr recovery stages. Similar to early stage AP, pancreas could not be recognized before contrast injection on T1-weighted images. Comparing to 3-hr onset of AP, a significant reduction of contrast enhancement was observed on T1-weighted MRI at recovery stages (Fig. 4b, p<0.01). While the contrast from pancreatic tissue could still be visible relative to the liver and muscle, there is a poor boundary between the spleen and pancreatic tail, as shown on MR images and contrast ratio measurements. No further change within the pancreas was observed after 24 hours both on SPACE and contrast enhanced images.
a. Recovery stage of acute pancreatitis at 24 (upper) and 48 hours (lower). While AP was undetectable on precontrast T1-weighted TSE (left), inflammation could be detected by contrast enhanced T1 TSE (mid), as reflected by decreased pancreatic edema on SPACE (right). L: liver, Sp: spleen, St: stomach. b. Contrast ratio for pancreas over liver (left), spleen (mid) and muscle (right) on contrast enhanced T1-weighted images indicated a significant signal reduction at recovery stages as compared to 3-hr of AP (p<0.01). c. Normalized pancreatic volume reached a maximum after 3-hr of AP, gradually recovered afterwards, and returned to the basal level after 48-hr of AP induction as shown on ex vivo measurements. In addition, the corresponding segmented MRCP volume at early stage AP indicated an overestimation at 8-hr (p<0.05).
Pancreatic volume changes throughout acute pancreatitis
Ex vivo pancreatic volume was normalized to animal body weight (ml/100g body weight), and compared with the normalized volume acquired from MRCP images. Data of normal pancreas were used as control group for pancreatic volume measurement on ex vivo analysis. From our measurements, pancreatic volume reached a maximum after 3-hr of AP induction, and decreased gradually at 8-hr on both MRCP and ex vivo analysis (Fig. 4c). Due to the loss of signal within the pancreas at recovery stages, the volume based on edematous pancreas on MRCP was not available, while the EB dye assisted ex vivo measurements indicated that pancreatic edema was fully recovered to the basal level after 48 hours of AP induction. There is no significant difference between volume measured by the two methods at 3-hr of AP, however the MRCP segmented volume was greater than the volume from ex vivo analysis at 8-hr of AP (p<0.05).
Enzyme level and histology analysis throughout acute pancreatitis
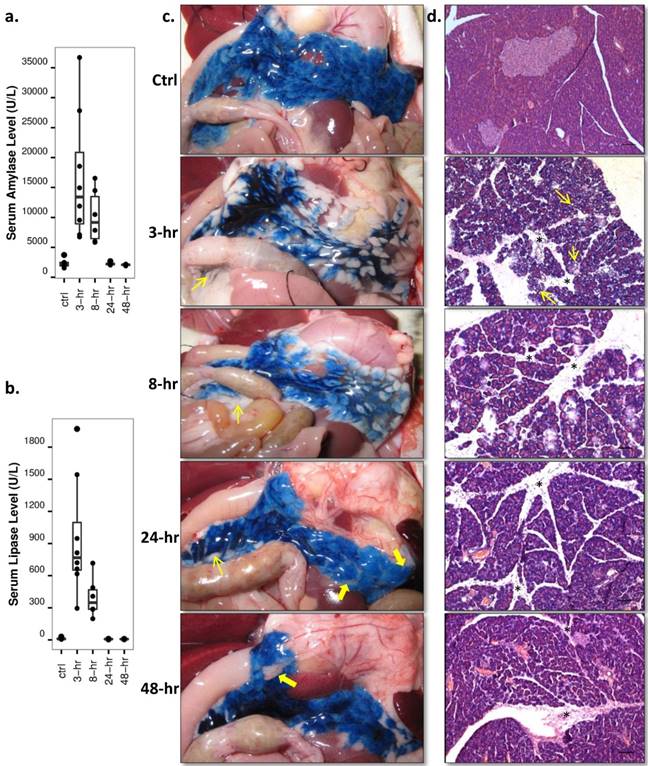
Both serum amylase and lipase levels were raised rapidly during the first 3-hr of AP, gradually decreased afterwards and reverted to basal level at recovery stages (Fig. 5a, 5b, p<0.01 and p<0.05). Pancreatic tissue could be recognized after opening the animal at early stage AP due to the pancreas enlargement. Over-excreted transparent jelly-like fluid was wrapped by the pancreatic capsule. In normal rats and rats at recovery stage AP, the pancreas was anatomically interleaved with the peritoneum and abdominal adipose tissue. Pancreatic infusion of EB dye clearly demarcated the pancreatic from other soft tissues and surrounding organs, as shown on digital photos (Fig. 5c). Heterogeneous distribution of EB dye within the pancreas after 3-hr and 8-hr AP implied a high pressure in the pancreatic ductal system and pancreatic edema. Microscopic examinations with hematoxylin-eosin staining (Fig. 5d) revealed severe edema during early stage AP, which manifested as acinar cell swelling and expansion of interlobular septa. Intracellular vacuolization spread through the entire pancreas at 3-hr of AP, and inflammatory cell infiltration predominated at 8-hr onwards. At recovery stages of AP, the distance of interlobular septa and the size of acinar cells returned nearly to basal level, while cell infiltration accumulation remained up until 48-hr. Acinar cell loss was observed at recovery stages as well.
Enzyme level and histology analysis throughout acute pancreatitis. a, b: Serum levels: significantly increased serum amylase and lipase levels were observed at 3-hr and 8-hr of AP relative to the control and recovery stage levels (p<0.01 and p<0.05). c: Digital photos of Evans blue (EB) infused pancreas: pancreas could be easily identified after local EB infusion, interleaved with surrounding peritoneum (thin arrows) and abdominal adipose tissue (thick arrows). Apparent pancreatic edema could only be seen at 3-hr and 8-hr of AP. d: Microscopic histology: acinar cell swelling and interlobular septa expansion dominated at early stage AP, with intracellular vacuolization (thin arrows) spread through the entire pancreas at 3-hr. Inflammatory cell infiltration (stars) and acinar cell loss were most sever during recovery stages. Scale bar: 100 µm.
Correlation between imaging findings and histological parameters during early stage pancreatitis
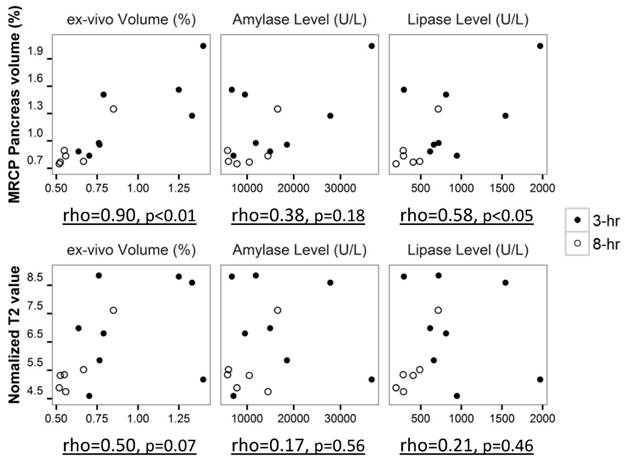
The correlation of pancreatic volume measurements, T2 values and histological parameters during early stage AP was performed with Spearman's rho test (Fig. 6). Pancreatic volume measured from MRCP was strongly correlated with the volume obtained from ex vivo analysis (rho=0.90, p<0.01). A positive correlation between serum lipase level and pancreatic volume on MRCP was observed as well (rho=0.58, p<0.05). Less positive correlation was noticed between pancreatic T2 values and histological parameters, however, the correlation was not statistically significant (p>0.05) due to limited sample size.
Correlation plot of pancreatic volume on MRCP and pancreatic T2 value to histological parameters during early stage pancreatitis, shown with Spearman's rho value and significant level.
Discussion
This study describes the detectability of Caerulein-induced AP in rats by multiparametric MRI using a 3.0T clinical scanner. Both T2 weighted MRI and contrast enhanced T1 protocols were investigated, correlated to clinical enzymatic indicators and histomorphology. Although rat models of Caerulein-induced AP have been widely used in pre-clinical studies, the minute dimension of rat pancreas has hampered the biomedical imaging research on this organ. To our knowledge, this is the first time that inflammatory changes within rodent pancreas has been clearly recorded with MR imaging techniques, which may render a new experimental platform for translational research on this organ.
Since MRI techniques including MRCP, fat suppressed T2 weighted sequences and contrast enhanced T1 imaging were well developed and used as routine screening for AP in clinic practice (5, 27), protocols modified from clinic database were chosen as references for our pre-clinical research. However, technical adaptations are apparently needed when a 3.0T human magnet is used for pancreatic imaging in rats. Our adapted heavily T2 weighted 3D TSE is similar to clinical 3D MRCP sequence (28, 29). With the clinical MRCP, the changes in biliopancreatic ductal system can be clearly detected without any post-procedural complications. The techniques applied in our study was adjusted to rodent pancreatic imaging with the potential application for common bile duct evaluation similar to that in previous studies (30, 31). In clinic, isotropic resolution allows 3D post-processing of all data with maximum intensity projections (MIP), multiplanar reconstructions (MPRs) and volume rendering. However, rather than a solid organ of human pancreas, rat pancreas is a soft organ with irregular shape and the dimension of pancreatic duct is too small to be reflected on 3D MIP with different MPRs. Since MPR is not our purpose, partial Fourier in slice-encoding direction was applied for 3D acquisition, which decreased the resolution in slice-encoding direction while kept the minimal slice thickness. Small slice thickness on 3D acquisition helped improve the accuracy for pancreatic volume estimation. Long TE (600-1000 ms) is widely used in clinical MRCP, but in our study TE of 256 ms was applied to avoid loss of SNR and motion artifact raised from long echo train. Besides, TE of 256 ms already provided a good contrast for static fluid within rat abdomen (Fig. 2, Fig. 3). To ensure T1-weighting in contrast enhanced protocols, respiration gating was not applied for T1-TSE sequences; instead, oversampled BLADE radial reconstruction was used to eliminate motion artifacts (32).
In our study, 3D MRCP still lacked the sensitivity for recovery stage AP. On the other hand, high-resolution SPACE sequence retained the ability to locate the region of pancreatic tissue under the guidance of anatomical landmarks. Meanwhile, 2D contrast enhanced protocol applied after SPACE images provided information about pancreatic vascular permeability, although the pancreas could be captured only on limited number of slices.
Although pancreatic volume obtained from in vivo 3D MRCP was strongly positively correlated with the volume from ex vivo measurement (Fig. 6), overestimation of pancreatic volume in MRCP occurred when the outcomes were compared (Fig. 4c). Since the small intestine and free water content in abdominal cavity showed similar signals to that from pancreatic edema on heavily T2 weighted images, manual correction for pancreas segmentation on 3D MRCP images could induce subjective mistakes. On the contrary, contrast enhanced T1 TSE images reflected the extravasation of the contrast agent from pancreatic vasculature to its interstitium, which appeared to be a more reliable marker for pancreatitis on MRI. However it was difficult to have a complete view for the entire pancreas on 2D images due to the limited thickness of the pancreas in rats. Combining the segmentation using ITK-SNAP software and manual correction, the pancreatic volume measured from MRCP appeared consistent throughout the entire study, which can be considered as a reasonable volume index for early stage AP.
For ex vivo analyses, section of entire pancreas was a challenge before as there is a lack of clear boundary between the pancreas and other visceral organs, whether diseased or not. It was difficult to obtain a clear-cut resection of rodent pancreas without losing some of its tissues, especially for pancreatic head portion. This problem has now been tackled by intra-pancreatic infusion of EB dye, which ideally ensured the accurate excision of the pancreas and subsequent volume measurements as demonstrated by this study.
As for AP model, most of the studies use 7 hourly repeated intraperitoneal (i.p.) injections (33, 34) or continuous infusion of Caerulein (8, 9) to reach a maximal severity of Caerulein induced AP. While for induction of edematous AP, two i.p. injections with 1-hr intervals at a supramaximal concentration as adopted in our study would be enough to reach a maximal stimulation after 3 hours (16). However, a heterogeneous damage within pancreas was observed both on microscopy and calculated T2 maps (Fig. 3, Fig. 5d), which placed 3D overview imaging diagnosis to a more important position in this model. One limitation of our study is the lack of capability to indicate acinar cell loss by MRI, since acinar cell loss is an important pathological feature of AP and can be assessed only by microscopic analysis in this preclinical model. The lack of statistically significant correlation between MRI-derived severity parameters and serum enzymatic levels appears similar to that of reported clinical scenarios (1, 2).
To summarize, in addition to previously introduced 3D MRI visualization of normal pancreas (12) and pancreatic head tumor (35), here, we described the rat model of Caerulein-induced acute pancreatitis as well as the in vivo and ex vivo experiments by using multiparametric MRI for qualitative and quantitative assessment of this model as a potential platform for further translational theranostic research.
Abbreviations
AP: acute pancreatitis; BLADE: commercial name of periodically rotated overlapping parallel lines with enhanced reconstruction (PROPELLER) in Siemens Medical Solutions; CBD: common bile duct; EB: Evans Blue; GRAPPA: generalized auto-calibrating partially parallel acquisitions; HE: hematoxylin-eosin; i.p.: intraperitoneal; MRI: magnetic resonance imaging; MRCP: MR cholangiopancreatography; ROI: region of interest; SPACE: 3D turbo spin-echo with variable-flip-angle refocusing RF pulses; TSE: turbo spin-echo.
Acknowledgements
This study was partially supported by the grants awarded by the KU Leuven Molecular Small Animal Imaging Center MoSAIC (KUL EF/05/08) and KU Leuven the center of excellence In vivo Molecular Imaging Research (IMIR). The corresponding author Ni Y is currently a Bayer Lecture Chair holder.
Conflicts of interest
The authors declare no conflict of interest.
References
1. Lankisch PG, Apte M, Banks PA. Acute pancreatitis. Lancet. 2015;386:85-96
2. Tenner S, Baillie J, DeWitt J, Vege SS. American College of Gastroenterology guideline: management of acute pancreatitis. Am J Gastroenterol. 2013;108:1400-1415
3. Banks PA, Freeman ML. Practice guidelines in acute pancreatitis. Am J Gastroenterol. 2006;101:2379-2400
4. Working Party of the British Society of Gastroenterology, Association of Surgeons of Great Britain and Ireland, Pancreatic Society of Great Britain and Ireland, Association of Upper GI Surgeons of Great Britain and Ireland. UK guidelines for the management of acute pancreatitis. Gut. 2005;54(Suppl 3):iii1-9
5. Bharwani N, Patel S, Prabhudesai S, Fotheringham T, Power N. Acute pancreatitis: the role of imaging in diagnosis and management. Clin Radiol. 2011;66:164-175
6. Wu BU, Hwang JQ, Gardner TH. et al. Lactated Ringer's solution reduces systemic inflammation compared with saline in patients with acute pancreatitis. Clin Gastroenterol Hepatol. 2011;9:710-717.e1
7. Schmidt J, Lewandrowsi K, Warshaw AL, Compton CC, Rattner DW. Morphometric characteristics and homogeneity of a new model of acute pancreatitis in the rat. Int J Pancreatol. 1992;12:41-51
8. Lampel M, Kern HF. Acute interstitial pancreatitis in the rat induced by excessive doses of a pancreatic secretagogue. Virchows Arch A Pathol Anat Histol. 1977;373:97-117
9. Watanabe O, Baccino FM, Steer ML, Meldolesi J. Supramaximal caerulein stimulation and ultrastructure of rat pancreatic acinar cell: early morphological changes during development of experimental pancreatitis. Am J Physiol. 1984;246(4 Pt 1):G457-G467
10. Kara ME. The anatomical study on the rat pancreas and its ducts with emphasis on the surgical approach. Ann Anat. 2005;187:105-112
11. Paredes JL, Orabi AI, Ahmad T. et al. A Non-Invasive Method of Quantifying Pancreatic Volume in Mice Using Micro-MRI. PLoS One. 2014;9:e92263
12. Yin T, Coudyzer W, Peeters R. et al. Three-dimensional contrasted visualization of pancreas in rats using clinical MRI and CT scanners. Contrast Media Mol Imaging. 2015;10:379-387
13. Dang SC, Zeng YH, Wang P jiang. et al. Clodronate-superparamagnetic iron oxide-containing liposomes attenuate renal injury in rats with severe acute pancreatitis. J Zhejiang Univ Sci B. 2014;15:556-565
14. Zhang J-X, Dang S-C, Zhang Y. et al. MRI shows clodronate-liposomes attenuating liver injury in rats with severe acute pancreatitis. Hepatobiliary Pancreat Dis Int. 2010;9:192-200
15. Lüthen R, Owen RL, Sarbia M, Grendell JH, Niederau C. Premature trypsinogen activation during cerulein pancreatitis in rats occurs inside pancreatic acinar cells. Pancreas. 1998;17:38-43
16. Yamaguchi H, Kimura T, Mimura K, Nawata H. Activation of proteases in cerulein-induced pancreatitis. Pancreas. 1989;4:565-571
17. Rongione A, Kusske A, Kwan K, Ashley S, Reber H, McFadden D. Interleukin 10 reduces the severity of acute pancreatitis in rats. Gastroenterology. 1997;112:960-967
18. Peter Hegyi, George Perides, Michael L. Steer E. Commonly Employed Rodent Models of Experimental Acute Pancreatitis: Their Strengths and Weaknesses, Relevance to Human Disease, Selection, and Appropriate Use. The Pancreapedia. 2013 doi: 10.3998/panc.2013.4
19. Sweiry J, Mann G. Pancreatic microvascular permeability in caerulein-induced acute pancreatitis. Am J Physiol. 1991;261:G685-692
20. Abe T, Shimosegawa T, Satoh A. et al. Nitric oxide modulates pancreatic edema formation in rat caerulein-induced pancreatitis. J Gastroenterol. 1995;30:636-642
21. Yushkevich PA, Piven J, Hazlett HC. et al. User-guided 3D active contour segmentation of anatomical structures: significantly improved efficiency and reliability. Neuroimage. 2006;31:1116-1128
22. Thickman D, Hendrick RE, Jerjian KA, Schanker CS. Liver-lesion tissue contrast on MR images: effect of iron oxide concentration and magnetic field strength. Radiology. 1990;176:557-562
23. Cornfeld DM, Israel G, McCarthy SM, Weinreb JC. Pelvic imaging using a T1W fat-suppressed three-dimensional dual echo Dixon technique at 3T. J Magn Reson Imaging. 2008;28:121-127
24. Rosenkrantz AB, Patel JM, Babb JS, Storey P, Hecht EM. Liver MRI at 3 T using a respiratory-triggered time-efficient 3D T2-weighted technique: Impact on artifacts and image quality. Am J Roentgenol. 2010;194:634-641
25. Muftuoglu MAT, Isikgor S, Tosun S, Saglam A. Effects of probiotics on the severity of experimental acute pancreatitis. Eur J Clin Nutr. 2006;60:464-468
26. R Core Team. R: A Language and Environment for Statistical Computing. Vienna, Austria: R Foundation for Statistical Computing. 2015
27. Hecht E. Magnetic Resonance Imaging of Acute Pancreatitis. Imaging of the Pancreas. 1st ed. Heidelberg: Springer-Verlag. 2009:79-104
28. Nandalur KR, Hussain HK, Weadock WJ. et al. Possible biliary disease: diagnostic performance of high-spatial-resolution isotropic 3D T2-weighted MRCP. Radiology. 2008;249:883-890
29. Sodickson A, Mortele KJ, Barish MA, Zou KH, Thibodeau S, Tempany CMC. Three-dimensional fast-recovery fast spin-echo MRCP: comparison with two-dimensional single-shot fast spin-echo techniques. Radiology. 2006;238:549-559
30. Ernst TM, Schwinge D, Raabe N. et al. Imaging of the murine biliopancreatic tract at 7 tesla: Technique and results in a model of primary sclerosing cholangitis. J Magn Reson Imaging. 2013;40:1355-1364
31. Tabibian JH, Macura SI, O'Hara SP. et al. Micro-computed tomography and nuclear magnetic resonance imaging for noninvasive, live-mouse cholangiography. Lab Invest. 2013;93:733-743
32. Finkenzeller T, Zorger N, Kühnel T. et al. Novel application of T1-weighted BLADE sequences with fat suppression compared to TSE in contrast-enhanced T1-weighted imaging of the neck: Cutting-edge images? J Magn Reson Imaging. 2013;37:660-668
33. Yamagiwa T, Shimosegawa T, Satoh A, Kimura K, Sakai Y, Masamune A. Inosine alleviates rat caerulein pancreatitis and pancreatitis-associated lung injury. J Gastroenterol. 2004;39:41-49
34. Lugea A, Nan L, French SW, Bezerra JA, Gukovskaya AS, Pandol SJ. Pancreas recovery following cerulein-induced pancreatitis is impaired in plasminogen-deficient mice. Gastroenterology. 2006;131:885-899
35. Yin T, Peeters R, Feng Y. et al. Characterization of a rat orthotopic pancreatic head tumor model using three-dimensional and quantitative multi-parametric MRI. NMR in Biomedicine. 2016 in press. doi: 10.1002/nbm.3676
Author contact
![]() Corresponding author: Yicheng Ni MD, PhD. Department of Radiology, University Hospitals, KU Leuven, Herestraat 49, 3000 Leuven, Belgium. Email: yicheng.nikuleuven.be. Tel: +32 16 33 01 65 Fax: +32 16 34 37 65
Corresponding author: Yicheng Ni MD, PhD. Department of Radiology, University Hospitals, KU Leuven, Herestraat 49, 3000 Leuven, Belgium. Email: yicheng.nikuleuven.be. Tel: +32 16 33 01 65 Fax: +32 16 34 37 65