Impact Factor
- Issue 14; 2026
- Issue 13; 2026
- Issue 12; 2026
- Issue 11; 2026
- Issue 10; 2026
- Volume 16; 2026
- Advance Articles
- Past Issues
- Cover Images
- Cover Suggestion
- Index & Coverage
- Special Issues
Introduction
Methods
Results
Discussion and Summary
Abbreviations
Acknowledgements
References
Author Biographies
International Journal of Biological Sciences
International Journal of Medical Sciences
 Global reach, higher impact

Theranostics 2017; 7(1):196-204. doi:10.7150/thno.16899 This issue Cite
Research Paper
3-D Ultrasound Localization Microscopy for Identifying Microvascular Morphology Features of Tumor Angiogenesis at a Resolution Beyond the Diffraction Limit of Conventional Ultrasound
Fanglue Lin, Sarah E. Shelton, David Espíndola, Juan D. Rojas, Gianmarco Pinton, Paul A. Dayton ![]()
Joint Department of Biomedical Engineering, University of North Carolina at Chapel Hill and North Carolina State University, Chapel Hill, North Carolina, USA.
Received 2016-7-19; Accepted 2016-10-2; Published 2017-1-1
Abstract

Angiogenesis has been known as a hallmark of solid tumor cancers for decades, yet ultrasound has been limited in its ability to detect the microvascular changes associated with malignancy. Here, we demonstrate the potential of 'ultrasound localization microscopy' applied volumetrically in combination with quantitative analysis of microvascular morphology, as an approach to overcome this limitation. This pilot study demonstrates our ability to image complex microvascular patterns associated with tumor angiogenesis in-vivo at a resolution of tens of microns - substantially better than the diffraction limit of traditional clinical ultrasound, yet using an 8 MHz clinical ultrasound probe. Furthermore, it is observed that data from healthy and tumor-bearing tissue exhibit significant differences in microvascular pattern and density. Results suggests that with continued development of these novel technologies, ultrasound has the potential to detect biomarkers of cancer based on the microvascular 'fingerprint' of malignant angiogenesis rather than through imaging of blood flow dynamics or the tumor mass itself.
Keywords: Angiogenesis, super-resolution, ultrasound localization microscopy, microbubble contrast agent, acoustic angiography, biomarker.
Introduction
Early detection of disease is universally important for diagnostics and successful therapy. In solid tumors, the presence of angiogenesis has been recognized as an early hallmark of cancer for several decades [1,2]. Vessel structural abnormalities are known to reveal disease in very early stage, even after the introduction of tens of cells to the tissue [3,4]. These abnormalities can be resolved, or normalized, after positive response to treatment [5,6]. Despite this knowledge, we have been unable to utilize imaging tools to directly assess changes in microvascular morphology associated with angiogenesis as a biomarker clinically because relevant imaging modalities do not have the sensitivity and/or resolution to assess the microvascular structure associated with small tumors.
Traditional grayscale ultrasound imaging is not very sensitive to blood flow in small vessels. For this reason, ultrasound contrast agents (UCA) have been developed. These contrast agents can be administered intravenously to improve blood contrast in an imaging exam, and are FDA approved for use in cardiac and liver imaging in the United States, and are used even more extensively for other clinical applications in Europe and Asia. UCA are gas-filled encapsulated microbubbles, typically with mean diameter less than 5 µm, which oscillate and scatter energy in an ultrasound field, and thus can be detected with high sensitivity by an imaging system. Various techniques have been investigated to improve the quality of contrast enhanced ultrasound imaging [7-13]. All these techniques utilize the specific responses of microbubbles to ultrasound waves. The resolution of classic ultrasound imaging is limited by the wavelength of the transmitted pulse, the aperture of the transducer, the imaging depth and the beamforming algorithm used [14]. Microbubbles appear as a point spread function (PSF) of the ultrasound system in an image, thus substantially degrading imaging resolution despite the micron-size of the bubbles themselves.
Within these vascular imaging techniques, super-harmonic contrast ultrasound imaging has been utilized to image microvasculature in-vivo non-invasively. This approach, also called acoustic angiography because of image similarity to x-ray angiography, enables visualization of microvascular morphology in-vivo with resolution on the order of 150 microns at 1.5 cm [15]. Data from acoustic angiography studies have shown that microvascular morphology abnormalities associated with tumor-induced angiogenesis can be detected for tumors as small as 2-3 millimeters, and can be used to differentiate between tumor bearing tissue and healthy tissue [13,16-19]. These findings support the concept that detection and analysis of microvascular changes due to tumor angiogenesis could be utilized as a cancer biomarker. Furthermore, angiogenesis biomarker imaging could be accomplished with low-cost, safe, and portable ultrasound technology. Super-harmonic imaging based acoustic angiography takes advantage of the unique superharmonic signal from microbubbles and a high-resolution ultrasound receiver to enable visualization of microvessel patterns and differentiation from surrounding tissue [15]. Nevertheless, this technique still suffers from the resolution limit of ultrasound imaging and the compromise between resolution and imaging depth. These limitations prevent current ultrasound imaging approaches from resolving details of microvascular networks where vessels are below approximately 100 microns, even with advanced contrast ultrasound techniques such as super-harmonic imaging.
Recently, researchers in the medical ultrasound domain have made effort to mimic the revolutionary technology of optical localization microscopy [20,21]. Optical localization microscopy exploits the stochastic blinking of specific fluorescent sources and localizes the center of each separable source. By accumulating these center positions over thousands of acquisitions, the resulting image achieves a ten-fold resolution improvement and enables imaging of cell membranes and small organelles [22]. In the medical ultrasound domain, different techniques have been investigated to achieve an ultrasound super resolution image, using contrast agent microbubbles as an acoustic equivalent of these fluorescent sources. Some groups used highly diluted contrast agents to meet the key requisite of separable microbubbles detection [23,24]. Although these groups obtained super-resolved images using conventional ultrasound scanners, the long acquisition time necessary to perform diluted microbubble super resolution imaging is likely to impinge upon its practicality. Tanter's group used ultrafast acquisition and spatiotemporal filter to separate microbubbles from a high concentration, by exploiting the decorrelation of microbubbles from a stack of images [25,26]. This technique is a direct analog to FPALM in optics and the acquisition time is more reasonable for clinical translation. By localizing the centers of separable scattering microbubbles, this ultrasound localization microscopy (ULM) technique enables imaging of microvessels at resolutions as small as ten micrometers, over an order of magnitude smaller than the ultrasound diffraction limit. Super-resolved vasculature maps of rat brain slices using ULM technique have been shown in previous studies [26], although an application to tumor-associated angiogenesis has not yet been demonstrated.
We hypothesize that the paradigm-shift of ultrasound localization microscopy enabled by high-frame rate imaging systems provides a new opportunity to image microvessels involved in tumor angiogenesis. In this pilot, we demonstrate that ultrasound localization microscopy can achieve similar vessel morphology data as acoustic angiography, yet with improved spatial resolution. Since microvascular morphology analysis requires assessment of microvascular structure within a tissue volume, we customize a programmable research ultrasound system to perform the ULM technique in 3 dimensions through synchronization with a mechanical scanning system. We then obtain 3D images of microvascular architecture from healthy rats and tumor-bearing rats noninvasively. Data are analyzed quantitatively and compared to super-harmonic imaging based acoustic angiography. Data illustrate a substantial improvement in imaging resolution over traditional acoustic angiography and analysis of vascular morphology suggests that 3D ULM based acoustic angiography should have the ability to differentiate healthy from diseased tissue, based on the high-resolution imaging of microvascular morphology alone.
Methods
In order to validate improvements in resolution via the ULM technique, in vitro studies were first conducted using simulated vessels from thin-walled polycarbonate microtubes (Paradigm Optics Inc., WA, USA) with inner diameters of 150 µm, 75 µm and 50 µm. The imaging system and parameters for the in-vitro study were the same as those used for in vivo study.
In vivo studies were conducted on female Fischer 344 rats (approximately 200 g, Charles River Laboratories, Durham, NC). Animal studies were approved by the University of North Carolina Institutional Animal Care and Use Committee. Tumor-bearing rats were implanted with subcutaneous fibrosarcoma (FSA; originally provided by the laboratory of Dr. Mark Dewhirst) tumors in the right flank region and were imaged after the tumor had grown larger than 0.5 cm in each axis. Healthy rats of the same species, age and sex were used as control rats and were imaged at the same anatomic location as tumor-bearing rats. Imaging was performed after anesthetizing the rats with vaporized isoflurane and placing them on a warming stage to maintain body temperature. The right flank was shaved and depilated to remove the hair, and ultrasound gel was applied to couple the transducer to the skin. Microbubbles were infused through a 24-gauge tail-vein catheter at the rate of 1×10⁸ bubbles/min, with the aid of an infusion pump (Harvard Apparatus, Holliston, Mass).
Lipid-encapsulated microbubble contrast agents containing decafluorobutane (SynQuest Labs, Alachua, FL, USA) were prepared as described previously [27], resulting in a polydisperse size distribution of contrast agents with a mean diameter of 0.9 μm and a concentration of 1×10¹⁰ bubbles per milliliter. Specifically, the bubbles were prepared with a 9:1 molar mixture of 1,2-distearoyl-sn-glycero-3-phosphocholine (DSPC, Avanti Polar Lipids, Alabaster, AL, USA) and 1,2-distearoyl-sn-glycero-3-phosphoethanolamine-N-[methoxy(polyethylene glycol)-2000] (mPEG-DSPE, Creative PEGWorks, Winston Salem, NC, USA) in phosphate buffered saline containing 15% (v/v) propylene glycol and 5% (v/v) glycerol. The lipid solution was then agitated with a Vialmix mixer (Bristol-Myers Squibb Medical Imaging, North Billerica, MA, USA) to create microbubbles.
Imaging was performed using a Verasonics Vantage system (Verasonics Inc., Redmond, WA, USA) with a L11-5 linear probe, using plane-wave imaging at a pulse repetition frequency of 500 Hz. The transmitted pulses were 1 cycle sinusoids at 4.5 MHz with a rarefactional pressure of 220 kPa (mechanical index = 0.1). This low mechanical index was chosen to minimize bubble destruction under high frame rate insonification. The transducer was mounted to a motorized precision motion stage synchronized with the imaging system for 3D scanning. 8,000 images were acquired for each scan slice and slice step size was 200 µm. Although ideally a smaller step size would have enabled superior volumetric reconstruction, elevational sampling was sacrificed in order to keep the imaging time less than 35 minutes, in order to limit the anesthesia and infusion time. IQ data were saved for post-processing. All rats were also imaged with traditional super-harmonic imaging based acoustic angiography technique [15,16] for comparison. Traditional acoustic angiography images were acquired by a Vevo 770 ultrasound scanner (VisualSonics, Toronto, ON, CA) with a modified transmit 4 MHz/receive 25 MHz dual-frequency transducer operating at a MI of 0.6, as previously described by Shelton et al [16].
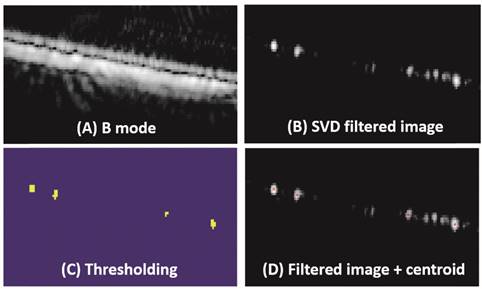
ULM images were obtained through offline post-processing on beamformed IQ data. For in vivo studies, frames with breathing induced motion artifacts were excluded by calculating the frame-to-frame cross-correlation of a chosen region of tissue signals. A high-pass spatiotemporal singular value decomposition (SVD) filter was applied. The decorrelation of bubbles was detected, yielding individual sources on the filtered images. This spatiotemporal filter can discriminate bubble signals whose spatial coherence is low from tissue signals whose spatial coherence is high because their temporal variations affect many neighboring pixels the same way [28]. Hysteresis thresholding was used to localize the bubbles on the filtered images. Bubble centers were detected and center positions from all the frames were accumulated to get a ULM image, with a pixel size of 10 µm × 10 µm, for each scan slice. An experimental test using the same imaging system parameters with a wire target (data not shown) indicated that position error of the localization process (resolution limit) was about 3.3 μm × 3.3 µm. However, a pixel size of 10 µm × 10 µm was chosen because the smaller pixel size required a larger number of separable events to be detected to reconstruct the vasculature map, therefore longer acquisition time would be needed. Regardless, 10 μm is more than a tenfold resolution increase of traditional ultrasound imaging and approaches capillary size, we hypothesize it would be more than sufficient for resolving tumor microvasculature. The ULM process is described in Figure 1, with in vitro data from microtubes.
Bubble detection process. (A) Acquired beamformed B mode image. (B) Image after using a spatiotemporal filter to remove static and slow-moving signals. (C) Localized microbubbles using hysteresis thresholding. (D) Detected bubble center position superposed on a filtered image.
To verify the ability of ULM technique to differentiate healthy tissue and tumors, vascular tortuosity was measured from 3D ULM images acquired from three controls and three tumor-bearing rats. Individual vessels were firstly segmented using the Aylward/Bullitt centerline extraction algorithm with manually defined seed points [29]. This algorithm uses dynamic-scale ridge traversal method to segment and extract the centerline of tubular objects. Vascular tortuosity was then calculated for each vessel, using the distance metric (DM) [30], which is defined as the total path length of a vessel, divided by the Euclidean distance between vessel endpoints. The DM has a minimum value of 1 for a straight vessel and increases as the vessel deviates from straight. The statistical significance was measured by unpaired student t-test with three rats in each group.
Results
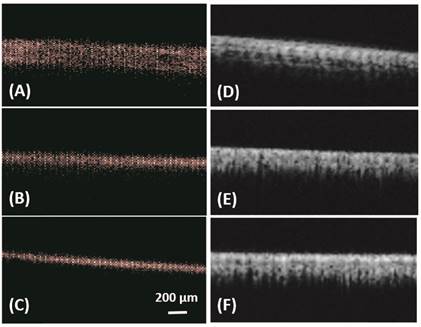
Figure 1 illustrates the bubble detection process. In vitro results from microtubes, with inner diameters of 150 µm, 75 µm and 50 µm, are shown in Figure 2 and Table 1. All the three microtubes were measured as 171 µm in B mode imaging, because the transmitted frequency of 4.5 MHz yields an axial resolution limit of 171 µm and all three microtubes were below this resolution limit. However, they were resolved with ULM, with measured diameter of 140 µm, 65 µm and 40 µm, respectively. Figure 2 also shows the super-harmonic images of the three microtubes for visual comparison. The in vitro experimental results demonstrate the ability of the ULM technique to resolve objects below the resolution limit of traditional ultrasound imaging.
In vitro: ULM images (A-C) and super harmonic images (D-F) of microtubes with inner diameter of 150 µm (A, D), 75 µm (B, E) and 50 µm (C, F). Bar = 200 µm.
Comparison of measured tube size with B mode imaging and ULM technique.
| Actual (µm) | B mode Imaging | ULM | ||
|---|---|---|---|---|
| Measured Size (µm) | Error (%) | Measured Size (µm) | Error (%) | |
| 150 | 171 | 14 | 140 | 6.7 |
| 75 | 171 | 128 | 65 | 14 |
| 50 | 171 | 242 | 40 | 20 |
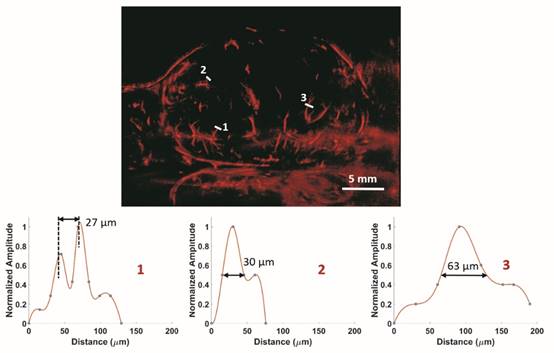
In vivo results from a 2D slice of a rat FSA tumor are shown in Figure 3, illustrating detection of vessels with diameters between 25 µm and 175 µm. Cross-sections of several vessel profiles, indicated by lines 1 to 3, are also shown in Figure 3. The full-width at half-maximum was measured as the vessel diameter size. A branching vessel profile (profile 1) shows two vessels at a distance of 27 µm can be separated. However, some artifacts are present in Figure 3. These artifacts come from the low signal to noise ratio (SNR) of our imaging system and transmit settings. Therefore, some noise signals are included during the bubble identification process. Although transmitting pulses of higher pressure and more cycles can increase the image SNR, these conditions also lead to microbubble deterioration. A complete 3D ULM image (maximum intensity projection from all the ULM image slices) is displayed in Figure 4C and compared with traditional acoustic angiography images acquired from the same rat tumor. The number of detected events per tumor plane ranges from tens of thousands to hundreds of thousands. It is difficult to compare the two types of images in exactly the same orientation, because they come from different imaging system and different probes. Therefore, the traditional acoustic angiography images are oriented in sagittal anatomic plane and coronal anatomic plane for easier comparison. The arrows with the same numbers indicate the same vessels detected by both techniques. The minimum detected vessel size inside the tumor was approximately 25 µm, while the resolution limit of traditional acoustic angiography with a 25 MHz receiver at approximately 1.5 cm is on the order of 150 µm. Hence, ULM readily resolves more small vessels inside the tumor, compared with traditional acoustic angiography imaging. Figure 5 presents 3D ULM images of the subcutaneous region of the right flank from two healthy (control) rats and two rats with subcutaneous tumors. Vessel density and morphological differences are readily apparent between healthy and control tissue.
In vivo: ULM images of a 2D slice of a rat FSA tumor and cross-section profiles of three vessels with different size. Bar = 5 mm.
In vivo: Maximum intensity projection through three-dimensional acoustic angiography image data (A, B) and three-dimensional ULM image (C) of a same rat FSA tumor. The resulting two-dimensional images are orientated in the sagittal anatomic plane (A) and coronal anatomic plane (B) for acoustic angiography and in the sagittal anatomic plane (C) for the ULM image. Bar = 4 mm.

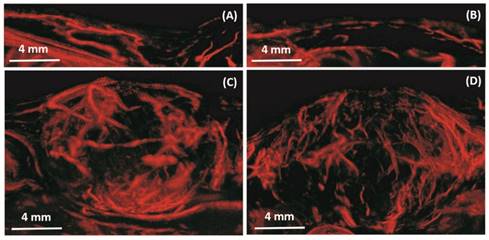
In vivo: Maximum intensity projection through three-dimensional ULM image data for four rats. The resulting two-dimensional images are orientated in the sagittal anatomic plane. Vessel density and morphological differences are obvious between the control rats (A, B) and tumor rats (C, D). Bar = 4 mm.
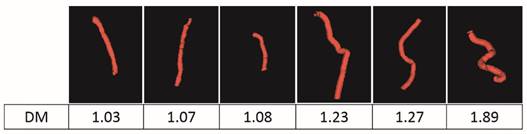
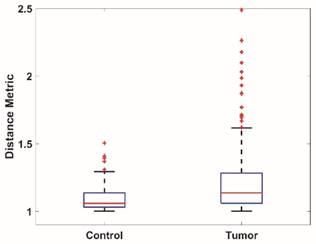
To quantitatively analyze the difference of vessel tortuosity between control rats and tumor-bearing rats, three control rats and three tumor-bearing rats were imaged at the same anatomic location (subcutaneous region of the right flank) and microvessel morphology was compared. The total number of vessels analyzed were 379, with 113 vessels extracted from control rats and 266 vessels extracted from tumor-bearing rats. The distance metric was calculated for each segmented vessel. To intuitively show how the microvessel morphology yields the tortuosity metric, six extracted vessels with different morphology and their corresponding DM values were presented in Figure 6. Box plots of distance metric for the two animal types are shown in Figure 7 and a summary of the tortuosity values are shown in Table 2. An unpaired student t-test shows the tortuosity was significantly higher for the tumor rat population than for the control rat population, with p < 0.01 (Figure 7). The mean and standard deviation of the DM values of all the control vessels was 1.106 ± 0.115, whereas the tumor vessels had higher DM values of 1.279 ± 0.529, representing an increase of 15.64%. The mean intra-animal variability is the average intra-animal variability across all animals within the population. The relative intra-animal variability was calculated by normalizing intra-animal variability with the mean tortuosity value and is expressed as a percentage. The intra-animal variation was 0.110 and 0.580 for control and tumor rats, which corresponds to a relative deviation of 9.79% and 44.01%, respectively, indicating the tumor vascular network is more heterogeneous than the normal vascular network.
Six extracted vessels and their corresponding tortuosity metric values.
Box plots of the vessel tortuosity (Distance metric) of images from the control rat population and tumor-bearing rat population.
Summary of tortuosity for control and tumor-bearing rats.
| Control | Tumor | |
|---|---|---|
| Maximum | 1.505 | 6.655 |
| Minimum | 1.002 | 1.001 |
| Mean | 1.106 | 1.279 |
| Median | 1.059 | 1.136 |
| Intra-population variability | 0.115 | 0.529 |
| Mean intra-animal variability | 0.110 | 0.580 |
| Mean relative intra-animal variability | 9.79% | 44.01% |
Discussion and Summary
In this study, we presented in vivo images of tumor angiogenesis using 3-D ultrasound localization microscopy for the first time. Quantitative analysis of vascular networks extracted from 3D ULM images indicates the potential ability of this technique to distinguish healthy from diseased tissue, therefore examining tumor associated microvascular angiogenesis. Ultrasound localization microscopy can resolve very small vessels inside the tumor, and all tumor-bearing rats had significant increase of the vessel tortuosity and a higher degree of vascular heterogeneity, compared with vessels in the control rats. These vascular changes presented in tumors agree with the observations by super-harmonic based acoustic angiography [13,16] and other imaging modalities such magnetic resonance angiography [3]. Such ultra-high resolution imaging of microvascular morphology is a paradigm shift in the capabilities of an ultrasound system, largely enabled by advances in processing hardware. Although the ultrasound system utilized here was a programmable research system, it is quite reasonable that commercial systems would be able to perform this kind of imaging in the clinic in the near future.
However, there are several significant limitations of this study. First, the imaging time required to acquire ULM images is long, compared with acoustic angiography or traditional ultrasound imaging. To reconstruct a super-resolved vasculature map, a large number of frames is necessary to capture more bubbles flowing in the vessels. Our study used a frame rate of 500 Hz and acquired 8,000 images for each slice, therefore, imaging one slice needs 26s (16s for data acquisition and 10s for data save). A complete 3D scan of typical sized rat tumors (0.5 cm to 1.5 cm) requires imaging time from 11 minutes to 33 minutes, when a step size of 200 µm is used. It is beneficial to acquire more images for each slice because the resolution of ULM depends on the number of bubbles detected. Errico et al. 2015 used 78,000 images (150s) for a brain cortex single slice with 3.5mm depth, and 10 minutes of acquisition for a whole brain coronal slice with 11.6 mm depth [26]. Their impressive image data suggests they detect many more events than us, leading to more resolved microvessels. However, note that they imaged in a physiologic location where the entire vessels could be visualized in a single plane. This single plane approach would not enable volumetric analysis of cancer-associated malignancy, which is highly spatially heterogeneous. Second, a compromise exists between the scan step size and imaging time. Imaging with smaller scan step can capture more elevational spatial information, however, in order to limit the anesthesia time and contrast infusion volume with the in-vivo study, we kept the imaging time less than 35 minutes. However, the frame rate could be increased substantially with appropriate hardware, further speeding the acquisition time.
Another drawback lies in the post-processing stage. First, frames with breathing induced motion artifacts were excluded in our study. Although this did effectively avoid interference of bubble positions from moving frames, 20%-30% frames were lost during this process. Second, the hysteresis thresholding method was used to localize bubbles. The thresholding values need to be appropriate because a too high threshold value can exclude some low intensity bubbles while a too low threshold value may include some unwanted noise signal. Improved motion correction and detection algorithms will ameliorate these limitations.
Finally, our capability to measure tortuosity metrics was limited by the fact that the imaging technique is challenged to detect vessels in the elevational plane and our step size in this plane is larger than with traditional acoustic angiography. This fact likely limited our sensitivity to microvessel morphology. Indeed, differences between microvessel tortuosity between healthy and tumor-bearing tissue appeared more substantial in previously published works using traditional acoustic angiography [13,16]. This is a more significant challenge for 3D ULM, which may be resolved by 2D matrix transducers or other methods to image in the elevational plane. We were also not able to effectively calculate the sum of angles metric due to challenges in the data format. The sum of angles metric is more sensitive to high frequency tortuosity differences in malignant angiogenesis than distance metric, and has previously shown to be a stronger differentiator than the distance metric in characterizing malignant angiogenesis [13]. Further studies will incorporate this analysis as well.
Considering the long imaging time, detecting as many vessels as possible in each slice within limited imaging time becomes crucial. The relationship between imaging parameters like bubble size, bubble concentration, transmitted wave energy, transmitted frequency and the final tumor ULM image quality needs to be studied.
Nevertheless, the performance of ULM for super resolution imaging of angiogenesis as a biomarker is encouraging, and the utility of this diagnostic tool will no doubt play more of a role in theranostics over the next decade.
Abbreviations
ULM: ultrasound localization microscopy; UCA: ultrasound contrast agents; FSA: fibrosarcoma; SVD: singular value decomposition; DM: distance metrics; SNR: signal to noise ratio.
Acknowledgements
This work was supported by grants R01CA170665, R01CA189479, R44CA165621, and T32HL069768 from the National Institutes of Health.
Competing Interests
Paul A. Dayton is an inventor on a patent describing the superharmonic acoustic angiography technology mentioned here (although not ULM which this paper is focused on), and a co-founder of SonoVol, Inc., a company which has licensed the patent enabling acoustic angiography.
References
1. Folkman J. Tumor angiogenesis. Adv Cancer Res. 1974;19:331-358
2. Hanahan D, Weinberg RA. The Hallmarks of Cancer. Cell. 2000;100:57-70
3. Bullitt E, Lin NU, Ewend MG. et al. Tumor therapeutic response and vessel tortuosity: preliminary report in metastatic breast cancer. Med Image Comput Comput Assist Interv. 2006;9:561-8
4. Li CY, Shan S, Huang Q. et al. Initial stages of tumor cell-induced angiogenesis: evaluation via skin window chambers in rodent models. J Natl Cancer Inst. 2000;92:143-7
5. Bullitt E, Ewend M, Vredenburgh J. et al. Computerized assessment of vessel morphological changes during treatment of glioblastoma multiforme: Report of a case imaged serially by MRA over four years. Neuroimage. 2009;47:T143-T151
6. Jain RK 1. JRN of tumor vasculature: A emerging concept in antiangiogenic therapy. S (80-) 2005; 307: 58-62. Normalization of tumor vasculature: An emerging concept in antiangiogenic therapy. Science (80- ). 2005;307:58-62
7. Bouakaz A, Frigstad S, Ten Cate FJ. et al. Super harmonic imaging: a new imaging technique for improved contrast detection. Ultrasound Med Biol. 2002;28:59-68
8. Forsberg F, Shi WT, Goldberg B. Subharmonic imaging of contrast agents. Ultrasonics. 2000;38:93-98
9. Simpson DH, Chin CT, Burns PN. Pulse inversion Doppler: a new method for detecting nonlinear echoes from microbubble contrast agents. IEEE Trans Ultrason Ferroelectr Freq Control. 1999;46:372-82
10. Pasovic M, Danilouchkine M, Faez T. et al. Second harmonic inversion for ultrasound contrast harmonic imaging. Phys Med Biol. 2011;56:3163
11. Lin F, Cachard C, Mori R. et al. Ultrasound Contrast Imaging: Influence of Scatterer Motion in Multi-pulse Techniques. IEEE Trans Ultrason Ferroelectr Freq Control. 2013;60:2065-2078
12. Eckersley RJ, Chin CT, Burns PN. Optimising phase and amplitude modulation schemes for imaging microbubble contrast agents at low acoustic power. Ultrasound Med Biol. 2005;31:213-219
13. Gessner RC, Aylward SR, Dayton PA. Mapping microvasculature with acoustic angiography yields quantifiable differences between healthy and tumor-bearing tissue volumes in a rodent model. Radiology. 2012;264:733-40
14. Szabo TL. Diagnostic Ultrasound Imaging: Inside Out. 2004.
15. Gessner RC, Frederick CB, Foster FS. et al. Acoustic angiography: A new imaging modality for assessing microvasculature architecture. Int J Biomed Imaging. 2013;2013:936593
16. Shelton SE, Lee YZ, Lee M. et al. Quantification of microvascular tortuosity during tumor evolution using acoustic angiography. Ultrasound Med Biol. 2015;41:1896-1904
17. Rao SR, Shelton SE, Member S. et al. The 'Fingerprint' of cancer extends beyond solid tumor boundaries: assessment with a novel ultrasound imaging approach. IEEE Trans Biomed Eng. 2016;63:1082-1086
18. Shelton SE, Lindsey BD, Tsuruta JK. et al. Molecular acoustic angiography: A new technique for high-resolution superharmonic ultrasound molecular imaging. Ultrasound Med Biol. 2016;42:769-781
19. Lindsey BD, Shelton SE, Foster FS. et al. Assessment of Molecular Acoustic Angiography for Combined Microvascular and Molecular Imaging in Preclinical Tumor Models. Mol Imaging Biol. 2016:1-9
20. Betzig E, Patterson GH, Sougrat R. et al. Imaging intracellular fluorescent proteins at nanometer resolution. Science. 2006;313:1642-1645
21. Rust MJ, Bates M, Zhuang XW. Sub-diffraction-limit imaging by stochastic optical reconstruction microscopy (STORM). Nat Methods. 2006;3:793-795
22. Huang B, Babcock H, Zhuang X. Breaking the diffraction barrier: Super-resolution imaging of cells. Cell. 2010;143:1047-1058
23. Christensen-Jeffries K, Browning RJ, Tang M-X. et al. In vivo acoustic super-resolution and super-resolved velocity mapping using microbubbles. IEEE Trans Med Imaging. 2015;34:433-440
24. O'Reilly MA, Hynynen K. A super-resolution ultrasound method for brain vascular mapping. Med Phys. 2013;40:110701
25. Desailly Y, Couture O, Fink M. et al. Sono-activated ultrasound localization microscopy. Appl Phys Lett. 2013;103:174107
26. Errico C, Pierre J, Pezet S. et al. Ultrafast ultrasound localization microscopy for deep super-resolution vascular imaging. Nature. 2015;527:499-502
27. Feingold S, Ryan G, Ismayil M G. et al. Quantitative volumetric perfusion mapping of the microvasculature using contrast ultrasound. Invest Radiol. 2010;45:669-674
28. Demene C, Deffieux T, Pernot M. et al. Spatiotemporal clutter filtering of ultrafast ultrasound data highly increases Doppler and fUltrasound sensitivity. IEEE Trans Med Imaging. 2015;34:2271-85
29. Aylward SR, Bullitt E. Initialization, noise, singularities, and scale in height ridge traversal for tubular object centerline extraction. IEEE Trans Med Imaging. 2002;21:61-75
30. Bullitt E, Gerig G, Pizer SM. et al. Measuring tortuosity of the intracerebral vasculature from MRA images. IEEE Trans Med Imaging. 2003;22:1163-1171
Author Biographies
 Dr. Fanglue Lin received her B.S. degree and M.S. degree, both in biomedical engineering, from Southeast University in China. She received her Ph.D. degree from Institut National des Sciences Appliquées de Lyon (INSA-Lyon) in France, where her research activities focused on ultrasound nonlinear propagation and ultrasound contrast imaging techniques. She joined Dayton lab at University of North Carolina at Chapel Hill in 2015 as a post-doctoral researcher. Her current interests are ultrasound super resolution imaging and ultrasound molecular imaging.
 Sarah E. Shelton obtained her M.S. degree in Environmental Sciences and Engineering from the Gillings School of Global Public Health at the University of North Carolina. She is currently a graduate student in the Joint Department of Biomedical Engineering at the University of North Carolina and North Carolina State University, and her research focuses on characterizing the vascular structure of tumors using ultrasound.
 Dr. David Espíndola earned his Ph. D. degree in Physics from the University of Santiago de Chile (USACH), Chile, where he worked on acoustics applied to granular material. He is currently a Post-Doc at the University of North Carolina at Chapel Hill, USA. His current research interest are; the linear and nonlinear shear wave propagation in soft tissue, and the design of novel ultrasound sequences for the development of quantitative images.
 Juan D. Rojas obtained his B.S. degree in biomedical engineering from the University of North Carolina in 2012. He joined the Dayton lab in 2013 and is pursuing a Ph.D. from the University of North Carolina and North Carolina State University Joint Department of Biomedical Engineering. His research includes the development of technologies for the use of phase change contrast agents to assess disease progression and evaluate response to therapy.
 Gianmarco Pinton is an Assistant Professor in the Joint Department of Biomedical Engineering at the University of North Carolina at Chapel Hill and North Carolina State University. His research interests are in non-conventional diagnostic ultrasound imaging, nonlinear wave propagation, and shear shock waves and brain injury.
 Paul A. Dayton is Professor of Biomedical Engineering and Associate Chair in the Joint Department of Biomedical Engineering at the University of North Carolina at Chapel Hill and North Carolina State University, Associate Director of the Biomedical Research Imaging Center, and member of the Lineberger Comprehensive Cancer Center. His research interests involve ultrasound contrast imaging, ultrasound-mediated therapies, and medical devices.
![]() Corresponding author: Paul A. Dayton, padaytonunc.edu.
Corresponding author: Paul A. Dayton, padaytonunc.edu.