Impact Factor
- Issue 14; 2026
- Issue 13; 2026
- Issue 12; 2026
- Issue 11; 2026
- Issue 10; 2026
- Volume 16; 2026
- Advance Articles
- Past Issues
- Cover Images
- Cover Suggestion
- Index & Coverage
- Special Issues
Introduction
Materials and Methods
Results and discussion
Conclusion
Supplementary Material
Acknowledgements
References
International Journal of Biological Sciences
International Journal of Medical Sciences
 Global reach, higher impact

Theranostics 2017; 7(1):164-179. doi:10.7150/thno.17099 This issue Cite
Research Paper
Smart Cu(II)-aptamer complexes based gold nanoplatform for tumor micro-environment triggered programmable intracellular prodrug release, photodynamic treatment and aggregation induced photothermal therapy of hepatocellular carcinoma
Da Zhang1,2, Aixian Zheng1,2, Juan Li4, Ming Wu1,2, Lingjie Wu1,2, Zuwu Wei1,2, Naishun Liao1,2, Xiaolong Zhang1,2, Zhixiong Cai1,2, Huanghao Yang4, Gang Liu5, Xiaolong Liu1,2 ![]() , Jingfeng Liu1,2,3
, Jingfeng Liu1,2,3 ![]()
1. The United Innovation of Mengchao Hepatobiliary Technology Key Laboratory of Fujian Province, Mengchao Hepatobiliary Hospital of Fujian Medical University, Fuzhou 350025, P. R. China;
2. The Liver Center of Fujian Province, Fujian Medical University, Fuzhou 350025, P. R. China;
3. Liver Disease Center, The First Affliated Hospital of Fujian Medical University, Fuzhou 350005, P. R. China;
4. The Key Lab of Analysis and Detection Technology for Food Safety of the MOE, Fujian Provincial Key Laboratory of Analysis and Detection Technology for Food Safety, College of Chemistry, Fuzhou University, Fuzhou 350002, P.R. China;
5. Center for Molecular Imaging and Translational Medicine, Xiamen University, Xiamen, 361005, P. R. China.
Received 2016-8-3; Accepted 2016-10-7; Published 2017-1-1
Abstract

This study describes smart Cu(II)-aptamer complexes based gold nanoplatform for tumor micro-environment triggered programmable prodrug release, in demand photodynamic therapy and aggregation induced photothermal ablation of hepatocellular carcinoma. The nanoplatform is consist of monodispersed gold nanoparticle (GNP) that is binding to HCC cell specific targeting aptamers (TLS11a) through Au-S bond; the aptamer is labeled with Ce6 at the 5'end and coordinated with Cu(II) through (GA)10 repeating bases to load AQ4N at the 3' end. In normal physiological conditions, the fluorescence and ROS generation ability of Ce6 are quenched by GNPs via RET; but in cancerous cells, the fluorescence and the ROS generation of Ce6 could be recovered by cleavage of Au-S bond through high level of intracellular GSH for real-time imaging and in demand PDT. Meanwhile, the prodrug AQ4N release could be triggered by acid-cleavage of coordination bonds, then accompanied by a release of Cu(II) that would induce the electrostatic aggregation of GNPs for photo-thermal ablation; furthermore, the significantly enhanced chemotherapy efficiency could be achieved by PDT produced hypoxia to convert AQ4N into AQ4. In summary, here described nanoplatform with tumor cell specific responsive properties and programmable PDT/PTT/chemotherapy functions, might be an interesting synergistic strategy for HCC treatment.
Keywords: programmed synergistic therapy, Cu(II)-aptamer complexes, hypoxia induced chemotherapy, tumor micro-environment response, PDT and aggregation induced PTT.
Introduction
Hepatocellular carcinoma (HCC) is the fifth most common lethal cancer worldwide1,2. Hypoxia micro-environment is one of the most important nature of HCC that caused by shortage of blood circulation due to the disorganized vasculature inside the growing solid tumors.3,4 Hypoxia could significantly induce a survival response in affected cells and then cause the radiotherapy and chemotherapy resistant of tumor cells 3,4. However, the hypoxia character of tumor could be smartly utilized as a compelling therapeutic target for HCC treatment since the levels of hypoxia are more severe in tumors than most of the normal tissues.1,2,4 Banoxantrone (di-N-oxide of 1,4-bis[2-(dimethyllaminoethyl-amino]5,8-dihydro xyanthracene-9, 10-dione, AQ4N) is one of the di-N-oxide antitumor prodrug, and the only topoisomerase II inhibitor under clinical investigation.5-8 It shows little intrinsic cytotoxicity in aerobic conditions, but exhibits strong antitumor activity in hypoxic environment through selectively bio-reducing to alkylaminoa-nthraquinone metabolite AQ4; some evidences have suggested that the reduction of none-toxic AQ4N into toxic AQ4 could be significantly improved by further enhance the local hypoxia level of tumor through applying of pharmacological vascular “steal” agent or vascular occlusion by using clamping.5,7,9 Coincidentally, photodynamic therapy (PDT) was an oxygen-dependent therapeutic modality; it could aggravate the hypoxia within local tumor regions via continuous oxygen (O2) consumption by photosensitizer (PS), and generate reactive oxygen species (ROS) induced tumor cell apoptosis and necrosis simultaneously under the adaptive laser irradiation.10 Chlorin e6 (Ce6) has been widely applied for PDT, due to its relatively rapid elimination from the body, high singlet oxygen generation efficiency, and could activated by NIR light; furthermore, the existence of carboxy makes it suitable for further conjugation or modification 11. Nevertheless, the potential photo-toxicity of Ce6 which generates ROS could nonspecifically damage the vascular system and normal tissues once exposed to the sun light, can make serious side effects in patients including burn, swelling and pain.12 Recently, stimuli-responsive drug delivery system (DDS) has captured extensive attentions due to their finely controllable response to external or tumor micro-environment stimulus, which could significantly reduce adverse effects and enhance their anti-cancer efficiency.12-17 To utilize the nature of tumor micro-environment, considerable efforts have been made to develop tumor micro-environment responsive strategies for cancer therapy, such as the redox-responsive DNA nano-hydrogels,18 the ATP-triggered Dox / Duplex nano-vehicles,19 the acid-degradable polymer nano-carriers,20,21 the enzymatic-mediated peptide / MSN nano-system22 and hypoxia-responsive nano-carrier system17, which were demonstrated the enhanced anticancer efficacy and reduced side effects to normal tissues. However, only few reported strategies have achieved for the programmable synergistic treatment of cancer to overcome the shortages of a single therapeutic modality. Therefore, development of drug delivery system (DDS) with tumor cell specific targeting ability and tumor micro-environment responsive property is essential to improve the drug pharmacokinetic efficiency and enhance the synergistic antitumor effects with minimizing the side effects of PDT to normal tissues. 11,12
Aptamer is structured single-stranded DNA or RNA molecule with specific recognition abilities to its target. It is a promising targeting element for drug delivery applications due to its small size, synthetic accessibility, thermal stability, specific binding and easy with chemical modifications.23, 24 Meanwhile, it not only could serve as a targeting element for nano-carrier design, but also could serve as drug carrier itself for controlled drug release (e.g. DOX).25-27
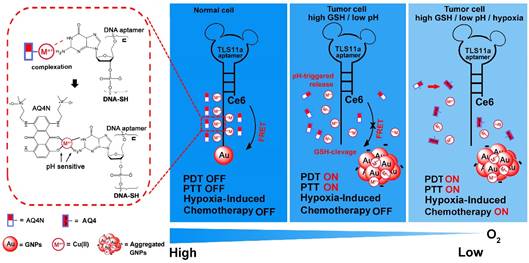
Herein, we prepared an innovative “host-metal-guest” architecture, which is consist of Ce6 labelled aptamer (TLS11a) binding to gold nanoparticle through Au-S bond with (GA)10 repeating bases at the 3'end to serve as the carrier of AQ4N through Cu(II) coordination (refer as AQ4N-Cu(II)-AptCe6-GNPs), for programmable intracellular AQ4N release, in demand PDT and aggregation induced PTT that triggered by tumor micro-environment in HCC (Scheme 1). In normal physiological conditions, the fluorescence signal and the ROS generation ability of our proposed nanoprobe (AQ4N-Cu(II)-AptCe6-GNPs) was effectively quenched by gold nanoparticles (GNPs) through RET. In tumor cells, the fluorescence and the ROS generation ability of our nanoprobe could be recovered for NIR imaging and PDT, due to the release of GNPs through cleaving Au-S bond by high level of intracellular GSH; the AQ4N also could be quickly released by acid cleavage of the “Cu(II)-aptamer” and “Cu(II)-AQ4N” coordination bond due to the low pH level of tumor cells and its lysosomes, accompanied by free Cu(II) release which then could induce the aggregation of GNPs for PTT; furthermore, switching on PDT would produce significant enhanced hypoxia in tumors to improve the chemotherapy efficacy by increasing the reduction of AQ4N into AQ4. Taken together, the designed nanoplatform is suitable for the combination of in demand PDT, aggregated induced PTT and subsequently programmable chemotherapy for synergistic cancer treatment.
Schematic view of the preparation and functional principle of the AQ4N-Cu(II)-AptCe6-GNPs. (GA)10 repeating base is coordinated with Cu(II) through NH2 and N7 to guest AQ4N via C=O and C-O bonds. In normal cells, the fluorescence and ROS generation was quenched by GNPs via RET and would be in “OFF” state due to normal level of redox. In cancerous cells, an activated fluorescence signal was recovered by cleavage of Au-S through high intracellular redox agent for real-time detection and in demand PDT. Meanwhile, AQ4N release was triggered by acid-cleavage of “aptamer-Cu(II)” and “Cu(II)-AQ4N” coordination bonds, and this is accompanied by a release of Cu(II) that could induce the electrostatic aggregation of GNPs for photo-thermal therapy (PTT). Furthermore, the toxicity of AQ4N reduce to AQ4 is enhanced by the “on” state of PDT which induces hypoxia condition in cancerous cells to achieve the synergistic PDT / PTT / chemotherapy by single laser irradiation.
Materials and Methods
Materials
Hydrogen tetrachloroaurate (HAuCl4), N-hydroxysuccinimide ester (NHS), and N-(3-dimethylaminopropyl)-N-ethylcarbodiimide hydrochloride (EDC) were purchased from Sigma-Aldrich. MitoXpress Kit was purchased from Cayman Chemical Company. Sodium citrate tribasic dehydrates and copper chloride Dihydrate were purchased from J&K Scientific. Deionized water with a resistivity of 18.2 M Ω·cm was obtained from a Milli-Q Gradient System (Millipore, Bedford, MA, U.S.) and was used for all experiments. All oligonucleotides were synthesized by Sangon Biotech Company and purified using reversed phase HPLC. Unless specified, all other chemicals were commercially available and used as received.
Cell Culture
HepG2 cells (hepatocellular carcinoma), LO2 cells and HeLa cells (human cervical epithelioid carcinoma) were purchased from ATCC (Manassas, VA). All cells were cultured in RPMI 1640 medium (ATCC, Manassas, VA) supplemented with 10% FBS and 100 IU/mL penicillin-streptomycin (Cellgro, Manassas, VA).
Preparation of Chlorin e6 labeled aptamer ( TLS11a, AptCe6-SH)
First, both 5' end amine and 3' thiol modified ssDNA strands (aptamer “TLS11a”, NH2-(C6)-ACAGCATCCCCATGTGAACAATCGCATTGTGATTGTTACGGTTTCCGCCTCATGGACGTGCTG(GA)10-(C3)-SH) were synthesized by Sangon Biotech Company and purified using reversed phase HPLC. Then, the equimolar of N-hydroxysu succinimide ester (NHS), dicyclohexyl carbodiimide (DCC) and Chlorin e6 (Ce6) were dissolved in anhydrous DMF in the dark for 30 min. Afterwards, the activated Ce6 was added into aptamers in NaHCO3 at pH 7.0 by vigorously stirring overnight in the dark. The unconjugated Ce6 was then removed by ethanol precipitation of DNA, and repeated for four times to get the AptCe6-SH. Quantification of the conjugated DNA and Ce6 was done by measuring the absorbance at 260 nm by Nanodrop 2000 (Thermo Scientific) and 402 nm by SpectraMax M5 (Molecular Devices), respectively. The standard curve has a very good linear relation with Ce6 from the concentration of 1-25 μg/mL (Y = 0.0471X + 0.0468, R2 = 0.9978).
Preparation of AQ4N-Cu(II)-AptCe6-GNPs
According to previous reports, 100 μL of AptCe6-SH (15 μM, in 5 mM of HEPES buffer) was added into solution of GNPs (10 nM), and the molar ratio of AptCe6-SH and GNPs was 150 to 1. Afterwards, the mixture was incubated at room temperature for 24hrs, and then 20 μL of 500 mM NaCl solution was added into 1 mL mixture to start a salt aging process through incubation for 24hrs.29,30 Then, the conjugated AptCe6-GNPs were collected by centrifugation at 14000 rpm/min for 20 min and washed three times with DI-water. The amount of conjugated AptCe6-SH was determined by measuring the supernatant absorbance of AptCe6-SH at 402 nm (SpectraMax M5, Mo lecular Devices) when the AptCe6-GNPs were co-incubated with DTT (10 mM) for 12hrs, and the result was shown that 0.993 μM of AptCe6 could be loaded on the surface of each 10 nM of GNPs. Next, the copper chloride dihydrate (200 μM, pH 7.4) was added into 10 nM of AptCe6-GNPs, and then the mixture was slightly shaking for 40 min at room temperature. After that, the Cu(II)-AptCe6-GNPs were collected by centrifugation at 14000 rpm/min for 20 min and washed three times with DI-water. The amounts of Cu(II) bound to AptCe6-GNPs were determined by XSERIES 2 inductively coupled plasma mass spectrometry (ICP-MS) (Thermo, USA). Thereafter, AQ4N (1 mg/mL) was added into Cu(II)-AptCe6-GNPs solution at pH 7.4, and the mixture was slightly shaking for 12 hrs at room temperature. The amount of loaded AQ4N was determined by measuring the supernatant absorbance at 595 nm (SpectraMax M5, Molecular Devices). The standard curve has a very good linear relation with AQ4N from the concentration of 1.5-50 μg/mL (Y = 5.535X + 0.034, R2 = 0.998).
CD spectra of Cu(II)-AptCe6-GNPs
CD spectroscopy is a powerful technique that is particularly suited to sensitively investigate conformational changes of DNA. 10 μM of AptCe6-GNPs or Cu(II)-AptCe6-GNPs complexes were detected by CD spectroscopy, respectively. Conformational transition of aptamer could be traced by changes in the position and intensity of the bands in CD spectra.
Redox-responsive fluorescence imaging and ROS generation
First, 1 mL of AptCe6-GNPs (10 nM, GNPs) was incubated with 10 mM dithiothreitol (DTT) for different times, and the fluorescence spectra was recorded at room temperature in a quartz cuvette on a FluoroMax-4 spectrofluorometer (HORIBA, NJ, USA). The excitation wavelength was 404 nm, and the emission wavelengths were in the range from 650 to 750 nm with both excitation and emission slits of 10 nm under a PMT voltage of 950V. Subsequently, ROS generation of AptCe6-GNPs with or without co-incubated with DTT for 12 hrs was measured through using ABDA as an indicator. Briefly, the AptCe6-GNPs solution (10 nM, GNPs) was incubated with 10 mM dithiothreitol (DTT) for 12 hrs, and then mixed with 100 μM ABDA. Upon laser irradiation at 670 nm with the power intensity of 0.5 W/cm2 for 0, 5, 10, 15, 20, 25 and 30 min, the absorbance changes of ABDA from 300 to 450 nm were measured by a UV-Vis spectrometer (Beijing Perkinje General Instrument Co., China).
pH-triggered controlled release of AQ4N from AQ4N-Cu(II)-AptCe6-GNPs
The controlled release study was conducted as follows: first, AQ4N-Cu(II)-AptCe6-GNPs (10 nM, GNPs) was dispersed in 1 mL PBS buffer with different pH as indicated (pH 7.4 or pH 4.5); at the pre-determined time intervals, 0.5 mL of the supernatant was analyzed to determine the released drugs by UV-vis absorption spectrum after centrifugation at 14000 rpm / min for 15 min. To keep a constant volume, 0.5 mL of fresh PBS buffer with corresponding pH as indicated (pH 7.4 or pH 4.5) was added after each sampling. After 12 hrs, the amount of released Cu(II) from the AQ4N-Cu(II)-AptCe6-GNPs in the supernatant at different pH conditions as indicated (pH 7.4 or pH 4.5) was determined by XSERIES 2 inductively coupled plasma mass spectrometry (ICP-MS) (Thermo, USA).
pH-triggered aggregation and photothermal effect of AQ4N-Cu(II)-AptCe6-GNPs in vitro and in vivo
10 nM of AQ4N-Cu(II)-AptCe6-GNPs or GNPs was dispersed in 1 mL of DI-water with different pH as indicated (pH 7.4 or pH 4.5). After 2 hrs, the mixture was irradiated by 670 nm lasers (0.5 W/cm2, 280 s) with a single “ON-OFF” cycling, and the temperature of the mixture was monitored by a thermocouple microprobe (Φ = 0.5 mm) (STPC-510P, Xiamen Baidewo Technology Co., China) submerged in the solution every 10 s. Meanwhile, the AQ4N-Cu(II)-AptCe6-GNPs solution (2.5 nM) was also incubated with or without 10 mM dithiothreitol (DTT) for 12 hrs, and then irradiated by 670 nm lasers (0.5 W/cm2, 280 s) for 5min; afterwards, the thermal images and temperature changes were monitored by Infrared Thermal Camera. In vivo assay, 50 μL of the Ce6 (1 μM) or AQ4N-Cu(II)-AptCe6-GNPs (10 nM) were intra-tumor injected into HepG2-bearing nude mice, respectively; the local temperature change of HepG2-bearing nude mice was real-time recorded by Infrared Thermal Camera when the tumor was irradiated by 670 nm laser with the laser power intensity of 0.5 W/cm2, and intra-tumor injection of 50 μL PBS was taken as control.
Confocal fluorescence microscopy studies of the selective cellular uptake of AQ4N-Cu(II)-AptTAMRA-GNPs
Since the fluorescence spectra of Ce6 was overlaped with that of AQ4N, we thus used the TAMRA labeled aptamer to instead the AptCe6. The selective uptake of AQ4N-Cu(II)-AptTAMRA-GNPs by HepG2 cells but not HeLa cells were investigated using CLSM. In a typical experiment, HepG2 cells (5×10⁴) or HeLa cells (3×10⁴) were seeded onto 35-mm glass-bottom Petri dishes and cultured for another 24 hours at 37˚C in the incubator; afterwards, the AQ4N-Cu(II)-AptTAMRA-GNPs was added into the cells and further incubated for 0, 30, 60, 90, 120, 180, 240 min, respectively. Then, the cells were washed three times with PBS (pH 7.4) at room temperature and then fixed with 4% paraformaldehyde for 15 min. Finally, the cells were imaged by a confocal microscope (LSM 780, USA) with 561 nm laser excitation for TAMRA and 630 nm laser excitation for AQ4N.
ROS generation and oxygen consumption assay of AQ4N-Cu(II)-AptCe6-GNPs in vitro
In ROS generation assay, dichlorodihydro fluorescein diacetate (DCFH-DA) was used as the fluorescence indicator to detect the ROS generation from the nano-complex under the 670nm laser irradiation.11 Briefly, the cells were seeded in a 96-well plate at a density of 1×10⁴ cells per well and incubated in a humidity atmosphere (with 5% CO2) for 24 hrs. Then the original medium was replaced with fresh culture medium containing AQ4N-Cu(II)-AptCe6-GNPs. After incubated for 4hrs, the original medium was replaced with fresh culture medium containing 100 μM of DCFH-DA and further incubated for 30 min, and then exposed to the 670 nm laser irradiation (0.5 W/cm2) for 5 min. CLSM was used to detect the fluorescence DCFH-DA.
In oxygen consumption assay, the oxygen consumption was examined using MitoXpress Kit according to the manufacturer's protocol. Briefly, the cells were seeded in a 96-well plate at a density of 1×10⁴ cells per well and incubated in a humidity atmosphere (with 5% CO2) for 24hrs. Then the original medium was replaced with fresh culture medium containing AQ4N-Cu(II)-AptCe6-GNPs. After incubated for 4hrs, the original medium was replaced with 50 μL fresh culture medium containing 10 μL of MitoXpress Kit (405 / 650 nm), and then covered with 100 μL oil according to the previous report.17 Subsequently, the samples were exposed to the 670 nm laser irradiation (0.5 W/cm2) for 5 min, and then detected by CLSM.
Synergistic antitumor efficacy of AQ4N-Cu(II)-AptCe6-GNPs in vitro
Cell Counting Kit (CCK8) was used to study the synergistic antitumor effect of cell toxicity of AQ4N-Cu(II)-AptCe6-GNPs against HepG2 cells, LO2 cells and HeLa cells. Briefly, the cells were seeded in a 96-well plate at a density of 1×10⁴ cells per well and incubated in a humidity atmosphere (with 5% CO2) for 24hrs. Then the original cell culture medium was discarded, and the cells were washed three times with PBS to remove dead cells, followed by incubation with Ce6 (0.5 μM), AQ4N (24 μM) and AQ4N-Cu(II)-AptCe6-GNPs (5 nM) in fresh medium at 37°C, respectively. Meanwhile, the cells incubated with cell culture medium only were prepared as untreated control. The medium was aspirated after 4h incubation, and the cells were washed twice with PBS solution to remove non-internalized probes. Afterwards, the cells were exposed to 670 nm laser (0.5 W/cm2) for 5 min. After laser irradiation, the cells were incubated with fresh medium containing 10% fetal bovine serum at 37°C for 24 hours. Cell viability was expressed as follows: Cell viability = (ODsample-ODblank) / (ODcontrol-ODblank). The ODsample and ODcontrol are the absorbance values of the treated cells (as indicated) and the untreated control cells (without nanoparticles), respectively. The ODblank was the absorbance of CCK8 reagent itself at 450 nm. All experiments were performed for 6 times.
To further evaluate cell apoptosis, the Annexin-V-FITC/propidiu iodide (PI) staining method was used. Briefly, HepG2 cells were seeded into a 24-well plate at a density of 2 × 10⁶ cells per well at 37°C in a 5% CO2 atmosphere for 24 hrs. The cells then were washed three times with PBS to remove dead cells at room temperature, followed by incubation with Ce6 (0.5 μM), AQ4N (24 μM) and AQ4N-Cu(II)-AptCe6-GNPs (5 nM) that were dispersed in a culture medium at 37°C for 4hrs. Next, the cells were washed by culture medium, and then exposed to 670 nm laser (0.5 W/cm2) for 5 min. After laser irradiation, the cells were incubated with fresh culture medium at 37°C for 24hrs. The cells then were collected and re-suspended in 500 μL of binding buffer, and AnnexinV-FITC and PI were added following the manufacturer' s recommendation. Afterwards, samples were incubated in darkness for 15 min at room temperature and then analyzed using flow cytometry. The stained cells were divided into four subgroups, the viable group, the early apoptotic group, the late apoptotic / necrotic group and the dead cells / debris group, which were localized in the lower left, lower right, upper right, and upper left quadrants, respectively.
To further investigate the efficiency of AQ4N converted to AQ4 under hypoxia condition, HepG2 cells were seeded into a 24-well plate at a density of 2 × 10⁶ cells per well at 37°C in a 5% CO2 atmosphere for 24 hrs. Then, the cells were washed three times with PBS to remove dead cells, followed by incubation with AQ4N (48 μM) that were dispersed in culture medium under hypoxia condition at 37°C for 24hrs. Afterwards, the culture medium was taken out to measure the free AQ4N content which is referred as Ms. The rest of the cells was then extracted and the remained AQ4N was determined as Mc. The conversion efficiency (CE) is calculated by the following equation: CE = (Mf- Ms- Mc)/( Mf- Ms)×100%; where Mf is the feeding amount of AQ4N, Ms and Mc were analyzed by HPLC (Agilent 1260 Infinity, Agilent Technologies, Germany) using Agilentzorbax Eclipse Plus C18 column (4.6 mm × 100 mm, 3.5 μm, Agilent Technologies, USA) employing isocratic elution with 78% of 50 mM ammonium formate (pH 3.6) and 22% of acetonitrile. The column temperature was maintained at 45°C, and the flow-rate was maintained at 0.8 mL/min. The AQ4N concentration was monitored by the absorption at 242 nm. The correlation between the peak area at the retention time of 3.297 min (see Figure S12 in the supporting information) and the concentration of AQ4N was analyzed by linear regression, which showed a well-correlated linear relationship (R2= 0.994). As shown in Figure S12, the standard curve has a very good linear relation with AQ4N from the concentration of 2-48 μM (Y = 90.554X + 169.24). Based on our HPLC analysis, the Ms and Mc were determined to be 1.48652 μg and 1.12558 μg in average, respectively, with the Mf of 5.5584 μg; thus, the average conversion efficiency was calculated to be 53.01%.
Synergistic antitumor efficacy of AQ4N-Cu(II)-AptCe6-GNPs in vivo
Male BALB/c-nude mice (6 weeks old) were purchased from China Wushi, Inc. (Shanghai, China). All animal procedures were approved by the Animal Ethics Committee of Fujian Medical University. Tumor-bearing mice were prepared by subcutaneously injecting a suspension of the HepG2 cells (107 cells) in sterilized 1 × PBS. When the tumor size reached about ∼300 mm3, 50 μL of Ce6 (1 μM), AQ4N (48 μM) and AQ4N-Cu(II)-AptCe6-GNPs (10 nM) were directly injected into the tumor site. One group of mice treated with the same volume of sterilized PBS was taken as the control group. The mice were segregated into four groups:
(1) sterilized PBS with combined laser irradiation under 670 nm (0.5 W/cm2) for 5 min (n = 4);
(2) free Ce6 with laser irradiation under 670 nm (0.5 W/cm2) for 5 min (n = 4);
(3) free AQ4N directly injected into the tumor site (n = 4);
(4) AQ4N-Cu(II)-AptCe6-GNPs with laser irradiation under 670 nm (0.5 W/cm2) for 5 min (n = 4).
The irradiation was conducted after 24hrs of injection. The therapeutic effects were evaluated by monitoring the tumor volume and body weight changes in each group every 2 days, up to 14 days. The tumor size was measured using caliper every other day after the treatment. The tumor volume (V) was calculated using the following equation:
V = AB2/2
where A and B are the longer and shorter diameter (mm) of the tumor, respectively. Meanwhile, to examine the histological changes of the tumors, one tumor-bearing mouse in each group was sacrificed after 48 hrs of irradiation, and the tumors were collected, and then stained with Hematoxylin and eosin (H&E) for histopathology evaluation
Histological examination and long-term toxicity assessment
To assess the long-term systematic toxicities of the AQ4N-Cu(II)-AptCe6-GNPs, the nano complex-treated BALB/c mice were sacrificed at the time point of 0, 5, 10 and 25 days after intravenous injection of the AQ4N-Cu(II)-AptCe6-GNPs (10 nM; 200 μL injection of each mouse) via the tail vein, and the major organs (heart, liver, spleen, lungs and kidney) of the mice were then collected, fixed in 4% neutral formaldehyde, conducted with paraffin-embedded sections, stained with hematoxylin and eosin, and observed under a Zeiss microscope (Axio Lab.A1).
Statistical analysis
Statistical analysis of data was performed using one-way of variance (ANOVA) method or the two-tailed paired Student's T-test, *p<0.05, **p<0.01, ***p<0.001. All the data were shown as means ± SD through at least three experiments.
Results and discussion
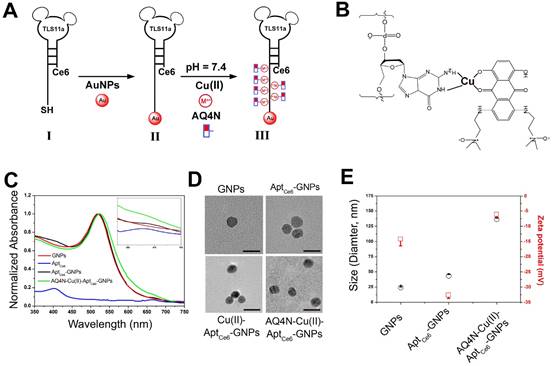
The procedure for the synthesis of AQ4N-Cu(II)-AptCe6-GNPs is illustrated in Figure 1A and 1B. Citrate-GNPs was first synthesized according to our previous report.28 Transmission electron microscopy (TEM) images showed that the citrate-GNPs (2.5 nM) was well-dispersed in an aqueous solution (PDI, 0.253) with an average diameter of 12 ± 1.1 nm (Figure 1D). However, at physiological conditions, citrate-GNPs are unstable which could form large aggregates with rapid clearance from the body. We thus introduced Ce6 labelled aptamer (TLS11a, AptCe6), which could specifically recognize the membrane surface of HCC cells, to conjugate with GNPs via Au-S bond by a salt aging process.29,30 As shown in Figure S1A, comparing with aptamer alone (red line), AptCe6 (black line) exhibited two new absorption peaks at 405 nm and 650 nm which are corresponding to the characteristic peaks of Ce6; however, the characteristic absorption peaks of AptCe6 are quite low since only one Ce6 molecular was covalently modified at the end of aptamer. After successful functionalization of AptCe6 to GNPs, TEM images showed that AptCe6-GNPs (GNPs, 2.5 nM) were well-dispersed in an aqueous solution (PDI, 0.398) (Figure 1D); meanwhile, the average diameters of AptCe6-GNPs (GNPs, 2.5 nM) were increased from 24.06 ± 1.3 (GNPs) to 43.04 ± 2.7 which has been determined by DLS, and the zeta potential was decreased from -14.2 ± 2.2 (GNPs) to -32.6 ± 1.1 at pH 7.4 (Figure 1E). Although the absorption peaks of AptCe6-GNPs did not make any changes, the fluorescence intensity of AptCe6-GNPs was significant lower than that of AptCe6 alone (Figure 1C and Figure S1B); this phenomenon confirmed the successful conjugation between AptCe6 and GNPs, and the effective quenching of Ce6 fluorescence of AptCe6-GNPs by GNPs via resonance energy transfer (RET). Furthermore, although the formed Au-S bond is very stable in physiological conditions, it could response to external glutathione (GSH), which is always abundant in tumor cells, for releasing thiol-containing payloads that bound on gold nanoparticles.31 Therefore, the redox-activated fluorescence enhancement was further investigated. At 37°C, the AptCe6-GNPs solution was incubated with redox agent DTT (10 mM) for different times. As shown in Figure S2A and S2C, a time-dependent fluorescence recovery was observed in AptCe6-GNPs solution, and the fluorescence intensity was almost enhanced 8.5-fold after 5hrs of incubation comparing with the beginning. In contrast, there was almost no noticeable fluorescence recovery in the absence of DTT even after 5hrs incubation in AptCe6-GNPs (Figure S2B and S2C). Since the ROS generation ability of Ce6 was suppressed by the GNPs through RET, we further investigated the ROS generation ability of AptCe6-GNPs in the presence or absence of DTT by ABDA (9, 10-anthracenediyl-bis-(methylene) dimalonic acid) 11. As shown in Figure 2A, the ABDA absorbance of AptCe6-GNPs solution was significantly declined in an incubation time dependent manner when incubated with DTT (10 mM) upon the 670 nm laser irradiation with a laser power intensity of 0.5W/cm2, which clearly demonstrated the recovery of ROS generation ability of Ce6 after the Au-S bond cleavage. In contrast, the ABDA absorbance of AptCe6-GNPs solution without incubation with DTT (10 mM) at the same conditions almost did not make any changes due to the effective quenching of ROS generation ability of Ce6 by GNPs through RET (Figure S3).
(A) The preparation procedure of smart AQ4N-Cu(II)-AptCe6-GNPs was shown in stepwise manner. (B) (GA)10 repeating base is coordinated with Cu(II) through of NH2 and N7, and guest AQ4N via C=O and C-O. (C) Vis-NIR spectra of GNPs, AptCe6, AptCe6-GNPs and AQ4N-Cu(II)-AptCe6-GNPs, and the enlarged Vis-NIR spectra ranging from 550 nm to 750 nm; (D) Representative TEM image of GNPs, AptCe6-GNPs, Cu(II)-AptCe6-GNPs and AQ4N-Cu(II)-AptCe6-GNPs (scale bar = 20 nm). (E) Hydrodynamic size and zeta potential of GNPs, AptCe6-GNPs, AQ4N-Cu(II)-AptCe6-GNPs.
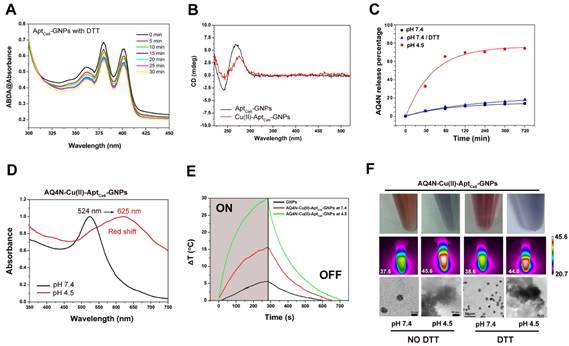
(A) The absorbance of 9, 10-dimethylanthracene (ABDA, 100 μM) after photodecomposition by ROS generation upon 670 nm laser irradiation at 0.5 W/cm2 in the presence of AptCe6-GNPs with DTT (10 mM) for different time in PBS solution (B) CD spectra of AptCe6-GNPs and Cu(II)-AptCe6-GNPs at pH 7.4. (C) The cumulative AQ4N release kinetic from AQ4N-Cu(II)-AptCe6-GNPs in PBS buffer (at pH 7.4 with and without 10 mM DTT, and at pH 4.5) at 37oC. (D) Vis-NIR spectra of AQ4N-Cu(II)-AptCe6-GNPs in different pH-value. (E) Temperature elevation of GNPs, AQ4N-Cu(II)-AptCe6-GNPs (pH 7.4) and AQ4N-Cu(II)-AptCe6-GNPs (pH 4.5) exposed to 670 nm laser (0.5 W/cm2) as a function of irradiation time. (F) The color change of the AQ4N-Cu(II)-AptCe6-GNPs under different pH values and with or without incubation with DTT (10 mM), respectively (upper pannel). Infrared thermal images of the AQ4N-Cu(II)-AptCe6-GNPs under different pH values and with or without incubation with DTT(10 mM) when exposed to an 670 nm laser (0.5 W/cm2) irradiation as a function of irradiation time (middle pannel). TEM images of the AQ4N-Cu(II)-AptCe6-GNPs under different pH values and with or without incubation with DTT(10 mM) (scale bar = 10, 50 nm) (lower pannel).
Since the prodrug AQ4N has very poor affinities to DNA as previous reported,5, 6 we here designed a smart “host-metal-guest” architecture to effectively payload the AQ4N onto the AptCe6-GNPs. As shown in Figure 1B, the (GA)10 repeating bases at 3' end of aptamer (TLS11a) coordinated with Cu(II) through N7 and NH2 of GA bases (Cu(II)-aptamer complexes), then guested with AQ4N via C-O and C=O bonds (Cu(II)-AQ4N) at pH 7.4 to form “AQ4N-Cu(II)-aptamer” architecture. To confirm the successful formation of “AQ4N-Cu(II)-aptamer” architecture at pH 7.4, the CD spectra was further analyzed. As shown in Figure 2B, the CD spectra of AptCe6-GNPs has a negative peak at 245 nm ascribed to the right-handed helicity and a positive peak at 274 nm. After the formation of Cu(II)-AptCe6-GNPs architecture, the intensity of the positive and negative peaks was decreased (shifting to zero level) and accompanied by a red shift. These changes were owing to the strong interactions between the metal ions and aptamer bases.32,33 Meanwhile, the zeta potential of AQ4N-Cu(II)-Aptce6-GNPs were then further changed from -32.6 ± 1.1 (Aptce6-GNPs) to -6.1 ± 0.9 mV, which due to the positive charge of Cu(II) (Figure 1E and Figure S4); furthermore, the size of AQ4N-Cu(II)-AptCe6-GNPs was significantly increased (137.07 ± 4.26 nm) comparing with AptCe6-GNPs (43.04 ± 2.7nm) since very few of the incorporated Cu(II) still could be dissociated from the complex, then could induce very slight aggregation; and the UV-vis absorption peak of AQ4N-Cu(II)-AptCe6-GNPs was slightly red shifted from 518 nm to 524 nm (Figure 1C) comparing with AptCe6-GNPs. TEM images further confirmed that AQ4N-Cu(II)-AptCe6-GNPs were still maintained the well-dispersion in DI-water (PDI, 0.142) (Figure 1D).
Moreover, we further investigated the stability of AQ4N-Cu(II)-Aptce6-GNPs in physiological conditions by adding free ssDNA (10 μM) or FBS (10%) into the buffer solution of our NPs to mimic the in vivo environments. As shown in Figure S5, even with adding the free ssDNA, the final released percentages of AQ4N from AQ4N-Cu(II)-AptCe6-GNPs after 24hrs was still only 14.28% which was very similar as that of AQ4N-Cu(II)-AptCe6-GNPs (13.57%) in PBS buffer at pH 7.4 without ssDNA or FBS. However, in the presence of 10% FBS, the final released percentages of AQ4N from AQ4N-Cu(II)-AptCe6-GNPs after 24hrs was increased to 26.78%, because FBS could bind with Cu(II) by competing with aptamer. Even so, the influence of free DNA and FBS on the stability of NPs is still tolerable comparing with the acid triggered dramatic AQ4N release; these results are indicating that our NPs could relatively better maintain their structural integrity under physiological environments. Taken together, these results were demonstrated that AQ4N-Cu(II)-Aptce6-GNPs were very stable after coordination of Cu(II) with AQ4N at pH 7.4.
The established “AQ4N-Cu(II)-AptCe6-GNPs” system might be sensitive to endogenous pH variations since the protons could compete with Cu(II)-AQ4N to bind with the bases in acidic conditions.34-36 To demonstrate this assumption, the pH sensitive release profiles of payload AQ4N from AQ4N-Cu(II)-AptCe6-GNPs were investigated under different physiological conditions (i.e., pH range 4.5-7.4 in PBS buffer). The amount of AQ4N released from AQ4N-Cu(II)-Aptce6-GNPs were determined by monitoring the absorbance of AQ4N in the supernatant solution at different time points. As shown in Figure 2C, the final released percentage of AQ4N from AQ4N-Cu(II)-AptCe6-GNPs after 12hrs was only 17.63% at pH 7.4 with 10 mM DTT incubation, and 13.86% at pH 7.4 without DTT incubation, indicating that reduction condition almost has no effects on AQ4N release. Therefore, the AQ4N release behavior was only further investigated under the acidic condition (pH 4.5). Comparing with the AQ4N release at pH 7.4, the released percentage of AQ4N was dramatically increased even at the first 1h incubation (almost reaching to 65.17%) at pH 4.5, with the cumulative release of payload reaching to 74.17% over 12hrs. These results suggested that “AQ4N-Cu(II)-aptamer” architecture could response to the acidic conditions such as in the tumor micro-environment for controlled drug release. Noteworthiness, the color of AQ4N-Cu(II)-Aptce6-GNPs solution was quickly changed from red to blue when the pH value was switched from 7.4 to 4.5 in Figure 2F, which might due to the aggregation of GNPs induced by the released Cu(II). To investigate the mechanism of GNPs aggregation, the AQ4N-Cu(II)-AptCe6-GNPs solution was prepared at pH 4.5 or at pH 7.4, and the Uv-vis-NIR absorption spectra was further analyzed. As shown in Figure 2D and Figure S6, the absorption peak of AQ4N-Cu(II)-AptCe6-GNPs was immediately red shifted from 524 nm to 625 nm at pH 4.5 within 10 min; in contrast, the samples at pH 7.4 showed no noticeable absorption changes within 2hrs incubation as shown in Figure S6. Meanwhile, Cu(II) concentrations in the supernatant and the zeta potential of AQ4N-Cu(II)-AptCe6-GNPs solution at pH 4.5 was further analyzed. In acidic condition (pH 4.5), the supernatant Cu(II) concentration of AQ4N-Cu(II)-AptCe6-GNPs was 70.11 μM (accounting for 75.19% of total Cu(II) in AQ4N-Cu(II)-AptCe6-GNPs), while the Cu(II) concentration was only 10.63 μM at pH 7.4 (accounting for 11.4% of total Cu(II) in AQ4N-Cu(II)-Aptce6-GNPs); and the zeta potential was also significantly increased from -6.1 ± 0.9 mV (pH 7.4) to 14.1± 2.1 Mv. The released Cu(II) might immediately induce the aggregates formation of GNPs via electrostatic interaction, which has been further proved by the DLS analysis and the TEM images of AQ4N-Cu(II)-AptCe6-GNPs under different pH conditions (Figure S7 and Figure 2F); as shown in Figure S7, the size of AQ4N-Cu(II)-AptCe6-GNPs was increased from 137.07 ± 4.26 nm to 1367.67 ± 57.93 nm when the pH was declined from 7.4 to 4.5 (without DTT incubation), and increased from 102.22 ± 20.34 nm to 1272.67 ± 35.91 nm with 10mM DTT incubation. Taken together, these results clearly proved the programmable pH induced drug release and followed metal ion induced aggregation of GNPs.
Since the absorption of AQ4N-Cu(II)-AptCe6-GNPs aggregates has been red-shifted with relatively strong absorption in the near infrared range, it might be used as a photo-thermal conversion agent for PTT under the 670 nm laser irradiation. Therefore, the photo-thermal conversion properties of these aggregates were first investigated with a laser ON/OFF cycling in 700s intervals. As shown in Figure 2E, the temperature of AQ4N-Cu(II)-AptCe6-GNPs (10 nM) increased from 23.4 oC to 53.3oC at pH 4.5 within 280 s (670 nm, 0.5 W/cm2) due to the strong SPR generated by the aggregated GNPs; in contrast, the temperature of AQ4N-Cu(II)-AptCe6-GNPs showed much less increase at pH 7.4 under the same conditions (from 23.2 to 38.9oC) due to the much less free Cu(II) which then could not effectively induce the aggregation formation, while the control GNPs at pH 7.4 only had negligible temperature changes (from 21.1 to 26.8oC) due to the absence of GNPs aggregation. To further investigate whether the redox agent would influence the aggregation behaviors, the AQ4N-Cu(II)-AptCe6-GNPs (2.5 nM) solution was further incubated DTT (10 mM) for 12hrs; afterwards, the infrared thermal imaging system was used to visualize influence of DTT on the photo-thermal conversion abilities. As shown in Figure 2F, after 670 nm laser irradiation for 5 min, the temperature of AQ4N-Cu(II)-AptCe6-GNPs incubated with DTT (10 mM) were increased to 44.6oC at pH 4.5 and 38.6oC at pH 7.4 respectively, and it is almost as the same as AQ4N-Cu(II)-Aptce6-GNPs without DTT incubation (45.6oC at pH 4.5 and 37.5oC at pH 7.4). These results clearly indicated that the photo-thermal conversion ability of AQ4N-Cu(II)-AptCe6-GNPs would only be affected by pH but not by redox agents.
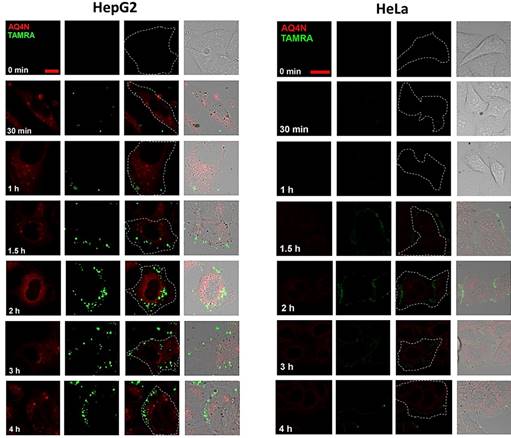
To evaluate the HCC cell specific targeting ability of AQ4N-Cu(II)-AptCe6-GNPs, confocal fluorescence microscopy (CLSM) was used in the study of its cellular uptake in HepG2 (positive control) and HeLa cells (negative control). Noteworthiness, since the excitation and emission of AQ4N (ex 633, em 650 nm) were as same as that of Ce6 (ex 633, em 650 nm), 5,11 we thus used TAMRA (ex 561, em 600 nm) to instead Ce6 in this experiment. As shown in Figure 3 and Figure S8, the red fluorescence of AQ4N (ex 633 nm, em 650 nm) was ready to be observed in the cytoplasm of HepG2 cells in the first 1h incubation, which was indicating the uptake of AQ4N-Cu(II)-AptTAMRA-GNPs; while at this moment, the green fluorescence of TAMRA rarely appeared in HepG2 cells, which might be due to the insufficient recovery of the TAMRA fluorescence that has been quenched by GNPs at the beginning. With the extension of the incubation time, both of the AQ4N fluorescence (red color) and the TAMRA fluorescence (green color) were concomitantly increased in the cytoplasm of HepG2 cells; in contrast, only negligible red and green fluorescence were observed in HeLa cells during all the incubation time, especially at the beginning 2hrs, which only reflect the none-specific background uptake of AQ4N-Cu(II)-AptTAMRA-GNPs due to the negligible bind on HeLa cells. These differences clearly suggested that our AQ4N-Cu(II)-AptTAMRA-GNPs exhibited highly selective binding to HepG2 cells rather than the Hela cells due to the specific targeting ability of aptamer.
Confocal images of HepG2 cells and HeLa cells incubated with AQ4N-Cu(II)-AptTAMRA-GNPs for different incubation times (Scale bar = 50 mm).
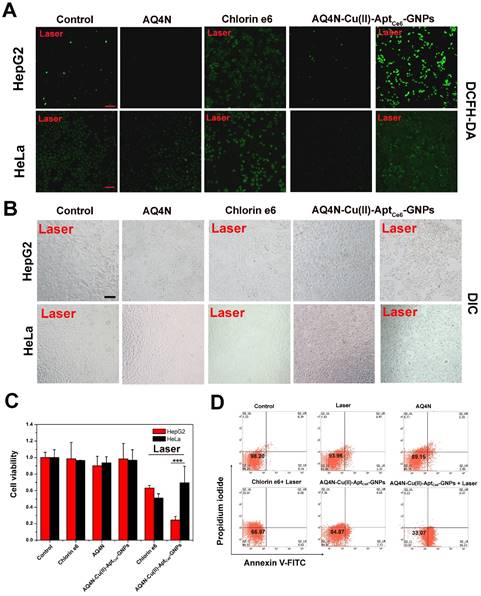
To investigate the synergistic antitumor effects of AQ4N-Cu(II)-AptCe6-GNPs in vitro, we first investigated the PDT induced ROS generation (PDT “on” state) inside HepG2 cells through using ROS detecting fluorogenic reagent (2, 7-Dichlorofluorescein diacetate, DCFH-DA) by CLSM.11 As shown in Figure 4A and Figure S9, upon the 670 nm laser irradiation (0.5 W/cm2) for 5 min, the untreated HepG2 and HeLa cells showed a slight green DCFH-DA fluorescence, indicating that a few ROS were present inside the cancer cells. Meanwhile, neither the laser irradiation at 670 nm alone nor the presence of AQ4N-Cu(II)-AptCe6-GNPs alone without laser irradiation could induce any additional ROS production inside the HepG2 or HeLa cells. Similarly, there was no more additional ROS generation inside the cells treated with AQ4N alone, implying that AQ4N could not induce the ROS production and also could not induce any cell death in the aerobic tumor cells. However, when the AQ4N-Cu(II)-AptCe6-GNPs treated HepG2 cells irradiated by 670 nm laser for 5 min, we could clearly see strong green florescence that produced by the DCFH-DA dye in the HepG2 cells, and it was much stronger than that of Ce6 treated cells; this might due to the efficient uptake of AQ4N-Cu(II)-AptCe6-GNPs than the uptake of Ce6 by HepG2 cells, due to the poor water solubility of Ce6. In contrast, we could not see obvious green fluorescence in AQ4N-Cu(II)-AptCe6-GNPs treated HeLa cells under 670 nm laser irradiation, and its florescence intensity was much lower than that of Ce6 treated HeLa cells. These results clearly proved that our AQ4N-Cu(II)-AptCe6-GNPs could serve as effective nano-carriers for targeted photosensitizer delivery.
(A) Confocal images of HepG2 cells and HeLa cells that received different treatments as indicated; the DCFH-DA was applied as the ROS indicator (scale bar = 50 μm); untreated cells with laser irradiation alone were taken as control; the cells treated with free AQ4N, with free Ce6 under laser irradiation, with AQ4N-Cu(II)-AptCe6-GNPs without laser irradiation, and cells treated with AQ4N-Cu(II)-AptCe6-GNPs with laser irradiation (670 nm, 0.5 W/cm2) was indicated (Scale bar = 50 μm). (B) DIC image of HepG2 cells and HeLa cells when treated with free Ce6, free AQ4N and AQ4N-Cu(II)-AptCe6-GNPs with or without laser irradiation (Scale bar = 50 μm). (C) Cell viability of HepG2 cells and HeLa cells treated with free Ce6, free AQ4N and AQ4N-Cu(II)-AptCe6-GNPs with or without laser irradiation (670 nm, 0.5W/cm2) (n = 6), and statistical analysis was performed with the two-tailed paired Student's T-test, ***p<0.001. (D) The cell apoptosis and necrosis were analyzed by flow cytometry analysis using Annexin V-FITC and PI staining when the HepG2 cells were treated with AQ4N, Ce6 and AQ4N-Cu(II)-AptCe6-GNPs with or without laser irradiation (670 nm, 0.5 W/cm2).
Afterwards, normal human hepatic cells (LO2 cells) have been selected to evaluate the cytotoxicity of AQ4N-Cu(II)-AptCe6-GNPs to normal cells. As shown in Figure S10, the cell viability was still remained as high as above 85% at a relatively high dose of 5 nM, and the slight toxicity of our NPs might be ascribed to the intrinsic cytotoxicity of AQ4N in aerobic conditions. These results clearly proved that our NPs had a very good biocompatibility.
Since the AQ4N-Cu(II)-AptCe6-GNPs could have the PDT effects after the cleavage of Au-S bond inside the tumor cells and have the PTT effects after the releasing of Cu(II) inside the tumor cells to induce the GNPs aggregation under a single laser irradiation (670 nm), as well as have the hypoxia-targeted chemotherapy ability after the activation of prodrug AQ4N by PDT induced hypoxia, we then carefully investigated the synergistic antitumor efficiency in aerobic and hypoxia condition, respectively. Actually, in aerobic condition, synergistic antitumor potency of PDT and PTT was ready apparent in microscopic images of treated HepG2 cells based on cell morphology changes after the laser irradiation (Figure 4B). Meanwhile, the cell viabilities of different treated cells were also examined by CCK8 assay; as shown in Figure 4C, Ce6 alone or AQ4N alone only inhibited 36.8% and 9.8% of the cell proliferation in HepG2 cells with laser irradiation (0.5 W/cm2, 670 nm), respectively; while in the AQ4N-Cu(II)-AptCe6-GNPs treated HepG2 cells, 75.6% of cell proliferation was significantly inhibited after the laser irradiation, but only less than 10% of cell proliferation was inhibited without laser irradiation due to the little toxicity of AQ4N in aerobic conditions. In contrast, AQ4N-Cu(II)-AptCe6-GNPs treated HeLa cells was only inhibited 30.4% of the cell growth under the same condition, which might be due to only the background none specific insufficient probe uptake by HeLa cells that would be crucial for further PDT and PTT treatment. Furthermore, the Annexin-V-FITC/PI staining experiments were performed to further clarify the synergistic antitumor efficacy of AQ4N-Cu(II)-AptCe6-GNPs. As shown in Figure 4D, the majority of HepG2 cells were localized in the lower left quadrant with more than 98.2% of the viable cells in the control. Meanwhile, most of the cells were still remained alive (93.96% of the viable cells) only under the 670 nm laser irradiation (0.5 W/cm2) compared with the control. However, the percentage of apoptotic and necrotic cells was obviously increased to 66.92% in AQ4N-Cu(II)-AptCe6-GNPs treated HepG2 cells under 670 nm laser irradiation, which was much higher than PDT treatment alone (33.03%, only incubated with Ce6 and irradiated with laser), AQ4N treatment alone (10.85%) or AQ4N-Cu(II)-AptCe6-GNPs treatment alone without laser irradiation (15.13%) under the same conditions. To investigate the improving of therapy efficacy of the Cu(II)-induced aggregation, we compared the photothermal therapy efficacy of Cu(II)-AptCe6-GNPs with that of AptCe6-GNPs on HepG2 cells; as shown in Figure S11, only 33.6% of cells survived after treating with Cu(II)-AptCe6-GNPs (5 nM) under laser irradiation, while the cell viability still remained above 67.5% after treating with AptCe6-GNPs at the same concentration of GNPs under the same laser irradiation conditions, indicating almost 2 times higher of therapeutic efficacy have been achieved with Cu(II) induced aggregation than without Cu(II) induced aggregation. These results clearly demonstrated a remarkable increased synergistic antitumor effects of AQ4N-Cu(II)-AptCe6-GNPs through PDT and PTT in aerobic HepG2 cells.
In hypoxia conditions, the toxicity of prodrug AQ4N would be significantly enhanced by reducing to AQ4, we thus simulated a PDT-induced hypoxia environment according to previous report (Figure 5A).17 In this study, the HepG2 or HeLa cells were incubated with Ce6, AQ4N, AQ4N-Cu(II)-AptCe6-GNPs for 4h, and then washed 3 times with PBS buffer at room temperature; afterwards, 50 μL of fresh medium was added into the 96-wells, followed by adding another 100 μL of oil (nontoxicity) on the upper surface of the medium. After 670 nm laser irradiation, the cell viability was investigated by CCK8 and fluorescence microscope, respectively. As shown in Figure 5B, we clearly saw that AQ4N-Cu(II)-AptCe6-GNPs significantly inhibited 88.3% of HepG2 cell proliferation under the laser irradiation, while only inhibited 48.7% of cell proliferation without laser irradiation; meanwhile, the Ce6 treated cells only inhibited 43.1% of the cell proliferation under the laser irradiation. In contrast, 52.8% cell proliferation of the AQ4N-Cu(II)-AptCe6-GNPs treated HeLa cells was inhibited due to the insufficient uptake. Noteworthiness, both the AQ4N and AQ4N-Cu(II)-AptCe6-GNPs treated cells (with or without laser irradiation in both HepG2 cells and Hela cells) exhibited significantly higher cell killing efficiency in hypoxia conditions comparing with the aerobic conditions (Figure 4C and Figure 5B), which was due to the effective reduce of AQ4N into AQ4 in hypoxia conditions. Meanwhile, the above mentioned synergistic antitumor results also could be directly proved by the microscopic images of treated cells through the morphological changes (Figure 5C). Overall, these results clearly demonstrated the remarkable improved selective synergistic antitumor effects of AQ4N-Cu(II)-AptCe6-GNPs through the combination of PDT, PTT and PDT-induced AQ4N chemotherapy.
(A) Schematic view of the preparation of the hypoxia environment in tumor cells under the 670 nm laser irradiation. (B) Cell viability of HepG2 cells and HeLa cells treated with free Ce6, free AQ4N and AQ4N-Cu(II)-AptCe6-GNPs under the 670 nm laser irradiation (n = 3), and statistical analysis was performed with the two-tailed paired Student's T-test, ***p<0.001. (C) DIC image of HepG2 cells and HeLa cells treated with free Ce6, free AQ4N and AQ4N-Cu(II)-AptCe6-GNPs in hypoxia environment under the 670 nm laser irradiation (Scale bar = 50 mm). (D) PDT-induced hypoxic environment in HepG2 and HeLa cells under different treatment as follows: untreated cells, untreated cells with laser irradiation, AQ4N-Cu(II)-AptCe6-GNPs treated cells, AQ4N-Cu(II)-AptCe6-GNPs treated cells with laser irradiation, Ce6 treated cells with laser irradiation; the 670 nm irradiation laser has a power intensity of 0.5 W/cm2.
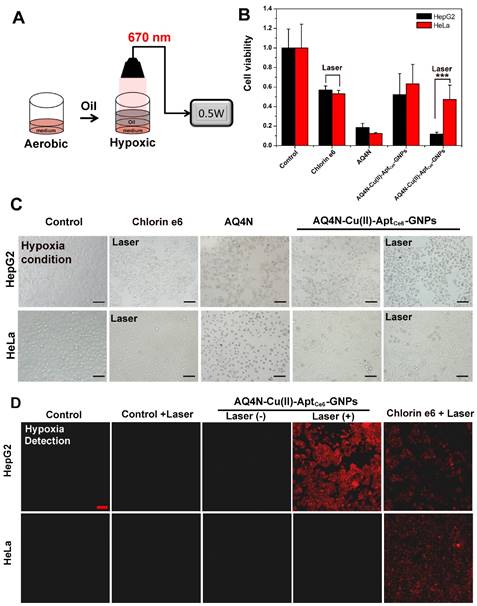
To further prove the AQ4N-Cu(II)-AptCe6-GNPs selectively induced local hypoxia in HepG2 cells, that is crucial for enhancing the chemotherapy efficiency of AQ4N, the AQ4N-Cu(II)-AptCe6-GNPs treated HepG2 cells and HeLa cells with or without laser irradiation were imaged by CLSM when they were incubated with hypoxia detection probes, respectively. Ce6 incubated cells were used as the positive control and the untreated cells as the negative control. As shown in Figure 5D, much stronger fluorescence (red color) could be clearly observed by CLSM in AQ4N-Cu(II)-AptCe6-GNPs treated HepG2 cells upon laser irradiation compared with any other conditions, indicating a higher level of PDT-induced hypoxic environment inside HepG2 cells; in contrast, there was no obvious red fluorescence in AQ4N-Cu(II)-AptCe6-GNPs treated HeLa cells due to the insufficient uptake. However, the fluorescence intensity of Ce6-treated HepG2 cells was as similar as that of Ce6-teated HeLa cells since both cells would have similar uptake of Ce6. These results further confirmed that AQ4N-Cu(II)-AptCe6-GNPs could selective internalize into the HepG2 cells and subsequently induce the hypoxic environment for chemotherapy when exposed to the 670 nm laser irradiation.
Next, to ensure the synergistic antitumor efficiency of AQ4N-Cu(II)-AptCe6-GNPs in vivo, NIR laser-induced local temperature arising of HepG2-bearing nude mice were investigated. As shown in Figure 6A and 6B, rapid temperature arising (increased 18.16 ± 1.6 oC) could be clearly observed at the tumor site under 670 nm laser irradiation after 24hrs of AQ4N-Cu(II)-Aptce6-GNPs injection; in contrast, only a slight temperature increase was observed at the tumor site under 670 nm laser irradiation when injected with Ce6 (increased 6.27 ± 1.6 oC) or injected with PBS (increased 5.76 ± 1.6 oC) as control, respectively.
(A) Thermo-graphic images of mice which were exposed to 670 nm laser irradiation (0.5 W/cm2) for different times (0-5min) after injection of PBS, Ce6 and AQ4N-Cu(II)-AptCe6-GNPs for 24 hrs; (B) The average of temperature elevation of PBS, Ce6, AQ4N-Cu(II)-AptCe6-GNPs when exposed to the 670 nm laser (0.5 W/cm2) irradiation in vivo (n = 4). (C) In vivo therapeutic response to PBS with laser irradiation, AQ4N, Ce6 with laser irradiation and AQ4N-Cu(II)-AptCe6-GNPs with laser irradiation after 24hrs of injection. (D) Tumor volumes of mice after different treatments as indicated. All date are presented as mean ± SD (n = 4), and statistical analysis was performed with the two-tailed paired Student's T-test, *p<0.05, **p<0.01. (E) Mean body weights of mice in different groups after treatment (n = 4). (F) Representative images of H&E staining from tumors after 48hrs of the indicated treatment (20X).
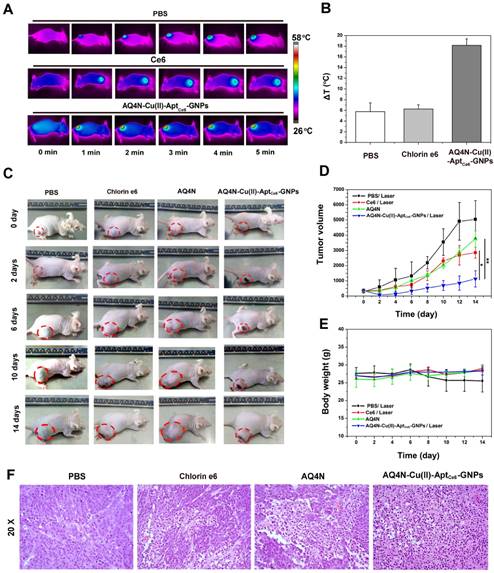
Furthermore, to evaluate the PDT / PTT / chemotherapy synergistic therapeutic effects of our AQ4N-Cu(II)-AptCe6-GNPs in vivo under the 670 nm single laser irradiation, HepG2-tumor bearing mice model with initial tumor volumes of ~300 mm3 was chosen and randomly divided into four groups, which then received various treatment as indicated (as mentioned in the Supporting information). The tumor volumes were measured by a Vernier caliper with a continuously monitor for 14 days. As shown in Fig. 6C, 6D, the mice in PBS treated group experienced a rapid tumor volume growth, indicating that laser irradiation alone has no influence on the tumor growth. It was noteworthy that the AQ4N treated mice exhibited delay in tumor growth due to the hypoxia induced chemotherapy of AQ4N, since the solid tumors always existed a hypoxia micro-environment. More obviously, the AQ4N-Cu(II)-AptCe6-GNPs treated mice exhibited significantly higher therapeutic efficiency after 670 nm laser irradiation, comparing with PDT treatment alone (Ce6) or AQ4N treatment alone, due to the enhanced synergistic PDT / PTT / chemotherapy effects. Moreover, we further evaluated the tumor tissues by H&E after 48hrs of treatment. In PBS treated group, no necrosis or obvious apoptosis was observed in the tumor tissue slices, and the tumor cells retained their normal morphology with distinguishable membrane and nuclear structure in Figure 6F. The tumors that received PDT treatment alone or AQ4N treatment alone showed a certain degree of tissue and cellular damage, due to the apoptosis of cancer cells induced by the PDT or AQ4 that is reduced from AQ4N. However, the AQ4N-Cu(II)-AptCe6-GNPs treated tumors under 670 nm laser irradiation showed significant cell destruction and extensive damaged areas, as indicated by the loss of tissue architectures and decrease general intensity of cells. These results clearly suggested that the synergistic combined PDT / PTT / chemotherapy of AQ4N-Cu(II)-AptCe6-GNPs was much efficient than any single treatment modality. Furthermore, inspired by the efficient cell destruction of AQ4N-Cu(II)-AptCe6-GNPs treated tumors under laser irradiation, we further evaluated the tumors weight after different treatment over 18 days (Figure S13). All these results were clearly demonstrated that our designed AQ4N-Cu(II)-AptCe6-GNPs exhibited excellent synergistic antitumor efficacy.
Nevertheless, the high toxicity usually leads to weight loss, we thus measured the body weight of the mice for all groups during the treatments, and no obvious weight loss was observed in those treatment groups (Figure 6E), and these results were further substantiated by pathological assessment. The pathological changes of major organs (heart, liver, spleen, lung, and kidney) were carefully analyzed through H&E staining at day 0, 5, 10 and 25 after the intravenous injection of AQ4N-Cu(II)-AptCe6-GNPs (200 μL per mouse,10 nM), and the PBS solution was set as control. As shown in Fig. S14, there was no noticeable tissue damaging in all major organs, in comparison with the control groups. The above-mentioned results implied that the toxicity or side effects of our AQ4N-Cu(II)-AptCe6-GNPs nanoprobe was not serious at all.
Conclusion
In summary, a smart tumor micro-environment responsive, “host-metal-guest” architecture based gold nanoprobe, “AQ4N-Cu(II)-AptCe6-GNPs” has been developed for programmable synergistic PDT, PTT and hypoxia-activated chemotherapy treatment of HCC. The above described nanoprobe has the unique features such as tumor cell redox responsive switching on of the PDT effects, low pH triggered chemotherapy drug release and metal iron release which then could induce the GNPs aggregation to produce PTT effects, as well as the PDT-induced hypoxia increase for chemotherapy enhancement. Both of the in vitro and in vivo experiments demonstrated that the AQ4N-Cu(II)-AptCe6-GNPs has excellent synergistic antitumor effects comparing with the chemotherapy alone or PDT alone. Thus, the here reported Cu(II)-aptamer complexes based gold nanoplatform could serve as a promising synergistic cancer therapeutic agent for HCC.
Supplementary Material
Figures S1-S14.
Acknowledgements
This work was supported by the Natural Science Foundation of China (Grant No. 61575044, U1505221, and 81671813); the Science and Technology Infrastructure Construction Program of Fujian Province (Grant No. 2014Y2005); the Natural Science Foundation of Fujian Province (Grant No. 2016J0101, 2016J01329 and 2015J05175).
Competing Interests
The authors declare no competing financial interest.
References
1. Wu X-Z, Xie G-R, Chen D. Hypoxia and hepatocellular carcinoma: The therapeutic target for hepatocellular carcinoma. J Gastroenterol Hepatol. 2007;22:1178-1182
2. Myung SJ, Yoon JH. Hypoxia in hepatocellular carcinoma. Korean J Hepatol. 2007;13:9-19
3. Lin D, Wu J. Hypoxia inducible factor in hepatocellular carcinoma: A therapeutic target. World J Gastroenterol. 2015;21:12171-12178
4. Song J, Qu Z, Guo X, Zhao Q, Zhao X, Gao L. et al. Hypoxia-induced autophagy contributes to the chemoresistance of hepatocellular carcinoma cells. Autophagy. 2009;5:1131-1144
5. Patterson LH, McKeown SR. AQ4N: a new approach to hypoxia-activated cancer chemotherapy. Br J Cancer. 2000;83:1589-1593
6. Patterson LH, McKeown SR, Ruparelia KJ. et al. Enhancement of chemotherapy and radiotherapy of murine tumours by AQ4N, a bioreductively activated anti-tumour agent. Br J Cancer. 2000;82:1984-1990
7. Patterson LH. Bioreductively activated antitumor N-oxides: the case of AQ4N, a unique approach to hypoxia-activated cancer chemotherapy. Drug Metab Rev. 2002;34:581-592
8. Tredan O, Garbens AB, Lalani AS, Tannock IF. The hypoxia-activated ProDrug AQ4N penetrates deeply in tumor tissues and complements the limited distribution of mitoxantrone. Cancer Res. 2009;69:940-947
9. Mehibel M, Singh S, Chinje EC, Cowen RL, Stratford IJ. Effects of cytokine-induced macrophages on the response of tumor cells to banoxantrone (AQ4N). Mol Cancer Ther. 2009;8:1261-1269
10. Agostinis P, Berg K, Cengel KA, Foster TH, Girotti AW, Gollnick SO. et al. Photodynamic therapy of cancer: an update. CA Cancer J Clin. 2011;61:250-281
11. Zhang D, Wu M, Zeng Y-Y, Wu L, Wang Q, Han X. et al. Chlorin e6 conjugated poly (dopamine) nanospheres as PDT/PTT dual-modal therapeutic agents for enhanced cancer therapy. ACS Appl Mater Interfaces. 2015;7:8176-8187
12. Wei Y. C.; Zhou, F. F.; Zhang, D. et al. A graphene oxide based smart drug delivery system for tumor mitochondria-targeting photodynamic therapy. Nanoscale. 2016;8:3530-3538
13. Liu Y, Liu Y, Bu W. Cheng C, Zuo C, Xiao Q, et al. Hypoxia Induced by Upconversion-Based Photodynamic Therapy: Towards Highly Effective Synergistic Bioreductive Therapy in Tumors. Angew Chem Int Ed Engl. 2015;54:8105-8109
14. Wang Y, Zhou K, Huang G, Hensley C, Huang X, Ma X. et al. A nanoparticle-based strategy for the imaging of a broad range of tumours by nonlinear amplification of microenvironment signals. Nat Mater. 2014;13:204-212
15. Chen WH, Luo GF, Qiu WX, Lei Q, Hong S, Wang SB. et al. Programmed Nanococktail for Intracellular Cascade Reaction Regulating Self-Synergistic Tumor Targeting Therapy. Small. 2016;12:733-744
16. Fan H, Zhao Z, Yan G, Zhang X, Yang C, Meng H. et al. A smart DNAzyme-MnO2 nanosystem for efficient gene silencing. Angew Chem Int Ed Engl. 2015;54:4801-4805
17. Qian C, Yu J, Chen Y, Hu Q, Xiao X, Sun W. et al. Light-Activated Hypoxia-Responsive Nanocarriers for Enhanced Anticancer Therapy. Adv Mater. 2016;17:3313-3320
18. Li J, Zheng C, Cansiz S, Wu C, Xu J, Cui C. et al. Self-assembly of DNA nanohydrogels with controllable size and stimuli-responsive property for targeted gene regulation therapy. J Am Chem Soc. 2015;137:1412-1415
19. Mo R, Jiang T, DiSanto R, Tai W, Gu Z. ATP-triggered anticancer drug delivery. Nat Commun. 2014;5:3364-3374
20. Kim BJ, Cheong H, Hwang BH, Cha HJ. Mussel-Inspired Protein Nanoparticles Containing Iron(III)-DOPA Complexes for pH-Responsive Drug Delivery. Angew Chem Int Ed Engl. 2015;54:7318-7322
21. Wang T, Wang D, Yu H, Wang M, Liu J, Feng B. et al. Intracellularly Acid-Switchable Multifunctional Micelles for Combinational Photo/Chemotherapy of the Drug-Resistant Tumor. ACS Nano. 2016;10:3496-3508
22. He Q, Shi JL. MSN Anti-Cancer Nanomedicines: Chemotherapy Enhancement, Overcoming of Drug Resistance, and Metastasis Inhibition. Adv Mater. 2014;26:391-411
23. Wang R, Zhu G, Mei L, Xie Y, Ma H, Ye M. et al. Automated modular synthesis of aptamer-drug conjugates for targeted drug delivery. J Am Chem Soc. 2014;136:2731-2734
24. Li J, Mo L, Lu CH, Fu T, Yang HH, Tan W. Functional nucleic acid-based hydrogels for bioanalytical and biomedical applications. Chem Soc Rev. 2016;45:1410-1431
25. Zhu G, Niu G, Chen XY. Aptamer-Drug Conjugates. Bioconjug Chem. 2015;26:2186-2197
26. Keefe AD, Pai S, Ellington A. Aptamers as therapeutics. Nat Rev Drug Discovery. 2010;9:537-550
27. Lao YH, Phua KK, Leong KW. Aptamer nanomedicine for cancer therapeutics: barriers and potential for translation. ACS Nano. 2015;9:2235-2254
28. Zeng Y, Zhang D, Wu M. Liu Y, Zhang X, Li L, et al. Lipid-AuNPs@PDA nanohybrid for MRI/CT imaging and photothermal therapy of hepatocellular carcinoma. ACS Appl Mater Interfaces. 2014;6:14266-14277
29. Kheyrabadi LK, Mehrgardi MA, Wiechec E, Turner AP, Tiwari A. Ultrasensitive detection of human liver hepatocellular carcinoma cells using a label-free aptasensor. Anal Chem. 2014;86:4956-4960
30. Niemeyer CM, Ceyhan B, Hazarika P. Oligofunctional DNA-gold nanoparticle conjugates. Angew Chem Int Ed Engl. 2003;42:5766-5770
31. Wang X, Cai X, Hu J, Shao N, Wang F, Zhang Q. et al. Glutathione-triggered "off-on" release of anticancer drugs from dendrimer-encapsulated gold nanoparticles. J Am Chem Soc. 2013;135:9805-9810
32. Zeng X, Liu X, Kong B. Wang Y, Wei W. A sensitive nonenzymatic hydrogen peroxide sensor based on DNA-Cu2+ complex electrodeposition onto glassy carbon electrode. Sens Actuators B Chem. 2008;133:381-386
33. Gao YG, Sriram M, Wang AH. Crystallographic studies of metal ion-DNA interactions: different binding modes of cobalt(II), copper(II) and barium(II) to N7 of guanines in Z-DNA and a drug-DNA complex. Nucleic Acids Res. 1993;21:4093-4101
34. Zheng H. Xing L, Cao Y, Che S. Coordination bonding based pH-responsive drug delivery systems. Coord Chem Rev. 2013;257:1933-1944
35. Langner A, Tait SL, Lin N, Chandrasekar R, Meded V, Fink K. et al. Selective coordination bonding in metallo-supramolecular systems on surfaces. Angew Chem Int Ed Engl. 2012;51:4327-4331
36. Xing L, Zheng H, Che S. A pH-responsive cleavage route based on a metal-organic coordination bond. Chemistry. 2011;17:7271-7275
Author contact
![]() Corresponding author: E-mail Address: xiaoloong.liucom Or E-mail Address: drjingfengcom.
Corresponding author: E-mail Address: xiaoloong.liucom Or E-mail Address: drjingfengcom.