13.3
Impact Factor
Theranostics 2016; 6(11):1887-1898. doi:10.7150/thno.16358 This issue Cite
Research Paper
Targeting Negative Surface Charges of Cancer Cells by Multifunctional Nanoprobes
1. The Institute for Translational Nanomedicine, Shanghai East Hospital, The Institute for Biomedical Engineering & Nano Science, Tongji University School of Medicine, Shanghai, 200120, China;
2. Department of Biomaterials, College of Materials, Xiamen University, Xiamen 361005, China;
3. Institutes of Biomedical Sciences, Fudan University, Shanghai, 200032, China;
4. Public Health Sciences, University of Miami School of Medicine, Miami, FL 33136, USA;
5. Department of Geological Sciences, School of Earth, Energy & Environmental Sciences, Stanford University, Stanford, CA 94305-2115, USA;
6. Materials Science and Engineering Program, Department of Mechanical and Materials Engineering, College of Engineering and Applied Science, University of Cincinnati, Cincinnati, Ohio, USA;
7. Department of Pathology, Wake Forest University School of Medicine, Winston-Salem, North Carolina, USA.
* These authors contributed equally.
Received 2016-6-2; Accepted 2016-7-11; Published 2016-8-7
Abstract

A set of electrostatically charged, fluorescent, and superparamagnetic nanoprobes was developed for targeting cancer cells without using any molecular biomarkers. The surface electrostatic properties of the established cancer cell lines and primary normal cells were characterized by using these nanoprobes with various electrostatic signs and amplitudes. All twenty two randomly selected cancer cell lines of different organs, but not normal control cells, bound specifically to the positively charged nanoprobes. The relative surface charges of cancer cells could be quantified by the percentage of cells captured magnetically. The activities of glucose metabolism had a profound impact on the surface charge level of cancer cells. The data indicate that an elevated glycolysis in the cancer cells led to a higher level secretion of lactate. The secreted lactate anions are known to remove the positive ions, leaving behind the negative changes on the cell surfaces. This unique metabolic behavior is responsible for generating negative cancer surface charges in a perpetuating fashion. The metabolically active cancer cells are shown to a unique surface electrostatic pattern that can be used for recovering cancer cells from the circulating blood and other solutions.
Keywords: Targeting, Biomarker, Nanoprobe, Surface Charge, Cell Metabolism, Lactate Secretion, Glycolysis.
Introduction
A great challenge in cancer diagnosis is to identify molecular biomarkers specific and universal to all cancer cells [1, 2]. A key application includes detection of the circulating tumor cells (CTC) from whole blood. The current CTC detection based on molecular biomarkers has been hampered by limitations in specificity and sensitivity of the methods. Therefore, new targeting strategies need to explore other bio-physical properties of cancer cells. Furthermore, the underlying mechanism responsible for the common bio-physical behavior of cancer cells, distinctively different from the normal cells, will not only provide the fundamental understanding of disease processes of cancer but also for clinical diagnosis and treatment.
The cell surface charges are the net electricity, which is different from the trans-membrane potentials [3]. In the last several decades, the studies on the electrostatic properties of somatic cell surfaces have been inconclusive and even contradicting. The contributing factors affecting the cell surface net charges include the levels of the charged components on the plasma membranes, the activities of the ion channels on the plasma membranes, and the neutralizing systems in the body fluids. The plasma membrane contains the charged molecules, such as glycolipids and glycoproteins. Therefore, the cell surface net charge is a dynamical process and complicated by the competing processes between the immobile components and the mobile ions with opposite charges. For instance, the serum proteins and the buffer systems are capable of neutralizing surface charges of the solid components in the body fluids. The ion channels and pumps present on the plasma membranes all play major roles in cell surface charge behaviors by transporting a significantly larger amount of ions across the plasma membranes.
Traditionally, the surface charges and trans-membrane potentials were extensively studied by using single-cell electrodes in the excitable neurons and muscle cells [4, 5]. In these cells, the changes of cell surface charges were driven primarily by the transient ion flows across the plasma membranes via ion pumps and ion channels without changing the immobile molecular composition. However, all these old methods, including single-cell electrodes and cell electrophoresis, were unable to evaluate the entire cell populations [6-11].
Nanoprobes (NPs) have emerged in recent years to study the cellular surface properties. One apparent advantage of using NPs for the assays is the improved sensitivity. However, cells in general can take up NPs nonspecifically via the general biochemical reactions with the receptors or via endocytosis of foreign objects [12]. The interactions between cells and small particles are therefore not limited only to the electrical forces. This may be highly significant when the NPs are conjugated with the functional groups, such as amino acids or proteins. Much of the inconsistent results could also be attributed to lacking of the proper means for minimizing and controlling the nonelectrical reactions. As a result, the cancer cell surface charges have never been well understood and utilized for targeting purposes.
The goals of this study are: 1) to develop a set of electrically charged, fluorescent, and superparamagnetic NPs for the assessment of cell surface charges without using any molecular biomarker; 2) to electrostatically target and magnetically capture cancer cells in solution as a quantitative assay for the overall charge status of the cell population; 3) to investigate the electrical charge behaviors of both cancer cells and normal cells, and 4) to identify the factors that can influence the cellular surface charges.
Materials and Methods
Nanomaterials
All initial reagents were obtained commercially. Iron (III) chloride hydrate (FeCl3•6H2O), ethylene glycol, sodium acetate, ammonium hydroxide (NH4OH, 28 wt%), and hydrochloric acid (37 wt% aqueous solution) were purchased from Shanghai (China) Reagent Company. Tetraethyl orthosilicate (TEOS), (3-Aminopropyl)triethoxysilane (APTES) and fluorescein isothiocyanate (FITC) were obtained from Sigma-Aldrich (USA). Branched poly(ethylene imine) (PEI, 99%, MW=10,000) were acquired from Alfa Aesar. Deionized water (DIW, 18.2 MΩ•cm resistivity at 25°C) was produced by a Thermo Easypure II UF System throughout the entire experiment.
Cell culture materials
RPMI-1640 medium, the heat-inactivated fetal bovine serum, penicillin-streptomycin and 0.25% trypsin-EDTA were purchased from Gibco Corp. Dulbecco's Modified Eagle's medium (DMEM) and phosphate-buffered saline (PBS) were purchased from Hyclone Corp. All rest of media for cell culture were acquired from Corning Corp.
Construction of electrically charged NPs
The magnetic microspheres were prepared by a solvothermal reaction [13]. Briefly, 2.56 g of sodium acetate and 0.81 g of FeCl3•6H2O were dissolved in 30 mL of ethylene glycol under magnetic stirring. The obtained homogeneous yellow solution was transferred to the Teflon-lined stainless-steel autoclave and heated at 200°C for 10 h. The autoclave was then cooled to the room temperature. The products were washed 3 times with ethanol and 3 times with DIW.
For the construction of the magnetic nanocore (Fe3O4@SiO2), 1.5 mL of Fe3O4 aqueous dispersion (100 mg/mL) was treated in 0.15 M HCl aqueous solution under sonication for 15 min. After being treated by acid, the treated Fe3O4 microspheres were dispersed in the mixture of ethanol and water (v/v = 70/30) for 10 min. Then ammonium hydroxide was added to the dispersion to adjust to pH 9.5. A certain amount of TEOS was added into the reactor with vigorous stirring and the reaction lasted for about 24 h at the room temperature. The extra reactants were removed from the Fe3O4@SiO2 after being washed 2 times with ethanol and 2 times with DIW.
For the preparation of the negatively charged NPs, 10 µL of APTES and 1mg of FITC were reacted under a dark condition overnight in 2 mL ethanol. Then, 100 mg of Fe3O4@ silica composite microspheres were dispersed in 45 mL 70% ethanol for 15 min and 1.3 mL of ammonium hydroxide and 30 µL of TEOS were added into the second reaction system. After incubation for 3 h, APTES-FITC compound was added and reacted for another 20 h in dark. The reaction mixture was washed with 3 times with ethanol and 3 times with DIW.
For the preparation of the positively charged NPs, the negatively charged NPs were used as the seeds and modified by PEI under gentle stirring and ultrasonication for 2 h. Final products were washed 3 times with DIW.
Materials characterization
Transmission Electron Microscopy images were obtained by a Philips Tecnai 20 microscope. Scanning Electron Microscopy images were taken using a JEOL SM4800 microscope. The surface zeta potentials of the magnetic NPs were obtained on a Dynamic light scattering particle size analyzer (Zetasizer Nano-ZS90, Malvern, UK). Fluorescence images were recorded with a CCD camera (Nikon DS-Ri1) mounted on an inverted fluorescence microscope (Ti-U, Nikon, Japan). A spinning-disk confocal microscope (Andor Revolution XD) was used for the confocal images.
Cell culture
K562 Cells, PC-3 cells, LNCaP cells, and BGC-823 cells were grown in RPMI 1640 medium supplemented with the 10% (v/v) heat-inactivated fetal bovine serum (FBS) and 1% (v/v) penicillin-streptomycin (PS) at 37°C in a 5% CO2 humidified atmosphere. Other cells were cultured at 37 °C in DMEM supplemented with 10% FBS and 1% (v/v) PS in a humidified atmosphere in the presence of 5% CO2. Typically, cells were passaged by trypsinization and maintained in medium accordingly.
Preparation of primary cells
The research was approved and performed under the ethical and legal standards of Ethics Committee of Shanghai East Hospital. Primary hepatocytes were isolated from rats as previously reported [14, 15]. Cell viability was > 90% as determined by the trypan blue exclusion test. For primary culture in 24-well plates, 1×10e5 Cells per well were plated. Two hours after seeding, cells were incubated in DMEM containing 10% FBS, 100 U/mL penicillin, and 100 µg/mL streptomycin.
Mouse primary renal cells were isolated and cultured as previously described with minor modification [16]. Upon isolation, the renal cells were resuspended in DMEM containing 1% antibiotic/antimycotic solution (Sigma-Aldrich, 10,000 U/mL penicillin, 0.1 mg/mL streptomycin, and 0.25 µg/mL amphotericin B), with 10% horse serum (Invitrogen Corp.). Cultures were incubated at 37°C with 5% CO2.
PMN and MNC cells were isolated by density gradient centrifugation from human whole blood according to a previously published method [17] with some modifications. Briefly, peripheral blood was collected in a vial containing EDTA as an anticoagulant. Ten mL of fresh blood was collected and red blood cells were sedimented. The buffy coat was collected and layered on top of a discontinuous percoll gradient. The buffy coat was separated into the residual red blood cells, granulocytes, mononuclear cells, platelets and plasma. Viability of collected cells was analyzed by trypan blue dye exclusion test.
Cells fluorescence microscopy
Hela cells were grown at 37°C in DMEM medium under normal cell culture conditions to approximately 70% confluency. The culture wells were washed thoroughly with PBS and incubated with PBS containing 100 µg/mL NPs on ice with gentle shaking for 60 min. The wells were then washed thoroughly with PBS to remove unattached NPs and examined by fluorescence microscope.
Cells seeded in 96-well plates were incubated with the negatively or positively charged NPs at 4°C for 15 min. After incubation, the wells were rinsed gently with PBS to remove the non-interacting NPs. The cell samples were then imaged using fluorescence microscopy (Ti-U, Nikon, Japan) equipped with an electron multiplying charge-couple device (EMCCD) camera (Nikon DS-Ri1).
Electrical charge evaluation of NPs
NPs were suspended in water at neutral pH 7 and zeta potential was measured by Zetasizer Nano-ZS90. Data were plotted using the percentages of cells in y axis against the average potential in mV in x axis.
The surface zeta potential distributions of the magnetic NPs in aqueous solution were measured using dynamic light scattering.
Cell capturing by magnetic field
Hela cells were cultured at 37°C in DMEM medium under normal cell culture conditions to approximately 70% confluency. The culture wells were washed thoroughly with PBS, trypsinized, washed again with PBS, and resuspended in PBS. NPs were added at the indicated concentrations to the cell suspensions and incubated on ice for 60 min with gentle agitation. After incubation, the NP-bound cells were captured by a permanent magnet placed against the side wall of the tube and free cells were removed by washing with PBS for 3 times. The captured cells were released by removing the magnet and resuspended in PBS. Both captured and free cells were counted as 100%. The data were presented as the percentages of magnetically captured cells and free cells.
Charged NPs of different concentrations were added to cell suspension (1×10e6) cells per mL and incubated with gentle shaking on ice for 2 min. They were then isolated and washed with a magnet. The captured and uncaptured cells were counted by hemocytometer.
Effects of glucose on cancer cells
To study the effects of glucose in culture medium on the surface charges of cancer cells, K562 cells were first grown under the normal grown condition at 10 mM glucose till 30% plate confluency. The culture media were then replaced with the DMEM media of different glucose concentrations as indicated in Figure 6A and incubated with cells at 37°C for 48 h. The magnetic capture efficiency of cells by the positive NPs was subsequently determined. The concentration of lactic acid secreted by K562 cells was measured by a lactic acid detection kit.
Effects of indirect glycolysis inhibitor DCA on cancer cells
Dichloroacetate acid (DCA) is an indirect inhibitor of glycolysis. DCA does not directly inhibit any enzyme of glycolysis pathway, but rather, promote oxidation of pyruvate in mitochondria, and in turn, shunt the pyruvate away from becoming lactate, thus inhibiting the conversion of pyruvate to lactate. K562 cells were grown under normal culture conditions to 30% confluency. Various concentrations of DCA indicated in Figure 7B were added to cell culture media and incubated at 37°C for 48 h. The magnetic capture efficiency of cell by the positive NPs was subsequently determined. The concentration of lactic acid secreted by K562 cells was measured by a lactic acid detection kit.
Effects of direct glycolysis inhibitor 3BP on cancer cells
3-bromopyruvate (3BP) is a direct inhibitor of glycolysis. 3BP blocks the activities of the first enzyme, hexokinase, and the glycolysis pathway. K562 cells were grown under normal culture conditions to 30% confluency. Various concentrations of 3BP as indicated in Figure 7D were added to cell culture media and incubated at 37°C for 24 h. The magnetic capture efficiency of cell by the positive NPs was subsequently determined. The concentration of lactic acid secreted by K562 cells was measured by a lactic acid detection kit.
Effects of extra lactate in culture medium on cancer cells
K562 cells were grown under normal culture conditions to 30% confluency. Various concentrations of extra lactate as indicated in Figure 8A were added to cell culture media and incubated at 37°C for 24 h. The pH value of the culture media was maintained at 7.4 by adding lactic acid and ammonium lactate with the same molar ratio. The magnetic capture efficiency of cell by the positive NPs was subsequently determined. The concentration of lactic acid secreted by K562 cells was measured by a lactic acid detection kit.
Treatment of cell surface with sialidase
Hela cells were grown under normal conditions to 50% confluency and trypsinized into suspension solution serum-free DMEM. S180 cells were grown in suspension directly, washed and resuspended in serum-free DMEM. Neuraminidase (sialidase, 1.28 mg/mL) was added and co-incubated at 37°C for 30 min. The magnetic capture efficiency of cells by the positive NPs was subsequently determined
S180 cells were first grown in DMEM under normal culture conditions. The cells were washed and resuspended in serum-free DMEM. Neuraminidase (sialidase) was used to remove sialic acid residues from the surfaces of cancer cells. Briefly, neuraminidase (1.28 mg/mL) was co-incubated with S180 cells at 37°C in serum-free DMEM and 5% CO2 for 30 min. The cancer cells were then magnetically captured by the NPs and counted.
Results
Design, Synthesis, and characterization of the NPs
Our first experimental consideration was to enable more efficient interactions between NPs and target cells. The second consideration was to minimize nonspecific interactions between NPs and unwanted cells. With these considerations in the NP design [18-20], superparamagnetic Fe3O4 nanocores were utilized for effective magnetic capture and separation of the attached cells. FITC fluorescence dyes were used for direct imaging of the NPs binding on the cells. The electrically charged surface functional groups on the NPs provided electrostatic force driven capability for cancer cell binding and consequent capture without using any biomarker. With this design, only the positively charged NPs were attached to cancer cells, but not those negatively charged ones.
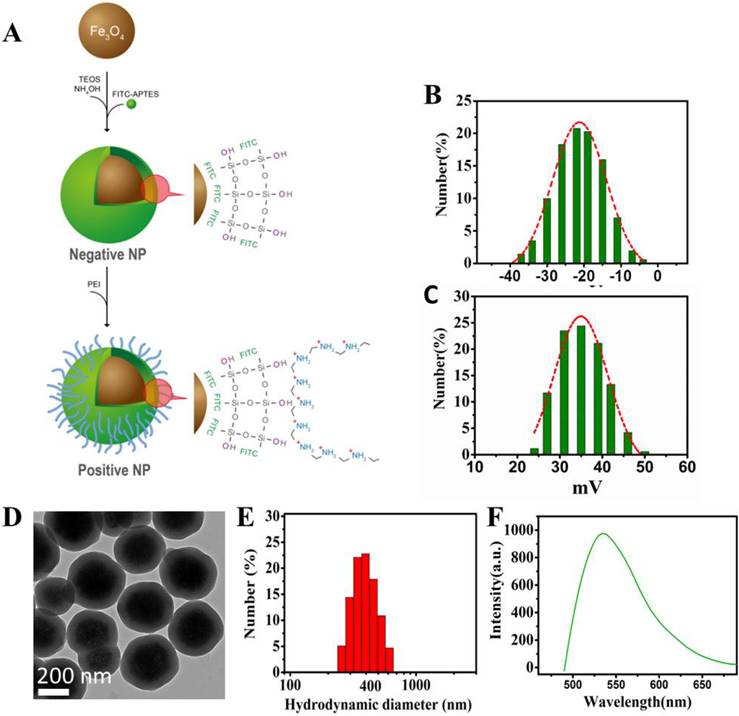
The schematic diagram of the NP synthesis is shown in Figure 1. As shown in Figure 1A, the superparamagnetic Fe3O4 NPs are conjugated with APTES to form a thin layer of SiO2 shell on the NPs' surface upon reaction with TEOS and NH4OH. FITCs are embedded in the SiO2 shell, thus exposing the Si-linked hydroxyl groups and creating the negative surface charge. For the positively-charged NPs, PEI molecules are used not only to cover the SiO2-OH groups in a non-covalently manner but also to expose the additional amine groups that carry the positive charges.
The zeta potential of the NPs was used as a measure of surface charges. Figure 1B and 1C show the zeta potential distributions of the negative and positive NPs under the same experimental condition. Most of the negative NPs exhibited a peak zeta potential of -20 mV, while that of the positive ones was +35 mV. Both negatively and positively charged NPs were evenly dispersed in water or buffer, such as PBS without clumping, and found stable for at least 12 months. Consistent with the nano-structure depicted in Figure 1A, the transmission electron microscopy showed a uniform SiO2 coating (~ 60 nm) on the NPs' surface with an average particle diameter of 320 nm (Figure 1D). Upon surface functionalization, the hydrodynamic diameter was in the range of 400 nm, as shown in Figure 1E. The NPs were conjugated with FITC, exhibiting an emission at 525 nm (Figure 1F). The pH dependences of zeta potentials for the negative and positive NPs are depicted in the Figure S1.
Design and characterization of the nanoprobes. (A) Schematic diagram showing the design of the Fe3O4 multi-functional nanoprobe which is rendered fluorescent with FITC. (B) Zeta potential distributions of negative NPs. (C) Zeta potential distributions of positive NPs. (D) Transmission electron microscopy showing the image of NPs with a thin layer of silica coating. (E) Light scattering histogram showing the hydrodynamic diameter distributions of NPs. (F) Fluorescence spectroscopy showing the emission of NPs having a peak around 525 nm.
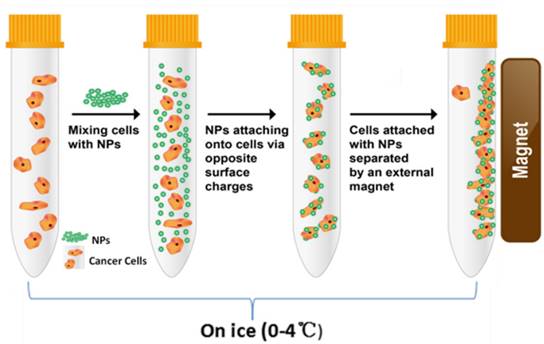
Schematic diagram showing the procedure of magnet capturing of the cells. The cells in suspension are mixed with NPs of different electrical charges. Cell/NP bindings take place due to the opposite charges. The captured cells are magnetically attracted to the side of the tube by a permanent magnet.
Interaction of the NPs with cancer cells
To compare the levels of cell surface charges, we developed a unique method for characterizing the surface charges of cells in suspension. In order to eliminate endocytic events, all cell-NP incubations were performed on ice. At this low temperature, the cells were incubated with NPs of different electrical charges (Figure 2). Adherent cells were mobilized by trypsin and incubated separately with the positive and negative NPs. Upon electrostatic interaction with a sufficient number of NPs, the captured cells are “pulled” to the side of the tube by a magnet.
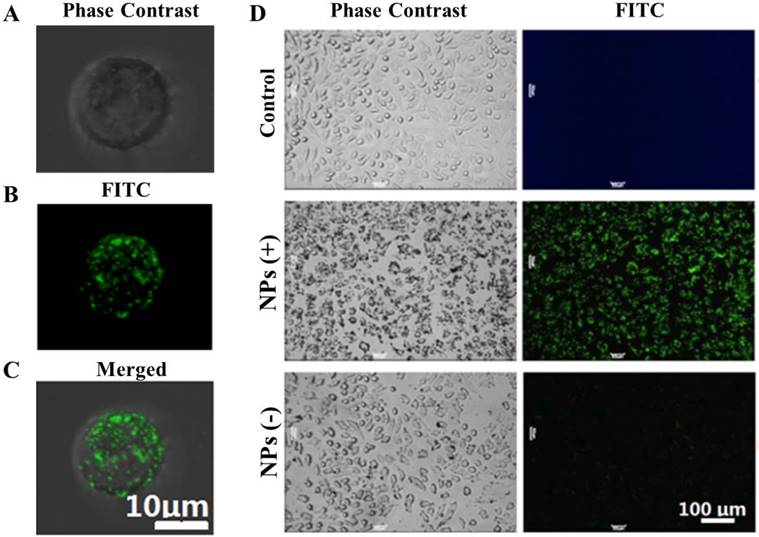
Figure 3 shows the phase contrast and florescent images of cell binding with NPs of different changes. Figure 3A shows the phase-contrast image of a Hela cell. Figure 3B is the fluorescence image of the positively-charged NPs attached on the very cell surface shown in Figure 3A, while Figure 3C is the superimposed image of Figure 3A and 3B. As shown in these images, based on the NPs' fluorescence intensity, a large number of the positive NPs were electrostatically bound to the surface of the Hela cell, due to opposite charges.
The interaction of NPs with multiple Hela cells is shown in Figure 3D. The left and right panels are the phase contrast and fluorescent images, respectively. The images in the top row are the control Hela cells without NPs. The images in the middle and bottom rows are Hela cells reacted respectively with positive and negative NPs. The strong fluorescence in the middle row indicates a high level binding of the positive NPs onto the cell surfaces.
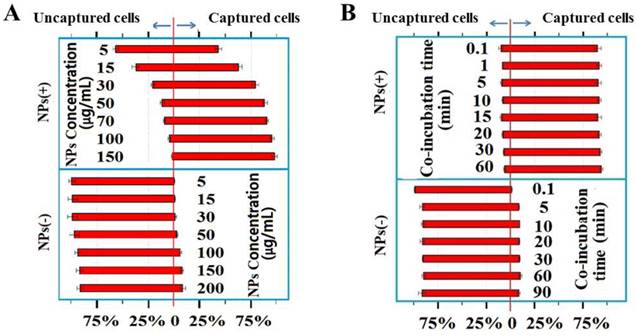
To further characterize the dynamics of the cell/NPs interactions, we incubated Hela cells at a constant number with various concentrations of NPs ranging from 5 to 150 µg/mL. The NP-bound cells were then magnetically captured and separated. The magnetic capture efficiencies of Hela cells by NPs of different charges are plotted at various NP concentrations (Figure 4A) and incubation times (Figure 4B). Positive NPs and negative NPs showed a completely different pattern of interaction with cancer cells. The number of cells captured by the negative NPs is not significant under both conditions, especially at low NP concentrations (Figure 4A).
In order to determine the interaction between Hela cells and the NPs over time, we incubated the cells with the positive NPs for periods ranging from 0.1 to 60 min on ice. As shown in Figure 4B, the NP-cell interactions are complete within 0.1 min, the shortest time within which we could start and stop the reactions. The extremely rapid reaction between the positive NPs and Hela cells is consistent with a charge-based mechanism, since cellular endocytic and biochemical mechanisms would have required a much longer interaction time, minutes to hours at low temperatures.
NPs of both signs were incubated with 22 different randomly-selected cancer cell lines and 4 types of primary normal cells freshly purified from healthy subjects of human, mouse, and rat. The experimental results showed a preferential binding of the positive NPs to all the 22 tested cancer cell lines but not the normal cells (Figure 5A). Initially, only a low level binding of negative NPs to the cancer cells was observed. However, upon additional washes, the cells binding to the negative NPs diminished to an insignificant level whereas the cells bound to the positive NPs remained largely unchanged (Figure S2).
Optical and fluorescent images of Hela cells with binding of NPs on the surfaces. (A) the phase-contrast image of a Hela cell; (B) the fluorescence image of the positively-charged NPs attached on the very cell surface shown in (A), and (C) the superimposed image of (A) and (B). (D) Optical and fluorescent images of NPs with multiple Hela cells. The left and right panel images are respectively the phase-contrast and fluorescent fields for Hela cells upon reacting with the NPs. The images in the top row are Hela cells without the NPs controls. The images in the middle row are Hela cells upon reacting with the positive NPs. The images in the bottom row are Hela cells upon reacting with the negative NPs.
(A) Magnetic capture efficiencies of Hela cell by both positive and negative NPs at various concentrations indicated. (B) The percentages of cells captured by the positive and negative NPs at the times indicated.
(A) Net surface charges of cells. The calculated net surface charges expressed in this figure is the net captured percentage of cells by one type charge sign NPs subtracted by the cells captured by the NPs with opposite charge sign as controls. Microscope photographs of blood smear (Green arrow to MNC cell & orange arrow to PMN cell) (B), blood smear with breast cancer MDA-MB-231 cells (Red arrow to MDA-MB-231 cell) (C), MDA-MB-231 cells smear (D) and positive NPs captured MDA-MB-231 cells from blood (E).
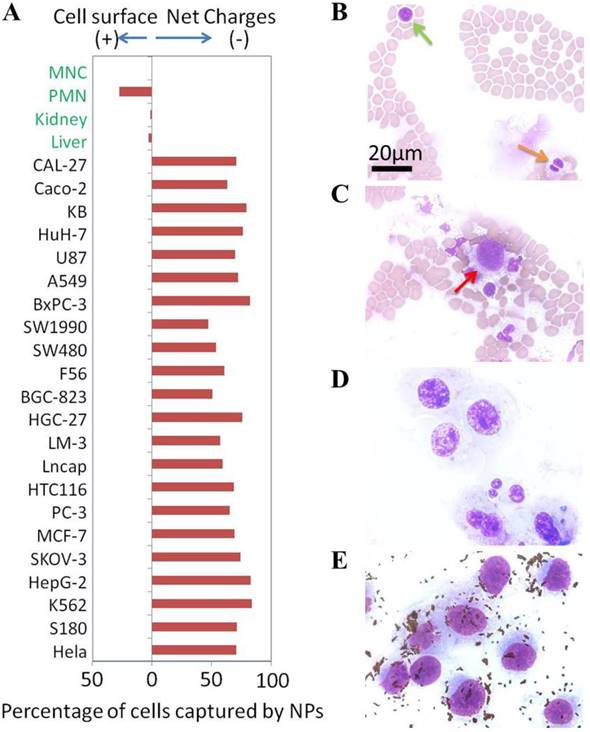
To further confirm that the surface charges of cancer cells were indeed different from the primary normal cells in blood, we mixed 2.7×10e5 human breast cancer cells (MDA-MB-231) with 500 µL whole blood (containing at least 3×10e9 blood cells). These cells were captured by the positive NPs, washed and counted. An aliquot of cells was spread onto slides and stained with HEMA 3®. Figure 5B and 5C respectively show the typical field of normal blood smear and the normal blood spiked with MDA-MB-231 cells. The image of MDA-MB-231 cells is shown in Figure 5D. Figure 5E shows an image of MDA-MB-231 cells recovered by the positive NPs as the small dots that surround the cells. The efficiency of cancer cell recovery reached over 90% (2.5×10e5 of 2.7×10e5). The purity of recovery was found to be over 80% with a small number of granulocytes that were apparently interacting with the cancer cells. The magnetic capture resulted in at least 10,000 folds of cancer cell enrichment from the blood. These experimental results showed that the negatively charged surfaces of cancer cells tested in this study were indeed unique in comparison to primary normal cells.
Mechanism of surface charge generation via lactate secretion
All known bioelectric phenomena in mammalian cells are generated by the cross-membrane movement of mobile ions [21]. Most human cells are actively maintained as charge-neutral or slightly positive at the surfaces via the ion pumps and channels on the plasma membrane. If cells possess a significant amount of surface charge, it must be generated by an abnormal movement of mobile ions across the plasma membrane. If the surface charge is negative, this can only be generated by either an inward movement of cations or an outward movement of anions across the plasma membrane. By examining all known properties of cancer cells, one metabolic pattern is consistent with this hypothesis. Nearly all metabolically active cancer cells, whether in vivo or in vitro, are known to secrete a large amount of lactate as mobile anions [22]. This is a result of increased glycolysis in which the levels of glucose uptake and lactate secretion can be up to 30 times greater than that of normal cells. Therefore, we propose that the negative charges on the surface of cancer cells are largely generated by the increased glycolysis and the associated lactate secretion across the plasma membrane.
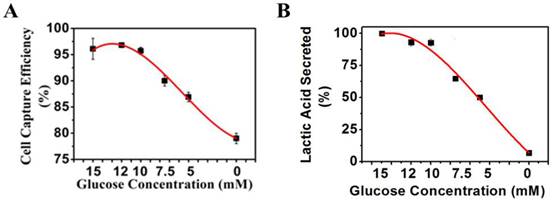
To test this hypothesis, we measured the levels of lactate secretion from cancer cells and the related changes in the negative surface charge when the glycolysis pathway or lactate secretion alone was altered by several different methods. First, we reduced the supply of glucose in the culture media of the cancer cells for 48 h. The lactate secreted from the cells into the culture media was measured directly. The negative surface charge was correlated to the percentages of the K562 cells captured magnetically. We found a 17% drop in the cancer cell capture efficiency (Figure 6A) when decreasing the glucose concentration from 10 to 0 mM within 48 h. As expected, secretion of lactate from the cancer cells was also considerably reduced (Figure 6B).
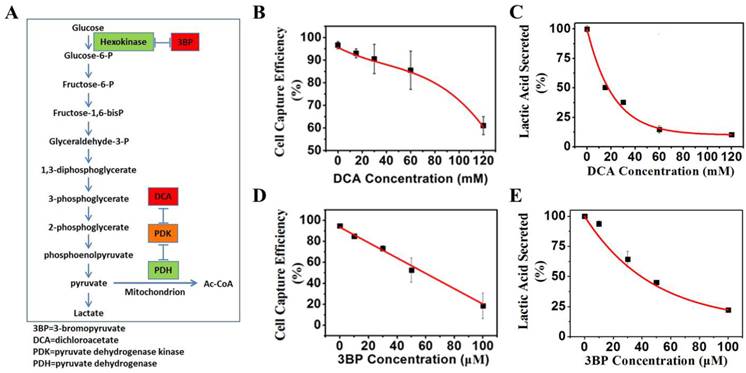
Furthermore, we used either an indirect inhibitor DCA of glycolysis or a direct inhibitor 3BP for the same purpose of varying the glucose levels of culture media. Both DCA and 3BP are effective glycolysis inhibitors as described in Figure 7A. DCA has been found to inhibit aerobic glycolysis and promotes pyruvate oxidation [23]. 3BP are synthetic brominated derivatives of pyruvic acid that have been reported as a highly reactive alkylating agent and a direct glycolysis inhibitor [24]. Figure 7B shows a 35% decrease in the captured cells when 120 mM of DCA is added for 48 h. The corresponding lactate secretion variation can be seen in Figure 7C. Consistently, as shown in Figure 7D, a much greater reduction of 75% is found in the captured cells when 100 µM 3BP is present for 24 h. The effect of 3BP on secretion of lactate is also pronounced as shown in Figure 7E.
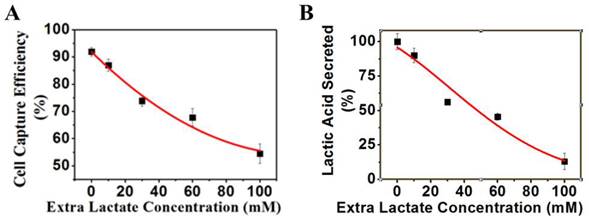
Lactate secretion occurs from a cancer cell only when extracellular lactate is dissipated away into the interstitial space. If there is a lactate buildup outside of the cell, the secretion of lactate would be specifically disrupted. If the surface negative charges are generated solely by lactate secretion, an elevation of extracellular lactate alone without blocking the glycolysis pathway would result in a decrease of lactate secretion and the surface charge of cancer cells. Based on this rationale, we designed a set of experiments to measure the surface charge and lactate secretion of cancer cells with increased extracellular lactate concentrations. When extracellular lactate concentration increased from 0 to 100 mM, the charge-based capture of cancer cells was reduced from 92% to 55% (Figure 8A), and the lactate secretion decreased from 15 mM to 2 mM (Figure 8B). These results are consistent with the generation of cell surface charge via anionic lactate movement across the membrane.
The electrical charge has been associated with the charged molecules on the cell surfaces. For example, sialic acid moieties of glycolipids and glycoproteins are believed to contribute to the electric properties of cancer cell surfaces [25, 26]. However, a previous study indicated that the surface sialic acid moieties were mostly removed from the cell surfaces by sialidase [27]. By using the same treatment, as shown in Figure S3, there is no significant change in cell capture efficiency, suggesting that immobile sialic acids at the surface do not contribute significantly to the negative surface charges of the cancer cells.
(A) K562 cancer cell capture efficiency vs. glucose concentration when reacting with the positive NPs. (B) Lactic acid secreted by K562 cancer cells vs. glucose concentration.
(A) Mechanisms of glycolysis inhibition via dichloroacetate (DCA) and bromopyruvate (3BP) for varying the glucose levels of culture media. (B) K562 cell capture efficiency vs. the concentration of glycolysis inhibitor DCA when reacting with the positive NPs. (C) Lactic acid secreted by K562 cancer cells vs. the glycolysis inhibitor DCA. (D) K562 cancer cell capture capacity vs. the glycolysis inhibitor 3BP when reacted with the positive NPs. (E) Lactic acid secreted by K562 cancer cells vs. direct glycolysis inhibitor 3BP.
(A) K562 cell capture capacity vs. extra lactic concentration when reacted with the positive NPs. (B) Lactic acid secreted by the K562 cells vs. extra lacate concentration.
Discussion
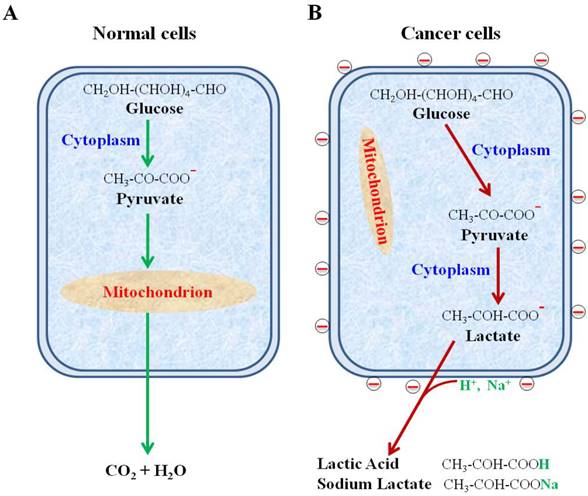
We have shown the negative surface charges as a unique pattern of cancer cells. In contrast, the normal cells, including all blood cells, do not possess this property. Using the uniquely designed NPs, we have recovered cancer cells from human blood with high efficiency and purity. The negative charges were found to be generated from the large quantity of lactate secretion, a known property of all metabolically active cancer cells. These findings are summarized in Figure 9.
Despite of the decades-long efforts, there has not been any theoretical consensus or clinical application based on the electrical properties of cancer cells. This study has, for the first time, provided unequivocal evidence for a unique electrical pattern of cancer cell surfaces from as many as 22 different types of cancer cells in comparison to primary normal cells. The experimental results of this study significantly differ from the previous reports on how to measure the cell surface charges. For example, the human granulocytes were reportedly to have the negatively charged surfaces whereas the data of this study clearly indicate their positive charged surfaces [28]. We attribute this contrast to the different methodologies employed by these studies. The multifunctional NPs developed in this study enabled direct assessment of the cell surface charge via electrostatic targeting, binding, and magnetic capturing of cancer cells from various solutions including blood. The findings of this study reveal a fundamental property of cancer cells and have profound potentials in clinical applications.
The phenomenon of the elevated glycolysis is unique for cancer cells and has been used widely for cancer diagnosis for decades. The level of glucose uptake and lactate secretion in cancer cells can be up to 30 folds higher than the normal cells, giving a basis for the cancer detection technologies, such as PET (Positron Emission Tomography) scan [29]. Radioactively labeled glucose can be preferentially taken up by cancer cells for imaging. Thus, the elevated glucose metabolism is a significant hallmark of cancer cells. In comparison to the glucose uptake, the secretion of lactate is also an inevitable outcome of glycolysis [30]. Our results show that lactate secretion is a direct cause for the negative charges on the cancer cell surfaces. It is not unreasonable to assume that the surface charges are consequentially linked to another well-established hallmark of cancer cells. Due to instability of genomes, the protein profiles can be vastly different even in the adjacent cancer cells of the same lesion. The search for consistent biomarker molecules on the surfaces of cancer cells has proven to be very difficult. In comparison to any molecular ligand, the biophysical property of cancer cells associated with the unique metabolism in cancer cells may prove to be a much more reliable property for detection.
Conclusions
All movements of ions across plasma membranes cause significant changes of surface charge. Cancer cells are well-known to secrete a large amount of lactate anions across plasma membranes as a hallmark. Our studies have now revealed that this hallmark may have led to a generation of unique negative charges on the surfaces of cancer cells. Without an elevated glycolysis, the surfaces of normal cells remain charge-neutral or slightly positive. This unique biophysical property can allow cancer cells to be identified and captured using a nanotechnology-based method without having to use any specific molecular marker. This technology could also be used to study the electrical property of all cells, such as neurons and other excitable cells. In clinical settings, our findings and technologies may have significant implications in developing novel diagnostic assay and probably therapies for cancer.
Schematic diagram showing secretion of lactate anions leading to a loss of cations from cancer cell surface and leaving behind the negative charges. (A) Glucose metabolism via glycolysis and oxidative phosphorylation in normal cells. (B) Glucose metabolism via highly elevated glycolysis and suppressed oxidative phosphorylation in cancer cells.
Supplementary Material
Supplementary table: List of cell lines used in the experiments. Supplementary figure S1-S5.
Abbreviations
NP: nanoprobes; CTC: circulating tumor cells; TEOS: Tetraethyl orthosilicate; APTES: (3-Aminopropyl)triethoxysilane; FITC: fluorescein isothiocyanate; PEI: polyethyleneimine; DIW: deionized water; EDTA: ethylenediaminetetraacetic acid; FBS: fetal bovine serum; PMN: polymorphic nuclear cells; MNC: mononuclear cells; DMEM: Dulbecco's modified Eagle's medium; PBS: phosphate-buffered saline; DCA: Dichloroacetate acid; 3BP: 3-bromopyruvate.
Acknowledgements
This study was supported by Natural Science Foundation of China (No. 51302190), an internal funding of Tongji University, and a charitable donation from Mr. Jin Nie to ZC. The author DS from the University of Cincinnati is partially supported by a National Science Foundation grant EEC-1343568.
Competing Interests
The authors have declared that no competing interest exists.
References
1. La Thangue NB, Kerr DJ. Predictive biomarkers: a paradigm shift towards personalized cancer cedicine. Nat Rev Clin Oncol. 2011;8:587-96
2. Madu CO, Lu Y. Novel diagnostic biomarkers for prostate cancer. J Cancer. 2010;1:150-77
3. Adams DS, Levin M. General principles for measuring resting membrane potential and ion concentration using fluorescent bioelectricity reporters. Cold Spring Harb Protoc. 2012;2012:385-97
4. Delmar M. Bioelectricity. Heart Rhythm. 2006;3:114-9
5. Gouaux E, MacKinnon R. Principles of selective ion transport in channels and pumps. Science. 2005;310:1461-5
6. Ambrose EJ, James AM, Lowick JHB. Differences between the electrical charge carried by normal and homologous tumour cells. Nature. 1956;177:576-7
7. Purdom L, Ambrose EJ. A correlation between electrical surface charge and some biological characteristics during the stepwise progression of a mouse sarcoma. Nature. 1958;181:1586-7
8. Vassar PS. Electrophoretic mobility of human tumour cells. Nature. 1963;197:1215-6
9. Gogichadze G, Gogichadze T, Misabishvili E. et al. Possible effect of variable membrane potential of a cancer cell on different carcinogenic processes. Georgian medical news. 2014;234:116-20
10. Lipman KM, Dodelson R, Hays RM. The surface charge of isolated toad bladder epithelial cells mobility, effect of pH and divalent ions. The Journal of general physiology. 1966;49:501-16
11. Heard DH, Seaman GVF, Simon-Reuss I. Electrophoretic mobility of cultured mesodermal tissue cells. Nature. 1961;190:1009
12. Osaka T, Nakanishi T, Shanmugam S. et al. Effect of surface charge of magnetite nanoparticles on their internalization into breast cancer and umbilical vein endothelial cells. Colloids and Surfaces B: Biointerfaces. 2009;71:325-30
13. Xu XQ, Deng C, Gao M. et al. Synthesis of magnetic microspheres with immobilized metal ions for enrichment and direct determination of phosphopeptides by matrix-assisted laser desorption ionization mass spectrometry. Adv Mater. 2006;18:3289-93
14. Seglen PO. Preparation of isolated rat liver cells. Methods Cell Biol. 1976;13:29-83
15. Genin B, Andereggen E, Rubbia-Brandt L. et al. Improvement of the effect of hepatocyte isograft in the gunn rat by cotransplantation of islets of langerhans. J Pediatr. Surg. 1999;34:321-4
16. Breggia AC, Himmelfarb J. Primary mouse renal tubular epithelial cells have variable injury tolerance to ischemic and chemical mediators of oxidative stress. Oxid Med Cell Longev. 2008;1:33-8
17. Roos D, de Boer M. Purification and cryopreservation of phagocytes from human blood. Methods Enzymol. 1986;132:225-43
18. Wang F, Pauletti GM, Wang JT. et al. Dual surface-functionalized Janus nanocomposites of polystyrene / Fe3O4@SiO2 for simultneous tumor cell targeting and stimulus-induced drug release. Adv Mater. 2013;25:3485-9
19. Cho HS, Dong ZY, Pauletti GM. et al. Fluorescent, superparamagnetic nanospheres for drug storage, targeting, and imaging: a multifunctional nanocarrier system for cancer diagnosis and treatment. ACS Nano. 2010;4:5398-404
20. Shi DL, Cho HS, Chen Y. et al. Fluorescent polystyrene-Fe3O4 composite nanospheres for in vivo imaging and hyperthermia. Adv Mater. 2009;21:2170-3
21. Kuismanen E, Saraste J. Low temperature-induced transport blocks as tools to manipulate membrane traffic. Methods Cell Biol. 1989;32:257-74
22. Gadsby DC. Ion Channels versus ion pumps: the principal difference, in principle. Nat Rev Mol Cell Biol. 2009;10:344-52
23. Sanchez WY, McGee SL, Connor T. et al. Dichloroacetateinhibits aerobic glycolysis in multiple myeloma cells and increases sensitivity to bortezomib. Br J Cancer. 2013;108:1624-33
24. Pedersen PL. 3-Bromopyruvate (3BP) a fast acting, promising, powerful, specific, and effective "small molecule" anti-cancer agent taken from labside to bedside: Introduction to a special issue. J Bioenerg Biomembr. 2012;44:1-6
25. Strilic B, Eglinger J, Krieg M. et al. Electrostatic cell-surface repulsion initiates lumen formation in developing blood vessels. Curr Biol. 2010;20:2003-9
26. Recio-Pinto E, Thornhill WB, Duch DS. et al. Neuraminidase treatment modifies the function of electroplax sodium channels in planar lipid bilayers. Neuron. 1990;5:675-84
27. Tsui ZC, Chen QR, Thomas MJ. et al. A method for profiling gangliosides in animal tissues using electrospray ionization-tandem mass spectrometry. Anal Biochem. 2005;341:251-8
28. Gallin JI, Durocher JR, Kaplan AP. Interaction of leukocyte chemotactic factors with the cell surface. I. Chemotactic factor-induced changes in human granulocyte surface charge. J Clin Invest. 1975;55:967-74
29. Gambhir SS. Molecular imaging of cancer with positron emission tomography. Nat Rev Cancer. 2002;2:683-93
30. Annibaldi A, Widmann C. Glucose metabolism in cancer cells. Curr Opin Clin Nutr. 2010;13:466-70
Author contact
![]() Corresponding authors: E-mail: zhengcuiedu; donglu.shiedu
Corresponding authors: E-mail: zhengcuiedu; donglu.shiedu
 Global reach, higher impact