Impact Factor
- Issue 14; 2026
- Issue 13; 2026
- Issue 12; 2026
- Issue 11; 2026
- Issue 10; 2026
- Volume 16; 2026
- Advance Articles
- Past Issues
- Cover Images
- Cover Suggestion
- Index & Coverage
- Special Issues
Introduction
Results and Discussion
Conclusion
Experimental Methods
Supplementary Materials
Acknowledgements
References
International Journal of Biological Sciences
International Journal of Medical Sciences
 Global reach, higher impact

Theranostics 2016; 6(11):1844-1865. doi:10.7150/thno.15088 This issue Cite
Research Paper
In vivo Biocompatibility, Biodistribution and Therapeutic Efficiency of Titania Coated Upconversion Nanoparticles for Photodynamic Therapy of Solid Oral Cancers
Sasidharan Swarnalatha Lucky1,2, Niagara Muhammad Idris2, Kai Huang 2, Jaejung Kim2, Zhengquan Li3, Patricia Soo Ping Thong4, Rong Xu5, Khee Chee Soo4, Yong Zhang1,2 ![]()
1. NUS Graduate School for Integrative Sciences & Engineering (NGS), Singapore 117456.
2. Department of Biomedical Engineering, National University of Singapore, Singapore 117575.
3. Institute of Physical Chemistry, Zhejiang Normal University, P. R. China 321004.
4. Division of Medical Sciences, National Cancer Centre Singapore, Singapore 169610.
5. School of Chemical & Biomedical Engineering, Nanyang Technological University, Singapore 637459.
Received 2016-1-26; Accepted 2016-3-2; Published 2016-7-18
Abstract

Despite the advantages of using photodynamic therapy (PDT) for the treatment of head and neck tumors, it can only be used to treat early stage flat lesions due to the limited tissue penetration ability of the visible light. Here, we developed near-infrared (NIR) excitable upconversion nanoparticle (UCN) based PDT agent that can specifically target epithelial growth factor receptor (EGFR) overexpressing oral cancer cells, in a bid to widen the application of PDT against thick and solid advanced or recurrent head and neck cancers. In vivo studies using the synthesized anti-EGFR-PEG-TiO2-UCNs following systemic administration displayed no major sub-acute or long term toxic effects in terms of blood biochemical, hematological or histopathological changes at a concentration of 50 mg/kg. NIR-PDT even in the presence of a 10 mm tissue phantom placed over the xenograft tumor, showed significant delay in tumor growth and improved survival rate compared to conventional chlorin-e6 (Ce6) PDT using 665 nm red light. Our work, one of the longest study till date in terms of safety (120 d), PDT efficacy (35 d) and survival (60 d), demonstrates the usefulness of UCN based PDT technology for targeted treatment of thick and bulky head and neck tumors.
Keywords: Oral cancer, EGFR, photodynamic therapy, upconversion nanoparticles, titanium dioxide, near-infrared.
Introduction
Oral cancer is the sixth leading cancer by incidence worldwide with poorest clinical outcomes.[1] Surgical management of oral cancer often leads to severe morbidity due to disfiguration and functional impairment. Although, surgery combined with chemotherapy and radiotherapy can improve the overall survival of patients with advanced oral cancers, approximately one-third experience loco-regional recurrences and/or distant metastasis,[2] accounting for poor prognosis and low survival rate.[3, 4] The primary tumor site, nodal involvement, tumor thickness, and the status of the surgical margin dictates the prognosis of the disease.[5] The median thickness for T1 and T2 tumors ranges from 4.3 and 8 mm respectively, and the prognosis significantly change with thickness where tumors <4 mm had 100% survival rates compared to 74% for those 4 mm or more thick.[6] Photodynamic therapy (PDT) of oral cancers, which involves the administration of a photosensitive drug or photosensitizer (PS) and subsequent activation with visible light of a specific wavelength to generate cancer cell killing reactive oxygen species (ROS), has been garnering significant interest as an alternative therapeutic modality. However, limited tissue penetration ability of visible light impede activation of the PSs beyond a few mm from the oral mucosa, and the results from phase I/II trials also suggests that PDT could be an effective treatment only in patients presenting with early head and neck tumors.[7] Clearly, new and improved therapeutic options are urgently needed for selective destruction of thick, solid, advanced and recurrent oral cancers.
Recently, the application of deep tissue penetrating near-infrared (NIR) excitable upconversion nanoparticles (UCNs) loaded with suitable PSs have shown great potential in improving the penetration depth limitations of conventional PDT.[8, 9] These nanoparticles have the ability to upconvert low-energy NIR light to high energy visible or ultra-violet (UV) light, via an anti-Stokes emission process. The upconverted light then excites the PS attached on the surface of the UCNs. Different strategies have been reported to attach PS on UCNs, namely silica encapsulation, covalent conjugation, physical adsorption and electrostatic interaction, however none of these techniques ensure stable binding of the PS, often compromising the repeatability of the PDT results.[8] Some recent studies utilized a promising UV light excitable inorganic photocatalyst, titanium dioxide (TiO2), by fabricating non-uniform composite nanostructures with a few UCNs embedded in TiO2 matrix,[10] or seeding TiO2 nanoparticles forming crystallized shells on the core UCNs in an effort to improve the PDT effect of TiO2.[11] Thereafter, a few other groups developed multifunctional theranostic TiO2 based UCNs nanocomposites by integrating a Gd-based UCN core (NaGdF4) which can be used for magnetic resonance imaging [12] or incorporating chemotherapeutic agents like doxorubicin for combined chemotherapy and PDT [13]. Recently, we demonstrated a facile method of directly surface coating a uniform and thin layer TiO2 on the surface of individual UCNs (TiO2-UCNs), to attain stable and controllable loading of the PS.[14, 15] Our proof of concept in vivo studies following intratumoral administration of PEGylated TiO2-UCNs (Mal-PEG-TiO2-UCNs) confirmed the potential of the nanoconstruct in significantly delaying tumor growth.[15] Although intratumoral delivery could result in extremely high doses of drugs with in the tumor with minimal systemic toxicity, this technique is often discouraged in clinical practice due to 3 reasons: (1) the tumor can simply be resected instead of injecting it with drugs, (2) disturbing the tumor could stimulate metastasis along the needle track, and (3) in case of metastatic disease local chemotherapy may not be helpful. Thus, to gain further insight into the usefulness and clinical applicability of this nanoconstruct, it is necessary to study its biodistribution, toxicity, long term effects and therapeutic potential in vivo following intravenous delivery.
The present study aims to further modify the PEGylated TiO2-UCNs with a targeting moiety against epithelial growth factor receptors (EGFRs), in order to achieve its site specific delivery to oral cancers. EGFR is known to be overexpressed in up to 90% of head and neck squamous cell carcinoma,[16, 17] playing a critical role in proliferation, invasion, metastasis, angiogenesis as well as therapeutic resistance.[18] Here, a non-immunoglobulin-derived affinity protein known as Affibody® was chosen as the targeting agent due to its small size and low immunogenicity.[19, 20] The fabricated anti-EGFR-affibody conjugated PEGylated TiO2-UCNs (anti-EGFR-PEG-TiO2-UCNs) were subjected to rigorous characterization and its selective cell targeting, ROS generation and PDT efficiency were studied in vitro. Although, UCNs have been deemed safe with no major toxic effects in various reports that performed short term toxicity[21] and biodistribution studies,[22, 23] their long term effects and potential bioaccumulation remain largely unexplored. Hence, before studying the therapeutic effect of these nanoparticles following systemic administration in vivo, its biodistribution and long term (120 d) toxicity profiles were analyzed, to determine a single safe dose for systemic administration in vivo. Lastly, we have also compared the therapeutic efficiency of UCN-based 980 nm NIR PDT, with conventional PS Chlorin e6 (Ce6) excited at 665 nm visible light to highlight the advantage of utilizing NIR light for the control of solid and bulky tumors.
Results and Discussion
Synthesis of anti-EGFR-PEG-TiO2-UCNs
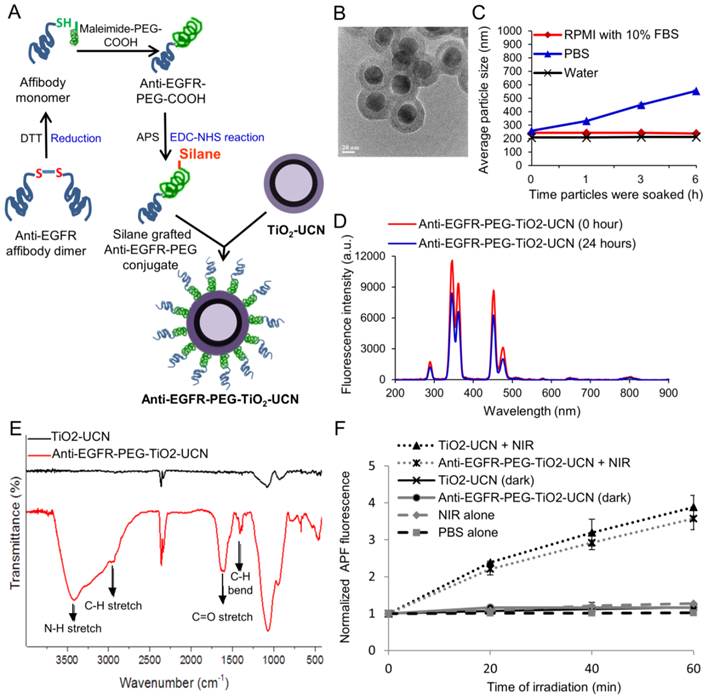
TiO2-UCNs were synthesized according to our previously published protocol. [14, 15] To conjugate the anti-EGFR affibodies to TiO2-UCNs, dimerized anti-EGFR affibody molecules were first reduced with dithiothreitol (DTT) to expose the thiol (-SH) group on the reactive cysteine residue (Figure 1A). The thiol group then reacts with the maleimide group of the maleimide-PEG-COOH, to generate anti-EGFR-PEG-COOH. Further addition of 3-aminopropyl trimethoxysilane (APS) results in the reaction between amino group (-NH2) on APS with COOH group on the PEG, resulting in the functionalization of the PEG chain with a silane group. In the final step, tetraethyl orthosilicate (TEOS) was added which conferred hydroxyl (OH) groups on the surface of unmodified TiO2-UCNs for the attachment of the silane group of PEG-affibody conjugates resulting in the formation of anti-EGFR-PEG-TiO2-UCNs.
(A) Schematic of synthesis of anti-EGFR-PEG-TiO2-UCN. (B) TEM image of anti-EGFR-PEG-TiO2-UCN (scale bar: 50 nm). (C) Average hydrodynamic size of 100 μg/ml anti-EGFR-PEG-TiO2-UCN soaked in different media at room temperature (RT) plotted as a function of time the nanoparticles were soaked. (D) Fluorescence emission spectra of 100 μg/ml anti-EGFR-PEG-TiO2-UCN in PBS irradiated immediately by NIR light and irradiated 24 h after soaking in PBS. (E) FT-IR absorption spectra of TiO2-UCN and anti-EGFR-PEG-TiO2-UCN. (F) ROS production from irradiated and non-irradiated anti-EGFR-PEG-TiO2-UCNs in PBS and corresponding unmodified TiO2-UCNs; *P<0.0001, Data are mean (n=2) ± SD.
Characterization and ROS generation ability of anti-EGFR-PEG-TiO2-UCNs
Transmission electron microscopy (TEM) imaging of anti-EGFR-PEG-TiO2-UCNs revealed spherical shape with ∼50 nm diameter and a well-defined core-shell structure (Figure 1B and S1A). The composition of the core-shell particles was further confirmed by Energy-dispersive X-ray (EDX) spectroscopy as displayed in Figure S1B. The peaks labelled Na, Y, F, Yb and Tm originate from the core nanocrystals, while that of Ti, Si and O come from the shell. The nanoconstructs demonstrated good dispersion stability in water and RPMI cell culture medium with 10% fetal bovine serum (FBS) (Figure 1C) and the hydrodynamic sizes were found to be relatively stable up to 6 h, except in phosphate buffered saline (PBS). This could be due to the high ionic strength of PBS, which may have resulted in a reduced electrical double layer thickness around the nanoparticles.[15] This correspondingly leads to a weaker electrostatic repulsive force between the nanoparticles resulting in the formation of slightly large sized aggregates in PBS. However, in the presence of serum, the serum proteins might have loosely bound to the nanoparticles creating a steric barrier preventing it from coming to each other; thus maintaining a stable dispersion in RPMI with serum. The zeta-potential of the nanoparticles were found to be weakly negative (Table 1), also contributing to the possibility of formation of aggregates. However polydispersity index (PDI) was around 0.2, which indicate formation of a stable dispersion at least up to 6 h following their dispersion in various solutions.
Zeta-potential and PDI of 100 μg/ml anti-EGFR-PEG-TiO2-UCN, immediately after dispersing in various solutions.
| Zeta potential (mV) | PDI | |
|---|---|---|
| Water | -16.5 ± 1.01 | 0.14 ± 0.01 |
| PBS | -7.82 ± 0.44 | 0.16 ± 0.02 |
| RPMI with 10% FBS | -7.62 ± 0.52 | 0.23 ± 0.02 |
Upon NIR irradiation the nanoparticles dispersed in PBS, emitted mainly in the UV and blue regions of the spectrum (Figure 1D). However, there was a slight drop (<1.5 times) in the fluorescence emission following 24 h soaking of the nanoparticles in PBS. This could probably be due to aggregate formation, hence all the studies were performed before 24 h. Fourier transform infrared spectroscopy (FT-IR) absorption spectra confirmed successful grafting of PEGylated affibody conjugates on the surface of TiO2-UCN, with characteristic peaks of PEG appearing at ≈2885 and ≈1470-1350 cm-1 corresponding to C-H stretching and C-H bending, as well as N-H stretch and C=O stretch pertaining to the amide linkage observed at ≈3500 and ≈1690 cm-1 respectively (Figure 1E). Upon NIR irradiation, anti-EGFR-PEG-TiO2-UCNs generated significant amount of ROS in PBS compared to the corresponding non-irradiated anti-EGFR-PEG-TiO2-UCNs (Figure 1F). In addition to that, in comparison with unmodified TiO2-UCNs there is no significant drop in the ROS generation after conjugation of the nanoparticles with anti-EGFR affibodies.
Determination EGFR expression in oral cancer cells
To ascertain the level of EGFR expression in OSCC, the cells were immunofluorescently stained with anti-EGFR antibodies and the expression levels were compared with EGFR overexpressing human epidermoid A431 cells (positive control) and low EGFR expressing human breast adenocarcinoma MCF-7 cells (negative control). The OSCC cells revealed significant red fluorescence particularly on the surface of the cells (Figure S2A), confirming high cell surface expression of EGFR. In order to further confirm and quantify the level of EGFR in both OSCC cell and xenograft tumor, western blotting was performed (Figure S2B). The ratio of EGFR intensity plotted against actin was higher for A431 cell lysate (2.0) compared to OSCC cell lysate (1.7), however the difference was not statistically significant (Figure S2C). OSCC tumor lysate had the highest EGFR expression (2.4), whereas the MCF-7 and normal lung fibroblast NHF cells showed low expression of EGFR levels (0.6). This observation reconfirms that both the OSCC cells and xenograft tumor expressed high levels of EGFR, and was suitable for further studies involving nanoparticles carrying targeting moieties against EGFR.
In vitro uptake and targeting efficiency of anti-EGFR-PEG-TiO2-UCNs
When compared to unmodified TiO2-UCNs, the anti-EGFR-PEG-TiO2-UCNs were internalized much more rapidly and efficiently (∼3.8 folds) by OSCC cells within 3 h of incubation (P<0.0001) (Figure 2A and B). This could most likely be due to the presence of the targeting moieties that could have initiated immediate attachment of anti-EGFR-PEG-TiO2-UCNs to the EGFR receptor triggering receptor mediated endocytosis of these nanoparticles. To compare the internalization efficiency of anti-EGFR-PEG-TiO2-UCNs, various cell-lines with high copy number of EGFR genes such as A431 and human lung adenosquamous carcinoma H596, EGFR wild type large cell lung cancer cell-line H460 and low EGFR expressing MCF-7 and HepG2 cell lines were chosen. The cell lines with EGFR amplification, A431 and H596, displayed greater uptake of anti-EGFR-PEG-TiO2-UCNs (Figure S3A and B). At the same time, OSCC cells also showed no significant difference in the uptake of anti-EGFR-PEG-TiO2-UCNs compared to A431 or H596. On the other hand, EGFR wild type H460 cells, and low EGFR expressing MCF-7 and HepG2 cells revealed significantly lower uptake of anti-EGFR-PEG-TiO2-UCNs compared to A431 cells. This observation further reconfirms the advantage of having the targeting moiety on the surface of the nanoparticle that initiates the immediate attachment and internalization of the nanoparticles in cells that expressed the surface receptor against it. Furthermore, to study the uptake dynamics of the nanoparticles with in the cells, anti-EGFR-PEG-TiO2-UCNs were incubated with OSCC and MCF-7 cells at different time-points ranging from 30 min to 24 h. The highest uptake of nanoparticles was found to occur at 6 h post incubation with OSCC cells (Figure S4A). At the same time, the uptake of nanoparticles by MCF-7 cells at 6 h was about 2 times lower that that taken up by OSCC cells (P<0.0001) (Figure S4B and C), thus showing selectivity to EGFR expressing cells.
(A) Representative images of nanoparticle uptake (blue fluorescence) in OSCC cells post 3 h incubation; green (Alexa Fluor® 488) and red (Propidium iodide (PI)) fluorescence indicate cell membrane and nucleus respectively (Magnification: 200X, Scale bar: 20 μm). (B) Comparison of fluorescence intensities of 1 mM unmodified and anti-EGFR-affibody conjugated TiO2-UCNs internalized by OSCC cells. *P<0.0001, data are mean fluorescence intensities (n=5) ± SD. (C) Representative images of anti-EGFR-PEG-TiO2-UCN uptake in OSCC cells that were either pre-incubated at 4°C or 37°C, (Magnification: 400X, Scale bar: 20 μm) (D) Comparison of UCN fluorescence intensities showing uptake of anti-EGFR-PEG-TiO2-UCN in OSCC cells pre-incubated at different temperature, *P<0.0001, data are mean fluorescence intensities (n=5) ± SD. (E) Representative images of anti-EGFR-PEG-TiO2-UCN uptake in OSCC cells that were either pre-blocked with EGF. (F) Comparison of UCN fluorescence intensities showing uptake of anti-EGFR-PEG-TiO2-UCN in OSCC cells that were either not treated or pre-treated with EGF to block the EGFR receptors; *P<0.0001, data are mean fluorescence intensities (n=5) ± SD.
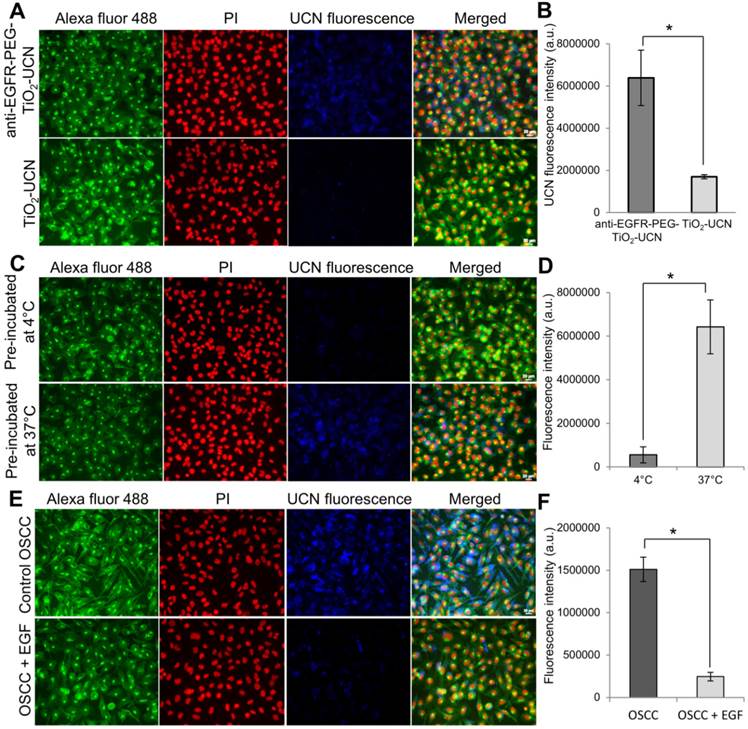
To check whether the uptake of anti-EGFR-PEG-TiO2-UCNs within the cells occurred via receptor mediated endocytosis, the cells were pre-incubated at 4°C when most of the energy-dependent activities such as endocytosis were suppressed. Consequently, the nanoparticle uptake was significantly reduced by ∼90% compared to the cells that were incubated at 37°C (P<0.0001) (Figure 2C and D), indicating that the internalization of the nanoparticles occurred via an energy dependent pathway. Finally, pre-blocking of the EGFR receptors by treating with EGF ligand also resulted in significant drop (∼85%) in the uptake of anti-EGFR-PEG-TiO2-UCNs (P<0.0001) (Figure 2E and F). This observation suggests that an interaction between anti-EGFR affibodies on the nanoparticles and the cell-surface EGFR receptors is a prerequisite for the enhanced cellular uptake of anti-EGFR-PEG-TiO2-UCNs.
In vitro dark toxicity and PDT using anti-EGFR-PEG-TiO2-UCNs
On comparing the toxicity of the nanoparticles post incubation with OSCC cells, both anti-EGFR-affibody conjugated nanoparticles were found to be less toxic and the cell-viability was not significantly lower than the untreated control cells up to a concentration of 1 mM (Figure 3A). Whereas unmodified TiO2-UCNs were found to cause significant decrease in cell viability from a concentration of 50 μM. Again, up to a concentration of 2 mM the viability of the cells treated with anti-EGFR-PEG-TiO2-UCN was still above 80%. However, the cell viability dropped below 50% at very high concentration of 5 mM.
(A) In vitro dark toxicity of nanoparticles incubated with OSCC cells for 6 h using MTT assay. (B) OSCC cell viability 24 h following in vitro PDT; control cells are untreated cells assumed to have 100% viability, light alone control are cells treated with NIR light alone. (C) In vitro PDT following incubation of anti-EGFR-PEG-TiO2-UCNs with various cells for a brief period of 1 h, to demonstrate selective cell killing; *P<0.0001, data are mean cell viability % (n=3) ± SD.
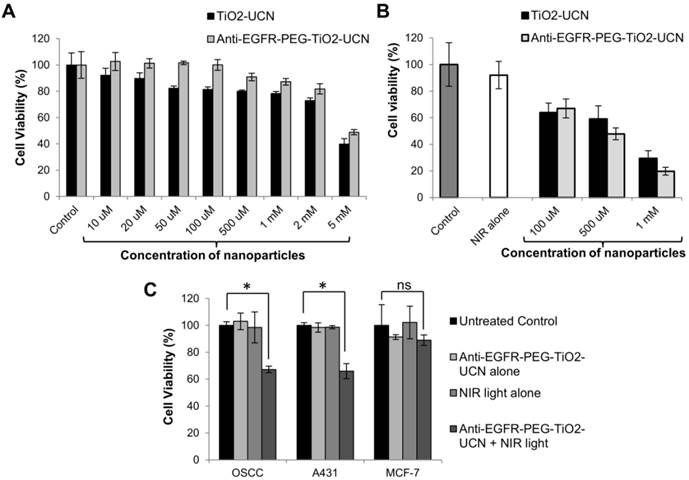
These results suggest that the PEG chains might have contributed to the biocompatibility of the anti-EGFR-PEG-TiO2-UCNs and that the conjugation of anti-EGFR affibody do not have any significant negative effect on the viability of the cells. In vitro PDT in OSCC cells post 6h incubation using the previously optimized light dose parameters demonstrated significant cell kill in a dose dependent manner when treated with anti-EGFR-PEG-TiO2-UCNs (Figure 3B). It was found that at a concentration of 1 mM about 80% of the OSCC cells were killed. Finally to demonstrate selective killing of EGFR expressing cells, anti-EGFR-PEG-TiO2-UCNs were briefly incubated (1h) with OSCC, A431 or MCF-7 cells. On irradiating the cells with 980 nm NIR light, similar amount of cell kill (∼35%) was achieved in A431 and OSCC cells (Figure 3C). On the other hand, there was merely any cell death in the case of MCF-7 cells. This again reiterates the fact that due to the presence of the targeting agent, anti-EGFR-PEG-TiO2-UCNs quickly attaches to the EGFR receptors expressed on the OSCC and A431 cells, within a short span of time, triggering internalization through receptor mediated endocytosis. As expected, the enhanced uptake of the targeted nanoparticles by the EGFR positive cells resulted in the higher cell death following NIR irradiation.
Blood contact properties of anti-EGFR-PEG-TiO2-UCNs
As soon as the nanoparticles are administered in to the blood stream they interact with the components of the blood, which is largely composed of proteins and blood cells (40-45% packed cell volume in blood), as well as the endothelial cells.[24] Depending on their physicochemical properties such as their shape, size, surface area, surface charge and composition, [25, 26] the nanoparticles may alter the balanced function of these cells and proteins. Thus, detailed evaluation of the blood-contact properties of the nanomaterials, such as hemolytic activity, platelet activation, as well as, clot formation and complement activation are essential to assess its safety for clinical applications. Hemolysis (damage to red blood cells (RBCs), is a fundamental in vitro test to determine the safety of a blood-contacting nanomaterial. The degree of hemolysis caused by both PEGylated and anti-EGFR conjugated TiO2-UCNs exposed to diluted mouse blood is shown in Figure 4A. The percent hemolysis remained below 1% across all the concentration range tested, and according to ASTM E2524-08 standard, percent hemolysis < 5% indicates that the test material is non-hemolytic.[27]
(A) Rate of hemolysis in RBCs upon 2 h incubation with nanoparticles at incremental concentrations, data are mean (n=2) ± SD. (B) Platelet activation assay presented in terms of concentration of PF4 in mouse blood plasma following intravenous administration of anti-EGFR-PEG-TiO2-UCNs, data are mean (n=3) ± SD. (C) Comparison of level of Prothrombin in blood plasma following intravenous injection of different doses of anti-EGFR-PEG-TiO2-UCNs; *P<0.0001, data are mean (n=3) ± SD. (D) Total complement activation assay presented in terms of C3 protein concentration in blood sera post intravenous delivery of anti-EGFR-PEG-TiO2-UCNs at different doses; *P<0.05, Data are presented as mean ± SD (n = 3 per group).
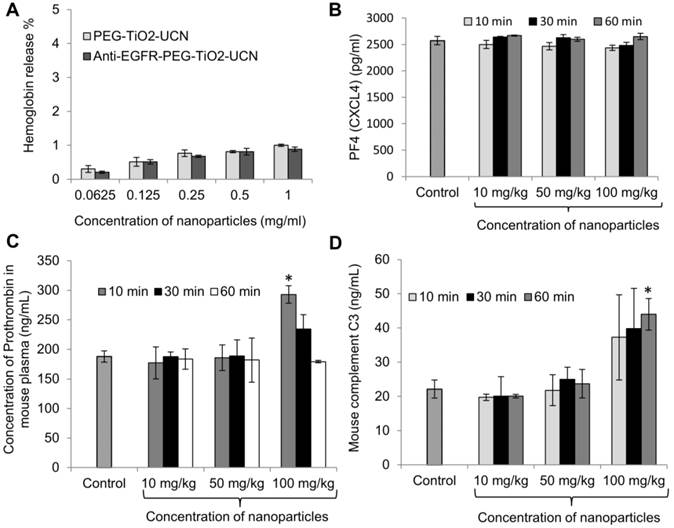
For in vivo blood contact property studies using the nanoparticles, a dose range of 10-100 mg/kg was chosen based on literature. Cui et al. reported a 100% death in animals that were intravenously injected with 220 mg/kg FA-modified chitosan coated UCN, within 7 d and the median lethal dose (LD50) was determined to be approximately 149 mg/kg.[28] As the onset of nanoparticle induced reactions associated with blood components could occur almost immediately after its systemic exposure, the blood was drawn at different time-points within the first 60 min to check for the various markers that indicate variations in normal hemostasis. Platelets (thrombocytes) are anucleate cytoplasmic discs that secrete factors necessary to convert soluble fibrinogen to insoluble fibrin, resulting in the formation of blood clot at the site of injury. Now, foreign or synthetic materials in contact with blood may trigger platelet aggregation and form blood clots without any injury, which could lead to undesirable or fatal consequences.[29] Nanoparticle induced platelet aggregation can occur due to direct interaction of the nanoparticles with platelets, releasing thrombin, which triggers the intrinsic pathway of blood clotting; whereas the extrinsic pathway (tissue factor dependent pathway) involves the release of blood clotting factors in the blood stream following vascular injury.[29] To check for the activation (and ultimately aggregation) of platelets following intravenous administration of anti-EGFR-PEG-TiO2-UCNs, the concentration of platelet factor 4 (PF4 or chemokine (C-X-C motif) ligand 4 (CXCL4)) was determined in mouse plasma based on the principle that PF4 that has an anti-heparin function is released during platelet aggregation, thus playing a role in blood clot formation.[30] It was found that there was no significant variation in the concentration of PF4 in the plasma of mice injected with any dose tested up to 1 h, compared to PF4 in the untreated control mice (Figure 4B). However, there was a significant increase in the level of prothrombin in blood plasma as early as 10 min post injection of anti-EGFR-PEG-TiO2-UCNs at a dose of 100 mg/kg (Figure 4C). This observation indicates that anti-EGFR-PEG-TiO2-UCNs displayed an acute dose-dependent thrombogenic activity that triggered the intrinsic pathway of blood clotting. Complement activation is another rapid-acting, first-line host defence mechanism that could be triggered by the exposure of nanoparticles in the bloodstream. The activation of this protein/glycoprotein network triggers a cascade of downstream events, resulting in effector functions such as lysis, opsonization, inflammation, secretion of immunoregulatory substances and immune clearance.[29] All the three complement pathways, namely classical, alternative and lectin, lead to the cleavage of C3 to form C3b (the major complement opsonin), and C3a (an anaphylatoxin that initiates inflammatory responses).[31] Hence, to assess in vivo complement activation, ELISA-based quantification of C3 in blood serum was done within 60 min of nanoparticle exposure (Figure 4D). The results showed increase in the level of C3 protein in serum of animals injected with 100 mg/kg anti-EGFR-PEG-TiO2-UCNs compared to the untreated controls, as early as 10 min post administration. Hence, the dose range up to 50 mg/kg was found to be safe, and did not trigger any major adverse blood-contact responses.
In vivo multi-dose sub-acute and sub-chronic toxicity study
Although the doses above 50 mg/kg were found to activate clot formation and trigger complement activation, an in vivo multi-dose (10-200 mg/kg) sub-acute (28 d) toxicity profiling of anti-EGFR-PEG-TiO2-UCN was performed to determine the immediate and acute toxic responses, physiological or behavioral changes, survival rates as well as sub-chronic (120 d) toxic effects of the nanoparticles. Mice injected with higher doses of nanoparticles (100 and 200 mg/kg), showed some signs of discomfort like pain and exhibited a decreased motor activity while and up to a few minutes after administration of the nanoparticle suspension, after which they did not differ noticeably from the control animals. The behavior of the mice in the other low dose groups was normal throughout the study. While there was neither a change in the weight of the animals in any of the groups (Figure S5), nor a variation in the amount of their food or water intake (Figure S6A and B), 40% of the animals injected with a dose of 200 mg/kg died within the first 3 d post intravenous delivery of the nanoparticles (Figure S6C). These mice showed obvious symptoms of labored breathing and difficulty in movement post injection. The mice in the other groups showed 100% survival up to 120 d and were found to be physiologically normal.
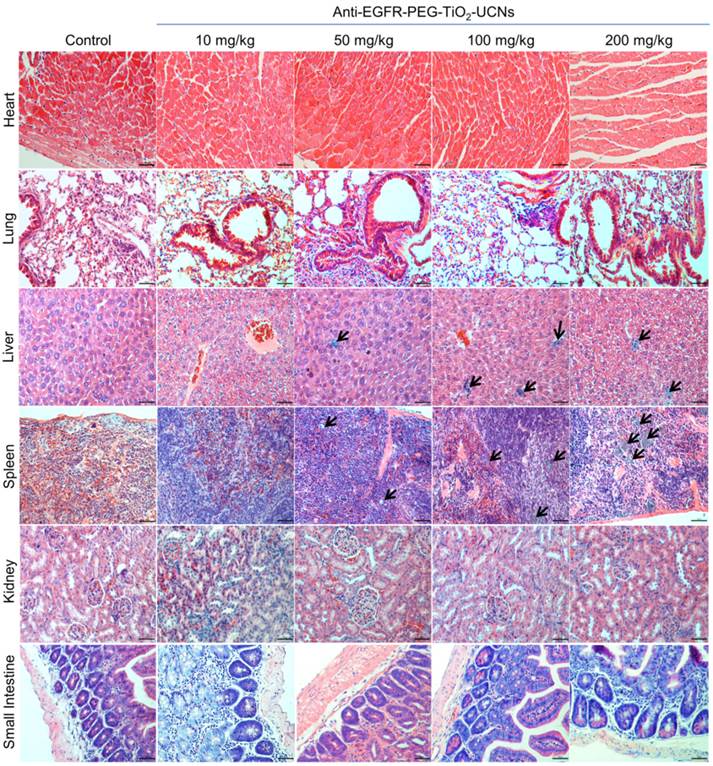
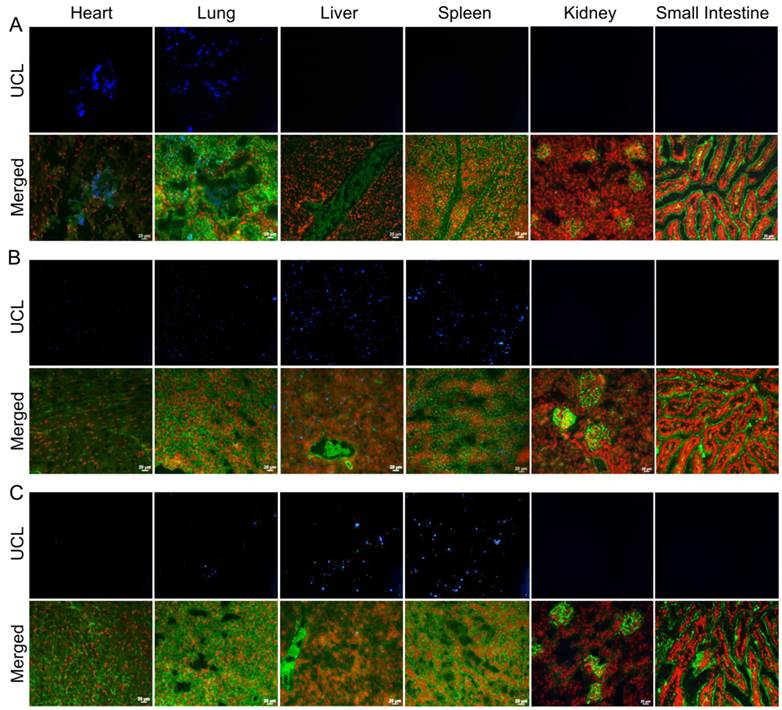
Histopathological evaluation of the tissues harvested at 120 d, revealed clusters of macrophages with intracytoplasmic pigments which probably were the ingested nanoparticles and were seen mostly in spleen, some in the liver and a very few in the lung (Figure 5). The nanoparticles were found to be localized within the interstitial macrophages in the lung, Kupffer cells in the liver and in macrophages both in the red and white pulp of the spleen. The amount of nanoparticles in these tissues were also found to be dose-dependent, with the highest concentration seen in animal injected with 200 mg/kg and a very few rather dispersed clusters of nanoparticles containing macrophages in the 50 mg/kg group. Although there was a very minimal to mild neutrophil infiltration in these organs, they were not necessarily associated with the presence of nanoparticles in the lung, liver or spleen. All other organs (heart, kidney and small intestine) seemed to be histologically normal and devoid of any signs of toxicity. Thus, from the above multi-dose hemocompatibility and long term toxicity studies, the dosage of 50 mg/kg body-weight was found to have minimal toxic effects on the animals and hence was chosen for the subsequent single dose toxicity, biodistribution and therapeutic studies.
Representative pictures from H&E stained sections of the heart, lung, liver, spleen, kidney and small intestine, harvested from mice at 120 d following intravenous administration of different doses of anti-EGFR-PEG-TiO2-UCNs. Black arrows denote clusters of macrophages with ingested nanoparticles. Magnification: 200X, scale bar: 50 µm.
In-vivo single-dose sub-acute toxicity study
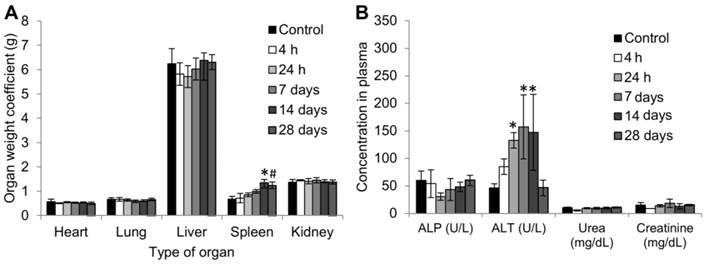
No obvious differences were found in the weight coefficients of the heart, lung, liver or kidneys between the control mice and mice injected with 50 mg/kg anti-EGFR-PEG-TiO2-UCN up to 28 d (Figure 6A). However, there was an obvious increase in the coefficient of spleen compared to control group from 24 h and remained high up to 28 d. Analysis of biochemical parameters in the plasma at various time-points up to 28 d revealed no significant changes in kidney function markers urea and creatinine (Figure 6B).
(A) Organ weight coefficients, data are presented as mean ± SD (n = 4-5 per group), *P=0.0011, #P=0.0031 (B) Biochemical parameters in blood plasma (Mean ± SD, n= 3-4) at different time-points, *P<0.0001.
Hematological parameters of mice treated with 50 mg/kg anti-EGFR-PEG-TiO2-UCN at different time points (Data are mean ± SD, n= 3-4).
| Controls | 4 h | 1 day | 7 day | 14 day | 28 days | |
|---|---|---|---|---|---|---|
| Red cell count (1012/L) | 9.5 ± 0.6 | 9.6 ± 0.1 | 10.2 ± 1.0 | 9.5 ± 0.1 | 9.9 ± 0.3 | 9.8 ± 0.3 |
| White cell count (109/L) | 2 ± 0.5 | 2.4 ± 0.2 | 5.6 ± 2.0 | 3.1 ± 1.1 | 4.1 ± 1.1 | 2.6 ± 0.2 |
| Hemoglobin (g/dL) | 14.4 ± 1.1 | 15.2 ± 0.6 | 15.7 ± 0.6 | 15.0 ± 0.2 | 15.2 ± 0.4 | 14.8 ± 0.2 |
| Platelets (109/L) | 426 ± 190.6 | 345.5 ± 54.4 | 438.3 ± 7.8* | 694 ±144.6* | 603 ± 104.4 | 763.75 ± 129.1* |
| Neutrophils (%) | 24.2 ± 7.5 | 78.5 ± 16.3 | 76.5 ± 13.9 | 52.3 ± 1.7 | 44.1 ± 20.3 | 51 ± 9.8 |
| Lymphocytes (%) | 42.05 ±9.7 | 17.5 ± 13.4 | 18.2 ± 8.9 | 39.3 ± 4.1 | 50 ± 19.8 | 42.575 ± 9.4 |
| Monocytes (%) | 6.2 ± 1.1 | 4 ± 2.8 | 6.2 ± 3.8 | 8.4 ± 2.7 | 5.8 ± 1.3 | 6.45 ± 1.6 |
| Eosinophils (%) | 0 | 0 | 0 | 0 | 0 | 0 |
| Basophils (%) | 0 | 0 | 0 | 0 | 0.1 ± 0.1 | 0 |
| Haemocrit (%) | 46.7 ± 3 | 48.5 ± 0.7 | 50 ± 2 | 48.3 ± 0.6 | 49.7 ± 1.5 | 48.8 ± 0.5 |
| MCV (fL) | 48 ± 0.6 | 50.5 ± 0.7 | 49.3 ± 3.1 | 50.7 ± 1.2 | 50.3 ± 1.2 | 50.3 ± 1 |
| MCH (pg) | 15.3 ± 0.6 | 16 | 16 ± 1 | 16 | 15.3 ± 0.6 | 15 |
| MCHC (g/dL) | 31.5 ± 1.2 | 31.5 ± 0.7 | 31.7 ± 0.58 | 31.3 ± 0.6 | 30.7 ± 0.6 | 30 |
| RDW (%) | 21.3 ± 0.4 | 19.2 ± 3.4 | 17.4 ± 1.2 | 17.2 ± 0.1 | 17.2 ± 0.2 | 17.5 ± 0.2 |
*P<0.05, #MCV Mean corpuscular volume, ‡MCH Mean corpuscular haemoglobin, ┴ MCHC Mean corpuscular hemoglobin concentration, †RDW Red cell distribution width.
Among the liver injury markers; although alkaline phosphatase (ALP) levels seemed to be normal throughout, there was a significant difference in the level of alanine aminotransferase (ALT), which increased right from 24 h post administration of 50 mg/kg anti-EGFR-PEG-TiO2-UCN. The ALT levels peaked (3 fold increase compared to controls) between 7 to 14 d, and then dropped back to normal levels at 28 d post injection. ALP is present in the cells lining the hepatic biliary ducts, while ALT exists in the cytoplasm of hepatocytes.[32] Increase in the plasma ALT concentration indicates altered hepatocellular membrane permeability resulting in the leakage of the enzyme into the bloodstream,[33] perhaps due to the presence of the nanoparticles. This could eventually progress to hepatocellular damage/necrosis, hepatocyte proliferation or hepatocellular degeneration. However, the fact that at 28 d the ALT levels are not significantly different from control, suggests that the altered membrane permeability could probably be reversed. Nevertheless, the increase in ALT level at 24 h post administration does indicate the probability of an acute liver damage, which could be further confirmed by histopathological analysis.
Evaluation of hematological parameters did not reveal any significant variations except for significantly high platelet counts as early as 24 h. Similar observations were reported following intraperitoneal administration of TiO2 nanoparticles in rats.[34] In addition to the increased platelet counts there was a mild increase in the white blood cell (WBC) and neutrophil counts, which signifies chronic inflammatory reaction in response to the exposure of the nanoparticles.[35] However, this was not statistically significant. While, platelets are known to assist in the modulation of inflammatory reaction and immune responses, neutrophils play a role in the phagocytosis of small particles. On the whole, there was no major hematological variation, except for a mild inflammatory/ immune response.
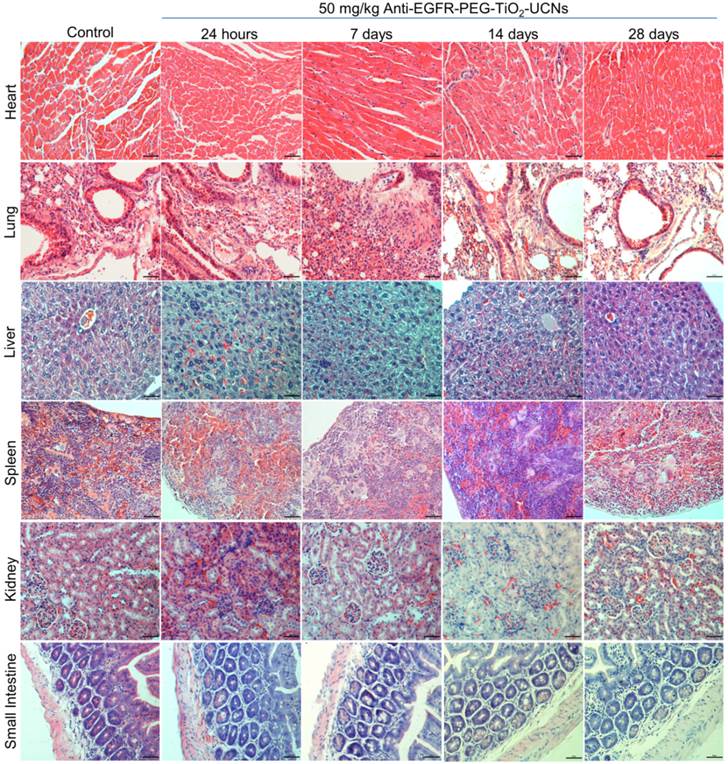
Further histopathological analysis of the major organs revealed very minimal to mild neutrophil infiltration in lung, liver and spleen between 24 h up to 28 d (Figure 7). Liver had normal hepatic architecture and hepatocytes, although some inflammatory cells were found in or adjacent to the bile ducts of the liver. Despite the high plasma ALT level, no obvious histopathological signs of liver injury were observed. However, minor lesions were observed in the spleen due to increased proliferation of local macrophages. All other organs seemed to be histologically normal and devoid of any signs of toxicity. As, the hematological results showed signs of immune system modulation, the expression of cytokines in the plasma of the mice was analyzed using a 64 target antibody array. It turned out that majority of the cytokine expression determined were significantly upregulated compared to that of controls, indicating a pronounced variation in the immune response within 30 min post exposure of anti-EGFR-PEG-TiO2-UCNs in the bloodstream (Figure 8).
Representative H & E stained images of the major organs (heart, lung, liver, spleen, kidney and small intestine) in mice harvested at different time-points (24 h to 28 d) following intravenous administration of 50 mg/kg anti-EGFR-PEG-TiO2-UCNs. Magnification: 200×, Scale bar: 50 µm.
Differential expression of various cytokines in the plasma of mice at 10, 30 and 60 min post injection of 50mg/kg anti-EGFR-PEG-TiO2-UCNs.*P<0.05, Data presented are mean spot intensity in 2 membranes ± SD.
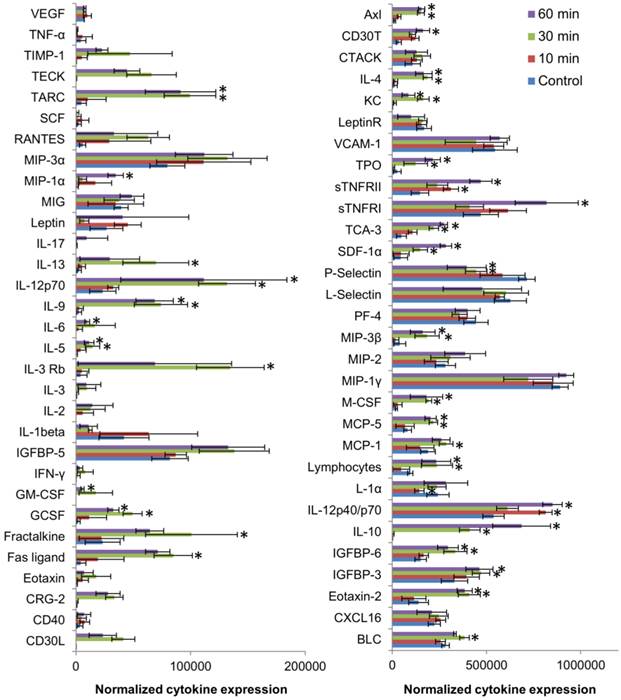
A detailed evaluation of the upregulated cytokines revealed that they mostly belonged to the Th2 class of cytokines (IL-4, IL-5, IL-6, IL-10, IL-13) which induced the macrophage polarization to M2 phenotype that were less phagocytic, and played a role in anti-inflammatory and wound healing process.[36] On the contrary, among the cytokines that did not vary significantly (IL-3, IL-2, IL-1β and IFN-γ), are the Th1 type cytokines that generally favor the induction of highly phagocytic macrophages with M1 phenotype resulting in a pro-inflammatory immune response. Besides, the overexpression of GCSF, GM-CSF and IL-6 at 30 min post systemic exposure of nanoparticles, could have consequently led to the mild increase in cytokine regulated production of the neutrophils,[35] as observed in the hematology data. Although affibodies are generally known to be less immunogenic, perhaps the high number of targeting ligands could have resulted in the quick recognition by the immune system,[37, 38] triggering the production of neutrophils and macrophages, with simultaneous activation of cytokines. Meanwhile, the biodistribution data suggests that majority of the nanoparticles are taken up by the spleen, the largest unit in the MPS system, that primarily functions to filter out the blood and remove pathogen and foreign materials.[39] The macrophage cells in the spleen and liver (Kupffer cells), are known to sequester nanoparticles resulting in the accumulation of the nanoparticles in these organs. This could invariably reduce the circulation half-life and bioavailability of the nanoparticles, and result in off-site toxicities, as indicated by elevated ALT levels. Thus, as reported by many others, high in vitro nanoparticles targeting efficiency due to the presence of a targeting ligand might not necessarily translate into in vivo efficiency, and hence in future it is important to perform and validate in vitro results in suitable in vivo models.[40] Optimization of the PEG chains, in terms of the chain length/molecular weight and surface coverage as well as fine-tuning of the number of targeting ligands linked to the PEG chains, without compromising the stability, the targeting ability and ROS generation of the nanoconstruct, might also be essential for further development of this nanoconstruct for clinical use.
In vivo biodistribution of anti-EGFR-PEG-TiO2-UCNs
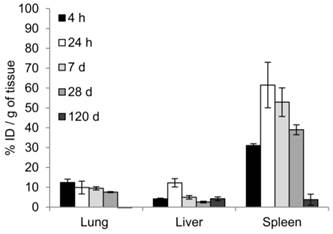
Biodistribution following the systemic administration of anti-EGFR-PEG-TiO2-UCNs was first studied by imaging of the sections from different organs, to generally locate the organs with high accumulation of nanoparticles. As expected, the upconversion luminescence (UCL) was observed primarily in the heart and lung, with in first 5 min of systemic administration (Figure 9A). At 4 h, the nanoparticles were mostly cleared from the heart but were localized in the lung, liver and spleen (Figure 9B); and continued to remain in these organs up to 24 h (Figure 9C). The kidney and small intestine did not show detectable levels of the nanoparticles with in the first 24 h. However, UCL imaging method is not quite apt to study the long-term biodistribution of the UCNs, as the signals might fade away with time. Hence, to quantitatively determine the biodistribution of the nanoparticles in mice, inductive coupled plasma atomic emission spectroscopy (ICP-AES) analysis of the tissue digests was performed to measure titanium ion concentrations in the organs that showed positive UCL signal in the imaging experiment. The result suggests that the nanoparticles accumulated in the lung, liver and spleen, as early as 4 h post administration (Figure 10). The highest uptake, about 60% of the injected dose (ID), was observed in spleen 24 h post systemic administration (P<0.0001 compared to uptake at 4 h); meanwhile lung and liver seem to take up about 10% each of the total ID. Thereafter, the concentration of the nanoparticles in the various organs were found to drop, and by 120 d there was negligible amount of nanoparticles in the lung, and <5% of the ID in liver and spleen. This is in good agreement with a previous study that reported slow clearance of the UCNs from the biological system; presumably through a hepatobiliary route.[23]
Representative images of UCL imaging and the corresponding fluorescence images (Green represents the plasma membrane and red represents nucleus) of cryosections of various organs harvested at (A) 5 min, (B) 4 h and (C) 24 h following systemic administration of 50 mg/kg anti-EGFR-PEG-TiO2-UCN. Magnification: 200X, Scale bar: 20 µm.
Biodistribution of UCNs measured by ICP-AES analysis, showing uptake of nanoparticles at 4 h, 24 h, 7 d, 28d and 120 d post-injection of 50 mg/kg anti-EGFR-PEG-TiO2-UCN expressed in terms of percentage of ID per gram of tissue. Data presented are mean (n= 2-3) ± SD.
NIR-PDT post intratumoral administration of UCNs
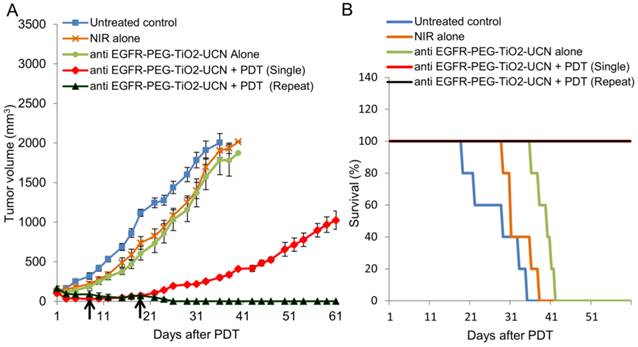
Although the developed anti-EGFR-PEG-TiO2-UCN was found to generate good amount of ROS and cell-kill in vitro, their behaviour in a complex biological milieu have to be tested. Thus before studying the therapeutic efficiency following a more challenging intravenous route, their ability in destroying or controlling the tumor growth following intratumoral administration was first determined. Results revealed that even after surface modification of the nanoparticles with anti-EGFR affibodies, the ROS production and tumor growth controlling ability of the nanoparticles following intratumoral administration and NIR irradiation, remains as efficient as the PEGylated TiO2-UCNs in our previously published work.[15] As expected, the tumor growth of mice in the control groups (untreated, anti-EGFR-PEG-TiO2-UCN alone and NIR light alone control) reached the maximum ethical size limit (Figure 11A) and had to be sacrificed between 19 and 42 d (Figure 11B). Animals with tumors that were treated with a single administration of anti-EGFR-PEG-TiO2-UCN followed by PDT with NIR light, demonstrated excellent tumor control up to 3 weeks. Thereafter, the tumors seemed to regrow slowly reaching an average size of about 1000 mm3 by 60 d. In an effort to achieve complete tumor control, both nanoparticle administration and light irradiation was repeated on 2 more occasions (Day 8 and 19), as and when the tumors started to show signs of regrowth. As seen in Figure S7A and B, there was complete tumor regression in mice of the repeat PDT group. This observation clearly suggests that the developed nanoparticles are efficient as NIR-excitable PDT agents and by optimizing the treatment regimen complete tumor control can be achieved.
(A) In vivo OSCC tumor growth up to 60 d on different groups of mice after various treatments indicated. Black arrows indicate the days when the PDT was repeated; n=3-5 per group. Error bars represent SD of the mean. (B) Survival rates of mice in different treatment groups within 60 d.
Tumor accumulation of nanoparticles following systemic administration
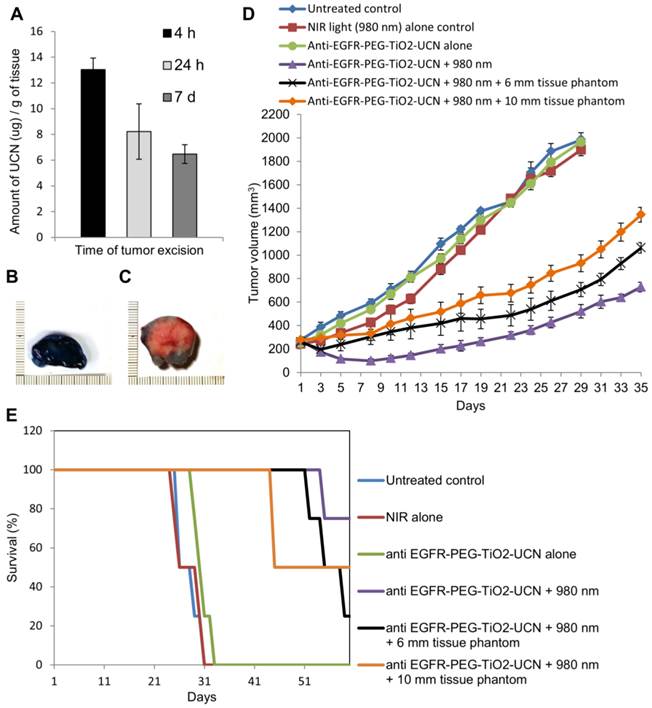
To determine the optimal drug-light interval (DLI), it is essential to find out the time at which maximum nanoparticles reach the tumor following their systemic administration. ICP-AES analysis of the whole tumor digest revealed that the maximum uptake of anti-EGFR-PEG-TiO2-UCN occurs 4 h after systemic administration (Figure 12A). At 24 h there seems to be considerable decrease in the amount of nanoparticles in the tumor tissue, and following that even at 7 d the amount of anti-EGFR-PEG-TiO2-UCN seems to remain the same as at 24 h. This suggests that at 4 h the nanoparticles might still have been circulating in the blood and hence were present in the blood vessels of the tumor; some amount of which might have extravasated into the tumor tissue. To further assess the suitability of the selected DLI, and the efficiency as well as depth of penetration following NIR light irradiation 4 h post systemic administration of 50 mg/kg anti-EGFR-PEG-TiO2-UCN, Evan's blue vital staining was done 48 h following NIR-PDT treatment. Compared to the NIR light alone (Figure 12B), the treatment group (50 mg/kg anti-EGFR-PEG-TiO2-UCN + NIR light) exhibited clear unstained necrotic areas with a depth reaching about 1.5 cm (Figure 12C).
(A) Comparison of UCN uptake at different time-points in tumor tissues by ICP-AES analysis, following systemic administration of 50 mg/kg anti-EGFR-PEG-TiO2-UCN. Data are mean (n=2-3) ± SD. Image of sections of tumor tissue excised from Evan's blue stained mouse treated with (B) NIR light alone and (C) NIR light irradiation 4 h post systemic administration of 50 mg/kg anti-EGFR-PEG-TiO2-UCN. (D) Tumor volumes charted against days to assess the tumor response in various treatment groups. Data are mean (n= 4-5 per group) ± SD. (E) Survival rates of mice in different treatment groups within 60 d.
NIR-PDT post systemic administration of UCNs
The effectiveness of PDT following systemic administration of 50 mg/kg anti-EGFR-PEG-TiO2-UCN and subsequent irradiation with NIR light was studied by measuring the tumor volume and charting the survival curve of the mice in the treatment as well as control groups. As expected the mice in the treatment group showed significant delay in tumor growth with a mean tumor volume reaching about 574.6 ± 19.9 mm3 at 35 d (Figure 12D and S8C) and demonstrated 80% survival at 60 d (Figure 12E). Whereas, the tumors of the mice in control groups (untreated, NIR light alone, and anti-EGFR-PEG-TiO2-UCN alone) reached the ethical size limit and all animals had to be sacrificed between 24 and 33 d (Figure S8A and B). In order to highlight the advantage of using NIR in PDT, tissue phantoms of various thickness (6 and 10 mm) was placed in the path of the light. It was found that the NIR light could penetrate up to 10 mm thick tissue phantom to excite the nanoparticles in the tumor tissue and achieve reasonable tumor growth control, with mean tumor size when irradiated in the presence of 6 and 10 mm tissue phantom being 661 ± 72.8 and 1164 ± 43.3 mm3 respectively (Figure 12D, S8D and E). In addition to this, the survival rate of the animals also improved significantly compared to the control groups, with 50% of the animals surviving up to 45 and 55 d when tumors were irradiated in the presence of 10 and 6 mm tissue phantom respectively (Figure 12E). This observation undoubtedly proves that the developed nanoparticles have the potential to delay growth of solid tumors with depth up to 10 mm.
Assessment of tumor growth and proliferation
H & E staining of the tumors excised at day 15 following NIR-PDT with anti-EGFR-PEG-TiO2-UCNs without tissue phantom and with 10 mm tissue phantom revealed large areas of necrosis compared to the tumors from untreated control animals (Figure S9A). To further analyse the status of tumor growth and cell proliferation, the presence of Ki-67, a nuclear antigen that is strictly associated with cell proliferation, was determined by immunohistochemistry. Ki-67 staining was significantly lower in the tumors from mice treated with anti-EGFR-PEG-TiO2-UCN + NIR without tissue phantom (3.1%) and with tissue phantom (11.3%) compared to control untreated group (39.3%) (Figure S9B and C).
Conventional Ce6-PDT using 665 nm light
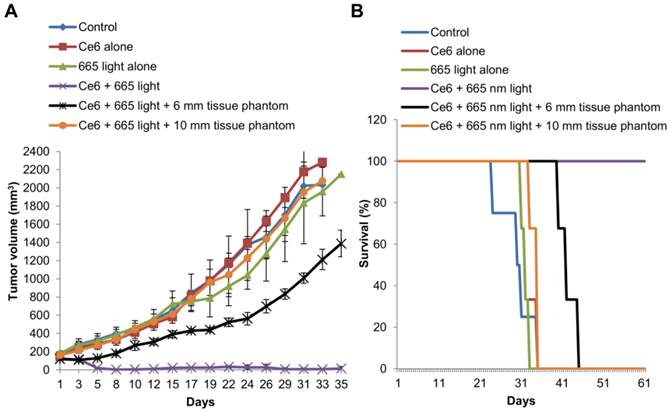
To further emphasize the effectiveness of the developed nanomaterial for NIR based PDT of solid and deep seated tumors, we compared it with conventional PDT using the PS Ce6. The results of tumor volume measurement following Ce6-PDT revealed complete tumor remission up to 35 d (Figure 13A) and 100% survival at 60 d (Figure 13B), compared to the mice in the control groups that were sacrificed between 24 and 35 d. Now, when a 6 mm tissue phantom was placed over the tumor, there was slight delay in the tumor growth with the average tumor size reaching 1388.3 ± 146 mm3 at 35 d. But in the presence of a 10 mm tissue phantom, Ce6-PDT at 665 nm had no effect on the tumor growth, which followed a similar trend as the mice in the control group reaching a mean size of 2078.1 ± 36 mm3 at 33 d. The results undoubtedly suggest that conventional PDT is far more effective in the treatment and control of small flat tumors that are a few mm thick. However, when the tumors are or greater than 10 mm in thickness, Ce6-PDT using 665 nm light fails as a therapeutic option, apparently due to the limited penetrating capability of 665 nm red light.
(A) In vivo OSCC tumor growth up to 35 d on different groups of mice after various treatments indicated.; n=3-4 per group. Error bars represent SD of the mean. (B) Survival rates of mice in different treatment groups within 60 d.
Conclusion
Advanced and recurrent oral cancer is often associated with poor prognosis. Hence, alternative targeted therapies to selectively destroy thick and solid lesions need to be developed. In view of this, anti-EGFR-PEG-TiO2-UCNs were developed for targeted delivery to the oral cancer cells so that they can then be excited by deep tissue penetrating NIR light to achieve cancer cell destruction at much deeper levels in the tissue. The developed nanoconstructs were found to specifically target EGFR expressing cells, leading to their enhanced uptake. In vitro PDT results indicate the ability of the anti-EGFR-PEG-TiO2-UCNs in bringing about significant selective destruction of EGFR expressing cells. Furthermore, anti-EGFR-PEG-TiO2-UCNs were found to be hemocompatible up to a dose of 50 mg/kg and exhibited 100% survival with no obvious toxic side effects in animals up to 120 d. A sub-acute toxicity study, on the other hand, suggests an induction of mild inflammatory response indicated by the significant increase in platelet counts and slight elevation of WBC and neutrophil counts in the plasma. Systemic delivery of nanoparticle is challenging as in most cases the amount of nanoparticles that ultimately reaches the tumor tissue is only a few percent of the total ID.[41] Although, the presence of the targeted agent is considered to play a critical role in the attachment of the nanoparticles to the cancer cell-surface receptors and further uptake into the cells by receptor mediated endocytosis, the enhanced permeability and retention (EPR) effect accounts for much of its accumulation in the tumor site. Here, when the developed nanoparticles were intratumorally delivered, they seemed to have a better therapeutic outcome compared to systemic delivery, with complete remission of the tumors following repetition of PDT. Nonetheless, NIR-PDT following systemic delivery also demonstrated considerable control of tumor growth up to 35 d, the longest study performed to the best of our knowledge, exhibiting reasonable therapeutic effect and improved survival rates even when the tumors were blocked with a 10 mm tissue phantom. On the other hand, though conventional Ce6-PDT using 665 nm red light demonstrated complete tumor remission with a single PDT application, it terribly failed to penetrate the 10 mm thick tissue phantom and display any therapeutic effect. Undeniably, the nanoparticle fabricated in this study has the potential to be developed as a NIR-PDT agent for the treatment of solid and deep-seated tumors. Further refinement of the surface characteristics could fine-tune the biodistribution of these nanomaterials, to enhance its accumulation in the tumor and also improve the therapeutic effect.
Experimental Methods
Cell-lines
All cell-lines were purchased from ATCC. OSCC (CAL-27), H596 (HTB-178) and H460 (HTB-177) were cultured in RPMI medium containing 10% FBS and 1% penicillin-streptomycin (Gibco, USA). A549 (CCL-185), MCF-7 (HTB-22), Hep-G2 (HB-8065), and NHF cells (IMR-90) were cultured in DMEM supplemented with 10% FBS and 1% penicillin-streptomycin. All cells were maintained at 37°C in a humidified atmosphere containing 5% CO2.
Conjugation of affibody to Maleimide-PEG-COOH
Anti-EGFR affibody (13.9 kDa) was purchased from Affibody AB (Sweden). Prior to the conjugation step, 1mg/ml lyophilized unconjugated anti-EGFR affibody in PBS was mixed with 20 mM DTT at pH 7.5 and incubated at RT for 4 h under constant stirring at 14000 rpm. The excess DTT was then removed by passing the mixture through Zeba Spin desalting columns, molecular weight cut-off (MWCO) 7K (Pierce, USA), using PBS (pH 7.2) with 5mM ethylenediamine tetraacetic acid (EDTA) as the exchange buffer. 1.2 mg of reduced anti-EGFR affibody was subsequently added to 48 mg maleimide-PEG-COOH (MW3000, Sigma, USA) in 15 ml of PBS with 5mM EDTA, and incubated at 4°C for 3 h under constant shaking at 285 rpm. The mixture was once again passed through Zeba Spin desalting columns (7K MWCO) to remove unconjugated PEG as well as exchange of the buffer to water. The anti-EGFR affibody conjugated PEG chains (anti-EGFR-PEG-COOH) were subsequently freeze dried, weighed and stored at -20°C until further use.
Grafting of anti-EGFR-PEG-COOH to TiO2-UCNs
Under constant stirring at RT, 10 μl of APS was added to 8 mg of anti-EGFR-PEG-COOH in 4 ml ethanol, along with 8 mg of N-(3-dimethylaminopropyl)-N'-ethylcarbodiimide hydrochloride (EDC) in 200 ul ethanol and 8 mg of N-hydroxysuccinimide (NHS) in 200 ul ethanol, and allowed to react overnight. TiO2-UCNs were prepared according to previously published protocol.[14, 15] 2 mg unmodified TiO2-UCNs well dispersed in 4 ml ethanol and 10 ul TEOS, was then added to the above mixture while stirring. After 30 min, 75 ul ammonia (28 wt%) was added drop wise to the reaction mixture and continued to stir for another 3 h at RT. At the end of the reaction, the affibody conjugated nanoparticles (anti-EFGR-PEG-TiO2-UCNs) were washed thrice with ethanol, air-dried and stored at 4°C until further use.
Characterization of anti-EGFR-PEG-TiO2-UCNs
Size, morphology and energy-dispersive X-ray spectroscopy (EDX) of the synthesized nanoparticles were characterized using a JEOL 2010F TEM (Jeol Ltd., Tokyo, Japan) operating at an acceleration voltage of 200 kV. Fluorescence spectra of 100 µg/ml anti-EFGR-PEG-TiO2-UCNs in PBS at various time-points under NIR excitation was recorded using spectrophotometer and dynamic light scattering (DLS) was conducted to measure the hydrodynamic diameter and zeta-potential using Zetasizer (Nano ZS, Malvern Instruments Ltd., UK). FT-IR spectra were recorded on a Shimadzu IRPrestige-21 model spectrometer (Shimadzu Corporation, Kyoto, Japan).
Comparison of ROS production ability before and after affibody conjugation
To measure the ROS generation ability, 1 mg of the TiO2-UCN or anti-EFGR-PEG-TiO2-UCN was suspended in 1 mL of PBS containing 10 µM of aminophenyl fluorescien (APF) dye. The mixture was then placed in a cuvette and the solution was irradiated with a 980 nm laser (EINST Technology Pte Ltd, Singapore) at 2.1 W/cm2 for 20 min time intervals beginning from time (t) = 0 to 60 min. The fluorescence emission of APF at 520 nm (upon excitation at 485 nm) was measured using a Tecan Safire 2 fluorescence plate reader (Männedorf, Switzerland).
Comparison of in vitro targeting and uptake of anti-EGFR-PEG-TiO2-UCNs
To compare the internalization efficiency of anti-EGFR affibody conjugated nanoparticles, OSCC cells were seeded in a 8 well chambered slide at a density of 25 x 103 cells per well and incubated at 37°C overnight and subsequently treated with TiO2-UCN or anti-EGFR-PEG-TiO2-UCN at a concentration of 1 mM (270 µg/ml) for 3h. The culture medium containing non-internalized nanoparticles were discarded, and the cells were washed three times with PBS. The cells were then fixed with ice-cold methanol for 10 min; plasma membrane and nuclei were stained with Wheat Germ Agglutinin, Alexa Fluor® 488 Conjugate and propidium iodide (PI) respectively, washed with PBS and coverslipped. The uptake of unmodified and modified TiO2-UCN was imaged using an upright Nikon 80i Fluorescence Microscope (Nikon, Tokyo, Japan) equipped with a 980 nm Laser Wide-field Fluorescence add-on (EINST Technology Pte Ltd, Singapore) using a 20X objective (200X magnification). The plasma membrane and nuclei of the cells were visualized under excitation with Hg arc lamp and a standard FITC and TRITC filter set respectively. The uptake was quantified by measuring the total fluorescence intensities of UCNs with Image J 1.49p software (National Institute of Health, USA). To evaluate the effect of low temperature on the energy dependent activities of the cells such as endocytosis, OSCC cells were pre-cooled at 4°C for 45 min prior to the addition of 1 mM anti-EGFR-PEG-TiO2-UCNs, which were further incubated for another 3 h. Lastly, for competition assay OSCC cells were pre-blocked with 20 µM human epithelial growth factor (EGF) ligand (R&D Systems, Inc., USA) 2 h prior to the addition of 1mM anti-EGFR-PEG-TiO2-UCNs, which was then incubated for another 3 h, before the cells were washed, fixed, stained and quantified as mentioned above.
In vitro dark toxicity assay
OSCC cells were seeded at a density of 8 X 10³ cells per well in a 96-well plate and incubated overnight at 37 °C, to allow it to adhere to the bottom of the plate. 1 mg/mL stock solution of TiO2-UCN and anti-EGFR-PEG-TiO2-UCNs was prepared in PBS and dispersed by sonication for 20 min before adding it in the respective culture medium to obtain concentration ranging from 10 μM (2.7 µg/ml) to 5 mM (1350 µg/ml). The cells were then treated with the different concentration of nanoparticles for 6 h at 37°C followed by washing it thrice in PBS to remove unbound and non-internalized nanoparticles. Fresh culture medium was then added into each well and the cells were returned to 5 % CO2 atmosphere at 37 °C for another 24 h round of incubation. The number of cells that remained viable was then assessed by CellTiter 96® AQueous One solution cell proliferation assay (Promega, Madison, WI, USA) as per manufacturer's instructions. Absorbance was measured at 490 nm using a microplate reader (Tecan Safire, Männedorf, Switzerland). Cell viability is expressed as a percentage of control cells without exposure to TiO2-UCN.
In vitro PDT assay
OSCC cells were seeded into 96-well cell culture plate at a cell density of 8 X 10³ cells per well. Following overnight incubation at 37°C, the cell were treated with various concentrations of unmodified TiO2-UCNs and anti-EGFR-PEG-TiO2-UCNs ranging from 100 µM (27 µg/ml) to 1 mM (270 µg/ml) for 6 h. The medium containing non-internalized nanoparticles were removed and the cells were washed thrice with PBS, and replaced with fresh culture medium. The cells were then irradiated using 980 nm NIR light at a power of 1.2 W for 5 min 20 s delivering a total fluence of 675 J/cm2. The cells were incubated for additional 24 h before percentage of cell viability relative to the control untreated cells was determined by MTS assay. In order to study the selective cell killing ability, 1mM anti-EGFR-PEG-TiO2-UCNs was incubated with cells that displayed different levels of EGFR expression for just an hour. The cells were then washed thrice with PBS, and irradiated with NIR light using the same light parameters as mentioned above and further incubated 24 h before proceeding to determine the viability.
Blood and tissue collection from animals
Female Balb/c nude mice, 6-8 weeks of age, weighing an average of 17 g were obtained from Animal Research Centre, Australia. All procedures were approved by the Institutional Animal Care and Use Committee (IACUC), SingHealth, Singapore. Before any terminal blood collection procedure, the animals were anaesthetized by intraperitoneal injection of 200 µl of an anaesthetic cocktail (Ketamine: diazepam: saline 6: 9: 10). For collection of blood plasma, fresh blood (≈600 µl) obtained via cardiac puncture was collected in a BD Microtainer PST™ tube (Becton-Dickinson Co.,USA). The tubes were subsequently centrifuged at 1300 g for 15 min at RT. The separated plasma was frozen at -80°C until analysis. For collection of mouse blood serum, fresh blood (≈1 ml) was collected in a 2 ml centrifuge tube, and allowed to clot for about 1 h at RT. The tubes were then centrifuged at 1500 g for 15 min. The separated serum was frozen at -80°C until analysis. For harvesting tissues, the anaesthetized animals were sacrificed before the tissues were excised, and either immediately snap frozen in liquid nitrogen or were fixed in 10% formalin solution.
Hemolysis assay
RBCs were separated from fresh blood (≈600 µl) obtained via cardiac puncture by centrifuging at 1500 rpm for 15 min at 4°C. The isolated RBCs were further washed three times with sterile PBS by centrifugation until the supernatant was clear, and resuspended in 2 ml PBS. Then 100 µl of the nanoparticle (both Mal-PEG-TiO2-UCN and anti-EGFR-PEG-TiO2-UCN) suspension in PBS at concentrations ranging from 0.0625 to 1 mg /ml were added to 100 µl of the RBCs suspension. Following 2 h incubation at 37°C under constant shaking, the suspensions were centrifuged at 1500 rpm for 15 min at RT. Subsequently, 100 µl of supernatant from each centrifuge tube was used to analyse hemoglobin release by microplate reader at the wavelength of 576 nm. Control experiments were performed under the same experimental conditions, where 100 µl of the RBCs suspension was added to 100 µl of PBS as a negative control and to 100 µl of 0.5% Triton X-100 as a positive control. The percentage hemolysis was calculated using the following equation:
Hemolysis(%) = (OD576 sample - OD576 negative control)/(OD576 positive control - OD576 negative control) ×100%
Platelet aggregation assay
Anti-EGFR-PEG-TiO2-UCNs in sterile saline, at various concentrations ranging from 10 to 100 mg/kg were thoroughly sonicated for 20 min, before intravenous administration (injection volume = 100 μl) through tail vein. Plasma was then collected at various time-points (10, 30 and 60 min) from the animals and expression of mouse PF4 in the collected mouse serum was quantified using an ELISA assay kit (PF4 (CXCL4) Mouse ELISA Kit, Abcam, USA) according to manufacturer's instruction.
Thrombin/Prothrombin determination
Mouse blood plasma collected at 10, 30 and 60 min post systemic administration of different concentration of anti-EGFR-PEG-TiO2-UCN ranging from 10 to 100 mg/kg, was quantified for the presence of total prothrombin and thrombin using an ELISA kit (Prothrombin/Thrombin Mouse ELISA kit, Abcam, USA) as per manufacturer's protocol.
Complement activation assay
Determination of mouse complement protein C3 in blood sera collected at 10, 30 and 60 min post systemic administration of different concentration of anti-EGFR-PEG-TiO2-UCN ranging from 10 to 100 mg/kg, was done using an ELISA kit (Complement C3 Mouse ELISA Kit, Abcam, USA) according to manufacturer's instruction.
Long term toxicity study
Histopathology: At 120 d post systemic administration of different doses of anti-EGFR-PEG-TiO2-UCNs, the animals were sacrificed. Major organs were harvested and immediately fixed in 10% formalin, and processed using a tissue processor (Leica TP 1020, Germany). Briefly, the tissue samples were treated in an ascending series of ethanol and subsequently cleared with xylene and embedded in paraffin. The paraffin embedded tissue samples were cut at a thickness of 5 μm using a microtome (Leica RM 2135, Germany). The sections were mounted on Superfrost™ Plus slides (Fischer Scientific, USA), air-dried and subsequently stained with H&E. Imaging of the tissue section was done using a Nikon 80i digital microscope (Nikon, Tokyo, Japan) using a 20X objective (200X magnification).
Single dose sub-acute toxicity study
Cytokine release profiling: Mouse blood plasma was collected at 10, 30 and 60 min post systemic administration of anti-EGFR-PEG-TiO2-UCN at a dose of 50 mg/kg. Cytokines were quantified using a 64 target antibody array (Cytokine Mouse Membrane Antibody Array, Abcam, USA) strictly following the manufacturer's protocol. Briefly, the protein array membranes were blocked with blocking buffer, after which the sample (blood plasma) was added to the membrane and incubated overnight at 4°C. After extensive washing with the wash buffers provided in the kit, the membranes were incubated with biotin-conjugated anti-cytokines. Following another round of washing, HRP conjugated streptavidin was added to the membranes and incubated for 2 h. After adding the detection buffer the membranes were exposed to X-ray film (Hyperfilm ECL, Amersham Biosciences, UK) and signal was detected using a film developer (Kodak M35, OMAT Processor, USA). The intensities of the signals were quantified by Image J 1.49p software (National institute of Health, USA). Normalized signal intensity of a spot in Array A “X(A)” was calculated by the formula:
X(NA) = X(A) * P1/P(A); where,
X(A) is the mean signal density of a spot in array A
P1 is the mean signal density of positive control spots on reference array
P(A) is the mean signal density of positive control spots on array A
By comparing the intensity of signals with the control (plasma collected from untreated animals), the relative expression levels of the angiogenic proteins were analyzed.
Determination of organ weight variations: At different time-points (4 h to 28 d) post systemic administration of 50 mg/kg anti-EGFR-PEG-TiO2-UCN, the animals were weighed, sacrificed and the major organs (heart, lung, liver, spleen and kidneys) were harvested and immediately weighed. The coefficients of these organs to body weight were calculated as the ratio of tissue weight (wet weight of whole organ) to body weight. The variation in the weight of the organs were compared with that excised from age matched untreated control animals.
Hematology and blood biochemistry: For complete blood count, fresh mouse blood (≈500 µl) was collected into a BD Microtainer Tube K2 EDTA at different time-points ranging from 4 h to 28 d following intravenous injection of 50 mg/kg anti-EGFR-PEG-TiO2-UCN. Analysis of hematological parameters, total RBCs, WBCs, differential leucocyte counts and hemoglobin were done by Quest Laboratories, Singapore. Similarly for blood biochemical analysis, 200 ul of plasma was prepared as mentioned above and plasma levels of urea, creatinine alkaline ALP and ALT were determined by Quest Laboratories, Singapore.
Histopathology: Following intravenous administration of 50 mg/kg anti-EGFR-PEG-TiO2-UCN, animals were sacrificed at different time-points (ranging from 4 h to 28 d) and the organs (heart, lung, liver, spleen, kidneys and small intestine) were harvested, fixed in 10% formalin and processed in a tissue processor as mentioned above. The tissues were sectioned, H & E stained, and analysed for histopathological variations.
Biodistribution
Imaging: Organs harvested following intravenous delivery of 50 mg/kg anti-EGFR-PEG-TiO2-UCN, at different time-points (ranging from 5 min to 24 h), were snap frozen in liquid nitrogen, cryosectioned (7 µm) and fixed in 4% paraformaldehyde. The sections were washed 3 X 5 min in PBS, stained with 5 µg/ml Wheat Germ Agglutinin, Alexa Fluor® 488 Conjugate for 2 h, followed by 500 nM PI for 30 min. The sections were again washed 3 X 5 min, coverslipped and imaged using a Nikon 80i Fluorescence Microscope (Nikon, Tokyo, Japan) equipped with a 980 nm laser as mentioned elsewhere.
ICP-AES: The tissue samples were incubated in 60% nitric acid, and digestion was allowed to take place at 60 °C overnight. The samples were then diluted with distilled water to a 5% acid solution, filtered through a 0.22-μm filter and then analyzed for titanium content by ICP-AES analysis.
Xenograft oral cancer tumor model
5 × 10⁶ OSCC cells suspended in 100 μl of HBSS was injected subcutaneously into the flanks of 6-8 week female Balb/c nude mice (weighing an average of 17 g).
In vivo PDT using NIR light post intratumoral administration of UCNs
For intratumoral administration, animals were assigned to 5 different groups: (i) Control (mice with untreated tumors), (ii) NIR-light alone control (1000 J/cm2) (iii) anti-EGFR-PEG-TiO2-UCN alone (0.1 mg/tumor) (iv) anti-EGFR-PEG-TiO2-UCN (0.1 mg/tumor) + PDT (1000 J/cm2) - single dose, and (v) anti-EGFR-PEG-TiO2-UCN (0.1 mg/tumor) + PDT (1000 J/cm2) - repeated dose , and each group comprised of 3-5 animals each. The animals were anesthetized with intraperitoneal injection of an anaesthetic cocktail (Ketamine: diazepam: saline 6: 9: 10) during any procedure involving light irradiation. For group (ii), tumors were irradiated with 980 nm NIR light at a power of 500 mW for 33 min 20 s. For group (iii) tumors were intratumorally injected with 40 μl of anti-EGFR-PEG-TiO2-UCN in sterile saline. For group (iv and v) 4 h post intratumoral administration of 40 μl of anti-EGFR-PEG-TiO2-UCN, the tumors were irradiated with NIR light on Day 1. Animals in group (v) were again injected with anti-EGFR-PEG-TiO2-UCN and irradiated with NIR light on Day 8 and Day 19. For all groups, tumor volume was measured on at least 3 alternate days a week, for up to 60 d. The tumor volume was calculated using the following formula: Volume = (π/6 × d1 × d2 × d3), where d1, d2 and d3 are tumor dimensions in 3 orthogonal directions.
Uptake of anti-EGFR-PEG-TiO2-UCN in tumor tissue
Following intravenous administration of 50 mg/kg anti-EGFR-PEG-TiO2-UCN, the animals were sacrificed at different time-points (ranging from 4 h to 7 d), and the tumor tissues were harvested. The tissue samples were then digested with 60% nitric acid at 60 °C, overnight. The samples were then diluted with distilled water to form a 5% acid solution, filtered through a 0.22-μm filter and then analyzed for titanium content by ICP-AES analysis.
In vivo PDT using NIR light post systemic administration of UCNs
Animals were randomly assigned into 6 different groups: (i) Control (mice with untreated tumors), (ii) NIR-light alone control (1000 J/cm2) (iii) anti-EGFR-PEG-TiO2-UCN alone (0.1 mg/tumor) (iv) anti-EGFR-PEG-TiO2-UCN (0.1 mg/tumor) + PDT (1000 J/cm2) , (v) anti-EGFR-PEG-TiO2-UCN + PDT (1000 J/cm2) + 6 mm tissue phantom and (vi) anti-EGFR-PEG-TiO2-UCN + PDT (1000 J/cm2) + 10 mm tissue phantom, and each group comprised of 3-5 animal each. Again for group (ii), tumors were irradiated with 980 nm NIR light at a power of 500 mW for 33 min 20 s. For groups (iii) to (vi), animals were injected with 50 mg/kg anti-EGFR-PEG-TiO2-UCN (volume of injection: 100 µl). For group (iv - vi) 4 h post systemic administration of anti-EGFR-PEG-TiO2-UCN, the tumors were irradiated with NIR light. To demonstrate the tissue penetration abilities, tumors of animals in group (v) and (vi) were blocked either by a 6 mm or 10 mm thick tissue phantom respectively, during NIR light irradiation. Briefly, the tissue phantoms were prepared using 0.5% (w/v) ultrapure agarose (Invitrogen, USA), 1% (v/v) of intralipid-10% (KabiVitrum Inc., USA) as the scatterer and 0.1% (v/v) Nigrosin, as the absorber.
In vivo Ce6-PDT using red light
For conventional PDT study, animals were randomly assigned to 6 groups: (i) Control (mice with untreated tumors), (ii) 665 nm light alone, (iii) Ce6 alone, (iv) Ce6 + PDT, (v) Ce6 + PDT + 6 mm tissue phantom and (vi) Ce6 + PDT + 10 mm tissue phantom. For group (ii) the tumors were irradiated with a laser light source emitting a wavelength of 665 nm (LVI Technology Inc, South Korea). A light dosage of 150 J/cm2 and fluence rate of 100 mW/cm2 was used. For group (iii) the animals were intravenously injected with 20 mg/kg Ce6 (Frontier Scientific, USA) and did not receive any light irradiation. For group (iii) to (vi), 3 h post systemic administration of 20 mg/kg Ce6, the tumors were irradiated with a 665 nm laser light source (LVI Technology Inc, South Korea). For group (v and vi) the tumors were blocked either by a 6 mm or 10 mm thick tissue phantom respectively and then irradiated with 665 nm laser light.
Evan's blue staining
For Evan's blue staining, 400 μl of 1% Evan's blue dye in saline was injected intraperitoneally into the animals 48 h post treatment and 6 h later the animals were sacrificed to excise the tumors. 2 - 3 mm thick cross-sectional slices of tumors were cut and imaged under a stereoscopic microscope (Stemi 2000C, Zeiss, Germany).
Statistical analysis
Statistical analysis was performed using GraphPad Prism version 4.0 (GraphPad Software, Inc., San Diego, CA, USA). One-way ANOVA was used to analyze the variance and Bonferroni's multiple comparison tests was used to compare the significance between all the groups for the various experiments. A P value of <0.05 was considered to be significant.
Supplementary Materials
Experimental methods and results including characterization of nanoparticles, detection of EGFR expression in cells and tumors, in vitro targeting and uptake studies, animal weight measurements, food and water intake measurements, immunohistochemistry as well as photographs of mice before and after different treatment.
Acknowledgements
The authors would like to thank Dr. Ralph M. Bunte (Duke-NUS, Singapore) for his kind help in analyzing and interpreting H&E slides; and also acknowledge the funding support from National Medical Research Council (NMRC) CBRG grant (CBRG13nov052). Lucky S. S. is a recipient of NGS scholarship from NUS graduate school (NGS) for Integrative Sciences and Engineering, National University of Singapore.
Competing Interests
The authors have declared that no competing interest exists.
References
1. Ribeiro FA, Noguti J, Oshima CT, Ribeiro DA. Effective targeting of the epidermal growth factor receptor (EGFR) for treating oral cancer: a promising approach. Anticancer Res. 2014;34:1547-52
2. Greenberg JS, El Naggar AK, Mo V, Roberts D, Myers JN. Disparity in pathologic and clinical lymph node staging in oral tongue carcinoma. Cancer. 2003;98:508-15
3. Carvalho Al, Kowalski LP, Agra IMG, Pontes E, Campos OD, Pellizzon ACA. Treatment results on advanced neck metastasis (N3) from head and neck squamous carcinoma. Otolaryngol Head Neck Surg. 2005;132:862-8
4. Agra IM, Filho JG, Martins EP, Kowalski LP. Second salvage surgery for re-recurrent oral cavity and oropharynx carcinoma. Head Neck. 2010;32:997-1002
5. Garzino-Demo P, Dell'Acqua A, Dalmasso P, Fasolis M, La Terra Maggiore GM, Ramieri G. et al. Clinicopathological parameters and outcome of 245 patients operated for oral squamous cell carcinoma. J Craniofac Surg. 2006;34:344-50
6. O'Brien CJ, Lauer CS, Fredricks S, Clifford AR, McNeil EB, Bagia JS. et al. Tumor thickness influences prognosis of T1 and T2 oral cavity cancer—but what thickness? Head Neck. 2003;25:937-45
7. Agostinis P, Berg K, Cengel KA, Foster TH, Girotti AW, Gollnick SO. et al. Photodynamic therapy of cancer: An update. CA Cancer J Clin. 2011;61:250-81
8. Lucky SS, Soo KC, Zhang Y. Nanoparticles in photodynamic therapy. Chem Rev. 2015;115:1990-2042
9. Idris NM, Jayakumar MKG, Bansal A, Zhang Y. Upconversion nanoparticles as versatile light nanotransducers for photoactivation applications. Chem Soc Rev. 2015;44:1449-78
10. Xu QC, Zhang Y, Tan MJ, Liu Y, Yuan S, Choong C. et al. Anti-cAngptl4 Ab-conjugated N-TiO(2) /NaYF(4):Yb,Tm nanocomposite for near infrared-triggered drug release and enhanced targeted cancer cell ablation. Adv Healthc Mater. 2012;1:470-4
11. Hou Z, Zhang Y, Deng K, Chen Y, Li X, Deng X. et al. UV-emitting upconversion-based TiO2 photosensitizing nanoplatform: Near-infrared light mediated in vivo photodynamic therapy via mitochondria-involved apoptosis pathway. ACS Nano. 2015;9:2584-99
12. Zhang L, Zeng L, Pan Y, Luo S, Ren W, Gong A. et al. Inorganic photosensitizer coupled Gd-based upconversion luminescent nanocomposites for in vivo magnetic resonance imaging and near-infrared-responsive photodynamic therapy in cancers. Biomaterials. 2015;44:82-90
13. Zeng L, Pan Y, Tian Y, Wang X, Ren W, Wang S. et al. Doxorubicin-loaded NaYF4:Yb/Tm-TiO2 inorganic photosensitizers for NIR-triggered photodynamic therapy and enhanced chemotherapy in drug-resistant breast cancers. Biomaterials. 2015;57:93-106
14. Idris NM, Lucky SS, Li Z, Huang K, Zhang Y. Photoactivation of core-shell titania coated upconversion nanoparticles and their effect on cell death. J Mater Chem B. 2014;2:7017-26
15. Lucky SS, Muhammad Idris N, Li Z, Huang K, Soo KC, Zhang Y. Titania coated upconversion nanoparticles for near-infrared light triggered photodynamic therapy. ACS Nano. 2015;9:191-205
16. Rabinowits G, Haddad RI. Overcoming resistance to EGFR inhibitor in head and neck cancer: a review of the literature. Oral Oncol. 2012;48:1085-9
17. Laimer K, Spizzo G, Gastl G, Obrist P, Brunhuber T, Fong D. et al. High EGFR expression predicts poor prognosis in patients with squamous cell carcinoma of the oral cavity and oropharynx: a TMA-based immunohistochemical analysis. Oral Oncol. 2007;43:193-8
18. Shaib W, Kono S, Saba N. Antiepidermal growth factor receptor therapy in squamous cell carcinoma of the head and neck. J Oncol. 2012;2012:1-11
19. Gao J, Chen K, Miao Z, Ren G, Chen X, Gambhir SS. et al. Affibody-based nanoprobes for HER2-expressing cell and tumor imaging. Biomaterials. 2011;32:2141-8
20. Ding L, Tian C, Feng S, Fida G, Zhang C, Ma Y. et al. Small sized EGFR1 and HER2 specific bifunctional antibody for targeted cancer therapy. Theranostics. 2015;5:378-98
21. Chatterjee DK, Rufaihah AJ, Zhang Y. Upconversion fluorescence imaging of cells and small animals using lanthanide doped nanocrystals. Biomaterials. 2008;29:937-43
22. Cheng L, Yang K, Shao M, Lu X, Liu Z. In vivo pharmacokinetics, long-term biodistribution and toxicology study of functionalized upconversion nanoparticles in mice. Nanomedicine. 2011;6:1327-40
23. Xiong L, Yang T, Yang Y, Xu C, Li F. Long-term in vivo biodistribution imaging and toxicity of polyacrylic acid-coated upconversion nanophosphors. Biomaterials. 2010;31:7078-85
24. Ilinskaya AN, Dobrovolskaia MA. Nanoparticles and the blood coagulation system. Part II: safety concerns. Nanomedicine. 2013;8:969-81
25. Ilinskaya AN, Dobrovolskaia MA. Nanoparticles and the blood coagulation system. Part I: benefits of nanotechnology. Nanomedicine. 2013;8:773-84
26. Choi J, Reipa V, Hitchins VM, Goering PL, Malinauskas RA. Physicochemical characterization and in vitro hemolysis evaluation of silver nanoparticles. Toxicol Sci. 2011;123:133-43
27. ASTM E2524-08 (2013). Standard test method for analysis of hemolytic properties of nanoparticles. Pennsylvania, USA: ASTM International. 2013
28. Cui S, Yin D, Chen Y, Di Y, Chen H, Ma Y. et al. In vivo targeted deep-tissue photodynamic therapy based on near-infrared light triggered upconversion nanoconstruct. ACS Nano. 2013;7:676-88
29. Sitharaman B. Nanobiomaterials Handbook. Florida, USA: CRC Press. 2011
30. Nath N, Lowery C, Niewiarowski S. Antigenic and antiheparin properties of human platelet factor 4 (PF4). Blood. 1975;45:537-50
31. Ricklin D, Hajishengallis G, Yang K, Lambris JD. Complement: a key system for immune surveillance and homeostasis. Nat Immunol. 2010;11:785-97
32. Sacher RA, McPherrson RA, Campos JM. Widmann's clinical interpretation of laboratory tests. 3 ed. Philadelphia: Davis. 1991
33. Khoo ZY, Teh CC, Rao NK, Chin JH. Evaluation of the toxic effect of star fruit on serum biochemical parameters in rats. Pharmacogn Mag. 2010;6:120-4
34. Younes N, Amara S, Mrad I, Ben-Slama I, Jeljeli M, Omri K. et al. Subacute toxicity of titanium dioxide (TiO2) nanoparticles in male rats: emotional behavior and pathophysiological examination. Environ Sci Pollut Res. 2015;22:8728-37
35. Fox JG. The mouse in biomedical research: Normative biology, husbandry, and models. Boston, USA: Academic Press. 2007
36. Elsabahy M, Wooley KL. Cytokines as biomarkers of nanoparticle immunotoxicity. Chem Soc Rev. 2013;42:5552-76
37. Allen TM. Ligand-targeted therapeutics in anticancer therapy. Nat Rev Cancer. 2002;2:750-63
38. Bertrand N, Wu J, Xu X, Kamaly N, Farokhzad OC. Cancer nanotechnology: The impact of passive and active targeting in the era of modern cancer biology. Adv Drug Deliv Rev. 2014;66:2-25
39. Dawidczyk CM, Kim C, Park JH, Russell LM, Lee KH, Pomper MG. et al. State-of-the-art in design rules for drug delivery platforms: Lessons learned from FDA-approved nanomedicines. J Control Release. 2014;187:133-44
40. Toporkiewicz M, Meissner J, Matusewicz L, Czogalla A, Sikorski AF. Toward a magic or imaginary bullet? Ligands for drug targeting to cancer cells: principles, hopes, and challenges. Int J Nanomedicine. 2015;10:1399-414
41. Bae YH, Park K. Targeted drug delivery to tumors: Myths, reality and possibility. J Control Release. 2011;153:198-205
Author contact
![]() Corresponding author: biezyedu.sg.
Corresponding author: biezyedu.sg.