Impact Factor
- Issue 14; 2026
- Issue 13; 2026
- Issue 12; 2026
- Issue 11; 2026
- Issue 10; 2026
- Volume 16; 2026
- Advance Articles
- Past Issues
- Cover Images
- Cover Suggestion
- Index & Coverage
- Special Issues
Introduction
Materials and Methods
Results
Discussion
Abbreviations
Supplementary Material
Acknowledgements
References
International Journal of Biological Sciences
International Journal of Medical Sciences
 Global reach, higher impact

Theranostics 2016; 6(9):1453-1466. doi:10.7150/thno.14145 This issue Cite
Research Paper
In Vivo Visualization of Tumor Antigen-containing Microparticles Generated in Fluorescent-protein-elicited Immunity
Fei Yang1,2*, Shun Liu1,2*, Xiuli Liu1,2*, Lei Liu1,2*, Meijie Luo1,2, Shuhong Qi1,2, Guoqiang Xu1,2, Sha Qiao1,2, Xiaohua Lv1,2, Xiangning Li1,2, Ling Fu1,2, Qingming Luo1,2 ![]() , Zhihong Zhang1,2
, Zhihong Zhang1,2 ![]()
1. Britton Chance Center for Biomedical Photonics, Wuhan National Laboratory for Optoelectronics-Huazhong University of Science and Technology, Wuhan 430074, China;
2. MoE Key Laboratory for Biomedical Photonics, Department of Biomedical Engineering, Huazhong University of Science and Technology, Wuhan 430074, China.
*These authors contributed equally to this work.
Received 2015-10-17; Accepted 2016-5-5; Published 2016-6-16
Abstract

In vivo optical spatio-temporal imaging of the tumor microenvironment is useful to explain how tumor immunotherapies work. However, the lack of fluorescent antigens with strong immunogenicity makes it difficult to study the dynamics of how tumors are eliminated by any given immune response. Here, we develop an effective fluorescent model antigen based on the tetrameric far-red fluorescent protein KatushkaS158A (tfRFP), which elicits both humoral and cellular immunity. We use this fluorescent antigen to visualize the dynamic behavior of immunocytes as they attack and selectively eliminate tfRFP-expressing tumors in vivo; swarms of immunocytes rush toward tumors with high motility, clusters of immunocytes form quickly, and numerous antigen-antibody complexes in the form of tfRFP+ microparticles are generated in the tumor areas and ingested by macrophages in the tumor microenvironment. Therefore, tfRFP, as both a model antigen and fluorescent reporter, is a useful tool to visualize specific immune responses in vivo.
Keywords: intravital imaging, fluorescent protein, immune response, microparticle, tumor immunology.
Introduction
Intravital microscopy approaches with optical imaging systems (e.g., multiphoton/confocal microscopy) have been used to assess cellular motility and interaction dynamics in the immune system since 2002 (1-3). This approach represents a powerful tool to address how, when, and where immune cells are involved in immune responses (4, 5) including tumor immunity, and this spatio-temporal dynamic information can be used to confirm the function of immunocytes and reveal the mechanisms of anti-tumor immune responses in vivo (1, 6, 7). In addition to the optical imaging system, the fluorescent-labeling method used to track cells in vivo is a key component of the intravital microscopy approach (5). Transgenic mice expressing fluorescent proteins (FPs) in specific subpopulations of immunocytes and tumor cells expressing FPs have greatly contributed to the visualization of tumor immunity and have become effective fluorescent-labeled animal/cell models. However, the immunogenicity of FPs is a noteworthy characteristic that cannot be ignored.
The mechanisms of cancer progression and immunotherapy are complicated: a large variety of immune cells and cytokines are dynamically involved and mutually affected during cancer suppression or promotion (8, 9). To investigate the mechanisms of tumor immunity, researchers generally establish a simplified animal model consisting of a specific model antigen, a murine strain with an intact immune system (e.g., C57BL/6, or BALB/C), and corresponding tumor cell lines. Ovalbumin (OVA) from chicken eggs is the most commonly used antigen and has been widely used in research on tumor immunity (10). To observe OVA-elicited immune responses with intravital microscopy approaches, either OVA is labeled with fluorescent dyes or the tumor cells are genetically labeled with both OVA and FPs (10-14). In these cases, a fluorescent protein must be simultaneously expressed in tumor cells and may interfere with the studied immune response elicited by the model antigen, OVA. Therefore, it is of great value to develop a visualizable model antigen system based on the FP alone to visualize the specific anti-tumor immune response.
Enhanced green fluorescent protein (EGFP), which is derived from Aequorea victoria and has a molecular weight of 28 kDa, triggers a distinct immune response in BALB/c mice (15). However, EGFP is minimally immunogenic in C57BL/6 mice (16-18), one of the most popular strains used in immunological research. KatushkaS158A, a tetrameric far-red FP denoted as tfRFP, is extremely suitable for optical imaging in vivo due to its excellent physico-chemical characteristics, such as its brightness, photostability, and far-red emission spectrum (> 620 nm) (19, 20). In our previous research, we developed an octavalent peptide nanoprobe based on tfRFP that showed enhanced tumor targeting and intracellular uptake in vivo (21). Because tfRFP is an excellent FP probe for optical imaging in vivo (20, 21), we sought to evaluate whether it elicits a strong immune response in C57BL/6 mice and whether its immunogenicity is equivalent to that of EGFP.
Here, we hypothesized that the tetramer FP KatushkaS158A, derived from Entacmaea quadricolor with a molecular weight of 112 kDa, could serve as an ideal fluorescent model antigen in C57BL/6 mice. To address this possibility, we developed a visualizable model antigen system containing the tfRFP antigen, tfRFP-expressing tumor cells, and GFP transgenic C57BL/6 mice. Intravital optical imaging dynamically visualized the specific immune response against tumor cells in the tumor microenvironment, in which a large number of neutrophil clusters were formed on Day 2, and mass of tfRFP+ microparticles was generated on Day 7.
Materials and Methods
Mice and Cell Lines
C57BL/6 (6 - 10 weeks old) mice were purchased from Hunan Slack King of Laboratory Animal Co., Ltd (Changshang, China). C57BL/6-Tg(CAG-EGFP)1Osb/J mice, in which EGFP is expressed in the whole body except erythrocytes and hair, was a gift from Professor Zhiying He (Second Military Medical University, Shanghai, China). All mice were fed under the specific pathogen free (SPF) conditions in the animal facility of WNLO-HUST. B16 cells were purchased from Wuhan Boster Biology Technology, Ltd. (Wuhan, China). tfRFP-expressing B16 cells were obtained by transfecting B16 cells with a plasmid containing the KatushkaS158A gene. All of the immortalized cell lines mentioned above were cultured in RPMI 1640 supplemented with 10% FBS (Thermo Scientific, Waltham, Massachusetts, USA) and penicillin-streptomycin (Life Technologies, Carlsbad, California, USA) and were kept in a constant temperature incubator (Thermo Scientific, Waltham, Massachusetts, USA) with 5% CO2 in air atmosphere.
All animal studies were performed in compliance with protocols approved by the Hubei Provincial Animal Care and Use Committee and under the experimental guidelines of the Animal Experimentation Ethics Committee of Huazhong University of Science and Technology.
Protein Purification
KatushkaS158A (tfRFP) is a mutant protein generated from Katushka. The pRSET-KatushkaS158A plasmids were transformed into E. coli C43 (DE3), which was derived from BL21. Isopropyl β-D-1-thiogalactopyranoside (IPTG) was added at a final concentration of 0.5 mM to induce protein expression for another 12 h at 26°C when the OD600 of the medium reached 0.4 - 0.6. The bacteria were frozen at -80°C for 30 min and thawed at 37°C. Then, the bacteria were suspended in binding buffer (sodium phosphate buffer containing 20 mM imidazole) and sonicated at 500 mW for 10 min with a 3-sec pause interval every 6-sec cycle. The lysates were then centrifuged, and the pellets were discarded. The supernatants were then filtered through 0.45-µm filters before being subjected to a Ni-NTA His-affinity resin (Thermo Scientific, Waltham, Massachusetts, USA). Target proteins were bound to the resin and eluted with elution buffer containing 500 mM imidazole. The purity and size of the KatushkaS158A protein were determined using SDS-PAGE. The eluted protein was dialyzed twice in PBS, 4 h each time, to remove the high concentration of imidazole. The concentration of the purified protein was measured using a Modified Lowry Assay kit (Thermo Scientific, Waltham, Massachusetts, USA), and the protein was sterilized with a sterile 0.22-µm filter. A similar protocol was used for mCerulean purification.
Mouse Immunization and Tumor Challenge Experiments In Vivo
Purified tfRFP or mCerulean (100 µg for each mouse) emulsified in Incomplete Freund's adjuvant (IFA) (Sigma-Aldrich, St. Louis, Missouri, USA) was injected twice into the mouse tail base with a one-week interval between injections. An equal volume of PBS was injected into the control group as the non-immunized mice. One million tumor cells were subcutaneously inoculated into the hind flank of C57BL/6 mice 7 days after the second immunization. The tumor volumes were measured with a caliper every other day and calculated as (length × width2)/2.
tfRFP-specific Antibody Titer
Mice were grouped and immunized twice using tfRFP (100 µg) or OVA (100 µg) as indicated above. Serum was collected from each of the mice in the tfRFP-immunized, OVA-immunized, and non-immunized groups 5, 7, 10, 14, and 17 days after the first immunization. The detection of specific antibody was performed using a semi-quantitative enzyme-linked immune sorbent assay (ELISA), as mentioned elsewhere. Briefly, the purified recombinant tfRFP or commercialized purified OVA was diluted at 5 µg/mL with 0.05 M carbonate solution (pH 9.6), and 100 µL was added into each well of a 96-well ELISA plate (Corning Incorporated, New York, USA) and incubated at 4°C overnight. The wells were then washed with PBS-T (PBS containing 0.05% Tween 20) three times and blocked with PBS-TB (PBS containing 0.05% Tween 20 and 1% BSA) for 2 h at 37°C. The mouse serum samples were diluted with PBS-TB by indicated dilutions, added to the wells, and then incubated for 2 h at 37°C. After the wells were washed with PBS-T three times, diluted HRP-labeled goat anti-mouse antibody (Beyotime, Nantong, Jiangsu, China) was added into each well and incubated for 2 h at 37°C. Then, the wells were washed with PBS-TB 5 times, and 200 μL TMB solution [3,3′,5,5′-Tetramethylbenzidine liquid substrate system for ELISA, Beyotime, Nantong, Jiangsu, China] was added. After incubation at room temperature for approximately 7 min, the absorption at 450 nm and the reference wavelength of 620 nm was read on a spectrophotometer (TECAN, Männedorf, Switzerland). The ratio of the extinction value of the tfRFP-immunized or OVA-immunized mouse serum to that of the non-immunized mouse serum is defined as the positive/negative value (P/N value). P/N ≥ 2.1 was positive; 1.5 ≤ P/N < 2.1 was suspicious, and P/N < 1.5 was negative. Antibody titer is defined as the largest dilution at which the P/N ≥ 2.1.
Cytokine Detection
Splenocytes obtained from the immunized mice and non-immunized mice 7 days after the 2nd immunization were seeded in 24-well plates at a density of 2 × 10⁶ cells/well in the presence of 50 μg/mL tfRFP for 3 days. The supernatant of the cell culture medium was collected and measured with an ELISA kit (Dakewe, Beijing, China) according to the manufacturer's instructions.
Flow Cytometric Analysis of Intracellular IFN-γ
Mice were immunized as mentioned above. PBS-treated mice were used as the control. Spleens were excised from the mice 14 days after the first immunization. Splenocytes were separated and counted on a Guava easyCyte 8HT (Merck Millipore, Billerica, Massachusetts, USA) with Viacount reagent (Merck Millipore, Billerica, Massachusetts, USA). The densities of the splenocytes were adjusted to 2.0 × 10⁶ cells/ml in complete RPMI 1640 containing 10% FBS. Splenocytes from each mouse were added to 2 wells of a 24-well plate (4.0 × 10⁶ cells per well). For the tfRFP-stimulated groups, 50 μg/ml tfRFP was added to the medium. An equal volume of PBS was added to the control groups. The splenocytes were cultured at 37ºC for 3 days. IFN-γ secretion was inhibited by monensin (Biolegend, San Dieg, California, USA) for the last 4 h of the culture. Finally, collected cells were fixed and stained with anti-mouse CD3 APC/Cy7 (Biolegend, San Dieg, California, USA), anti-mouse CD4 APC (Biolegend, San Dieg, California, USA), anti-mouse CD8 PE/Cy7 (Biolegend, San Dieg, California, USA), and anti-mouse IFN-γ PE (eBioscience, San Diego, California, USA) for flow cytometric analysis. A rat anti-mouse IgG1 kappa PE antibody (eBioscience, San Diego, California, USA) was used as an isotype control.
DTH Reaction Assay
Mice were immunized as described previously (22). Briefly, 100 μg of purified tfRFP or ovalbumin (OVA) in 50 μl PBS was emulsified by 30 min of vortexing in an equal volume of complete Freund's adjuvant (CFA, Sigma-Aldrich, St. Louis, Missouri, United States); this solution was then injected subcutaneously into both flanks at the base of the tail. Seven days later, 20 μg of tfRFP or OVA emulsified in 25 μl of IFA was injected subcutaneously into the right hind footpad. For the control group, PBS without any protein was emulsified in IFA at the v/v ratio of 1:1. The thickness of the footpad was measured with gauge calipers at the indicated time points (before the second challenge and 4 h, 24 h, 48 h, and 72 h post-challenge). The increase in footpad thickness was calculated as follows: Footpad swelling (mm) = Thickness after second tfRFP challenge - Thickness before second challenge.
Splenocyte Separation
Mice were sacrificed by cervical dislocation and disinfected in 70% alcohol for 10 min. Spleens were excised and put into petri dishes containing 3 ml of RPMI 1640 medium. Separated single cells were obtained by pressing the spleens against the bottom of the dish in a circular motion and washing through a 70-µm mesh. After centrifugation at 300 × g for 5 min, cell pellets were resuspended in 4 ml of ACK buffer. The cells were incubated in ACK buffer at room temperature for 3 min and centrifuged at 300 × g for 5 min. The cell pellets were resuspended in 5 ml of RPMI 1640 medium containing 10% FBS for experiments.
Lymphocyte Proliferation Assay
Seven days after the second immunization, splenocytes were collected from the immunized mice and then cultured with tfRFP (50 μg/mL) stimulation. The cells were seeded in a 96-well plate at a density of 3×10⁵ cells/well and cultured in RPMI 1640 medium supplemented with 10% FBS, 50 nM β-mercaptoethanol, and penicillin-streptomycin. After 3 days, 20 μL of MTS (CellTiter 96® AQueous One Solution Cell Proliferation Assay, Promega, Madison, Wisconsin, USA) was added into each well and then cultured for another 4 h at 37°C. The absorption at 490 nm and the reference wavelength of 620 nm was detected using a spectrophotometer. The larger absorption at 490 nm represents a higher proliferation rate.
Animal Model and Intravital Imaging
C57BL/6-Tg(CAG-EGFP) mice (6 to 10 weeks old) were immunized twice at the tail base. The control group was treated similarly, except that an equal volume of PBS was injected subcutaneously in place of IFA-emulsified recombinant tfRFP. Seven days after the second immunization was defined as Day 0. On Day -2, all of the mice in both groups were anesthetized and dehaired with hair clippers and depilatory cream. Specifically, the mice were first injected intraperitoneally with 120 mg/kg ketamine and 18 mg/kg xylazine (Sigma, St. Louis, Missouri, USA). Then, the hair was cut short with hair clippers and smeared with depilatory cream using cotton swabs. The depilatory cream was removed after 5 min according to the manufacturer's instructions to avoid potential irritation to the mice. On Day -1, all of the mice were implanted surgically with dorsal skinfold window chambers as described by Palmer et al (23). To relieve the pain of surgery, all mice were given an intraperitoneal injection of tolfedine (16.25 mg/kg, Vétoquinol, Lavaltrie, Québec, Canada) at the time of the procedure and within 24 hours after the implantation.
On Day 0, 2 × 10⁵ tfRFP-B16 cells (suspended in 20 μl PBS) were implanted within the dorsal window chamber. On Days 2, 3, 5, and 7, intravital two-photon imaging was performed using a Nikon upright A1R MP+ microscope (Minato, Tokyo, Japan) with a dry 20×/0.75NA objective (Nikon, Minato, Tokyo, Japan). Mice were anesthetized with 0.5 - 1.5% isoflurane in oxygen flow at 0.6 L/min, which was controlled by a Matrx VMS small animal anesthesia machine (Midmark, Kettering, Ohio, USA). The dorsal window chamber (APJ Trading, Ventura, California, USA) was fixed into a homemade horizontal bracket. Throughout the imaging process, the mouse was placed on a heating pad to maintain its body temperature at 37°C. Simultaneous excitation of tfRFP and EGFP was provided with a Mai Tai HP DeepSee Ti:Sapphire laser (Spectra-Physics, Santa Clara, California, USA) tuned at 1,000 nm. The fluorescent signals were collected through different filter sets (tfRFP 601~657 nm, EGFP 500 ~ 550 nm) with the non-descanned detector. A typical video was recorded with a galvanometer scanner every 10 s with zoom×1.5 for 10 min. Large images were stitched with 8×8 single fields of view (FOVs) with a 10% overlap, each of which was captured similarly, except that the resonant scanner was used to acquire images of each FOV 4 times for averaging. The objective was zoomed in 6× when images of microparticles were collected. All the images and videos were collected with the software NIS-Elements version 4.2 provided by the manufacturer of the microscope system (Nikon, Minato, Tokyo, Japan).
Histological Tumor Analysis
For all the cryosections, 1 × 10⁶ tfRFP-B16 or mCerulean-B16 tumor cells or equivalently mixed tfRFP-B16/mCerulean-B16 cells were subcutaneously inoculated at the hind flank of the mice. After removing the tumors at the indicated time points (Day 2 or Day 7, as mentioned in the legends), the tumors were fixed in 4% paraformaldehyde, dehydrated in 20% sucrose, frozen in Tissue-Tek OCT compound, and sectioned (25 μm) on a Leica CM1950 cryostat (Wetzlar, Germany). Anti-mouse Ly-6G Alexa Fluor 700 (diluted to 1:150, Biolegend, San Dieg, California, USA), anti-mouse F4/80 Alexa Fluor 647 (diluted to 1:150, Biolegend, San Dieg, California, USA), anti-mouse CD4 Alexa Fluor 647 (diluted to 1:200, Biolegend, San Dieg, California, USA), anti-mouse CD8a Alexa Fluor 647 (diluted to 1:200, Biolegend, San Dieg, California, USA), and anti-mouse B220 Alexa Fluor 647 (diluted to 1:200, Biolegend, San Dieg, California, USA) antibodies were used to identify neutrophils, macrophages, CD4+ T cells, CD8+ T cells, and B cells, respectively, in the tumor tissue. Tumor sections were imaged on a Zeiss LSM 710 confocal imaging system (Oberkochen, Germany) with a dry 20×/0.8NA objective. Sequential excitation of fluorphores was provided by a 561 nm DPSS laser (tfRFP: 582 ~ 650 nm), a 488 nm Ar laser (EGFP: 495 ~ 540 nm), and a 640 nm Helium-Neon laser (Alexa Fluor 647: 650 ~ 700 nm; Alexa Fluor 700: 700 ~ 750 nm). The same microscope system was used for the cryosections of mixed tumor of mCerulean-B16 and tfRFP-B16. The 458 nm Ar laser was used to excite mCerulean (457 ~ 534 nm) and 561 nm to excite tfRFP (572 ~ 667 nm). Data were collected with Zeiss Zen Black 2012 software and further analyzed in ImageJ (Version 1.49, Fiji distribution).
Data Analysis of Videos and Images
Immunocyte trajectories in tfRFP-immunized and non-immunized mice were tracked and characterized similarly according to the following parameters (12): 1) mean velocity, the mean value of the instantaneous velocities of a cell over the entire trajectory, μm/min; 2) arrest coefficient, the proportion of time when the instantaneous velocity of a cell is less than 2 μm/min; 3) confinement ratio, the ratio of the displacement of a cell to the length of its trajectory, i.e., the straightness of the cell trajectory. All cell motility data were extracted from videos acquired by two-photon microscopy using Imaris (Version 7.6, Bitplane) and ImageJ (Version 1.49, Fiji distribution).
Statistical Analysis
Experimental data are expressed as the means ± SEM. Histograms are presented using Graphpad Prism. Two-way ANOVA analysis and Bonferroni post-tests were used for comparisons of tumor growth and the DTH reaction assay between tfRFP-immunized and control groups at the same time point. For the comparisons of cell motility, groups were compared using the Kruskal-Wallis test followed by Dunn's multiple comparison test. For comparisons between two samples, Student's t test was used. The statistical analysis is described in each figure legend. Differences between or among groups were indicated by ns for non-significant, * for P < 0.05, ** for P < 0.01, *** for P < 0.001, **** for P < 0.0001, respectively.
Results
The tumorigenicity of tfRFP-expressing B16 cells was suppressed in tfRFP-immunized mice
FP-expressing tumor cell lines are often used to track tumor growth, metastasis, and therapeutic effects in vivo. The B16 melanoma cell line is a common tumor model for investigating tumor immunology (24). Due to the high absorption of melanin in the visible spectrum with an obvious decline at wavelengths greater than 600 nm (25), it is better to use a far-red FP to label B16 cells for in vivo optical imaging. Here, we successfully isolated a B16 tumor cell line, tfRFP-B16, which stably expressed tfRFP with an expression rate of approximately 100% (Fig. 1A). Whole-body optical imaging showed that tfRFP-B16 cells formed subcutaneous solid tumors (Fig. 1B) and metastases in the lung and liver (Fig. 1C, Fig. S1) with strong fluorescence signals in C57BL/6 mice, indicating that tfRFP-B16 cells still partially maintained the tumorigenicity and invasiveness of the parental B16 cells.
The tumorigenicity of tfRFP-B16 cells. (A) Confocal microscopy and flow cytometry analysis of tfRFP-B16 cells. Bar in the lower right of the merged image represents 100 μm; the bar in the enlarged box in the upper right represents 10 μm. (B) Whole-body fluorescence imaging of a tfRFP-B16 tumor-bearing mouse. (C) Metastatic potential of tfRFP-B16 cells and the fluorescence imaging of metastases. (D) Photographs of tfRFP-B16 and P-B16 cells in the tfRFP-immunized and non-immunized mice. (E) Tumor growth of tfRFP-B16 and P-B16 cells in normal C57BL/6 mice. (F) Tumor growth of tfRFP-B16 cells in the tfRFP-immunized and non-immunized C57BL/6 mice. Statistical analyses were performed using two-way ANOVA analysis and Bonferroni post-tests. For the experiments in D and E, n = 5, error bars represent the means ± SEM, *P < 0.05, **P < 0.01, ***P < 0.001.
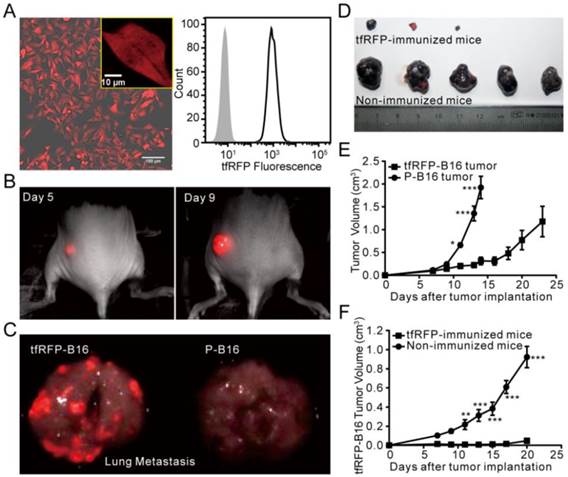
We next compared the growth rate of tfRFP-B16 cells and P-B16 cells in vitro and in vivo. The cell proliferation assay showed that tfRFP-B16 cells maintained the same proliferation rate as P-B16 cells (Fig. S2). However, there was a significant difference between the tfRFP-B16 and P-B16 cells implanted subcutaneously in C57BL/6 mice (n = 5, P < 0.001; Fig. 1E). This observation may be the result of the immune system recognizing and responding to tfRFP.
To evaluate the immunogenicity of tfRFP in C57BL/6 mice, tfRFP-B16 cells or P-B16 cells were inoculated into the hind flank of the tfRFP-immunized mice. Tumor cells implanted into non-immunized mice, which were instead injected with PBS, served as the control group. The tumorigenicity of tfRFP-B16 cells was clearly inhibited in tfRFP-immunized mice (n = 5, P < 0.001, Fig. 1D and F), whereas there was no significant difference in the tumorigenicity of P-B16 cells between immunized and non-immunized mice (n = 4, P = 0.4637, Fig. S3A). Moreover, the tumorigenicity of another cell line, mCerulean-B16, which stably expresses the GFP-derived FP mCerulean, was not significantly affected by tfRFP immunization (Fig. S3B). These data suggest that tfRFP, a foreign antigen, elicited a specific immune response to efficiently block the growth of tfRFP-B16 tumors in immunized C57BL/6 mice.
tfRFP elicited both humoral and cellular immune responses in C57BL/6 mice
To verify the humoral immune response elicited by tfRFP, a semi-quantitative ELISA was used to detect the relative concentration of anti-tfRFP antibody in the serum. As shown in Fig. 2A, anti-tfRFP antibody was generated in immunized mice from 7 days after the 1st immunization. The serum level of anti-tfRFP antibodies increased continually after the 2nd immunization of tfRFP. Five days after the 1st immunization, there was no difference in antibody levels between the immunized mice (both tfRFP-immunized and OVA-immunized mice), and the antibody was undetectable in the non-immunized mice. The antibody titer was 0.26 × 10⁶ in tfRFP-immunized mice and was very low in OVA-immunized mice 7 days after the 1st immunization. After the 2nd immunization, the antibody titer in tfRFP-immunized mice significantly and continually increased to 1.8 × 10⁶ at 10 days, 3.6 × 10⁶ at 14 days, and 6.1 × 10⁶ at 17 days, i.e. 16.4-fold higher at 10 days, 7.0-fold higher at 14 days, and 9.0-fold higher at 17 days compared with those in OVA-immunized mice (Fig. 2B, Fig. S2). These results demonstrated that tfRFP elicits strong humoral immune response.
tfRFP induced both humoral and cellular immune responses in C57BL/6 mice. (A) The serum anti-tfRFP antibody levels on the indicated days. Murine serum was diluted 64,000-fold. For the tfRFP-immunized group, n = 4; for the non-immunized group, n = 3. (B) The serum anti-tfRFP and anti-OVA antibody titer on the indicated days. For the tfRFP-immunized group, n = 4; for the OVA-immunized group, n = 3. (C) The level of IFN-γ released by splenocytes from tfRFP-immunized and non-immunized mice. The presented data are from 10 mice in each group pooled from two independent experiments. (D) The percentages of IFN-γ+ cells in tfRFP-stimulated and PBS-treated splenocytes by flow cytometric analysis. For both groups, splenocytes were from tfRFP-immunized mice, and n = 3. (E) Median fluorescence intensity of IFN-γ+ splenocyte subsets. The data were derived from tfRFP-stimulated splenocytes and n = 3. (F) tfRFP induced vigorous proliferation of murine splenocytes from tfRFP-immunized C57BL/6 mice. For both the tfRFP-stimulated and PBS control groups, n = 4. (G) tfRFP induced a DTH reaction, as assessed by the increase in footpad thickness. OVA and PBS were positive and negative controls, respectively. The presented data are from 10 mice in each group pooled from two independent experiments. The comparison of IFN-γ levels, IFN-γ+ cell percentages and lymphocyte proliferation between two groups was performed using Student's t test, and the other statistical analyses were performed using a one-way or two-way ANOVA and Bonferroni post-tests. The values are the means ± SEM, *P < 0.05, **P < 0.01, ***P < 0.001, ****P < 0.0001.
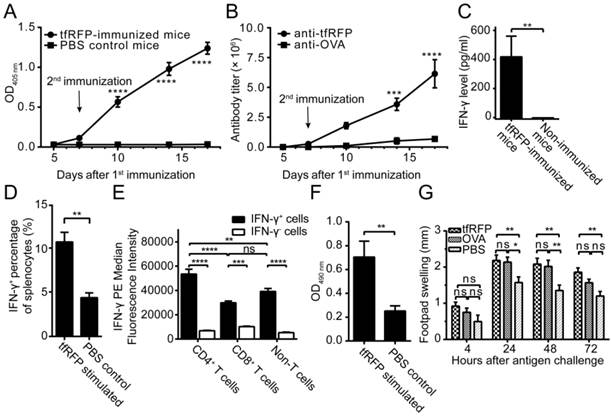
Delayed-type hypersensitivity (DTH) is a typical reaction elicited by a T cell-mediated immune response. To verify that tfRFP elicited cellular immune responses, we measured the production of IFN-γ and the level of DTH. The ELISA results indicated that splenocytes obtained from the immunized mice produced a distinct level of IFN-γ (425.1 ± 142.2 pg/ml, n = 10) when stimulated with tfRFP, whereas IFN-γ was undetectable in the non-immunized group (Fig. 2C). The flow cytometry data showed that the IFN-γ+ cells consisted primarily of CD4+ T cells (20.3% ± 2.0%), CD8+ T cells (13.8% ± 1.2%) and F4/80+ macrophages (51.9% ± 2.5%) (Fig. 2D and Fig. S4E-F). Median fluorescence intensity (MFI) analysis demonstrated that CD4+ T cells showed higher IFN-γ expression level than other cells (Fig. 2E). This is reasonable because adaptive immunity should play a more important role in the immune responses to the protein antigen tfRFP. An in vitro lymphocyte proliferation assay verified that tfRFP vigorously stimulated the proliferation of splenocytes from tfRFP-immunized mice (Fig. 2F); the viability of splenocytes in the tfRFP-stimulated group (0.7046 ± 0.667) was 2.79-fold of that in the PBS control group (0.2517 ± 0.0216). Furthermore, tfRFP emulsified in IFA successfully elicited a DTH reaction with clear footpad swelling, and it is well known that DTH is a typical cell-mediated immune response (22). As shown in Fig. 2G, the degree of footpad swelling in the tfRFP-immunized mice was significantly higher than that in the IFA control group (P < 0.05, n = 10). tfRFP elicited swelling similar with the classic antigen OVA(P > 0.05 at all of the four indicated time points), indicating that tfRFP possesses strong immunogenicity in C57BL/6 mice.
Large-field intravital microscopy of the recruitment and accumulation of immunocytes in the tfRFP-B16 tumor microenvironment
Given the immunogenicity of tfRFP, to reveal the dynamic process of the tfRFP-elicited specific immune response, a visualizable tumor microenvironment model was established using EGFP-transgenic C57BL/6 mice with a skin-fold window chamber in which tfRFP-B16 cells were implanted for intravital imaging. The day that tumor cells were implanted, i.e. seven days after the second immunization, was defined as Day 0. Thus, we could observe how the host immunocytes attacked tfRFP-B16 cells in the tumor microenvironment using two-photon excitation microscopy because all nucleated cells express EGFP in EGFP-transgenic C57BL/6 mice and most mobile cells are immunocytes.
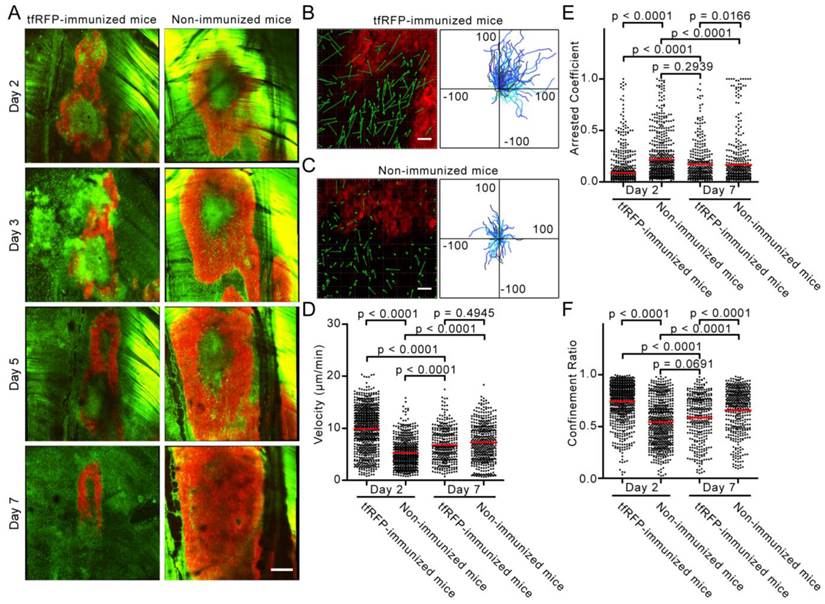
To observe the immune response in the whole tumor microenvironment, 8 × 8 imaging fields (422.97 μm × 422.97 μm/field) were collected using two-photon microscopy with 20× objective and stitched into a large-field image to display the distribution of EGFP+ cells in the implanted tfRFP-B16 tumor area. Because the implanted tfRFP-B16 cells demand one day to adapt to the in vivo environment, large-field images were acquired on Days 2, 3, 5, and 7. Strikingly, in the immunized mice, a large number of EGFP+ immunocytes infiltrated into the tfRFP-B16 tumor area as early as Day 2 (Fig. 3A). Flow cytometric analysis revealed that there were (4.14 ± 0.38) × 104 tumor-infiltrating immunocytes (TIIs) in the tfRFP-immunized mice, nearly 2.5-fold more than those in the non-immunized mice [(1.63 ± 0.31) × 104 TIIs, Fig. S9E, n = 3, P = 0.0073]. Subsequently, an increasing number of clusters of EGFP+ immunocytes appeared in the tumor microenvironment on Day 2, resulting in abundant EGFP-expressing immunocytes covering most of the tumor area on Day 3. The majority of EGFP+ cells were dispersed on Days 5 and 7, whereas the tfRFP-B16 tumor area containing the tfRFP signal shrank, indicating that tfRFP-B16 cells were partially eliminated by immunocytes and that the tumorigenesis of the tfRFP-B16 tumor was controlled in immunized mice. In contrast, tfRFP-B16 tumors kept growing in non-immunized mice, and the number of immunocytes in the tumor area was clearly less than that observed in immunized mice (Fig. 3A).
Intravital imaging of the specific immune response against tfRFP-B16 cells. (A) Large-field images of the tumor microenvironment in the same mouse on the indicated days after implantation of tfRFP-B16 cells. Green: EGFP+ host immunocytes; Red: tfRFP-B16 cells; Field of view (FOV): 2,888.6 μm × 2,888.6 μm; Scale bar represents 500 µm. (B-C) Typical images of immunocyte displacement and tumor position in the FOV. The scale bar represents 50 μm. The corresponding trajectory of immunocyte movements was tracked and extracted. The units for the x and y axes are microns. The start points of the trajectories were set at the origin. (D-F) Statistical analysis of (D) the mean velocity, (E) the arrest coefficient, and (F) the confinement ratio of immunocytes on Days 2 (Additional file 2: Video S1) and 7 (Additional file 3: Video S2). Statistical analyses were performed using the Kruskal-Wallis test followed by Dunn's multiple comparison test. Data were pooled from 5 mice in each group from three independent experiments.
Time-lapse fluorescence imaging visualized the high motility and chemotactic movement of immunocytes in the specific anti-tumor immune response
To visualize the recruitment of immunocytes to the tumor area at the early stage of the tfRFP-specific immune response, time-lapse imaging of the tumor microenvironment was performed on Days 2 and 7 after tfRFP-B16 implantation. We moved the imaging focus to the tumor margin where the recruitment and infiltration of host EGFP+ immunocytes in the tumor area were clearly observed (Fig. 3B-C). The motility of immunocytes on Days 2 and 7 was characterized using a series of dynamic parameters (11, 26), such as cell trajectories, mean velocities, arrest coefficients, and confinement ratios of the pooled data (Fig. 3D-F).
As shown in Additional file 2: Video S1, at the early stage (Day 2), host EGFP+ immunocytes rushed vigorously to the tumor area in tfRFP-immunized mice. The cell trajectories were tracked with Imaris, and representative examples are shown in Fig. 3B and 3C. The data obtained from immunized mice showed that the displacements of the cell trajectories (green arrows in Fig. 3B-C) were pointing to the tumor area, and in accordance with the tumor position in the field of view (FOV), most of the cell trajectories were constrained to the first quadrant of the coordinate system (Fig. 3B-C). In non-immunized mice, the chemotactic movement of immunocytes was not obvious. Meanwhile, the mean velocity of immunocytes in the immunized mice was significantly faster than that in the non-immunized mice on Day 2 (9. 90 ± 0.16 μm/min vs. 5.30 ± 0.11 μm/min, n = 5, P < 0.0001, Fig. 3D). Lindquist et al. defines 2 μm/min as the threshold between moving and sessile cells (27), and Tadokoro et al. coined the term “arrest coefficient” using this threshold (28).
The arrest coefficient, which is defined as the ratio of “resting” time (when the immediate velocity is less than 2 μm/min) to the duration of the imaging session, also demonstrated a significant difference, i.e. immunocytes in tfRFP-immunized mice rested much less than those in non-immunized mice (0.089 ± 0.006 vs. 0.217 ± 0.010, n = 5, P < 0.0001, Fig. 3E). There was also a striking difference in the confinement ratio (straightness) of the cell trajectories. This parameter was significantly higher in tfRFP-immunized mice than in non-immunized mice (0.744 ± 0.007 vs. 0.545 ± 0.009, n = 5, P < 0.0001, Fig. 3F). These data indicate that immunocytes in immunized mice moved toward the tumor area with more activity and on a straighter path at an early stage (Day 2). At a later stage (Day 7), the immunocytes in immunized mice moved more slowly with a mean velocity that decreased from 9.90 ± 0.16 μm/min on day 2 to 6.80 ± 0.18 μm/min on day 7 (P < 0.0001). In addition, the arrest coefficient increased to 0.171 ± 0.010 (P < 0.0001), and the confinement ratio decreased to 0.585 ± 0.012 (P < 0.0001), which may have been due to the massive dispersion of cognate antigens.
Seven days after tfRFP-B16 cell implantation, the specific immune response was also observed in non-immunized mice, i.e. the immunocytes moved faster (7.29 ± 0.18 μm/min) than on Day 2 (5.30 ± 0.18 μm/min) (P < 0.0001, Fig. 3D). There was no significant difference in the mean velocity of immunocytes between the tfRFP-immunized and non-immunized mice on Day 7 (n = 5, P > 0.05, Fig. 3C-E, Additional file 3: Video S2). In fact, the mean velocities of cells from both groups were slower than those in the tfRFP-immunized mice on Day 2. Day 7 may be a time point when the intensity of the immune responses in the immunized and non-immunized mice was well-matched. However, the arrest coefficient and confinement ratio data revealed that the motility of immunocytes in non-immunized mice (arrest coefficient 0.166 ± 0.012, confinement ratio 0.658 ± 0.010) was more directed than that in immunized mice (0.585 ± 0.012) on Day 7 (P < 0.0001, Fig. 3E-F). These data indicated that the strong immunogenicity of tfRFP in the tfRFP-B16 cells was recognized by the host immune system, resulting in the activation of immunocytes, even in non-immunized mice. This immunogenicity is likely why the tumorigenicity of tfRFP-B16 cells is weaker than that of P-B16 cells (Fig. 1E). These data also suggested that, although not so strong as on Day 2, immunocytes in immunized mice on Day 7 remained the activated state, which is crucial for the inhibition of tumor growth.
Intravital microscopy and ex vivo identification of Ly-6G+ neutrophil clusters and tfRFP+ microparticles in the tumor microenvironment of the tfRFP-immunized mice
During the imaging study of the motility of the massive recruited immunocytes, we captured an intriguing behaviour of a population of the immunocytes. As shown in Additional file 4: Video S3 and the screenshots of different time points in Fig. 4A, many EGFP+ immunocytes moved quickly and aggregated into many EGFP+ cell clusters, each of which was formed within ten minutes. We speculated that these clusters of immunocytes were trigged by an incentive and gathered with certain central points. In this interesting process, the fast-moving cells, which were typically 8 - 10 μm in length and 4 - 6 μm in width, formed clusters with an average diameter up to an average diameter of more than 30 μm. However, the centroids of cell clusters barely moved (Fig. S5). Interestingly, we found in tumor cryosections on Day 2 that the cell clusters mainly consisted of Ly-6G+ neutrophils (the antibody 1A8, labeled only Ly-6G+ neutrophils and not Ly-6C+ cells) and pushed the surrounding tumor cells aside (Fig. 4B ROI 1, i.e. the yellow box in Fig. S7). A few of tfRFP+ microparticles existed inside of the newly formed cell clusters, while in the area where Ly-6G+ cells were disassociated from the cell clusters, massive tfRFP+ microparticles dispersed with the tumor cells dead (Fig. 4B ROI 2, i.e. the cyan box in Fig. S7). It suggested that a few of tfRFP+ microparticles generated inside the tumor is the incentive to attract the recruitment of immunocytes and the formation of Ly-6G+ neutrophils clusters.
The formation of immunocyte clusters and the generation of tfRFP+ microparticles in tumor microenvironment of tfRFP-immunized mice. (A) Cell clusters formed on Day 2 in tfRFP-immunized mice as shown in Additional file 4: Video S3. The scale bar represents 100 μm. (B) Representative cryosection images of the newly formed (ROI 1, cyan box in Fig. S7) and disassociating (ROI 2, yellow box in Fig. S7) Ly-6G+ neutrophil clusters on Day 2. The scale bar represents 50 μm. (C) Representative images of tfRFP+ microparticles in tfRFP-immunized mice on Day 2 and Day 7. The scale bar represents 25 μm in length and approximately 2 μm in height. (D) tfRFP+ immunocytes appeared on Day 2 at the tumor border in the tfRFP-immunized mice. The typical FOV is indicated by the white box in Fig. S7. The enlarged images at the right side show the details of the corresponding boxes. The scale bar in the large image represents 50 μm, and the bar in the enlarged image is 10 μm. (E) tfRFP immunization led to the elimination of tfRFP-B16 cells in tfRFP-B16/mCerulean-B16 mixed tumors, leaving only the tfRFP+ microparticles. Red: tfRFP-B16 cells; Green: mCerulean-B16 cells. The scale bar represents 500 μm. Enlarged images are detailed images of the corresponding boxes from tfRFP-immunized mice and non-immunized mice. The scale bar represents 100 μm. (F) Statistical comparison of area ratio of tfRFP-B16 in living mixed tumor area. The data were pooled from 2 mice in each group. Each point stands for an area of 100 μm × 100 μm. (G) The phenomenon of generating microparticles is specific to tfRFP immunization but not mCerulean immunization. Day 2 tumors from the indicated mice were separated and sectioned for fluorescence imaging. The images are representative of those from 3 mice in each group. The scale bar represents 50 μm. (H, I) tfRFP+ microparticles were DiR-BOA- and IgG+. Cryosections of Day 2 tfRFP-B16 tumors from both immunized and non-immunized mice were stained with DiR-BOA (H) and anti-mouse IgG DyLight 690 (I). The results are typical images of Day 2 tumor sections from 3 mice in each group. The box in the upper right corner of each image shows the 3× enlarged details of the corresponding smaller white boxes. The scale bar represents 50 μm.
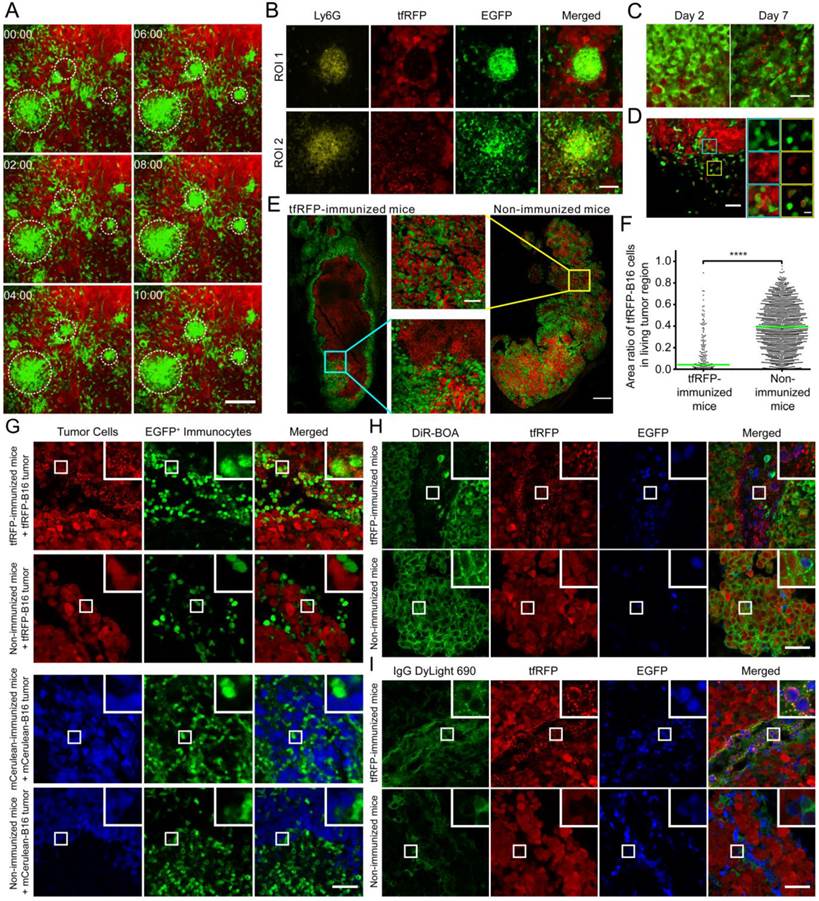
Based on this fascinating ex vivo phenomenon, we examined the in vivo existence and generation of tfRFP+ microparticles derived from tfRFP-B16 cells in immunized mice (Fig. S6A-B). The microparticle levels were moderate on Day 2 and clearly increased on Day 7 (Fig. 4C). It is also worth noting that the high density of fluorescent microparticles was primarily localized in the dark zones of the tumor where tfRFP-B16 cells had been eliminated on Day 7 (Fig. S6B). These tfRFP+ microparticles were endocytosed by EGFP+ immunocytes and existed in the dark zone (indicated with arrows in Fig. S6C). In the tumor margin, microparticles were engulfed by a large number of EGFP+ immunocytes and formed a tfRFP+ ring around the inside of the immunocytes (Fig. 4C and Fig. S6D). Given the sizes (0.5 - 2 µm) and the tfRFP contents, these microparticles were likely released from immunologically eliminated tfRFP-B16 cells, which is a sign of the anti-tumor effect triggered by the specific immune response against tfRFP-expressing tumor cells.
To further confirm the tfRFP-elicited specific immune response, tfRFP-B16 cells were mixed 1:1 with mCerulean-B16 cells and implanted into mice. Intriguingly, primarily tfRFP+ microparticles and few mCerulean+ microparticles were observed in the centers of tfRFP-B16/mCerulean-B16 mixed tumors in tfRFP-immunized mice. On Day 7, the majority of the tumor was composed of mCerulean-B16 cells, with the area ratio of tfRFP-B16 cells in living tumor areas decreased to 4.2 ± 0.5% in tfRFP-immunized mice compared to 39.3 ± 0.5% in non-immunized mice (P < 0.0001, Fig. 4E-F). These data provided direct evidence that the tfRFP-elicited immune response specifically attacked the tumor cells expressing tfRFP but not those expressing mCerulean. To further confirm that this observation of microparticles is specific to tfRFP, we repeated the experiment with mCerulean as the antigen. C57BL/6 mice were immunized with purified mCerulean and inoculated with mCerulean-B16 tumor cells. On Days 2 and 7, the mice were sacrificed, and the tumors were excised for cryosectioning. Fluorescence images of the cryosections indicated that mCerulean immunization did not elicit the generation of similar microparticles on either Day 2 or Day 7 (Fig. 4G and Fig. S6E). These data prove that the generation of tfRFP+ microparticles is a phenomenon specific to tfRFP, not to all fluorescent protein antigens.
The composition of the microparticles is of interest. The cryosections were stained with the cell membrane dye DiR-BOA to examine whether the microparticles had membranes composed of a lipid coat. To our surprise, the microparticles were not stained by the membrane dye (Fig. 4H). Because there were high titers of anti-tfRFP antibodies in the sera of the tfRFP-immunized mice (Fig. 2B), we speculated that there would be a high concentration of tfRFP-specific antibodies in the tumor microenvironment. The cryosections were stained with anti-murine IgG antibody. The immunofluorescence results showed that, in contrast to the microparticles ingested by immunocytes, most of the microparticles in the tumor interstices were IgG+ (Fig. 4I). These data indicated that the microparticles were antigen-antibody complexes. Because antigen-antibody complexes can be more easily phagocytosed by macrophages and other immunocytes, this result also explained why a large number of immunocytes in the tumor microenvironment had intracellular tfRFP (Fig. 4D, Fig. 4G, Fig. S6C and Fig. S6D).
Both innate immunocytes and adaptive immunocytes accumulated in tumors and were involved in tfRFP-B16 tumor elimination
To identify the types of immunocytes involved in the tfRFP-elicited anti-tumor immune response, immunofluorescence assays of tumor cryosections were performed (Fig. 5A-B, Fig. S7-S10). The immunofluorescence data from tfRFP-immunized mice 2 days after tfRFP-B16 cell implantation demonstrated that Ly-6G+ neutrophils were the main cellular population recruited to form the immunocyte clusters in the tumor area (Fig. 4B and Fig. S7). The data demonstrated that a large number of neutrophils accumulated in the tumor area and many microparticles existed in the area where intact tumor cells disappeared on Day 2 (Fig. 4B and Fig. S7). The majority of the TIIs were F4/80+ macrophages (Fig. S9A-S9B), while few other subpopulations of immunocytes, such as T cells and B cells, were observed (Fig. S9D). However, there were significantly more Ly-6G+ neutrophils in the tfRFP-immunized mice than in the non-immunized mice, even though the neutrophils in the cell clusters were not counted (Fig. S9C). This result indicated that innate immune cells were the major fighters in the Day 2 tumors.
Identification of tumor-infiltrating immunocytes in a tfRFP+ tumor on Day 7 with an immunofluorescence assay. (A) Ly6G+ neutrophils infiltrated to a greater extent in the tfRFP-immunized mice than in the non-immunized mice. The occurrence of tfRFP+ microparticles was related to the distribution of Ly6G+ neutrophils. (B) tfRFP+ macrophages (F4/80+, see Fig. S10 in the supplementary material for more details) were present in the tumor microenvironment only in the tfRFP-immunized mice. The data shown are representative images of tfRFP+ macrophages on Day 7. (C, D) A greater number of both CD4+ and CD8+ T cells accumulated in the tumor margin in the tfRFP-immunized mice than in the non-immunized mice. The size of the field of view (FOV) is 425.10 μm × 425.10 μm. The scale bar represents 100 μm. Images are representative of 2-4 mice in each group. Green cells are EGFP+ host immunocytes and red cells are tfRFP-B16 tumor cells. The magenta color represents the fluorescence signal of antibodies against the indicated antigens (see Fig. S10 for images of single channels). The numbers of Ly6G+ cells (E), CD8+ T cells (F) and CD4+ T cells (G) per FOV were statistically analyzed with Student's t-test. The data are pooled from at least 10 FOVs in each group and are shown as the means ± SEM. P values less than 0.05 were considered to be statistically significant (*P < 0.05, **P < 0.01, ****P < 0.0001).
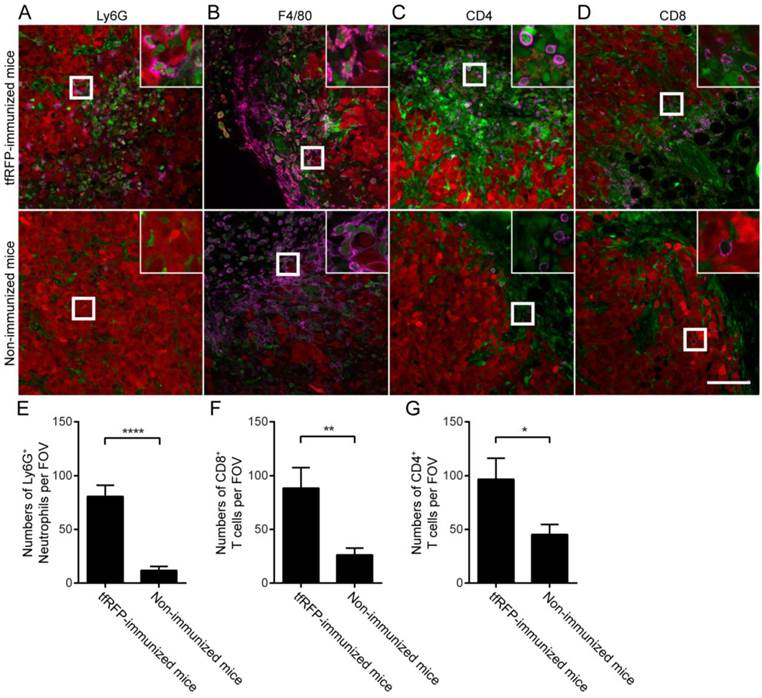
Notably, the histological results of Day 7 tumors revealed that the tfRFP-B16 tumors were infiltrated by Ly-6G+ neutrophils more in the tfRFP-immunized mice than in the non-immunized mice, although there was an obvious decrease in the cell number (80.77 ± 10.37 cells/FOV, n = 13, vs. 11.86 ± 3.70 cells/FOV, n = 14; Fig. 5A and 5E). More notably, in Day 7 tumors, the immunocytes engulfing tfRFP+ microparticles that appeared as a ring inside of the cells (Fig. S6D) turned out to be primarily F4/80+ macrophages (Fig. 5B). Because the tfRFP+ microparticles were antigen-antibody complexes, it is not surprising that macrophages took up the microparticles to form the fluorescent rings. As professional antigen presenting cells, the macrophages might take in the fluorescent model antigen to elicit long-lasting protective immunity. Accordingly, at this time, there were significantly more CD4+ T cells (96.73 ± 19.57 cells/FOV, n = 11) and CD8+ T cells (88.50 ± 19.11 cells/FOV, n = 10) infiltrated into the tumor microenvironment in the tfRFP-immunized mice compared to non-immunized mice (45.33 ± 9.261 CD4+ T cells/FOV, n = 12; 26.23 ± 6.376 CD8+ T cells/FOV, n = 13, Fig. 5C-D and 5F-G). The nearly unlimited diversity and effective cytotoxicity of T cells makes them the most potent anti-tumor effectors. Thus, the immune responses elicited by tfRFP immunization should have maintained control of the general microenvironment of tfRFP-B16 tumors, supporting the inhibited tumorigenicity in tfRFP-immunized mice (Fig. 1E).
Discussion
Our findings verified that tfRFP, a foreign protein with a fluorescent signal, is an ideal model antigen in C57BL/6 mice. Thus, we developed a visualizable animal model with the tfRFP antigen and tfRFP-expressing tumor cells to investigate the specific anti-tumor immune response in the tumor microenvironment using intravital optical microscopy. The advantages of tfRFP as a model antigen are as follows: 1) it is simple—it is easy to purify tfRFP in vitro, to isolate stable tfRFP-expressing tumor cells, and to detect tfRFP-specific immune responses in vivo; 2) it is multifunctional—tfRFP is both a model antigen and a fluorescent reporter; 3) it is efficient—tfRFP simultaneously elicits cellular and humoral immune responses, efficiently inhibiting the growth of tfRFP+ tumors in C57BL/6 mice; and 4) it is specific—the tfRFP-elicited immune response was specific against tfRFP+ tumors but not mCerulean+ tumors.
Both cellular and humoral immune responses were involved in the elimination of tfRFP+ tumor cells by the immune system. Before the implantation of the tfRFP+ tumor cells, tfRFP-immunized C57BL/6 mice possessed the essential conditions for both cellular and humoral immune responses, such as a high titer of anti-tfRFP antibody in the murine blood (Fig. 2B), lymphocytes that had been exposed to tfRFP with strong IFN-γ secretion potential (Fig. 2C), and the tfRFP immunization-induced memory T cells, as shown by the DTH assay (Fig. 2G). According to long-term intravital imaging of the tfRFP-elicited immune response, we propose that the specific elimination process triggered by the implantation of tfRFP+ tumor cells was as follows. A small amount of tfRFP antigen released from tfRFP-B16 cells activated the memory cells to secrete IFN-γ, changing the immune response to Th1 type and activating innate immune cells (e.g., neutrophils and monocytes).
On Day 2, a large number of neutrophils and macrophages were recruited to the tumor area (Fig. S7-S8), forming cell clusters and pushing the adjacent tumor cells aside (Fig. 4B ROI 1). The formation of neutrophil clusters was observed in the murine ear skin, which was induced within 20 min by damage-elicited sterile inflammation after high-power laser treatment (29, 30). The neutrophil clusters in our experiment were not induced by the laser-elicited inflammation but were probably due to inflammation factors released when a few tfRFP-B16 cells were killed during the tfRFP-elicited immune response, resulting in the recruitment of neutrophils. In the context of a high titer of anti-tfRFP antibodies (Fig. 2B), tfRFP+ tumor cells were killed by the activated neutrophils and macrophages through antibody-dependent cell-mediated cytotoxicity (ADCC) (Fig. S11). Killed tumor cells released tfRFP, resulting in the generation of tfRFP+ microparticles. These microparticles which contained antibody, were recognized and ingested by APCs (e.g., macrophages, dendritic cells, etc.) in the tumor microenvironment. When tfRFP fragments were presentd to cognate effector cells (e.g., CD4+ and CD8+ T cells), especially those that had been pre-activated by tfRFP-immunization, would be recruited to the tumor site and infiltrated into the tumor (Fig. 5C and 5D), which further eliminated tfRFP+ tumor cells. Because of this, the center of the tumor displayed a large area of death and was filled with a large number of tfRFP+ microparticles. At this time, the F4/80+ macrophages in the tumor area ingested the abundant microparticles (Fig. 5B) and more efficiently presented antigens (including self-antigens from the B16 cell line in addition to tfRFP) to further activate more diversified effectors. As a result, this chain of events formed a loop of regenerative feedback until the elimination of the tfRFP+ tumor.
In the non-immunized mice, we observed that the immunocytes were activated on Day 7 with the elevated motility of immunocytes and the emergence of microparticles, compared with those on Day 2. This is also the evidence of the significant immunogenicity of tfRFP, the fluorescent protein variant derived from Entacmaea quadricolor, which is more amenable to intravital microscopic imaging in C57BL/6 mice compared to mCerulean, one of the GFP variants derived from Aequorea victoria. The immunogenicity of tfRFP makes the tfRFP-B16 cells grow more slowly than the parental P-B16 and mCerulean-B16 cells in vivo (Fig. 1E and Fig. S3B). Thus, our results indicated that the immunogenicity of fluorescent proteins (31-33) should be taken into consideration when we choose such a protein as a tool for research, especially for intravital studies in immunology.
In summary, we found a novel anti-tumor immune response pattern by using tfRFP as a fluorescent model antigen. Two novel phenomena in tumor microenvironment of tfRFP-immunized mice were revealed using the intravital imaging. One is rapid formation of the neutrophil clusters; the other is the generation of abundant tfRFP+ microparticles. Attributed to tfRFP-specific antibodies, neutrophils and other immunocytes recognized and killed tfRFP+ tumor cells efficiently via ADCC, generating a large number of tfRFP+ microparticles. These tfRFP-containing microparticles were engulfed and ingested by antigen-presenting cells (e.g., macrophages and dendritic cells) for further immune stimulation in a regenerative feedback loop. Thus, a visualizable model antigen system based on the tfRFP is a powerful tool for investigating the specific immune response in vivo.
Abbreviations
tfRFP: tetrameric far-red fluorescent protein; OVA: Ovalbumin; EGFP: enhanced green fluorescent protein; IPTG: isopropyl β-D-1-thiogalactopyranoside; IFA: incomplete Freund's adjuvant; CFA: complete Freund's adjuvant; DTH: delayed-type hypersensitivity; FOV: field of view; IFN-γ: interferon gamma; ROI: region of interest; ADCC: antibody-dependent cell-mediated cytotoxicity; APC: antigen-presenting cell.
Supplementary Material
Additional File 1Figures S1-S10.
Video S1.
Video S2.
Video S3.
Acknowledgements
The authors thank Dr. Guanxin Shen for paper discussions. We thank the Optical Bioimaging Core Facility of WNLO-HUST for support in data acquisition and the Analytical and Testing Center of HUST for spectral measurements. This work was supported by the Major Research plan of the National Natural Science Foundation of China (Grant No. 91442201), the Science Fund for Creative Research Group of China (Grant No. 61421064), the Fundamental Research Funds for the Central Universities (HUST: 2015ZDTD014) and the Director Fund of WNLO.
Author contributions
F. Y., S. L., X.L., L.L., Q.M.L., and Z.H.Z. initiated and designed the project; F.Y., S. L., X.L., L.L., M.J.L., S.H.Q., G.Q.X., and S.Q. performed the experiments; L.F. assisted with data processing, and F.Y., S. L., X.L., L.L., Q.M.L., and Z.H.Z. analyzed the data and wrote the paper.
Competing Interests
The authors have declared that no competing interest exists.
References
1. Germain RN, Robey EA, Cahalan MD. A decade of imaging cellular motility and interaction dynamics in the immune system. Science. 2012;336(6089):1676-81
2. Ellenbroek SI, van Rheenen J. Imaging hallmarks of cancer in living mice. Nat Rev Cancer. 2014;14(6):406-18
3. Looney MR, Thornton EE, Sen D, Lamm WJ, Glenny RW, Krummel MF. Stabilized imaging of immune surveillance in the mouse lung. Nat Methods. 2011;8(1):91-6
4. Tang JY, van Panhuys N, Kastenmuller W, Germain RN. The future of immunoimaging - Deeper, bigger, more precise, and definitively more colorful. Eur J Immunol. 2013;43(6):1407-12
5. Pittet MJ, Weissleder R. Intravital Imaging. Cell. 2011;147(5):983-91
6. Zal T, Chodaczek G. Intravital imaging of anti-tumor immune response and the tumor microenvironment. Semin Immunopathol. 2010;32(3):305-17
7. Weigert R, Porat-Shliom N, Amornphimoltham P. Imaging cell biology in live animals: Ready for prime time. J Cell Biol. 2013;201(7):969-79
8. Quezada SA, Peggs KS, Simpson TR, Allison JP. Shifting the equilibrium in cancer immunoediting: from tumor tolerance to eradication. Immunol Rev. 2011;241(1):104-18
9. Schreiber RD, Old LJ, Smyth MJ. Cancer immunoediting: integrating immunity's roles in cancer suppression and promotion. Science. 2011;331(6024):1565-70
10. Engelhardt JJ, Boldajipour B, Beemiller P, Pandurangi P, Sorensen C, Werb Z. et al. Marginating dendritic cells of the tumor microenvironment cross-present tumor antigens and stably engage tumor-specific T cells. Cancer Cell. 2012;21(3):402-17
11. Boissonnas A, Fetler L, Zeelenberg IS, Hugues S, Amigorena S. In vivo imaging of cytotoxic T cell infiltration and elimination of a solid tumor. J Exp Med. 2007;204(2):345-56
12. Mrass P, Takano H, Ng LG, Daxini S, Lasaro MO, Iparraguirre A. et al. Random migration precedes stable target cell interactions of tumor-infiltrating T cells. J Exp Med. 2006;203(12):2749-61
13. Breart B, Lemaitre F, Celli S, Bousso P. Two-photon imaging of intratumoral CD8+ T cell cytotoxic activity during adoptive T cell therapy in mice. J Clin Invest. 2008;118(4):1390-7
14. Deguine J, Breart B, Lemaitre F, Di Santo JP, Bousso P. Intravital Imaging Reveals Distinct Dynamics for Natural Killer and CD8(+) T Cells during Tumor Regression. Immunity. 2010;33(4):632-44
15. Stripecke R, Carmen Villacres M, Skelton D, Satake N, Halene S, Kohn D. Immune response to green fluorescent protein: implications for gene therapy. Gene Ther. 1999;6(7):1305-12
16. Denaro M, Oldmixon B, Patience C, Andersson G, Down J. EGFP-transduced EL-4 cells from tumors in C57BL/6 mice. Gene Ther. 2001;8(23):1814-5
17. Skelton D, Satake N, Kohn DB. The enhanced green fluorescent protein (eGFP) is minimally immunogenic in C57BL/6 mice. Gene Ther. 2001;8(23):1813-4
18. Arina A, Murillo O, Hervas-Stubbs S, Azpilikueta A, Dubrot J, Tirapu I. et al. The combined actions of NK and T lymphocytes are necessary to reject an EGFP+ mesenchymal tumor through mechanisms dependent on NKG2D and IFN gamma. Int J Cancer. 2007;121(6):1282-95
19. Shcherbo D, Merzlyak EM, Chepurnykh TV, Fradkov AF, Ermakova GV, Solovieva EA. et al. Bright far-red fluorescent protein for whole-body imaging. Nat Methods. 2007;4(9):741-6
20. Zheng Y, Huang C, Cheng ZY, Chen M. Establishment of Visible Animal Metastasis Models for Human Nasopharyngeal Carcinoma Based on a Far-Red Fluorescent Protein. J Innov Opt Health Sci. 2012;5(3):1250019-28
21. Luo H, Yang J, Jin H, Huang C, Fu J, Yang F. et al. Tetrameric far-red fluorescent protein as a scaffold to assemble an octavalent peptide nanoprobe for enhanced tumor targeting and intracellular uptake in vivo. Faseb J. 2011;25(6):1865-73
22. Luo M, Zhang Z, Li H, Qiao S, Liu Z, Fu L. et al. Multi-scale optical imaging of the delayed type hypersensitivity reaction attenuated by rapamycin. Theranostics. 2014;4(2):201-14
23. Palmer GM, Fontanella AN, Shan S, Hanna G, Zhang G, Fraser CL. et al. In vivo optical molecular imaging and analysis in mice using dorsal window chamber models applied to hypoxia, vasculature and fluorescent reporters. Nat Protoc. 2011;6(9):1355-66
24. Pincha M, Sundarasetty BS, Salguero G, Gutzmer R, Garritsen H, Macke L. et al. Identity, potency, in vivo viability, and scaling up production of lentiviral vector-induced dendritic cells for melanoma immunotherapy. Human gene therapy methods. 2012;23(1):38-55
25. Castano AP, Demidova TN, Hamblin MR. Mechanisms in photodynamic therapy: part one-photosensitizers, photochemistry and cellular localization. Photodiagnosis Photodyn Ther. 2004;1(4):279-93
26. Cahalan MD, Parker I. Choreography of cell motility and interaction dynamics imaged by two-photon microscopy in lymphoid organs. Annu Rev Immunol. 2008;26:585-626
27. Lindquist RL, Shakhar G, Dudziak D, Wardemann H, Eisenreich T, Dustin ML. et al. Visualizing dendritic cell networks in vivo. Nat Immunol. 2004;5(12):1243-50
28. Tadokoro CE, Shakhar G, Shen SQ, Ding Y, Lino AC, Maraver A. et al. Regulatory T cells inhibit stable contacts between CD4(+) T cells and dendritic cells in vivo. J Exp Med. 2006;203(3):505-11
29. Ng LG, Qin JS, Roediger B, Wang YL, Jain R, Cavanagh LL. et al. Visualizing the Neutrophil Response to Sterile Tissue Injury in Mouse Dermis Reveals a Three-Phase Cascade of Events. J Invest Dermatol. 2011;131(10):2058-68
30. Lammermann T, Afonso PV, Angermann BR, Wang JM, Kastenmuller W, Parent CA. et al. Neutrophil swarms require LTB4 and integrins at sites of cell death in vivo. Nature. 2013;498(7454):371-5
31. Gambotto A, Dworacki G, Cicinnati V, Kenniston T, Steitz J, Tuting T. et al. Immunogenicity of enhanced green fluorescent protein (EGFP) in BALB/c mice: identification of an H2-Kd-restricted CTL epitope. Gene Ther. 2000;7(23):2036-40
32. Davey GM, Mueller SN, van Vliet C, Gigowski M, Zaid A, Davies B. et al. Identification of a MHC I-restricted epitope of DsRed in C57BL/6 mice. Mol Immunol. 2013;53(4):450-2
33. Lee IH, Kwon HK, An S, Kim D, Kim S, Yu MK. et al. Imageable Antigen-Presenting Gold Nanoparticle Vaccines for Effective Cancer Immunotherapy In Vivo. Angew Chem Int Edit. 2012;51(35):8800-5
Author contact
![]() Corresponding authors: Zhihong Zhang, czyzzhhust.edu.cn; Qingming Luo, qluohust.edu.cn. Address: Room G304, Britton Chance Center for Biomedical Photonics, Wuhan National Laboratory for Optoelectronics-Huazhong University of Science and Technology, Wuhan 430074, China. Fax: +86-27-87792034; Tel: +86-27-87792033; Zhihong Zhang (czyzzhhust.edu.cn) is the corresponding author for communication with the Editorial and Production offices.
Corresponding authors: Zhihong Zhang, czyzzhhust.edu.cn; Qingming Luo, qluohust.edu.cn. Address: Room G304, Britton Chance Center for Biomedical Photonics, Wuhan National Laboratory for Optoelectronics-Huazhong University of Science and Technology, Wuhan 430074, China. Fax: +86-27-87792034; Tel: +86-27-87792033; Zhihong Zhang (czyzzhhust.edu.cn) is the corresponding author for communication with the Editorial and Production offices.