Impact Factor
 Global reach, higher impact
Theranostics 2016; 6(3):291-301. doi:10.7150/thno.13728 This issue Cite
Research Paper
Quantitative Magnetic Particle Imaging Monitors the Transplantation, Biodistribution, and Clearance of Stem Cells In Vivo
Bo Zheng1, ![]() , Marc P. von See2, Elaine Yu1, Beliz Gunel1, Kuan Lu1, Tandis Vazin3,4, David V. Schaffer1,3,4, Patrick W. Goodwill1,5, Steven M. Conolly1,6
, Marc P. von See2, Elaine Yu1, Beliz Gunel1, Kuan Lu1, Tandis Vazin3,4, David V. Schaffer1,3,4, Patrick W. Goodwill1,5, Steven M. Conolly1,6
1. Department of Bioengineering, University of California at Berkeley, Berkeley, CA 94720, USA
2. Institute of Medical Technology, Hamburg University of Technology, Hamburg, Germany
3. Department of Chemical and Biomolecular Engineering, University of California at Berkeley, Berkeley, CA 94720, USA
4. Department of Molecular and Cell Biology, University of California at Berkeley, Berkeley, CA 94720, USA
5. Magnetic Insight, Inc., Newark, CA 94560, USA
6. Department of Electrical Engineering and Computer Science, University of California at Berkeley, Berkeley, CA 94720, USA
Received 2015-9-2; Accepted 2015-11-1; Published 2016-1-1
Abstract

Stem cell therapies have enormous potential for treating many debilitating diseases, including heart failure, stroke and traumatic brain injury. For maximal efficacy, these therapies require targeted cell delivery to specific tissues followed by successful cell engraftment. However, targeted delivery remains an open challenge. As one example, it is common for intravenous deliveries of mesenchymal stem cells (MSCs) to become entrapped in lung microvasculature instead of the target tissue. Hence, a robust, quantitative imaging method would be essential for developing efficacious cell therapies. Here we show that Magnetic Particle Imaging (MPI), a novel technique that directly images iron-oxide nanoparticle-tagged cells, can longitudinally monitor and quantify MSC administration in vivo. MPI offers near-ideal image contrast, depth penetration, and robustness; these properties make MPI both ultra-sensitive and linearly quantitative. Here, we imaged, for the first time, the dynamic trafficking of intravenous MSC administrations using MPI. Our results indicate that labeled MSC injections are immediately entrapped in lung tissue and then clear to the liver within one day, whereas standard iron oxide particle (Resovist) injections are immediately taken up by liver and spleen. Longitudinal MPI-CT imaging also indicated a clearance half-life of MSC iron oxide labels in the liver at 4.6 days. Finally, our ex vivo MPI biodistribution measurements of iron in liver, spleen, heart, and lungs after injection showed excellent agreement (R2 = 0.943) with measurements from induction coupled plasma spectrometry. These results demonstrate that MPI offers strong utility for noninvasively imaging and quantifying the systemic distribution of cell therapies and other therapeutic agents.
Keywords: Magnetic particle imaging, mesenchymal stem cells, cell therapy tracking, quantitative imaging
Introduction
Stem cell based therapies hold tremendous potential for treating debilitating diseases. Mesenchymal stem cells (MSCs), which are multipotent and are found in many tissue types, are of particular therapeutic interest because they can control inflammation and modify the proliferation and cytokine production of immune cells [1]. MSC-based therapies have shown promise for treating diseases such as stroke, graft versus host disease, myocardial infarction, traumatic brain injury, and cancer [1-3].
Intravenous injection is a common route for the delivery of MSCs in both animal models and clinical trials [3,4]. Until recently, it has been challenging to track the fate of these injected cells using standard molecular imaging technologies. As an example, it was recently discovered that more than 80% of MSCs injected intravenously are entrapped in pulmonary vasculature, leading to low delivery efficiency to target organs [1,5-8]. Even now, it remains difficult to noninvasively monitor the delivery and biodistribution of administered cells into target organs quantitatively and longitudinally without relying on behavioral endpoints or tissue histology [3,5,7]. Recent promising developments have focused on engineering MSCs for targeted delivery to specific sites, efforts that would also benefit from imaging technologies to monitor cell localization quantitatively and in real time [9,10].
Indeed, few, if any, existing tracer imaging modalities can quantitatively image injected cells with no depth penetration limitations over weeks- or months-long timescales [11]. Optical imaging techniques are limited in depth penetration and typically use genetically encoded reporters that are challenging for clinical translation [11]. Fluorescent and bioluminescent imaging are limited in their ability to image tracers deep in tissue, which prevents real-time dynamic cell tracking and quantification in the absence of a priori information about tracer depth and tissue optical parameters. Nuclear medicine is an exquisitely sensitive and high-contrast technique that images radioactive tracers, but faces limitations in tracer half-life and radioactive dose for longitudinal imaging [11] . Superparamagnetic iron oxide (SPIO) based T2* magnetic resonance imaging (MRI) has been successfully used clinically for cell tracking. However, due to the heterogenous nature of the tissue signal in MRI that is disrupted by SPIOs in T2* imaging (referred to as “negative contrast”), it remains difficult to achieve accurate quantitation, high image contrast, and reliable specificity for SPIOs [11]. It is particularly challenging to image SPIOs in the lung using MRI due to inherent field inhomogeneities in pulmonary tissue.
Fluorine (19F) MRI, which detects the nuclear magnetism of fluorine atoms, is an emerging positive-contrast imaging technique that has previously shown promise for cell-tracking applications [12,13]. However, it remains to be seen whether 19F MRI can be used for sensitive, whole-body cell tracking, particularly for organs near tissue-air susceptibility boundaries, such as lungs or the GI tract. Spectral Computed Tomography, also known as multicolor CT, is a new CT technique that can determine the energy of X-rays incident on the detector, making it useful for discriminating between different materials in the image [14,15]. The technique is still in development and may face challenges in cell tracking sensitivity and toxicity, but has already shown the capability to image atherosclerotic plaque in rodents with excellent contrast [14].
Magnetic particle imaging (MPI) [16-21], an imaging modality distinct from MRI, produces linearly quantitative images of iron oxide tagged cells, independent of depth. MPI offers significant advantages over existing stem cell tracking techniques, which are challenged by penetration, field inhomogeneity, and poor image contrast (Fig. 1). The SPIO tracers used in MPI are similar to those used in MRI and have been shown to be safe for both clinical use and cell labeling. Specifically, SPIO-labeled MSCs showed no decrease in cell viability, proliferation, or differentiation in previous MRI studies [22-25]. In addition to the safe SPIO tracer, MPI uses low frequency magnetic fields that are non-ionizing, making it a safe tool for clinical cell tracking applications.
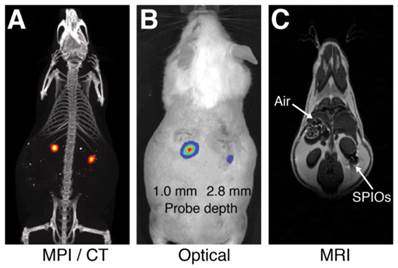
Comparison of MPI/CT, fluorescent imaging, and MRI in mouse. Two probes filled with a mixture of Nanomag-MIP SPIOs and Angiosense 680 EX fluorescent probe were implanted 1.0 mm and 2.8 mm below the dorsal skin surface of a mouse. (A) A representative MPI image visualizes SPIO tracer with high image contrast and no signal modulation by biological tissue. MPI: 5 × 3.75 × 10 cm FOV, 6.8 min scan. CT: 15 min scan, 184 μm isotropic resolution. (B) Fluorescent imaging of implanted probes shows a decrease in signal with tissue depth. Fluorescent imaging: 5 sec scan. (C) In MR images, the presence of SPIO tracer corresponds to a signal dropout similar to those generated at air-tissue interfaces. MRI: 4 × 8 cm FOV, 313 μm in-plane resolution, 17 min scan.
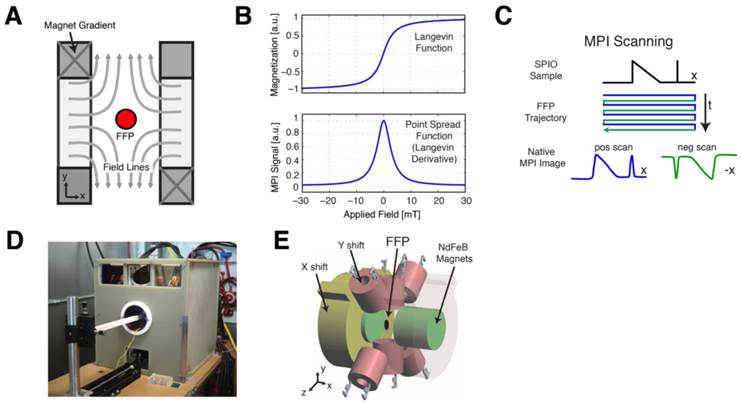
In MPI, a static magnetic gradient field, with a central field-free region (such as a field-free point, or FFP), is applied to the imaging field-of-view (FOV) (Fig. 2A). This gradient field saturates the nonlinear magnetization of all SPIO particles within the FOV except those at the field free point (Fig. 2B). To form a MPI image, the FFP is rastered across the 3D FOV using a combination of electromagnets (shown in Fig. 2D-E). MPI signals are generated when the FFP traverses a location containing SPIOs, causing the SPIO magnetization to respond by changing in magnitude and orientation [17]. This change in SPIO magnetization is detected via a receiver coil, and the resulting voltage signal can be assigned to the instantaneous FFP location to reconstruct the final MPI image. We note that the MPI signal is linear and shift-invariant (LSI) with respect to the SPIO tracer distribution, with a well-characterized point spread function that is simply the derivative of the SPIO magnetization curve (Fig. 2B-C) [17,21,26]. This point spread function can be modified to account for the relaxation times of large SPIOs that do not align instantaneously with the applied field in viscous media, such as in intracellular environments [27]. This SPIO relaxation in MPI is exhibited as an additional spatial blur in the reconstructed MPI image, but preserves the LSI properties of the MPI imaging process [27]. Since the MPI image intensity is LSI with respect to SPIO tracer concentrations, MPI images can be used to quantify the number of SPIOs or labeled cells within the imaging FOV.
MPI scanning process. (A) Opposing magnets form a gradient field with a central field-free region, labeled here as a field-free point (FFP). The FFP can be shifted using a series of electromagnets in a scan trajectory to cover the imaging volume. (B) The magnetization of SPIOs changes nonlinearly due to an externally applied magnetic field, which can be modeled using a Langevin function. The MPI point spread function (PSF) corresponds to the derivative of this Langevin function. (C) The traversal of the FFP across a spatially-varying SPIO distribution (shown in black) causes SPIO magnetization to change according to the Langevin curve. This change in SPIO magnetization induces a voltage signal in a detector coil, which can be assigned to the instantaneous FFP location for image reconstruction. (D-E) The prototype FFP MPI scanner used in this study has a 7 T/m magnetic gradient along the X direction and 3.5 T/m gradient along the Y and Z directions, which are generated using neodymium permanent magnets. The FFP can be shifted via electromagnets in the X and Y directions and a drive coil (not shown) in the Z direction.
Moreover, because biological tissues neither generate image contrast in MPI nor interfere with the low-frequency magnetization signals generated by SPIO tracers, MPI images exhibit extremely high image contrast, similar to PET or SPECT nuclear medicine scans. Figure 3A-B show a MPI and an optical scan of SPIO/fluorescent point sources in separate glass capillary tubes embedded at increasing depths in a tissue phantom. As is well characterized in literature [28,29], the fluorescent signal shows exponential signal loss with tissue depth. However, the MPI signal shows no significant dependence on surrounding tissue and hence may be clinically translatable for applications in molecular imaging.
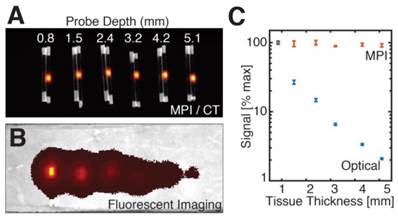
Quantitative comparison of MPI and fluorescent signal with tissue depth. Six pairs of equivalent SPIO and fluorescent probes in sealed capillary tubes were placed at various depths in a sectioned porcine muscle phantom. (A-B) Maximum intensity projection MPI/CT images show constant SPIO signal at various depths in tissue, but equivalently placed fluorescent probes show significant signal reduction with tissue depth. (C) Log plot of image signal with tissue depth for MPI and fluorescent imaging shows no significant dependence of MPI signal on tissue depth, but exponential decrease of optical signal with increasing tissue depth. MPI imaging (n = 3): 4 cm × 3.75 cm × 8 cm FOV, 5.3 min scan. Fluorescent imaging (n = 5): 2 second exposure, F/2, 675 and 720 nm excitation/emission filters. CT imaging: 25 min acquisition, 184 μm isotropic resolution.
In this study, we show for the first time the use of MPI to quantitatively track SPIO-labeled hMSCs in vivo with computed tomography (CT) coregistration. We intravenously administered SPIO-labeled hMSCs in rat and monitored the injections and the dynamic in vivo distribution of the hMSCs using MPI over a period of 12 days. We also used the longitudinal MPI signal to quantify SPIO tracer clearance from the body after injection. Finally, SPIO biodistribution in lung, liver, heart, and spleen were determined postmortem via MPI imaging and compared to induction-coupled plasma spectrometry as a reference standard.
Methods
Comparison of MPI, fluorescent, and MRI tracer imaging in postmortem mouse
A 12-week old CD-1 female mouse was sacrificed via CO2 inhalation and cervical dislocation. Post-sacrifice, sealed polyethylene tubes containing a 2 μL mixture of 120 pmol Angiosense 680 EX fluorescent tracer (PerkinElmer, Waltham, MA) and 20 nmol Nanomag-MIP SPIOs (micromod, Rostock, Germany) were implanted 1.0 mm and 2.8 mm below the dorsal skin surface for imaging. Fluorescent imaging was performed on IVIS Spectrum (PerkinElmer) using 5 second scan time, F/2, and excitation/emission filters at 675 and 720 nm, respectively. CT imaging was performed on a RS9-80 Micro CT scanner (General Electric) with 15 min scan time and 184 μm isotropic resolution. MR imaging was performed on a Bruker PharmaScan 7T scanner using a multi-slice multi-echo sequence with 4 × 8 cm FOV and 313 μm in-plane resolution, 10 slices total with 0.5 mm slice thickness, and 17 minute scan time. MPI imaging was performed using a custom 7 T/m field-free point MPI scanner with 40 mTpp drive field, 5 × 3.75 × 10 cm FOV, and 6.8 min acquisition.
MPI and fluorescent imaging of a porcine tissue phantom
All MPI studies in this work are performed on a 3D MPI scanner with a 7 T/m magnetic field gradient, a drive field at 40 mTpp amplitude, and 20.05 kHz drive frequency [30]. MPI images were reconstructed using an x-space MPI reconstruction algorithm [17,21,26] and windowed at 10% full scale. All data acquisition, control, and data processing were performed using custom MATLAB software (Mathworks, Natick, MA) controlling National Instruments DAQ modules (NI PICe-6363, Austin, TX).
To quantitatively assess MPI performance in deep tissue imaging for larger tissue volumes, we designed a phantom comprised of layered fresh porcine muscle. Six pairs of MPI and fluorescent probes in sealed glass capillary tubes were placed within the tissue phantom at depths of 0.8 mm, 1.5 mm, 2.4 mm, 3.2 mm, 4.2 mm, and 5.1 mm from the phantom surface, spaced approximately 1 cm apart laterally. MPI probes were comprised of 2 μL undiluted Nanomag-MIP SPIOs at 25 mg Fe/mL concentration. Fluorescent probes were 160 pmol reconstituted Angiosense 680EX in 2 μL deionized water solution. MPI imaging was performed in triplicate in a 5.3 min scan with 4 × 3.75 × 8 cm FOV. Fluorescent imaging was performed (n = 5) on IVIS Spectrum with 2 second exposure, F/2, and excitation/emission filters at 675 and 720nm. For probe localization and confirmation of tube depth, a reference CT scan was performed (GE RS9-80 CT, 25 min acquisition, 184 μm isotropic resolution).
Resovist labeling of hMSCs
Bone marrow-derived human mesenchymal stem cells (ATCC PCS-500-012) were seeded at initial density of 5000 cells per cm² in 5 mL of complete growth medium (ATCC PCS-500-041). The seeded culture flasks were incubated at 37°C with 5% CO2. At 70%-90% confluence, cell cultures were passaged into new culture flasks using 0.05%-trypsin-EDTA to detach cell monolayer from flask surface and trypsin neutralizing solution (ATCC PCS-999-004) to stop the trypsin digestion of cells. Dissociated cells were centrifuged for 3 minutes at 1500 rpm for collection, counted using a hemocytometer, and reseeded at initial growth conditions. All cell counting was performed using a hemocytometer and averaged (n=5).
Resovist superparamagnetic iron oxide particles (Bayer Healthcare, Germany; 0.5 mmol Fe/mL) were used for cell labeling using methodology similar to previous studies [24,25]. Resovist is a MRI contrast agent intended for the detection and characterization of small liver lesions [22]. Resovist agent was added to growth medium in culture flasks containing adherent cells with a confluency of 50% to 80% to achieve desired Fe concentration. Cells were incubated with the Resovist solution for 24 hours. After labeling, cultures were washed twice with PBS to remove remaining free and surface-bound Resovist particles. Cells were trypsinized, centrifuged, resuspended in PBS and kept on ice no longer than 2 hours before injection.
Determination of hMSC iron labeling efficiency, loading content, and viability
To determine SPIO labeling efficiency, cells were cultured in a 24-well plate containing 6 samples each for the following 4 Fe labeling concentrations: 0 µg Fe/mL, 20 µg Fe/mL, 30 µg Fe/mL and 40 µg Fe/mL. Iron-labeled cells were visualized using a Prussian blue (PB) cell staining kit (Ocean NanoTech, Springdale, AR). Prussian blue-labeled cells were counted manually using a microscope to determine average cell labeling efficiency.
hMSC iron loading was determined by MPI imaging and by ICP-OES (induction-coupled plasma optical emission spectrometry, Optima 5300 DV, PerkinElmer, Waltham, MA). Cells were cultured and labeled with Resovist as above with Fe concentrations of 20 µg Fe/mL, 30 µg Fe/mL and 40 µg Fe/mL in the incubation media. For MPI measurement of intracellular iron, a calibration curve was generated using the total MPI image signal from 3 samples each of 5, 10, and 15 mM Resovist in 100 µL PBS solution. This calibration curve was used to estimate the iron content in MPI images from 3 hMSC samples at each Resovist labeling concentration, containing respectively 121×103 ± 19×103 cells/sample, 121×103 ± 13×103 cells/sample, and 135×103 ± 52×103 cells/sample. For ICP measurements, the hMSC samples, along with 3 samples of 1 µL undiluted Resovist in 100 µL PBS solution, were digested using a mixture of 1 mL 70% nitric acid (Fisher A509P500) and 300 µL 30% hydrogen peroxide (Ricca 3821.7-16) overnight at room temperature and subsequently diluted to 30 mL using deionized water. A linear regression line was created with Fe standard solutions at concentrations of 0, 10, 100, 1000 ng Fe/mL. ICP analysis was performed in triplicate to determine cellular iron as mean ± SD in picograms of iron per cell.
For assessment of cell viability after SPIO labeling, cells labeled using 0 µg Fe/mL, 20 µg Fe/mL, 30 µg Fe/mL and 40 µg Fe/mL Resovist were harvested and resuspended in a solution of 93.5% basal media and 6.5% FBS and pipetted into a 96-well-plate for assessment. A blank group contained only the basal media / FBS solution with no cells. For each group, three samples were separately cultured, labeled, resuspended and transferred into the 96-well-plate. An MTT-based In Vitro Toxicology Assay Kit (Sigma Aldrich, Saint Louis, MO) was applied to the five different groups with three samples each. One vial of MTT powder was dissolved in 3 mL of basal media / FBS. Reconstituted MTT in an amount equal to 10% of the culture medium volume was added. Cultures were returned to the incubator for 4 hours. After incubation, the resulting formazan crystals were dissolved by adding an amount of MTT solubilization solution equal to the original culture medium volume of 150 µL per well and shaken gently. After about 30 minutes, the samples were transferred to a multiplate reader. The absorbance of the solution was measured at 570 nm and 650 nm after 15 and 30 minutes. Comparisons in viability between groups were performed using analysis of variance and Bonferroni Post-Hoc test for multi-pair comparisons. Differences were considered significant at p < 0.05.
Animal Procedures
All animal procedures were approved by the Animal Care and Use Committee at UC Berkeley and conducted according to the National Research Council's Guide for the Care and Use of Laboratory Animals. Immunocompetent 7-week old female Fischer 344 rats weighing approximately 130 g and a 12-week old CD-1 female mouse weighing approximately 40 g were used for MPI imaging. Animals were fed on a diet of Teklad Rodent Diet 2018 (Harlan, Indianapolis, IL) ad libitum.
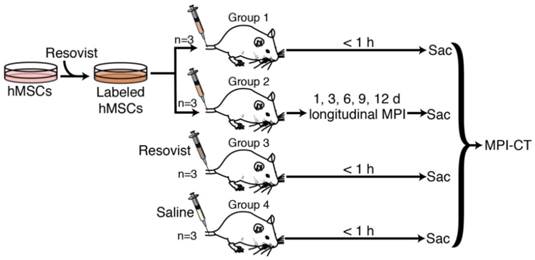
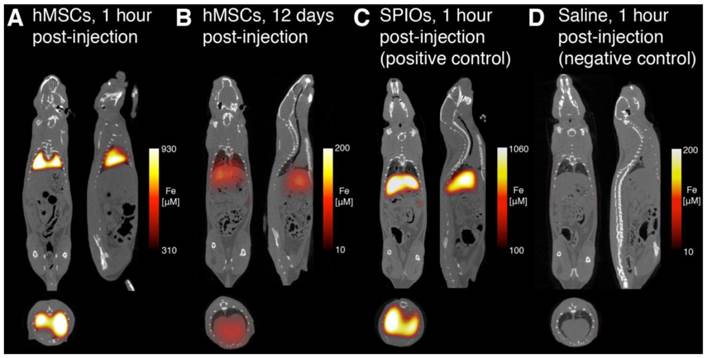
Briefly, four groups of rats (Fig. 4) anesthetized under isoflurane (4% for induction and 2% for maintenance, 1.5 L/min flow) received tail vein injections of 5×10⁶ to 8×10⁶ Resovist-labeled hMSCs in 1 mL PBS (n=3, Groups 1 and 2) [5,8], 100 µL Resovist stock solution diluted to 1 mL in PBS (n=3, Group 3), or 1 mL isotonic saline solution (n=3, Group 4). hMSCs used for animal injections were labeled with 40 µg Fe /mL of Resovist in cell culture solution. The administered cell numbers are similar to previously published data [3,7,8,31,32] and are well below lethal or adverse event-inducing dose limits in animal and human studies [33]. Animals in Group 1, 3, and 4 were sacrificed via isoflurane overdose within one hour of injection for postmortem MPI and CT imaging. Animals in Group 2 were monitored and imaged in vivo using MPI at 1, 3, 6, and 9 days post-injection, and sacrificed via isoflurane overdose for MPI and CT imaging 12 days post-injection.
In vivo MPI experimental protocol. 4 groups of 3 rats each were used in this study. Groups 1 and 2 received tail vein injections of 5×10⁶ to 8×10⁶ Resovist-labeled mesenchymal stem cells. Group 3 received an equivalent tail vein injection of Resovist alone, and Group 4 received a tail vein injection of isotonic saline. Groups 1, 3, and 4 were sacrificed within one hour of injection and imaged using MPI and CT, while Group 2 was imaged in vivo using MPI over 12 days after injection, followed by sacrifice and MPI-CT imaging. Post-sacrifice, all animals were dissected and the liver, lungs, heart, and spleen were excised for MPI imaging and iron distribution analysis.
Animal MPI Imaging
For in vivo small animal MPI imaging, animals were placed in a 7 T/m FFP MPI scanner under isoflurane anesthesia (2%, 1.5 L/min) using a custom animal bed. In vivo and postmortem MPI scans were conducted using a 4 × 3.75 × 10 cm FOV in a 9 minute acquisition. All animal MPI imaging was performed in quadruplicate. Anatomic CT reference images were also acquired (RS9-80 CT, 25 min acquisition, 184 μm isotropic resolution), and MPI-CT 3D images were co-registered with Osirix Imaging Software (Pixmeo SARL, Switzerland) visually using SPIO-glass fiducial markers.
To estimate SPIO tracer quantity from MPI images, a standard curve of iron quantity to volumetric MPI signal was created using MPI scans of 1, 2, 3, and 100 µL Resovist tracer. To determine iron clearance half-life from hMSC injections in Group 2, an exponential regression fit was applied to the total in vivo longitudinal MPI signal, and the line-of-best-fit and 95% confidence intervals were determined.
MPI biodistribution studies
For assessment of SPIO biodistribution using MPI, all animals from all groups were dissected post-sacrifice and the liver, spleen, heart, and lungs were harvested. The organs were imaged in quadruplicate using MPI, with 4 × 3.75 × 10 cm FOV and 9 minute acquisition time as before. SPIO biodistribution was determined in μg as mean ± s.d. using a calibration curve, as previously described, and the volumetric MPI signal in each organ.
ICP biodistribution studies
For validation of MPI biodistribution results, an ICP analysis on the excised organs was carried out by Analytical Resources Incorporated (Tukwila, WA) using sample preparation method 3050B and analysis method 6010C to determine iron content as mg/kg multiplied by organ mass. To compensate for physiologic background iron in ICP analyses, ICP-measured iron for each organ was subtracted by mean physiologic iron content from organs of age-matched, saline-injected animals in Group 4. A linear correlation, 95% confidence intervals, and correlation coefficient were determined for ICP- and MPI-measured iron for all harvested organs.
Results
Comparison of MPI with fluorescent imaging and MRI
To compare the image contrast and depth attenuation of MPI with standard fluorescent and MR imaging techniques, we imaged two probes filled with a mixture of Nanomag-MIP SPIOs and Angiosense 680 EX fluorescent probe, implanted 1.0 mm and 2.8 mm below the dorsal surface of a mouse. Figure 1 shows representative MPI/CT, fluorescent, and MR images of the tracers. In MPI, the SPIO tracer can be visualized with high image contrast and no signal modulation by biological tissue. In fluorescent images, implanted optical probes shows a decrease in signal with tissue depth. In MR images, the presence of SPIO tracer corresponds to a signal dropout similar to those generated at air-tissue interfaces, making it challenging to identify the presence of SPIOs with high specificity.
In Figure 3, we compared the signal intensity of MPI and fluorescent imaging for tracers embedded deeply in tissue, using six equivalent SPIO and fluorescent probes in sealed capillary tubes placed at increasing depths in a sectioned porcine muscle phantom. Our results indicate that while the MPI signal remains constant for probes located at all tissue depths, equivalently placed fluorescent probes show exponential signal reduction with tissue depth.
hMSC labeling efficiency, SPIO uptake, and cytotoxicity
We generated SPIO-labeled hMSCs using a modified standard cell-labeling protocol [23-25]. Figure 5A shows Prussian blue-stained hMSC cell cultures labeled with 0, 20, 30, and 40 μg Fe/mL Resovist labeling concentration, and, in contrast, a control group labeled using 0 μg Fe/ml indicates little to no visible PB staining. Between 90-95% cells were labeled at 20 μg Fe/mL labeling concentration, while 95-100% cells were labeled at 30 and 40 μg Fe/mL labeling concentrations.
hMSC labeling using Resovist SPIO tracer. (A) Prussian blue staining of hMSCs labeled with four Resovist labeling concentrations ranging from 0 to 40 μg Fe / mL. Cells labeled with 40 μg Fe / mL Resovist show around 90-95% labeling efficiency with no differences in cell morphology. Scale bars: 100 μm. (B) An MTT-based cell viability assay shows no significant differences in cell viability between unlabeled and labeled hMSC populations.
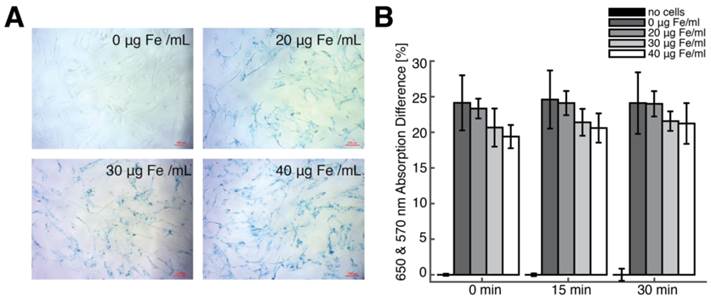
We then performed MPI imaging and ICP-OES to determine intracellular iron uptake in labeled hMSCs. For hMSC populations (n = 3) labeled using 20, 30, and 40 μg Fe/mL Resovist labeling concentrations respectively, MPI imaging indicated iron uptake of 50.8 ± 12.0, 55.8 ± 10.9, and 85.7 ± 20.7 pg Fe/cell, and ICP analysis showed good agreement with MPI measurements (R2 = 0.89) with intracellular iron measurements of 44.2 ± 11.1, 53.9 ± 11.8, and 77.8 ± 23.3 pg Fe/cell. These intracellular uptake values are in agreement with published data for Resovist labeling of MSCs [23-25,34,35]. An MTT viability assay showed no significant difference in cell viability between unlabeled and labeled hMSC populations (Fig. 5B).
In vivo and postmortem MPI studies
We next asked whether MPI can be used to visualize the fate of intravascular hMSC injections in vivo. Previous studies on intravenous delivery of MSCs have shown that the majority of injected MSCs become entrapped in pulmonary vasculature during first passage, followed by clearance to liver within 1-2 days [1,7,8,32,36,37]. However, these prior studies did not provide longitudinal quantification of cell localization and tissue biodistribution. To visualize and quantify the dynamics and biodistribution of intravascular hMSC injections using MPI, four groups (n=3 each) of Fischer 344 rats were injected with 5×10⁶ to 8×10⁶ Resovist-labeled hMSCs labeled using 40 µg/mL Resovist solution (Groups 1 and 2), 100 µL Resovist (Group 3), or 1 mL isotonic saline solution (Group 4) via the tail vein. Groups 1, 3, and 4 were imaged within 1 hour of injection, while longitudinal in vivo MPI imaging was performed on Group 2 up to 12 days post-injection.
Figure 6 shows representative MPI-CT images after intravenous injection. MPI images of animals receiving labeled hMSC injections showed high SPIO content in the lungs immediately after injection (Fig. 6A). In those animals, we measured up to 930 µM iron concentration in the lungs, corresponding to approximately 52 ng Fe/mm3 in lung tissue. At 12 days post-injection (Fig. 6B), MPI imaging indicates a significant decrease in total iron content, along with the relocation of the majority of the signal to liver. In stark contrast, and consistent with reports of Resovist distribution following systemic administration, animals receiving Resovist-only injections showed immediate uptake of SPIOs in liver tissue (Fig. 6C) [22]. There was no detectable MPI signal in animals receiving saline-only injections (Fig. 6D).
MPI-CT imaging of intravenously injected hMSCs, Resovist, and saline control, with representative coronal, sagittal, and axial slices shown from full 3D MPI datasets. (A) MPI imaging of hMSC tail vein injections less than one hour post-injection shows substantial hMSC localization to lung. (B) At 12 days, hMSC tail vein injections show significant total clearance and liver migration. (C) MPI imaging of Resovist-only tail vein injections less than one hour post-injection shows immediate SPIO uptake in liver and spleen. (D) Control injections of isotonic saline show no detectable MPI signal. MPI imaging (n = 4 for each animal): 4 × 3.75 × 10 cm FOV, 9 minute acquisition. CT imaging: 25 minute acquisition, 184 μm isotropic resolution.
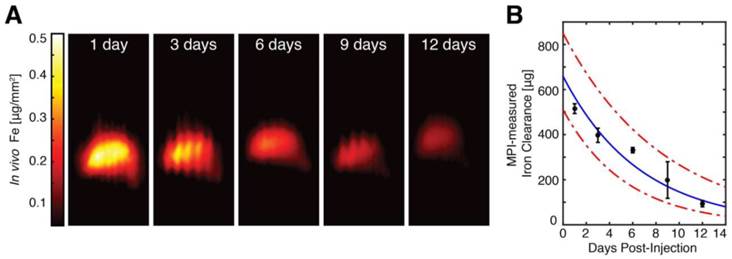
To monitor the in vivo distribution and clearance of Resovist-labeled hMSCs, we imaged anesthetized hMSC-injected animals using MPI at 1, 3, 6, and 9 days post-injection. Quantitative MPI images (Fig. 7) show redistribution of hMSCs to the liver as early as 24 hours after injection. Our observation of the rapid trafficking of intravascularly injected MSCs to the liver agrees with previous dynamic imaging studies of in vivo MSC injections [1,6-8,32,37]. In vivo MPI showed a gradual decay in liver SPIO signal over time, with a measured clearance half-life of 4.6 days and 95% confidence intervals at 3.7 and 6.0 days. We note that the longitudinal liver MPI imaging was performed here in the absence of respiratory and cardiac gating, leading to benign image undulation artifacts due to physiologic respiration, which can be seen most prominently in MPI images at 3 and 9 days post-injection in Fig. 7A. We also note these image artifacts do not appear in postmortem imaging and that the respiration-gated MPI acquisition may be implemented, similar to gating in nuclear medicine [38].
MPI quantification of in vivo SPIO clearance from hMSC injections. (A) In vivo MPI monitoring of intravenous hMSC injections (shown here as coronal summed intensity projections) shows gradual clearance from liver tissue from 1 day post-injection to 12 days post-injection. In vivo MPI imaging also shows benign respiratory motion artifacts (seen most prominently at 3 and 9 days post-injections), which do not affect MPI quantification and can be removed via the use of respiratory gating. MPI imaging (N = 3 animals, 2 MPI scans per time-point per animal): 4 × 3.75 × 10 cm FOV, 9 minute acquisition. (B) MPI measurements of in vivo iron clearance from labeled hMSC injections indicate in vivo clearance half-life at 4.6 days, with 95% confidence intervals at 3.7 and 6.0 days.
MPI biodistribution studies
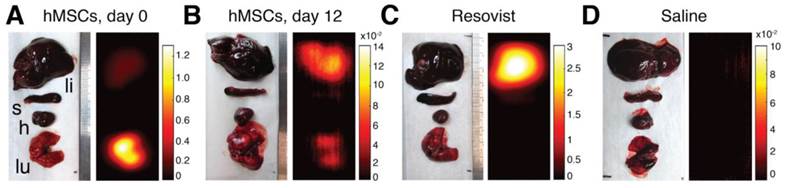
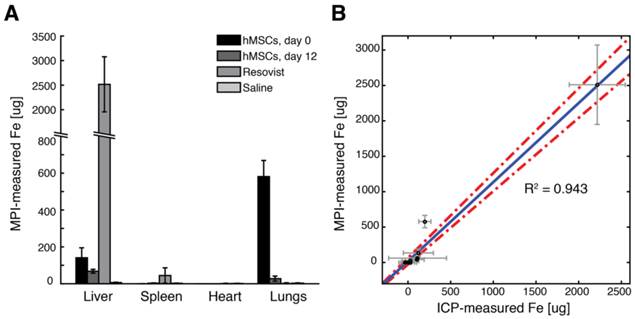
As a validation of the ability of MPI to quantify tracer biodistribution, we performed ex vivo MPI imaging of excised liver, spleen, heart, and lungs. Representative MPI biodistribution images from each experimental group are shown in Figure 8. Fig. 8A shows that hMSCs injections overwhelmingly localize to lung tissue upon injection, but are mostly cleared into liver over time (Fig. 8B). In contrast, injected Resovist was immediately taken up by liver and partially in the spleen (Fig. 8C). No MPI signal was detected for saline-only injections (Fig. 8D).
MPI analysis of postmortem SPIO biodistribution. MPI analysis of SPIO biodistribution for all groups was performed on liver, spleen, heart, and lung organs harvested postmortem. (A) MPI imaging of intravenous hMSC injections indicate localization of cells to lung tissue within one hour of injection. (B) 12 days after hMSC injection, MPI imaging shows substantial SPIO clearance and signal migration to liver and spleen. (C-D) Resovist SPIO intravenous injections localize immediately to liver and spleen, while no detectable MPI signal is found for control saline injections. The abbreviations li, s, h, and lu refer respectively to liver, spleen, heart, and lung. MPI imaging (n = 4 scans per animal): 4 × 3.75 × 10 cm FOV, 9 minute acquisition. All units are in µg Fe / mm2.
To validate MPI measurements of SPIO biodistribution, we performed ICP analysis for iron content in excised organs. The biodistribution of SPIOs after injection for each experimental group, as measured from MPI imaging, is shown in Fig. 9A. For ICP iron measurements, we noted remarkable variations in measured SPIO content in the liver and spleen, presumably due to the variability of physiologic background iron content in those tissues. Nonetheless, a linear regression of ICP and MPI-measured iron content in excised organs (Fig. 9B) shows excellent agreement between MPI and ICP-measured iron content in tissue (R2 = 0.943, 95% confidence intervals shown for linear regression).
Comparison of MPI-measured SPIO biodistribution to induction-coupled plasma spectrometry. (A) MPI-measured SPIO biodistribution for each experimental group. (B) A scatterplot of MPI and ICP-measured iron content in each organ for each experimental group shows high correlation (R2 = 0.943, 95% linear confidence intervals shown). Data points are mean ± s.d. for both MPI and ICP measurements for each organ for each experimental group (n = 3 animals each).
Discussion
In this study, we demonstrated the first use of magnetic particle imaging to track and quantify intravenous administrations of human mesenchymal stem cells and SPIO tracer in rats. MPI-CT imaging visualized the in vivo dynamic biodistribution of the SPIO tracer with excellent contrast and sensitivity, noninvasively confirming that injected MSCs are rapidly entrapped in lung microvasculature and are mostly cleared to the liver within one day [1,5,7,36]. MPI's linear quantitation and ability to image SPIOs longitudinally also enabled a noninvasive measurement of tracer clearance from the body. Here we measured a 4.6-day clearance half life for the SPIO label by the liver after intravenous injection, which is similar to previous findings [39]. As most intravenously injected MSCs trafficked to liver are not viable [1,6], MPI signal found in the liver in this study is likely due to SPIO labels from apoptotic cells. Our findings suggest that, to avoid significant loss of therapeutic MSC injections due to lung and liver entrapment, a better approach would be to administer MSCs arterially or directly in target tissue to improve targeted delivery of MSC-based therapies. However, for acute lung injury, the entrapment of intravenous MSC administrations in lung may be beneficial in triggering production of reparative growth factors and have an anti-inflammatory therapeutic effect [40,41]. In all cases, noninvasive monitoring of the location and clearance of cell injections is of vital importance for a more comprehensive understanding of the dynamic response of MSC therapies.
MPI has unique quantitative accuracy and high image contrast that enables it to monitor the delivery and localization of cell therapies longitudinally. Although the MPI signal is generated by the nonlinear Langevin magnetization of SPIOs, it is linear and shift invariant with respect to the number and location of SPIOs. Importantly, no biological tissue exhibits similar superparamagnetic behavior that could produce interfering MPI signals, enabling high image contrast and sensitivity to SPIO tracers. As a result, the image contrast and sensitivity in MPI can be extremely high, comparable to those of nuclear medicine, but with high tracer half-life and without the use of ionizing radiation.
As with other cell tracking techniques that directly label cells using SPIOs or other tracers, one challenge in MPI for cell tracking is in quantifying administrations of highly proliferative or apoptotic cells that may lose SPIO labels during cell division or apoptosis [11]. It is debatable whether the use of highly proliferative or undifferentiated cells is clinically feasible due to the increased risk for teratogenesis, and most clinical cell tracking studies have used differentiated adult progenitor cell models [11]. Nonetheless, several groups have attempted to engineer genetically encoded reporters for intracellular SPIO synthesis, but such approaches may incur a cost in clinical translatability and safety [13,42]. A similar challenge for all direct labeling imaging techniques, including MPI, is the determination of cell viability in vivo, as the label in dead cells may be endocytosed by resident macrophages [11], leading to false positives in image contrast. One approach to resolving the challenge of determining the viability of implanted cells in MPI imaging may be the use of relaxation and aggregation-based SPIO contrast mechanisms for color-contrast MPI, which our group and others have recently demonstrated [43,44]. Another challenge for MPI stem cell imaging is that the MPI signal decreases over time in vivo as the SPIO tracers are degraded by the mononuclear phagocyte system, including liver and spleen. Hence, the quantification of SPIOs in tissues involved in iron degradation for longitudinal MPI applications must account for biological iron clearance in these tissues. For long-term imaging applications, however, there may be strategies to design magnetic nanoparticles with exceptionally long biological clearance times [45].
The spatial resolution of the 7 T/m MPI scanner used in the current study was around 1.5 mm full-width at half-maximum, which exceeds the spatial resolution of SPECT imaging and is comparable to preclinical PET imaging [11]. Many opportunities exist to further improve MPI spatial resolution, including the use of a field-free line instead of a field-free point [18] and the use of projection reconstruction MPI imaging, which has been shown to further improve spatial resolution by 50% [46]. Moreover, spatial resolution in MPI scales linearly with the applied magnetic field gradient [19,21]. Our group has been working to develop a 6.3 T/m projection MPI scanner [47], which is expected to have a 3D MPI resolution of 600 µm using tailored SPIOs for MPI [48]. We further note that the detection sensitivity of MPI has not yet been fully optimized. In our present systems, the dominant noise source is the detector preamplifier, which may be further improved by 1-2 orders of magnitude with optimal noise matching and detector coil design [20,49].
The high SNR and contrast afforded by MPI imaging may enable clinical applications beyond dynamic cell tracking and biodistribution analysis. The MPI images presented here of MSCs in the rat pulmonary microvasculature has implications for clinical MPI perfusion imaging applications. As an example, the ventilation/perfusion (V/Q) nuclear lung scan is a standard technique for diagnosing pulmonary perfusion disorders such as pulmonary embolism. In V/Q perfusion scans, a radionuclide tag is conjugated to aggregated albumin proteins 100 µm in size, injected intravenously to the patient, and imaged via gamma camera or SPECT to determine radionuclide distribution and to infer perfusion defects in the lung microvasculature [50]. Pulmonary ventilation scans are performed similarly using inhaled radioactive aerosols or gases. Our results with SPIO-labeled MSCs here suggest that MPI may be applied for lung perfusion and ventilation imaging using SPIOs conjugated to macro-aggregated albumin particles or as aerosolized SPIOs [51]. MPI V/Q imaging may enable higher resolution scans with no radiation dose. Finally, MPI could enable further theranostic applications, including simultaneous imaging and delivery guidance of inhaled aerosols for the treatment of respiratory disorders [52].
In conclusion, we have shown the use of magnetic particle imaging to dynamically track the systemic administration of human mesenchymal stem cells labeled using superparamagnetic iron oxides. Here we visualized the entrapment of MSCs in lung tissue and quantified the clearance and biodistribution of hMSCs over a 12-day period. Among existing available molecular imaging modalities, MPI shows a unique combination of high sensitivity, quantitative accuracy, and longitudinal monitoring that may accelerate the development of clinical cell therapies.
Abbreviations
MSC: mesenchymal stem cell; MPI: magnetic particle imaging; SPIO: superparamagnetic iron oxide; MRI: magnetic resonance imaging; CT: computed tomography; FFP: field-free point; PSF: point spread function; FOV: field of view; PBS: phosphate buffered saline; V/Q: ventilation/perfusion; LSI: linearity and shift-invariance; ICP-OES: Induction-coupled plasma optical emission spectroscopy.
Acknowledgements
The authors would like to thank Paul Keselman and Dr. Mike Wendland for MRI and CT assistance, and Analytical Resources Incorporated for ICP analysis. We gratefully acknowledge funding from Siebel Scholars Foundation, NIH R01 EB013689, CIRM RT2-01893, Keck Foundation 009323, NIH 1R24 MH106053 and NIH 1R01 EB019458, and ACTG 037829.
Competing Interests
Drs. Conolly and Goodwill are founders and stockholders in Magnetic Insight Inc. Dr. Goodwill is an employee of the company. All other authors declare no conflicts of interest.
References
1. Eggenhofer E, Luk F, Dahlke MH, Hoogduijn MJ. The life and fate of mesenchymal stem cells. Front Immunol. 2014;5:1-6
2. Hoogduijn MJ, Roemeling-van Rhijn M, Engela AU, Korevaar SS, Mensah FKF, Franquesa M. et al. Mesenchymal stem cells induce an inflammatory response after intravenous infusion. Stem Cells Dev. 2013;22:2825-35
3. Harting MT, Jimenez F, Xue H, Fischer UM, Baumgartner J, Dash PK. et al. Intravenous mesenchymal stem cell therapy for traumatic brain injury. J Neurosurg. 2009;110:1189-97
4. Wu Y, Zhao RCH. The role of chemokines in mesenchymal stem cell homing to myocardium. Stem Cell Rev. 2012;8:243-50
5. Ge J, Guo L, Wang S, Zhang Y, Cai T, Zhao RCH. et al. The Size of Mesenchymal Stem Cells is a Significant Cause of Vascular Obstructions and Stroke. Stem Cell Reviews and Reports. 2014;10:295-303
6. Eggenhofer E, Benseler V, Kroemer A, Popp FC, Geissler EK, Schlitt HJ. et al. Mesenchymal stem cells are short-lived and do not migrate beyond the lungs after intravenous infusion. Front Immunol. 2012;3:297
7. Fischer UM, Harting MT, Jimenez F, Monzon-Posadas WO, Xue H, Savitz SI. et al. Pulmonary passage is a major obstacle for intravenous stem cell delivery: the pulmonary first-pass effect. Stem Cells Dev. 2009;18:683-92
8. Gao J, Dennis JE, Muzic RF, Lundberg M, Caplan AI. The dynamic in vivo distribution of bone marrow-derived mesenchymal stem cells after infusion. Cells Tissues Organs. 2001;169:12-20
9. Karp JM, Leng Teo GS. Mesenchymal stem cell homing: the devil is in the details. Cell Stem Cell. 2009;4:206-16
10. Sarkar D, Spencer JA, Phillips JA, Zhao W, Schafer S, Spelke DP. et al. Engineered cell homing. Blood. 2011;118:e184-91
11. Nguyen PK, Riegler J, Wu JC. Stem cell imaging: from bench to bedside. Cell Stem Cell. 2014;14:431-44
12. Hitchens TK, Liu L, Foley LM, Simplaceanu V, Ahrens ET, Ho C. Combining perfluorocarbon and superparamagnetic iron-oxide cell labeling for improved and expanded applications of cellular MRI. Magn Reson Med. 2014 doi:10.1002/mrm.25120
13. Ahrens ET, Bulte JWM. Tracking immune cells in vivo using magnetic resonance imaging. Nat Rev Immunol. 2013;13:755-63
14. Cormode DP, Naha PC, Fayad ZA. Nanoparticle contrast agents for computed tomography: a focus on micelles. Contrast Media Mol Imaging. 2014;9:37-52
15. Schlomka JP, Roessl E, Dorscheid R, Dill S, Martens G, Istel T. et al. Experimental feasibility of multi-energy photon-counting K-edge imaging in pre-clinical computed tomography. Phys Med Biol. 2008;53:4031-47
16. Gleich B, Weizenecker J. Tomographic imaging using the nonlinear response of magnetic particles. Nature. 2005;435:1214-7
17. Goodwill PW, Conolly SM. Multidimensional x-space magnetic particle imaging. IEEE Trans Med Imaging. 2011;30:1581-90
18. Goodwill PW, Konkle JJ, Zheng B, Saritas EU, Conolly SM. Projection x-space magnetic particle imaging. IEEE Trans Med Imaging. 2012;31:1076-85
19. Rahmer J, Weizenecker J, Gleich B, Borgert J. Signal encoding in magnetic particle imaging: properties of the system function. BMC Med Imaging. 2009;9:4
20. Zheng B, Vazin T, Goodwill PW, Conway A, Verma A, Ulku Saritas E. et al. Magnetic Particle Imaging tracks the long-term fate of in vivo neural cell implants with high image contrast. Sci Rep. 2015;5:14055
21. Goodwill PW, Conolly SM. The X-space formulation of the magnetic particle imaging process: 1-D signal, resolution, bandwidth, SNR, SAR, and magnetostimulation. IEEE Trans Med Imaging. 2010;29:1851-9
22. Reimer P, Balzer T. Ferucarbotran (Resovist): a new clinically approved RES-specific contrast agent for contrast-enhanced MRI of the liver: properties, clinical development, and applications. Eur Radiol. 2003;13:1266-76
23. Schäfer R, Kehlbach R, Wiskirchen J, Bantleon R, Pintaske J, Brehm BR. et al. Transferrin receptor upregulation: in vitro labeling of rat mesenchymal stem cells with superparamagnetic iron oxide. Radiology. 2007;244:514-23
24. Hsiao JK, Tai MF, Chu HH, Chen ST, Li H, Lai DM. et al. Magnetic nanoparticle labeling of mesenchymal stem cells without transfection agent: Cellular behavior and capability of detection with clinical 1.5 T magnetic resonance at the single cell level. Magn Reson Med. 2007;58:717-24
25. Kim HS, Oh SY, Joo HJ, Son K-R, Song I-C, Moon WK. The effects of clinically used MRI contrast agents on the biological properties of human mesenchymal stem cells. NMR Biomed. 2010;23:514-22
26. Lu K, Goodwill PW, Saritas EU, Zheng B, Conolly SM. Linearity and shift invariance for quantitative magnetic particle imaging. IEEE Trans Med Imaging. 2013;32:1565-75
27. Croft LR, Goodwill PW, Conolly SM. Relaxation in x-space magnetic particle imaging. IEEE Trans Med Imaging. 2012;31:2335-42
28. Ntziachristos V, Ripoll J, Wang LV, Weissleder R. Looking and listening to light: the evolution of whole-body photonic imaging. Nat Biotechnol. 2005;23:313-20
29. Grabtchak S, Montgomery LG, Whelan WM. Optical absorption and scattering properties of bulk porcine muscle phantoms from interstitial radiance measurements in 650-900 nm range. Phys Med Biol. 2014;59:2431-44
30. Saritas EU, Goodwill PW, Croft LR, Konkle JJ, Lu K, Zheng B. et al. Magnetic particle imaging (MPI) for NMR and MRI researchers. J Magn Reson. 2013;229:116-26
31. Kidd S, Spaeth E, Dembinski JL, Dietrich M, Watson K, Klopp A. et al. Direct evidence of mesenchymal stem cell tropism for tumor and wounding microenvironments using in vivo bioluminescent imaging. Stem Cells. 2009;27:2614-23
32. Kraitchman DL, Tatsumi M, Gilson WD, Ishimori T, Kedziorek D, Walczak P. et al. Dynamic imaging of allogeneic mesenchymal stem cells trafficking to myocardial infarction. Circulation. 2005;112:1451-61
33. Ra JC, Shin IS, Kim SH, Kang SK, Kang BC, Lee HY. et al. Safety of intravenous infusion of human adipose tissue-derived mesenchymal stem cells in animals and humans. Stem Cells Dev. 2011;20:1297-308
34. Mailänder V, Lorenz MR, Holzapfel V, Musyanovych A, Fuchs K, Wiesneth M. et al. Carboxylated superparamagnetic iron oxide particles label cells intracellularly without transfection agents. Mol Imaging Biol. 2008;10:138-46
35. Skopalik J, Polakova K, Havrdova M, Justan I, Magro M, Milde D. et al. Mesenchymal stromal cell labeling by new uncoated superparamagnetic maghemite nanoparticles in comparison with commercial Resovist - an initial in vitro study. IJN. 2014:5355
36. Schrepfer S, Deuse T, Reichenspurner H, Fischbein MP, Robbins RC, Pelletier MP. Stem Cell Transplantation: The Lung Barrier. Transplant Proc. 2007;39:573-6
37. Daldrup-Link HE, Rudelius M, Metz S, Piontek G, Pichler B, Settles M. et al. Cell tracking with gadophrin-2: a bifunctional contrast agent for MR imaging, optical imaging, and fluorescence microscopy. Eur J Nucl Med Mol Imaging. 2004;31:1312-21
38. Nehmeh S a, Erdi YE, Ling CC, Rosenzweig KE, Squire OD, Braban LE. et al. Effect of respiratory gating on reducing lung motion artifacts in PET imaging of lung cancer. Med Phys. 2002;29:366-71
39. Bos C, Desmoulie A, Grosset C, Dubus I, Rosenbaum J, Charbord P. et al. Molecular Imaging Radiology In Vivo MR Imaging of Intravascularly Injected Magnetically Labeled Mesenchymal Stem Cells in Rat Kidney and Liver. Radiology. 2004Dec;233(3):781-9
40. Gupta N, Su X, Popov B, Lee JW, Serikov V, Matthay MA. Intrapulmonary delivery of bone marrow-derived mesenchymal stem cells improves survival and attenuates endotoxin-induced acute lung injury in mice. J Immunol. 2007;179:1855-63
41. Rojas M, Xu J, Woods CR, Mora AL, Spears W, Roman J. et al. Bone Marrow-Derived Mesenchymal Stem Cells in Repair of the Injured Lung. Am J Respir Cell Mol Biol. 2005;33:145-52
42. Vandsburger MH, Radoul M, Cohen B, Neeman M. MRI reporter genes: applications for imaging of cell survival, proliferation, migration and differentiation. NMR Biomed. 2013;26:872-84
43. Hensley D, Goodwill P, Croft L, Conolly S. Preliminary experimental X-space color MPI. Magnetic Particle Imaging (IWMPI), 2015 5th International Workshop on. 2015:1-1
44. Rahmer J, Halkola A, Gleich B, Schmale I, Borgert J. First experimental evidence of the feasibility of multi-color magnetic particle imaging. Phys Med Biol. 2015;60:1775-91
45. Arami H, Khandhar A, Liggitt D, Krishnan KM. In vivo delivery, pharmacokinetics, biodistribution and toxicity of iron oxide nanoparticles. Chem Soc Rev. 2015 doi:10.1039/C5CS00541H
46. Konkle JJ, Goodwill PW, Carrasco-Zevallos OM, Conolly SM. Projection reconstruction magnetic particle imaging. IEEE Trans Med Imaging. 2013;32:338-47
47. Yu EY, Goodwill PW, Conolly SM. Preliminary characterization of a laminated iron-core 6.3 T/m FFL magnet. Magnetic Particle Imaging (IWMPI), 2015 5th International Workshop on. 2015 p. 1-1
48. Ferguson R, Khandhar A, Saritas E, Croft L, Goodwill P, Halkola A. et al. Magnetic Particle Imaging with Tailored Iron Oxide Nanoparticle Tracers. IEEE Trans Med Imaging. 2014;62:1-1
49. Zhang W, Zheng B, Goodwill P, Conolly S. A custom low-noise preamplifier for Magnetic Particle Imaging. Magnetic Particle Imaging (IWMPI), 2015 5th International Workshop on. 2015:1-1
50. McNeil BJ. A diagnostic strategy using ventilation-perfusion studies in patients suspect for pulmonary embolism. J Nucl Med. 1976;17:613-6
51. Nishimoto K, Mimura A, Aoki M, Banura N, Murase K. Application of Magnetic Particle Imaging to Pulmonary Imaging Using Nebulized Magnetic Nanoparticles. Open Journal of Medical Imaging. 2015;5:49
52. Dames P, Gleich B, Flemmer A, Hajek K, Seidl N, Wiekhorst F. et al. Targeted delivery of magnetic aerosol droplets to the lung. Nat Nanotechnol. 2007;2:495-9
Author contact
![]() Corresponding author: bozhengedu
Corresponding author: bozhengedu