Impact Factor
- Issue 14; 2026
- Issue 13; 2026
- Issue 12; 2026
- Issue 11; 2026
- Issue 10; 2026
- Volume 16; 2026
- Advance Articles
- Past Issues
- Cover Images
- Cover Suggestion
- Index & Coverage
- Special Issues
Introduction
Materials and Methods
Results
Discussion
Supplementary Material
Acknowledgements
References
International Journal of Biological Sciences
International Journal of Medical Sciences
 Global reach, higher impact

Theranostics 2016; 6(2):231-242. doi:10.7150/thno.14023 This issue Cite
Research Paper
Smartphone-Based Fluorescent Diagnostic System for Highly Pathogenic H5N1 Viruses
Seon-Ju Yeo1‡, Kyunghan Choi2‡, Bui Thi Cuc1, Nguyen Ngoc Hong1, Duong Tuan Bao1, Nguyen Minh Ngoc1, Mai Quynh Le3, Nguyen Le Khanh Hang3, Nguyen Co Thach3, Shyam Kumar Mallik4, Hak Sung Kim4, Chom-Kyu Chong5, Hak Soo Choi6, Haan Woo Sung7, Kyoungsik Yu2 ![]() , Hyun Park1
, Hyun Park1 ![]()
1. Zoonosis Research Center, Department of Infection Biology, School of Medicine, Wonkwang University, Iksan, 570-749, Republic of Korea
2. School of Electrical Engineering, Korea Advanced Institute of Science and Technology, Daejeon, 305-338, Republic of Korea
3. National Institute of Hygiene and Epidemiology, No 1- Yersin street, Hanoi, Vietnam
4. College of Pharmacy, Institute of Pharmaceutical Research and Development, Wonkwang University, Iksan, 570-749, Republic of Korea
5. GenBody Inc, No.206, Biotech Business IC, DanKook University, San-29, Anseo-dong, Dongnam-gu, Cheonan, Republic of Korea
6. Division of Hematology/Oncology, Department of Medicine, Beth Israel Deaconess Medical Center, Harvard Medical School, Boston USA
7. College of Veterinary Medicine, Kangwon National University, Chunchon, 200-701, Republic of Korea
‡ Equal contributor: Seon-Ju Yeo and Kyunghan Choi contributed equally to this work.
Received 2015-10-1; Accepted 2015-11-19; Published 2016-1-1
Abstract

Field diagnostic tools for avian influenza (AI) are indispensable for the prevention and controlled management of highly pathogenic AI-related diseases. More accurate, faster and networked on-site monitoring is demanded to detect such AI viruses with high sensitivity as well as to maintain up-to-date information about their geographical transmission. In this work, we assessed the clinical and field-level performance of a smartphone-based fluorescent diagnostic device with an efficient reflective light collection module using a coumarin-derived dendrimer-based fluorescent lateral flow immunoassay. By application of an optimized bioconjugate, a smartphone-based diagnostic device had a two-fold higher detectability as compared to that of the table-top fluorescence strip reader for three different AI subtypes (H5N3, H7N1, and H9N2). Additionally, in a clinical study of H5N1-confirmed patients, the smartphone-based diagnostic device showed a sensitivity of 96.55% (28/29) [95% confidence interval (CI): 82.24 to 99.91] and a specificity of 98.55% (68/69) (95% CI: 92.19 to 99.96). The measurement results from the distributed individual smartphones were wirelessly transmitted via short messaging service and collected by a centralized database system for further information processing and data mining. Smartphone-based diagnosis provided highly sensitive measurement results for H5N1 detection within 15 minutes. Because of its high sensitivity, portability and automatic reporting feature, the proposed device will enable agile identification of patients and efficient control of AI dissemination.
Keywords: highly pathogenic H5N1 influenza virus, smartphone-based fluorescent diagnostic device, fluorescence-based immunochromatographic strip test, coumarin-derived dendrimer, field application
Introduction
Human infections by avian influenza (AI) viruses derived directly from wild birds or poultry have been a significant and expanding threat to both human and bird populations [1, 2]. AI viruses belong to the influenza type A viruses [3, 4]; three of their subtypes, H5, H7, and H9, have crossed the species barrier over the past decade [5, 6]. The highly pathogenic avian influenza strain H5N1 caused more than 60% human mortality according to the World Health Organization (WHO) [7]. Once an AI outbreak occurs, screening tests at the clinical level aim to detect the presence of AI viruses and to identify their subtype [8]. Therefore, considerable attention has been focused on the use of field-level point-of-care (POC) testing methods to screen AI infection in clinical samples. Although conventional laboratory testing is still needed, advances in engineering and instrumentation of POC testing can play an increasing role in public health care by providing smaller, faster, and simpler-to-operate devices for reliable and ubiquitous diagnostic testing [9-11].
As one of the POC applications, RDTs have been widely recommended for initial detection of pathogenic influenza outbreaks [12]. However, the clinical performance of the H5N1 RDTs particularly in human cases has seldom been reported. A rapid H5N1-diagnostic kit using H5N1-infected human samples has been reported to show a relatively low sensitivity (80%) for clinical samples (n = 10) [13]. Therefore, the development of highly sensitive rapid diagnostic kit to diagnose H5N1 in the field is still necessary. Recently, many trials have also adapted the fluorophores to significantly improve the RDT sensitivity [14]. To develop sensitive and field-applicable portable diagnostic kit for H5N1 detection, while taking advantage of the convenience of conventional RDTs, we employed a lateral flow assay with highly sensitive fluorescent coumarin-derived dendrimer-based bioconjugation to the smartphone-based diagnostic system with improved fluorescence collection efficiency.
Migratory birds typically cause transmission of AI to bird flocks [15], and thus play an important role in the geographic spread of various zoonotic AI viruses. To maintain up-to-date information about AI outbreaks and their dissemination, a networked global database with the latest diagnostic data for the regional spread of AI is highly desirable [16]. Traditional surveillance systems for AI outbreaks often involve substantial time and cost for labor, transportation, and laboratory studies [17]. The proposed diagnostic instrument was designed to address such issues by reporting measurement results immediately to a central monitoring site, such as the national quarantine agency, to allow the rapid dissemination of information about the detected AI viruses.
There are more than 2 billion smartphone users in the world [18]. Since modern smartphones are not only portable and connected to the communication network but are also equipped with a lightweight, high-performance camera/imaging module, they have become the preferred tool for use in many POC applications [10, 11, 19, 20]. In the clinical perspective, the smartphone-camera-based devices are being widely tested for various diagnostic applications [21-24], and the well-known examples include portable spectrophotometers, fluorescence analyzers, and microscopes [25]. To be fully adopted for medical and clinical purposes in the future, however, it is important for such devices to generate accurate, reliable, and repeatable measurement results even for the actual clinical samples at the field-level environments. Although accurate and quantitative smartphone-based diagnosis methods, such as enzyme-linked immunosorbent assay (ELISA) [26], are being developed, some smartphone-based diagnosis has shown the lack of accuracy under the involvement of medical professionals [25].
In this study, we report highly sensitive and specific clinical evaluation of a smartphone-based rapid, accurate, and networked AI diagnostic system for samples directly from H5N1-infected patients. Smartphone-based diagnostic tools and their networks have seldom been applied to geographically distributed quantitative analysis of zoonotic AI agents in clinical samples. In addition, the importance of optical collection efficiency has often been overlooked. Under the resource-limited portable environments where the light source for fluorescence excitation is battery-operated and its power is restricted, the fluorescence collection efficiency becomes very important and often determines the minimum detectable amount of fluorescent target materials. To improve the overall fluorescence collection efficiency, we adapt an efficient reflective light concentrator that can overcome the limited numerical aperture of the conventional fluorescence diagnostic devices based on refractive optics.
Materials and Methods
Materials
Aliphatic Amine Latex Beads (2% w/v, 20 nm) were purchased from Life Technology and two monoclonal antibodies, anti-influenza A-7307 and -7304, were purchased from Medix Biochemica. Aqueous glutaraldehyde (8% in distilled water [DW]) solution and goat anti-mouse IgG were purchased from Sigma-Aldrich.
Study group
The proposed device was tested at the National Institute of Hygiene and Epidemiology (NIHE), Hanoi, Vietnam with throat swab samples from patients confirmed to be infected with H5N1. Twenty-nine cases of H5N1-confirmed patients with their WHO case numbers and clinical features are described in Table 1. As H5N1-negative control groups, 29 H5N1-negative throat samples were also tested at NIHE. As an additional negative control, patients with 4 different viral respiratory diseases were selected from a database at Wonkwang University Hospital, Iksan, Republic of Korea, under the approval of the Institutional Review Board of Wonkwang University Hospital (Approval No. 1263). The respiratory diseases included were adenovirus (n = 10), parainfluenza virus (n = 10), respiratory syncytial virus (n = 10), and metapneumovirus (n = 10).
Clinical characteristics of 29 human cases of highly pathogenic avian influenza A (H5N1) virus infection in Vietnam. The specimens from H5N1-confirmed patients were listed in WHO case numbers between 2003 and 2010.
| Specimen No | WHO case No | ID No | Gender | Age | Date of Onset | Date of Collection | Condition |
|---|---|---|---|---|---|---|---|
| 1 | VN 1 | 3028 | F | 12 | unknown | unknown | Died (12/29/2003) |
| 2 | VN 3 | 3040 | M | 10 | 12/29/2003 | 1/06/2004 1/07/2004 | Died (1/10/2004) |
| 3 | VN 7 | 3058 | F | 8 | 1/10/2004 | 1/15/2004 1/16/2004 | Died (1/17/2004) |
| 4 | VN 5 | 3062 | M | 19 | 1/09/2004 | 1/16/2004 | Recovered (1/30/2004) |
| 5 | VN 21 | TH001 | M | 15 | 9/02/2004 | unknown | Died (10/03/2004) |
| 6 | VN 25 | 30262 | F | 1 | 7/27/2004 | 7/08/2004 8/20/2004 | Died (8/04/2004) |
| 7 | VN 24 | 30259 | M | 4 | 7/20/2004 | 7/30/2004 | Died (8/02/2004) |
| 8 | unknown | 30402 | M | 19 | unknown | 2/02/2005 | unknown |
| 9 | VN46 | 30408 | M | 14 | 2/21/2005 | 2/24/2005 2/25/2005 2/272005 | unknown |
| 10 | VN92 | 30850 | M | 35 | 10/23/2005 | 10/29/2005 | unknown |
| 11 | VN 94 | HN 31203 | M | 29 | 5/07/2007 | 5/19/2007 | Recovered (6/11/2007) |
| 12 | VN 95 | HN 31209 | M | 19 | 5/19/2007 | 5/26/2007 5/27/2007 5/28/2007 6/06/2007 | Recovered (6/11/2007) |
| 13 | VN 97 | HN 31242 | M | 20 | 6/01/2007 | 6/08/20076/10/2007 | Died (6/10/2007) |
| 14 | VN 98 | HN31244 | F | 28 | 6/02/2007 | 6/8/2007 | Died (6/21/2007) |
| 15 | VN 99 | HN31312 | F | 22 | 7/14/2007 | 7/25/2007 | Died (7/31/2007) |
| 16 | VN 100 | HN31323 | M | 15 | 7/27/2007 | 8/03/2007 | Died (8/03/2007) |
| 17 | VN 101 | HN31388 | M | 4 | 12/04/2007 | 12/14/2007 | Died (12/14/2007) |
| 18 | VN 102 | HN 31394 | M | 32 | 1/10/2008 | 1/16/2008 | Died (1/16/2008) |
| 19 | VN 104 | HN 31412 | M | 40 | 2/02/2008 | 2/09/2008 | Died (2/13/2008) |
| 20 | VN 103 | HN 31413 | M | 27 | 2/07/2008 | 2/13/2008 | Died (2/14/2008) |
| 21 | unknown | HN 31633 | unknown | unknown | unknown | unknown | unknown |
| 22 | VN 105 | HN 31432 | F | 22 | 2/14/2008 | 2/21/2008 | Died (2/22/2008) |
| 23 | VN 106 | HN 31461 | M | 11 | 3/04/2008 | 3/14/2008 | Died (3/16/2008) |
| 24 | VN 107 | HN 31604 | F | 8 | 12/27/2008 | 1/06/2009 | unknown |
| 25 | VN 109 | HN 31641 | M | 30 | 2/11/2009 | 2/13/2009 | unknown |
| 26 | VN 110 | HN 31673 I, II, III | M | 3 | unknown | 3/18/2009 | unknown |
| 27 | VN 116 | HN 36250 | F | 25 | 3/05/2010 | 3/10/2010 | unknown |
| 28 | VN 118 | HN 36282 | M | 22 | 3/27/2010 | 4/02/2010 | unknown |
| 29 | VN 119 | HN 36285 | F | 2 | unknown | 4/04/2010 | unknown |
Smartphone detector design
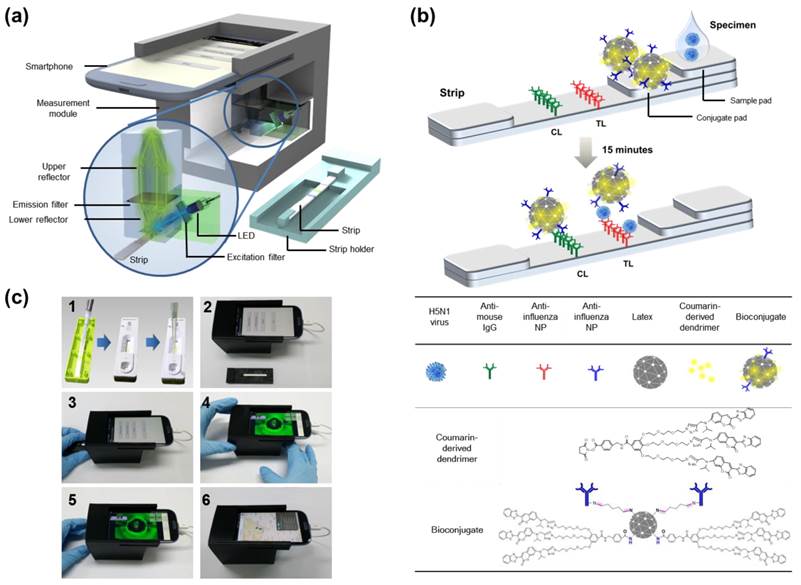
A compact (8×9×7 cm3) and lightweight attachment module for fluorescence excitation and collection was designed to be compatible with the smartphone's camera and fabricated using a 3D printer (Replicator™ 2x, MakerBot Industries, New York, NY, USA), as shown in Fig. 1. The attachment module included a reflective light collection structure, an LED (OVLGB0C6B9, Optek Technology Inc., Carrollton, TX, USA, cost: ~$0.5), plastic color filters (Kodak Wratten 2 filters, Eastman Kodak Company, Rochester, NY, USA, cost: <$5), and a plastic cover piece (not shown in Fig. 1 for illustration). Plastic materials were chosen to reduce the overall cost of the module. The reflector structure with the LED module was fixed at the center and the smartphone camera aperture was placed close to it. The reflectors were coated with aluminum for improved light reflection. The reflectivity of aluminum was about 90% in the visible wavelength range. The cover piece protected the optics components from the external light and fixed the whole attachment module to the smartphone body (Galaxy S3, Samsung Electronics, Suwon, Republic of Korea). Other mobile phones with camera modules and programming capabilities can also be used for this type of instrumentation. The dominant emission wavelength for the LED is 470 nm, which is within the excitation wavelength of the fluorescent bioconjugate [27]. It is also possible to exchange both the LED and the excitation color filter for various fluorophores with different excitation wavelengths. Since the LED was powered by a cable connected to the smartphone's micro universal serial bus port, the measurement module does not require an additional battery. Inexpensive plastic color filters were used to improve the detection efficiency. The emission filter was positioned between the two reflectors, while the excitation filter was inserted in front of the LED. The smartphone used in this study had an 8 million pixel camera, but the measurement performance is not directly related to the number of camera pixels.
Overview of smartphone-based fluorescence detector design. (a) Schematic description of a smartphone-based fluorescence detector with a reflective light concentrator module. When the fluorescent lateral flow strip, shown separately, is inserted into the measurement module and excited by an LED through an excitation filter, the fluorescence emission from the strip is filtered by an emission filter, collected by the non-imaging reflector module, and detected by the smartphone's camera module. (b) Schematic of a fluorescence detector flow strip. As a base of strip, a nitrocellulose membrane is coated with anti-influenza A nucleocapsid (NP) antibody on the test line (TL) and anti-mouse IgG on the control line (CL). Bioconjugate (latex conjugated with antibody and coumarin-derived dendrimer) that is reactive to the AI virus is captured by the anti-influenza NP on the TL. Meanwhile, the unreactive bioconjugates flow laterally further and are caught by the anti-mouse IgG on the CL. The fluorescent intensity, with an excitation/emission wavelength of 460/560 nm, is measured by the smartphone-based diagnostic device. (c1) Bioconjugate and specimens were dropped onto the conjugate pad of the diagnostic strip to induce lateral flow reaction toward the test and control lines. (c2) After 15 min, the strip was transported to the smartphone fluorescence reader. (c3, c4) A user started the measurement application on the smartphone, and followed the step-by-step instructions. (c5) The smartphone displayed the measurement results for the fluorescence intensity of the TL and CL. (c6) After finishing the measurements, the test result was displayed on the smartphone and also transmitted via wireless communication using SMS to the database. The test result appeared on the webpage with a binary diagnostic decision based on the cut-off value.
Strip preparation for lateral flow immunoassay
Nitrocellulose membrane (EMD Millipore, Billerica, MA, USA) was coated with 0.5 mg/mL of goat anti-mouse IgG (Life Technologies) on the CL and 2.6 mg/mL of anti-influenza A NP on the TL. As a sample conjugation pad, glass fiber was coated with 2% (w/v) BSA, 2% (w/v) sucrose, and 0.1% (w/v) NaN3. The diagnostic strip was tested after drying the membrane at 30 °C for 2 h.
Avian influenza virus propagation and plaque assay
As positive AI viruses, Ya-Lake ChungCho 10-3-F1(2011) (H5N3), Ya-Jeju, Youngsoori-12-2F4 (2012) A/common teal/Korea/KNU YSR12/2012(H7N1), and Jae-Songwoorijang-chicken-TR-TR A/chicken/Korea/KNUSWR09/2009(H9N2) were amplified in embryonic eggs [27]; H5N3, H7N1, and H9N2 viruses were kindly provided by Dr. Haan Woo Sung (Kangwon National University, Republic of Korea). Their abundances were determined in PFU/mL to quantify the virus titer after plaque assay. Briefly, MDCK epithelial cells were grown in 10% (v/v) fetal bovine serum (Gibco, Grand Island, NY, USA) in Dulbecco's modified Eagle's medium (DMEM), 100 IU/mL penicillin and 100 mg/mL streptomycin in 24-well plates for 24 h. Subsequently, cells were washed with PBS and inoculated with a 10-fold serial dilution of virus stock diluted in serum-free DMEM containing 1 µg/mL of ʟ-(tosylamido-2-phenyl) ethyl chloromethyl ketone (TPCK)-treated trypsin. After 2 h of incubation at 37 °C, the cells were washed 3 times with PBS and supplemented with 3 mL of overlay containing 0.8% (w/v) agarose mixed 1:1 with 2 × serum-free DMEM containing TPCK-trypsin. The plates were inverted and incubated for 3 days at 37 °C. After removing the agarose carefully, cells were fixed with 4% (w/v) formaldehyde and stained with 0.2% (w/v) crystal violet solution for 30 min.
Bioconjugation
For covalent conjugation of Ab with latex and coumarin-derived dendrimer, the conjugation procedures were based on the previously developed FICT assay [27], but further optimized to improve the sensitivity and specificity with higher sample volumes directly from the throat swab samples. Briefly, 10 μL of aliphatic amine latex beads (20 nm diameter) (2% w/v) (Life Technologies) were washed with phosphate-buffered saline (PBS) (pH 7.5) and 100 μL of coumarin-derived dendrimer (1 mg/mL in dimethyl sulfoxide) was mixed with latex in the presence of 1 mL conjugation buffer (0.1 M sodium bicarbonate, pH 8.5) at room temperature with shaking. After 1 hour, 8% (v/v) glutaraldehyde (0.5 mL) was added to the mixture of latex beads and incubated for 30 min. After washing the latex beads twice with PBS, coumarin-derived dendrimer-conjugated latex beads were resuspended in 50 µL of 1 mg/mL anti-Influenza NP. After vortexing, the conjugate mixture was incubated at 4 °C for 2 h. After centrifugation at 27,237 × g for 5 min, the collected bioconjugates were blocked for 30 min and resuspended in 1 mL of storage buffer (0.1% [w/v] bovine serum albumin [BSA]) and kept at 4 °C. To suppress non-specific reactivity of bioconjugate in throat swab samples, 0.1% of blocker (sucrose, fish gelatin, and BSA) were used as blockers.
Device operation
To conduct a diagnosis test, a strip was first placed on the strip holder, and 10 μL of bioconjugates were dropped onto the conjugate pad. After covering the strip with the strip cover, different volumes (10, 25, 50, 75, and 100 μL) of samples were introduced into the predefined hole in the strip cover, followed by sample buffer (SB) (SB1; 25 mM 2-[4-(2-hydroxyethyl)piperazin-1-yl] ethanesulfonic acid [HEPES], 0.1 M NaCl, 2.5 mM MgCl2, and 0.1% [v/v] NP-40 (pH7.5), SB2; 25 mM [HEPES], 0.2 M NaCl, 50 mM MgCl2, and 0.1% [v/v] NP-40 (pH 7.5), SB3; 25 mM [HEPES], 0.4 M NaCl, 100 mM MgCl2, and 0.1% [v/v] NP-40 (pH 7.5), SB4; SB4; 25 mM [HEPES], 0.2 M NaCl, 50 mM MgCl2, and 0.1% [v/v] NP-40 (pH 8.0), and SB5; 25 mM [HEPES], 0.2 M NaCl, 50 mM MgCl2, and 0.1% [v/v] Triton-X 100 (pH 7.5)) by making 125 μL of total reaction volume per strip. The strip was kept in the dark for 15 min and then the fluorescent intensities were measured using the smartphone detector. The fluorescence of samples were objectively and quantitatively measured and analyzed in 3 steps. First, the fluorescence-emitting sample on the plastic sample holder was inserted into the attachment module, which effectively blocked external light with its housing. Next, the ratio of the brightness of the TL and CL lines was measured by taking pictures with the smartphone's camera module and calculating the brightness data in each color channel. LED-based excitation was powered by the smartphone. Finally, the measurement data were analyzed and transmitted wirelessly to a server computer (centralized monitoring system) via short messaging service (SMS), together with metadata including the measurement time and location. The location information was obtained from the smartphone's global positioning system module.
Sandwich ELISA
Anti-influenza NP (10 μg/mL)-coated 96-well plates with 100 μL of 50 mM bicarbonate/carbonate coating buffer (pH 9.6) were incubated overnight at 4 °C. After incubation, the plate wells were washed with 200 μL of PBS containing 0.1% Tween® 20 (PBS-T) twice and blocked with 5% (w/v) BSA at 37 °C for 2 h. After washing with PBS-T buffer, serial dilutions of the virus prepared in either distilled water (DW) or normal throat samples, which were provided from by Wonkwang University Hospital, were loaded to into each well and incubated at 37 °C for 1 h. One hundred microliters of horseradish peroxidase-conjugated anti-influenza NP antibody (20 µg/ml) was applied to each well at 37 °C for 1 h. After washing with PBS-T 5 times, 100 μL of 3,3′,5,5′-tetra methyl benzidine substrate solution (Invitrogen, Carlsbad, CA, USA) was added to each well and samples were kept in the dark for 15 min. Finally, the reaction was stopped by adding 100 μL of 0.5 M sulfuric acid to each well. Optical density (OD) was determined by using a microplate reader at 450 nm. Data were shown as mean ± standard deviation.
Clinical evaluation
H5N1-confiremd throat swabs samples were directly applied to smartphone-based fluorescence immunochromatographic diagnostic system and fluorescence intensity was measured after 15 min.
Statistics
Mean, standard deviation (SD), linear regression, Student's t-test, and one-way ANOVA were conducted in Graphpad Prism. ROC curve and 95% confidence intervals (CI) were computed for the assay sensitivity and specificity.
Results
Design of smartphone-based fluorescence diagnostic device
To achieve high light collection efficiency and thereby fluorescence detection sensitivity within a small form factor that can be interfaced with a smartphone or other mobile diagnostic device, the proposed instrument uses a pair of parabolic mirrors between the lateral flow strip and the smartphone's camera, as illustrated in Fig 1. Since most fluorescent immunochromatographic tests used for initial screening purposes are usually concerned only with the total amount of fluorescence emission from the fluorophores, precise imaging with high-performance refractive lenses is often unnecessary. To improve the signal to noise and the fluorescent detection limit when compared to the conventional fluorescence-based strip readers [27], it is important to increase the number of signal photons collected at the fluorescence detector, or the fluorescence collection efficiency [28]. The details of the smartphone-based instrumentation as well as the light concentrator design can be found in the Methods section of the Supplementary Materials (Fig. S1).
Excitation light produced by LED excites the fluorophores, and a roughly collimated fluorescent beam reflected by the lower parabolic reflector passes through the emission filters. The stray excitation light is filtered by the emission filter and is therefore not detected by the photodetector, which is the smartphone's camera module in our implementation (Fig. 1a). To concentrate the fluorescent light toward the photodetector, the upper reflector is a non-imaging compound parabolic concentrator (CPC) with a nearly ideal concentration ratio [29]. The smartphone camera acquires the collected fluorescent light and its total intensities are estimated by averaging the pixel intensity values. The details of the smartphone-based instrumentation as well as the light concentrator design can be found in the Methods section of the Supplementary Materials (Fig. S1).
To determine the presence of AI virus antigens, image acquisition and fluorescence intensity estimation are performed for both the test and control lines of the lateral flow immunoassay strip, as illustrated in Fig. 1b. The ratio of the fluorescence intensity measurement results at the test line (TL) to those at the control line (CL) provides a good indicator of whether the sample loaded into the strip contains the target AI viruses. A software application running on the Android operating system was developed to enable non-experts to easily complete a fluorescence immunochromatographic diagnostic test and report its result via wireless communication through step-by-step instructions displayed on the smartphone's touchscreen. As seen in Fig 1c, the measurement starts with dropping of 10 µL of bioconjugate onto the conjugate pad of the diagnostic strip. The disposable plastic strip cassette is tightly covered with the lid to induce a lateral flow reaction toward the test and control lines. Subsequently, 75 µL of specimen is directly dropped into the opening hole of the sample holder, located on the top of the sample pad; 50 µL of sample buffer is added to complete the lateral flow reaction (Fig. 1c-1). After allowing 15 min to pass for the completion of the reaction, the strip is transported to a strip holder customized for the smartphone fluorescence reader (Fig. 1c-2). After installing the strip holder from the right side, the user starts the measurement application on the smartphone screen, following the step-by-step instructions on screen (Fig. 1c-3). The smartphone screen displays the measurement results for the concentrated fluorescence intensity of the TL first, and, after the strip holder is pushed to the left side, the fluorescence intensity of the CL is obtained (Fig. 1c-4, -5). The detailed smartphone camera properties, such as ISO, exposure compensation, and focus mode settings are carefully controlled by the application software for consistent measurements. The attachment module housing effectively blocks the external light, and provides a controlled environment for reliable and accurate fluorescent intensity measurements. After finishing the fluorescent intensity measurements, the test result is obtained by computing the fluorescent intensity ratio (TL/CL) and comparing its value with the predetermined threshold. The test results as well as other supplementary information such as test location and time are transmitted via wireless communication using SMS and stored in the remote database (Fig. 1c-6).
Optimization of bioconjugate
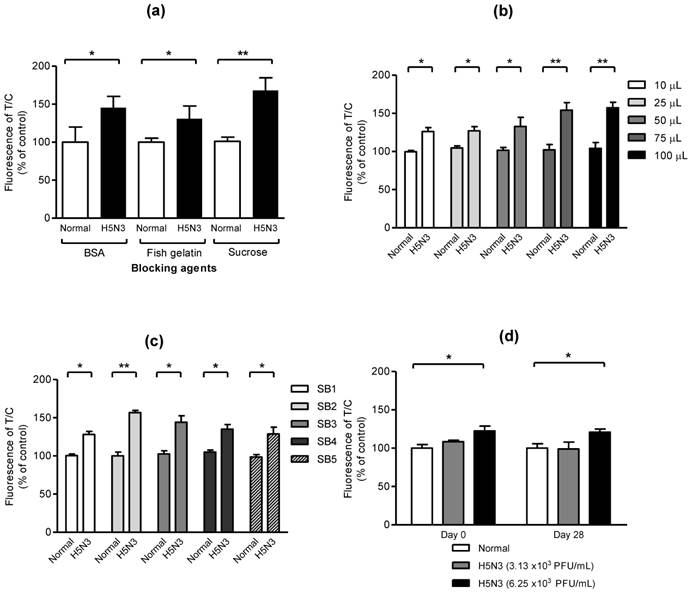
In preliminary experiment, we found that the use of latex beads enhanced the fluorescent signal of coumarin-derived dendrimers comparing with direct conjugation of antibody with dendrimers (Fig. S2). To optimize the smartphone-based diagnostic system, effect of blockers, optimal sample amount, sample buffer, and stability of bioconjugate on fluorescent-immunochromatographic strip was evaluated. As seen in Fig. 2a, three blockers such as 0.1% of sucrose, fish gelatin, and BSA, showed a significant difference between normal and H5N3 virus (2.5 × 10⁴ PFU/mL), indicating all three blockers were useful to block the nonspecific reaction easily and sucrose was the most efficient to increase the significance between positive- and negative samples. To confirm the capacity of the proposed diagnostic system to deliver sample volumes, various sample amounts were applied to the system. As shown in Fig. 2b, all different sample volumes of H5N3 virus (2.5 × 10⁴ PFU/mL) from 10 μL to 100 μL were statistically different and 75 μL of samples resulted in higher fluorescence difference than those of lower sample volumes in smartphone-based diagnostic system. Sample buffer (SB) plays a key role of lysis of specimen and migration of samples on nitrocellulose membrane without non-specific reaction [30]. In Fig. 2c, the performance of fluorescence immunochromatography was significantly different depending on salt concentration and pH of SB. SB2 (25 mM [HEPES], 0.2 M NaCl, 50 mM MgCl2, and 0.1% [v/v] NP-40 (pH7.5)) had slightly increased salt to block nonspecific reaction, comparing to SB1 which was used in the previous our report [27] and was more efficient than other condition tested. Therefore, we employed SB2 for further clinical study. To determine the stability of bioconjugate during storage, freshly generated bioconjugate and 28-day-old bioconjugate stored at 4 °C were separately applied to the smartphone-based diagnostic system at two different titers of H5N3 virus titer (3.13 × 10³ and 6.25 × 10³ PFU/mL). As seen in Fig. 2d, the performance of our smartphone detector was confirmed by comparing fresh and 28-day-old bioconjugate samples. The lowest detectable virus titer was remained at 6.25 × 10³ PFU/mL (P < 0.05) in both fresh and 28-day-old bioconjugate samples. In contrast, 3.13 × 10³ PFU/mL of virus titer had no significant difference (P > 0.05) of fluorescence level compared with blank sample in fresh and 28-day-old conjugate. This result indicated that the proposed device performance was not changed for 28 days. Therefore, the performance of smartphone-based diagnostic values was confirmed to keep the consistency of measurement for 28 days.
Characteristics of bioconjugate. (a) Sucrose, fish gelatin, and BSA were used to reduce background without decreasing fluorescence signals. After the bioconjugate was blocked with 0.1% of each blocker, 2.5 × 10⁴ PFU/mL of H5N3 in normal throat samples was applied to the strip and measured. Data (n = 3) were shown as mean ± SD, two tailed Student's t-test. (b) Different sample volumes of H5N3 virus (2.5 × 10⁴ PFU/mL) were applied to the smartphone device. (c) Various sample buffers (SB) at different salt concentrations (SB1-3), pH (SB4), detergent (SB5) were tested. All data (n = 3) were shown as mean ± SD, two tailed Student's t-test. (d) Stability of smartphone-diagnostic assay using 28-day-old bioconjugate was compared with that of fresh conjugate (day 0). Two different H5N3 virus titer (3.13 × 10³ PFU/mL and 6.25 × 10³ PFU/mL) and lower virus titer were applied to the diagnostic system. Data (n = 3) were shown as mean ± SD, one-way ANOVA.
Comparison of lowest detectable virus titers
The lowest detectable virus titer of the proposed smartphone diagnostic device for a viral antigen was compared with those of the conventional sandwich ELISA and the table-top fluorescence-based strip readers for fluorescent immunochromatographic tests (referred to as FICT in this paper). Because the smartphone-based device was designed to detect viruses in throat swab samples for facile field-level detection of AI in humans, serial dilutions of each virus subtype were prepared in distilled water (DW) or throat swab samples for analysis by sandwich ELISA.
ELISA analysis results for the lowest detectable amounts of H5N3, H7N1, and H9N2 dissolved in DW or throat swab samples are shown in Fig. 3a. When the viruses were dissolved in throat swab samples, the lowest positive optical density (OD) values (OD > 0.2) measured for the H5N3 subtype were obtained at 1.00 × 10⁵ and 8.00 × 10⁵ PFU/mL in DW and throat swab samples, respectively. The lowest positive OD values for H7N1 were at 6.84 × 10⁴ and 2.73 × 10⁵ PFU/mL in DW and throat swab samples, respectively. For H9N2, they were 3.52 × 10³ and 5.63 × 10⁵ PFU/mL in DW and throat swab samples, respectively.
Comparison of performance of conventional ELISA, table-top fluorescent immunoassay strip reader (FICT), and smartphone detector. (a) Serial dilutions of each virus subtype (H5N3, H7N1, and H9N2) were prepared in distilled water (DW) or normal throat swab; the viral titer in each sample was quantified by sandwich ELISA. (b) Each virus subtype dissolved in normal throat swab samples was tested using a table-top fluorescent immunoassay strip reader (FICT) as well as the smartphone-based detector and the quantitative range were analyzed. The normalized fluorescent values of TL/CL for each negative control were shown with horizontal dotted lines. Each data point represents mean ± SD (n = 3). All experiments were performed three times, independently.
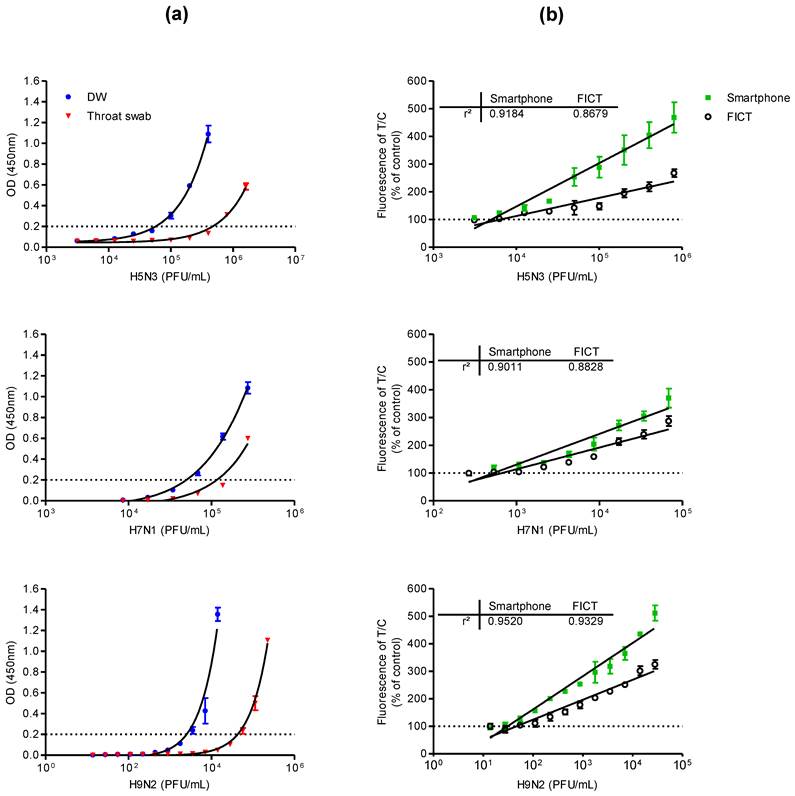
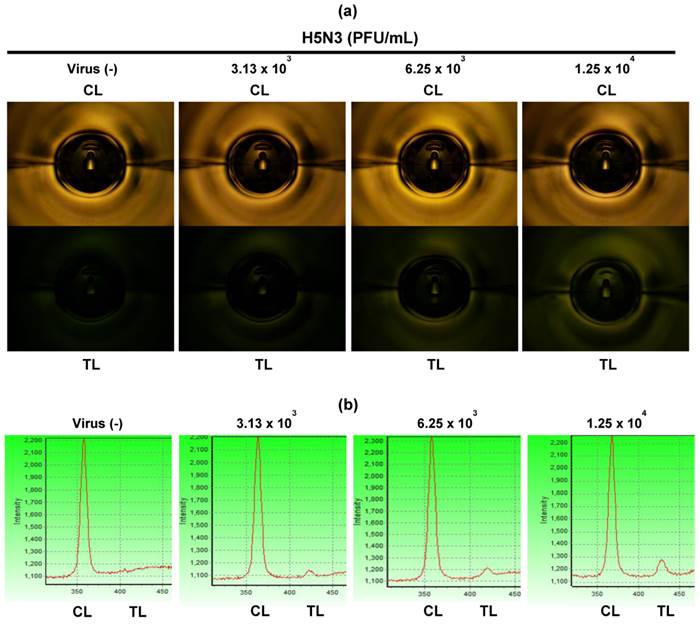
For fluorescence-based lateral flow immunoassays, the fluorescence intensity ratio of the test and control lines was determined as described previously [27]. In Fig. 3b, 75 μL of samples was applied to both smartphone and the table-top FICT assays. The lowest detectable virus titers for both assays were statistically different from those of the negative samples values (one-way ANOVA, Bonferroni's correction for multiple comparisons, P < 0.05). Data (n = 3) were shown as mean ± SD. For H5N3, the lowest detectable virus titers of the smartphone and FICT assays were 6.25 × 10³ and 1.25 × 10⁴ PFU/mL, respectively. For H7N1, the smartphone and FICT assays showed a linear range of detection between 2.67 × 10² and 6.83 × 10⁴ PFU/mL. The lowest H7N1 virus titers detectable by the smartphone and FICT assays were 5.34 × 10² and 1.06 × 10³ PFU/mL, respectively. For H9N2, the smartphone and FICT assays showed a linear detection range between 1.37 × 101 and 2.81 × 10⁵ PFU/mL. The lowest H9N2 virus titers detectable by the smartphone and FICT assays were 5.23 × 101 and 1.09 × 10² PFU/mL, respectively. Although we applied the same assay condition to both tests, the proposed smartphone device showed an approximately two-fold improvement in the minimum detectable viral titer for H5N3, H7N1, and H9N2 compared to the table-top FICT reader reported in [27]. The smartphone device showed higher R-squared (r2) values than those of the table-top FICT reader, indicating that the proposed smartphone device has the improved diagnostic performance (Fig. 3b). The fluorescence intensity of the test line (TL) and control line (CL) of different H5N3 virus titers from 3.13 × 10³ - 1.25 × 10⁴ PFU/mL was shown in Fig. 4. As seen in Fig. 4a, fluorescence signals of TL in center zone captured by smartphone was increased, depending on virus titer. As a result of statistical analysis, 6.25 × 10³ PFU/mL of H5N3 was determined as the lowest detectable virus titer (P < 0.05) by smartphone. Although FICT assay showed a little tiny peak in TL at this virus titer, the ratio of TL and CL of only 1.25 × 10⁴ PFU/mL was significantly different (P < 0.05) with negative control but 6.25 × 10³ PFU/mL virus titer was not significantly different with negative control (Fig. 4b).
Fluorescent images. Fluorescent intensities of TL and CL were captured at different H5N3 virus titers from 3.13 × 10³ to 1.25 × 10⁴ PFU/mL by the smartphone detector (a) and FICT assay (b).
Clinical performance of H5N1 diagnosis
For actual measurements with clinical samples, specimens from 29 H5N1-confirmed patients listed in WHO case numbers between 2003-2010 were tested at the National Institute of Hygiene and Epidemiology (NIHE), Hanoi, Vietnam. The mean age of patents (nine females and twenty males) was 17.7 years (range, 2-40); none had any known clinically significant preexisting medical condition. Sample collection was performed within a week of the onset of the illness, Among the 29 cases, 16 patients died within two weeks of the onset of the illness (Table 1).
For binary diagnostic decision, the TL/CL threshold cut-off value for H5N1 was determined to be 0.84 from receiver-operating characteristic (ROC) curve analysis after plotting all data using Graphpad Prism; this value was used in the app (positive if TL/CL > 0.84, negative otherwise). According to the ROC curve analysis, 0.82 < TL/CL < 0.86 showed the highest clinical sensitivity and specificity to diagnose H5N1 infection (Fig. 5a). The ROC curve analysis resulted in an area under-the-curve (AUC) value of 0.9915 (95% CI: 0.9778 to 1.005) for H5N1 patients (Fig. 5b) (P < 0.0001), indicating high accuracy for the smartphone detector to predict H5N1 infection.
Clinical validation of smartphone-based diagnostic device with H5N1-infected patient samples. A third-party field trial of the smartphone device was performed with human throat swab specimens collected from H5N1-infected patients (n = 29) and normal subjects (n = 29) in NIHE, Hanoi, Vietnam. In addition, adenovirus (n = 10), parainfluenza virus (PIV) (n = 10), respiratory syncytial virus (RSV) (n = 10), and metapneumovirus (MPV) (n = 10) were tested using the smartphone device at Wonkwang University Hospital, Iksan, Republic of Korea. (a) Various cut-off levels were provided by the ROC curve, representing the sensitivity, specificity, and 95% confidential interval (CI). Based on the ROC curve analysis, 0.84 was determined as the threshold cut-off value to differentiate H5N1 infection in clinical study. (b) All fluorescent levels of TL/CL were plotted for smartphone detector performance to predict H5N1 infection, displaying an ROC curve. Accuracy of smartphone device performance was determined with area under the ROC curve (AUC). (c) The cut-off value used for the detection of H5N1 was applied to determine whether each sample was positive or negative for the presence of the virus. Among H5N1-infected patients (n = 29), only one case showed a false-negative of TL/CL and the other twenty eight cases showed higher TL/CL values larger than the threshold value (0.84). Non-H5N1-infected control group (n = 69) showed only one false-positive case in parainfluenza virus-infected patients.
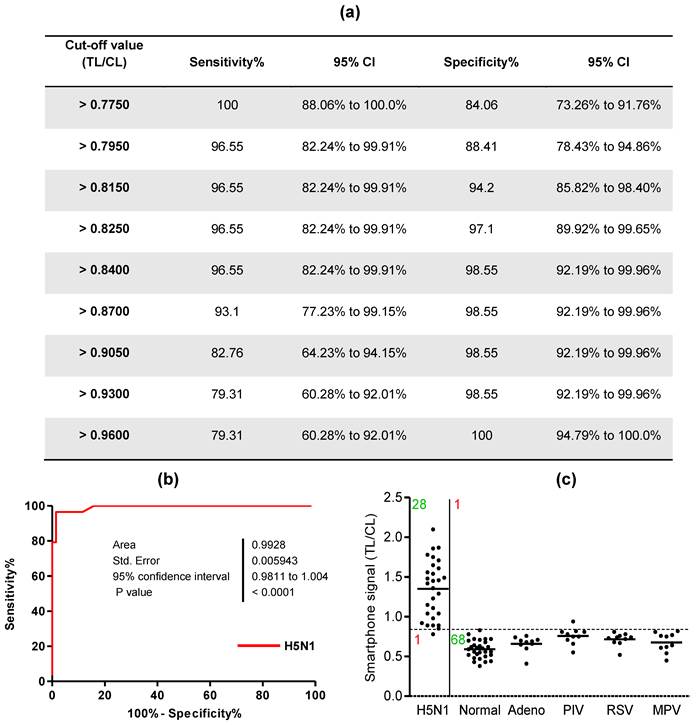
A case of H5N1-infected patients showed a false-negative value among twenty nine H5N1-positive patient samples and parainfluenza infection among the non-H5N1-infected control group showed only 1 false-positive case (Fig. 5c). Therefore, the smartphone-based diagnostic device showed a sensitivity of 96.55% (28/29) [95% confidence interval (CI): 82.24 to 99.91] and a specificity of 98.55% (68/69) (95% CI: 92.19 to 99.96) (P < 0.0001).
Transmission of measurement results to a central database
Measurement results were obtained by the following procedure. First, the concentrated fluorescence intensities from the test and control lines of each sample were obtained by the smartphone's camera module, and then the relative brightness was calculated and analyzed by the app. Binary diagnostic decision was made by comparing the fluorescent intensity ratio (TL/CL) and the statistical cut-off value (Fig. S3a). Second, the analyzed data as well as the geographical information and measurement time were transmitted to the central database server located at a remote location (Korea Advanced Institute of Science and Technology, Daejeon, Republic of Korea); the computer server uploaded the measurement results in real time to a webpage. On the monitoring map webpage, each color-coded balloon label represents a measurement result. For example in Fig. S3b, the green labels indicate that the measurement results from the comparison group (other respiratory disease samples) were negative. On the other hand, the red labels represent positive measurement results obtained from the H5N1 patient samples.
Discussion
Vietnam has had active control programs against human pathogenic H5N1 viruses since 2003 [31]. Based on the clinical case studies, the fatality of H5N1 patients in Vietnam was 55.2% (16/29), and the patients died within a week of hospitalization [32, 33]. An on-site control/surveillance system for H5N1 is therefore indispensable to prevent rapid widespread exposure to the virus and to identify potential patients for immediate hospitalization. To develop a highly sensitive diagnostic tool applicable to the field-level screening tests, the virus detectability as well as the field applicability must be improved. The reported performance of conventional immunoassay RDTs was about 7 × 10⁴ - 7 × 10⁵ PFU/mL for H5N3 [34, 35]. Recently, various approaches have been applied to improve the rapid diagnostic systems for accurate and quick analysis with different influenza subtype viruses; A fluorescent immunochromatographic test for seasonal influenza viruses has been reported to detect H5N1 virus at 83.7 PFU/reaction, but the clinical study was performed only with Influenza A type, not H5N1 [36]. Although recent developments in rapid diagnostic tests employ nanomaterials, including nanoparticles [37] and graphene films [38], to detect influenza H5 recombinant antigen, such methods still need further improvements and verification in clinical environments.
In our previous study using the table-top fluorescent strip reader, we confirmed the validity of coumarin-derived dendrimers as efficient fluorophores for RDTs with significantly improved sensitivities when compared to those of colloidal gold RDTs [27]. Here, we found that H5N1- infected throat human samples can be directly applied to the smartphone-based device using such fluorophores and highly sensitive and specific diagnostic performances were obtained without preprocessing of sample volumes. A previous report of an automated luminescence analyzer [13] would be fair to compare the performance as a rapid H5N1-diagnostic kit because it was also based on the H5N1-confirmed clinical samples from the same clinical laboratory (NIHE, Hanoi, Vietnam). Objective comparison between these studies implies that our diagnostic system performs better than the automated luminescence analyzer for H5N1 infection diagnosis in the field-level human clinical samples.
To further improve the performance of POC testing, modifications to the assay technique, such as the use of a higher light intensity, have been suggested [27, 39]. In our study, the proposed detection scheme improves the light collection efficiency through adaptation of an efficient reflective light concentrator, which yields a better signal-to-noise ratio, especially under low fluorescent intensity conditions. In addition, the optimized bioconjugate for smartphone device resulted in 2 times better performance than that of the table-top strip fluorescence reader which has a more complicated focusing/imaging lens system and a larger photodetector area [27].
Therefore, our results showed that the enhanced fluorescent light collection efficiency of the smartphone device as well as the improved sensitivity that results from the optimized fluorescence materials, can overcome the limitations of conventional colorimetric RDTs. We also confirmed that the data measured by the smartphone device were successfully transmitted to a central server computer for real-time reporting. Under the proposed hardware-software platform based on smartphones, it is possible to obtain the diagnostic results on-site immediately from a predetermined cut-off value, and at the same time build an international real-time surveillance system for emerging public health threats with the geographically distributed diagnostic tools.
Supplementary Material
Supplementary Methods, Supplementary Figures and Tables.
Acknowledgements
We thank Dr. Du-Young Choi (Wonkwang University) for providing respiratory virus-infected patients samples. Funding: This research was supported by the Public Welfare & Safety Research Program through the National Research foundation of Korea (NRF) funded by the Ministry of Science, ICT & Future Planning (2010-0020803, 2010-0020804) and the Bio & Medical Technology Development Program of the NRF funded by the Korean government, MSIP (2014M3A9E2064699).
Author contributions
S.-J.Y., B.T.C., N.N.H., D.T.B., N.M.N., and K.C. developed/performed immunoassays under the guidance of H.S.C., C.-K.C., and H.P. S.K.M. and H.S.K. synthesized the fluorescent materials. K.C. and K.Y. developed the smartphone-based instruments. H.W.S. performed the reference test for subtyping AI and provided AI. M.Q.L., N.L.K.H., N.C.T. performed clinical testing in NIHE. S.-J.Y., K.C., K.Y., and H.P. wrote the paper with inputs from all other authors.
Competing Interests
The authors have declared that no competing interest exists.
References
1. Animal influenza. World Health Organization. http://www.who.int/zoonoses/diseases/animal_influenza/en/
2. Bouvier NM, Lowen AC. Animal models for influenza virus pathogenesis and transmission. Viruses-Basel. 2010;2:1530-63
3. Li X-L, Liu K, Yao H-W, Sun Y, Chen W-J, Sun R-X. et al. Highly pathogenic avian influenza H5N1 in Mainland China. Int J Environ Res Public Health. 2015;12:5026-45
4. de Jong JC, Claas ECJ, Osterhaus ADME, Webster RG, Lim WL. A pandemic warning? Nature. 1997;389:554
5. Li KS, Guan Y, Wang J, Smith GJD, Xu KM, Duan L. et al. Genesis of a highly pathogenic and potentially pandemic H5N1 influenza virus in eastern Asia. Nature. 2004;430:209-13
6. Peiris M, Yam WC, Chan KH, Ghose P, Shortridge KF. Influenza A H9N2: Aspects of laboratory diagnosis. J Clin Microbiol. 1999;37:3426-7
7. Highly pathogenic asian avian influenza A (H5N1) in people. Centers for Disease Control and Prevention. http://www.cdc.gov/flu/avianflu/h5n1-people.htm
8. Avian influenza diagnostics and testing. The Animal and Plant Health Inspection Service. http://www.aphis.usda.gov/publications/animal_health/content/printable_version/fs_AI_diagnostics&testing.pdf
9. Jani IV, Peter TF. How point-of-care testing could drive innovation in global health. New England Journal of Medicine. 2013;368:2319-24
10. Vashist SK, Luppa PB, Yeo LY, Ozcan A, Luong JHT. Emerging technologies for next-generation point-of-care testing. Trends in Biotechnology. 2015;33:692-705
11. Vashist SK, Mudanyali O, Schneider EM, Zengerle R, Ozcan A. Cellphone-based devices for bioanalytical sciences. Analytical and Bioanalytical Chemistry. 2014;406:3263-77
12. WHO recommendations on the use of rapid testing for influenza diagnosis. World Health Organization. http://www.who.int/influenza/resources/documents/RapidTestInfluenza_WebVersion.pdf
13. Tsunetsugu-Yokota Y, Nishimura K, Misawa S, Kobayashi-Ishihara M, Takahashi H, Takayama I. et al. Development of a sensitive novel diagnostic kit for the highly pathogenic avian influenza A (H5N1) virus. Bmc Infectious Diseases. 2014:14
14. Miller E, Sikes HD. Addressing barriers to the development and adoption of rapid diagnostic tests in global health. 2015.
15. Tian HY, Zhou S, Dong L, Van Boeckel TP, Cui YJ, Wu YR. et al. Avian influenza H5N1 viral and bird migration networks in Asia. Proc Natl Acad Sci U S A. 2015;112:172-7
16. Human infection with avian influenza H5N1 viruses. Public Health Agency of Canada. http://www.phac-aspc.gc.ca/h5n1/index-eng.php
17. Coman A, Maftei DN, Chereches RM, Zavrotchi E, Bria P, Dragnea C. et al. Avian influenza surveillance in the danube delta using sentinel geese and ducks. Influenza Res Treat. 2014;2014:6
18. 2 billion consumers worldwide to get smart(phones) by 2016. eMarketer. http://www.emarketer.com/Article/2-Billion-Consumers-Worldwide-Smartphones-by-2016/1011694
19. Liu XY, Lin TY, Lillehoj PB. Smartphones for cell and biomolecular detection. Ann Biomed Eng. 2014;42:2205-17
20. Im H, Castro CM, Shao HL, Liong M, Song J, Pathania D. et al. Digital diffraction analysis enables low-cost molecular diagnostics on a smartphone. Proc Natl Acad Sci U S A. 2015;112:5613-8
21. Ming K, Kim J, Biondi MJ, Syed A, Chen K, Lam A. et al. Integrated quantum dot barcode smartphone optical device for wireless multiplexed diagnosis of infected patients. Acs Nano. 2015;9:3060-74
22. Guan L, Tian J, Cao R, Li M, Cai Z, Shen W. Barcode-like paper sensor for smartphone diagnostics: An application of blood typing. Analytical Chemistry. 2014;86:11362-7
23. Liu Y, Liu Q, Chen S, Cheng F, Wang H, Peng W. Surface plasmon resonance biosensor based on smart phone platforms. Sci Rep. 2015:5
24. Roda A, Michelini E, Cevenini L, Calabria D, Calabretta MM, Simoni P. Integrating biochemiluminescence detection on smartphones: Mobile chemistry platform for point-of-need analysis. Analytical Chemistry. 2014;86:7299-304
25. Azzazy HME, Elbehery AHA. Clinical laboratory data: acquire, analyze, communicate, liberate. Clinica Chimica Acta. 2015;438:186-94
26. Laksanasopin T, Guo TW, Nayak S, Sridhara AA, Xie S, Olowookere OO. et al. A smartphone dongle for diagnosis of infectious diseases at the point of care. Sci Transl Med. 2015:7
27. Yeo SJ, Huong DT, Hong NN, Li CY, Choi K, Yu K. et al. Rapid and quantitative detection of zoonotic influenza A virus infection utilizing coumarin-derived dendrimer-based fluorescent immunochromatographic strip test (FICT). Theranostics. 2014;4:1239-49
28. Waters JC. Accuracy and precision in quantitative fluorescence microscopy. Journal of Cell Biology. 2009;185:1135-48
29. Welford WT. High collection nonimaging optics. Elsevier. 2012
30. Gillet P, Mori M, Van den Ende J, Jacobs J. Buffer substitution in malaria rapid diagnostic tests causes false-positive results. Malaria Journal. 2010:9
31. Le MQ, Horby P, Fox A, Nguyen HT, Nguyen HKL, Hoang PMV. et al. Subclinical avian influenza A(H5N1) virus infection in human, Vietnam. Emerg Infect Dis. 2013;19:1674-7
32. Writing Committee of the Second World Health Organization Consultation on Clinical Aspects of Human Infection with Avian Influenza A (H5N1) Virus. Update on avian influenza A (H5N1) virus infection in humans. New England Journal of Medicine. 2008;358:261-73
33. Hien TT, Liem NT, Dung NT, San LT, Mai PP, Chau NvV. et al. Avian influenza A (H5N1) in 10 patients in Vietnam. New England Journal of Medicine. 2004;350:1179-88
34. Fedorko DP, Nelson NA, McAuliffe JM, Subbarao K. Performance of rapid tests for detection of avian influenza a virus types H5N1 and H9N2. J Clin Microbiol. 2006;44:1596-7
35. Daelemans D, Pauwels R, De Clercq E, Pannecouque C. A time-of-drug addition approach to target identification of antiviral compounds. Nat Protoc. 2011;6:925-33
36. Sakurai A, Takayama K, Nomura N, Kajiwara N, Okamatsu MS, Yamamoto N. et al. Fluorescent immunochromatography for rapid and sensitive typing of seasonal influenza viruses. PLoS ONE. 2015;10:13
37. Pang Y, Rong Z, Wang J, Xiao R, Wang S. A fluorescent aptasensor for H5N1 influenza virus detection based-on the core-shell nanoparticles metal-enhanced fluorescence (MEF). Biosens Bioelectron. 2015;66:527-32
38. Xie Z, Huang J, Luo S, Xie Z, Xie L, Liu J. et al. Ultrasensitive electrochemical immunoassay for Avian Influenza subtype H5 using nanocomposite. PLoS ONE. 2014:9
39. Barbosa AI, Gehlot P, Sidapra K, Edwards AD, Reis NM. Portable smartphone quantitation of prostate specific antigen (PSA) in a fluoropolymer microfluidic device. Biosens Bioelectron. 2015;70:5-14
Author contact
![]() Corresponding authors: Hyun Park, MD, Ph.D: hyunpkac.kr. Kyoungsik Yu, Ph.D: ksyuedu
Corresponding authors: Hyun Park, MD, Ph.D: hyunpkac.kr. Kyoungsik Yu, Ph.D: ksyuedu