Impact Factor
- Issue 14; 2026
- Issue 13; 2026
- Issue 12; 2026
- Issue 11; 2026
- Issue 10; 2026
- Volume 16; 2026
- Advance Articles
- Past Issues
- Cover Images
- Cover Suggestion
- Index & Coverage
- Special Issues
Introduction
Materials and Methods
Results
Discussion
Conclusions
Supplementary Material
Acknowledgements
References
International Journal of Biological Sciences
International Journal of Medical Sciences
 Global reach, higher impact

Theranostics 2015; 5(6):597-608. doi:10.7150/thno.11546 This issue Cite
Research Paper
Molecular Imaging of Tumor-Infiltrating Macrophages in a Preclinical Mouse Model of Breast Cancer
Xianlei Sun1*, Duo Gao1*, Liquan Gao1, Chenran Zhang1, Xinhe Yu1, Bing Jia1, Fan Wang1,2, Zhaofei Liu1 ![]()
1. Medical Isotopes Research Center and Department of Radiation Medicine, School of Basic Medical Sciences, Peking University, Beijing 100191, China;
2. Interdisciplinary Laboratory, Institute of Biophysics, Chinese Academy of Sciences, Beijing 100101, China.
*These authors contributed equally to this work.
Received 2015-1-9; Accepted 2015-2-5; Published 2015-2-27
Abstract

Significant evidence has indicated that tumor-associated macrophages (TAMs) play a critical role in the proliferation, invasion, angiogenesis, and metastasis of a variety of human carcinomas. In this study, we investigated whether near-infrared fluorescence (NIRF) imaging using a macrophage mannose receptor (MMR; CD206)-targeting agent could be used to noninvasively visualize and quantify changes in TAMs in vivo. The CD206-targeting NIRF agent, Dye-anti-CD206, was prepared and characterized in vitro and in vivo. By using NIRF imaging, we were able to noninvasively image tumor-infiltrating macrophages in the 4T1 mouse breast cancer model. Importantly, longitudinal NIRF imaging revealed the depletion of macrophages in response to zoledronic acid (ZA) treatment. However, ZA alone did not lead to the inhibition of 4T1 tumor growth. We therefore combined anti-macrophage ZA therapy and tumor cytotoxic docetaxel (DTX) therapy in the mouse model. The results demonstrated that this combination strategy could significantly inhibit tumor growth as well as tumor metastasis to the lungs. Based on these findings, we concluded that CD206-targeted molecular imaging can sensitively detect the dynamic changes in tumor-infiltrating macrophages, and that the combination of macrophage depletion and cytotoxic therapy is a promising strategy for the effective treatment of solid tumors.
Keywords: Optical imaging, CD206, Tumor-associated macrophage, Macrophage depletion, Image-guided therapy.
Introduction
Breast cancer is a frequently diagnosed malignancy in women and is a leading cause of cancer-related deaths worldwide [1, 2]. The mortality associated with breast cancer largely results from the metastatic spread of tumor cells to vital organs such as the lung, liver, and bone [1]. Early detection and improvements in treatment strategies could substantially increase the odds of curing or controlling this disease [3].
Solid tumors, including those of breast cancer, comprise not only the malignant tumor cells, but also many surrounding cells of various types that create a unique microenvironment; this microenvironment regulates the neoplastic properties of the tumors [4, 5]. Tumor-associated macrophages (TAMs) are a set of macrophages residing in the tumor microenvironment, and TAMs promote tumor cell migration and invasion by secreting cytokines and chemokines [5, 6]. Increasing evidence from clinical and preclinical studies has indicated that TAMs promote tumor cell invasion, proliferation, survival, and metastasis to local and distant sites [7, 8]. Several clinical studies have demonstrated that increased macrophage infiltration into tumors confers metastatic potential and poor prognosis in breast cancer [9]. The important roles of TAMs in cancers suggest that it is important to develop novel therapies that target these cells [7, 9]. In addition, noninvasive imaging of macrophage infiltrates would be of great help in better understanding cancer progression and in the evaluation of cancer treatment efficacy.
TAMs are considered mainly M2-polarized macrophages, also known as non-inflammatory (“alternatively activated”) macrophages, which are distinct from inflammatory macrophages (M1, or “classically activated”) [10, 11]. Evidence has shown that the macrophage mannose receptor (MMR; CD206) is not expressed in M1 macrophages; therefore, CD206 serves as a useful marker to distinguish M2 from M1 macrophages [12, 13]. This suggests the potential for CD206-targeted TAM imaging, as well as targeted therapies. A recent study demonstrated that a radiolabeled CD206-targeting nanobody could be successfully used for single-photon emission computed tomography (SPECT) imaging of macrophages in solid tumors in vivo [14]. Further, this radiotracer can also be used for imaging joint inflammation in a mouse model of rheumatoid arthritis [15].
Zoledronic acid (ZA) is a third-generation nitrogen-containing bisphosphonate that has been approved by the US Food and Drug Administration for the treatment of cancer-induced bone disease [16]. ZA prevents and treats bone metastases in patients with solid tumors by targeting osteoclasts, which are macrophages that home to the bone [17, 18]. ZA reduces the number of tumor-associated macrophages and the amount of vascularization, thereby reducing the burden of metastases [16, 19].
In this study, we prepared a near-infrared fluorescence (NIRF) imaging agent that targets CD206, and characterized it in vitro and in vivo. Our aim was to investigate whether CD206-targeted NIRF imaging can be used to noninvasively visualize and quantify the tumor-infiltrating macrophages, and to guide ZA-based anti-macrophage therapy. In addition, we developed a therapeutic strategy that combines anti-macrophage (ZA) and anti-tumor cell (docetaxel; DTX) therapies, and investigated whether this combination strategy could be used as an effective treatment for breast cancer in a mouse model.
Materials and Methods
Preparation of the CD206-targeting NIRF imaging agent
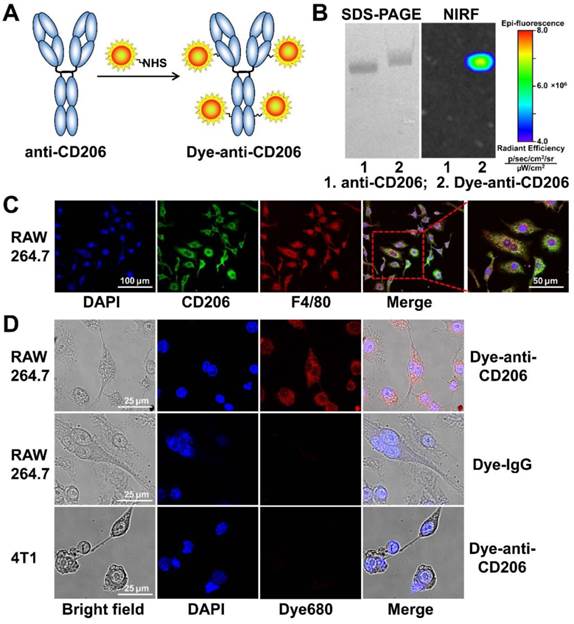
The CD206-targeting NIRF imaging agent (Figure 1A) was generated by conjugating an anti-mouse CD206 antibody (clone C068C2; IgG2a, κ isotype; BioLegend, San Diego, CA) with DyLight680 succinimidyl ester (Pierce, Rockford, IL) according to the standard protocol as previously described [20]. Briefly, antibody was mixed with the dye ester in bicarbonate buffer (pH 9.0) at a 6:1 molar ratio. After incubation for 1 h at room temperature, DyLight680-antibody conjugate (Dye-anti-CD206) was purified with a PD-10 desalting column (GE Healthcare, Piscataway, NJ) using phosphate buffered saline (PBS) as the mobile phage. The purity of Dye-anti-CD206 was determined by sodium dodecyl sulfate-polyacrylamide gel electrophoresis (SDS-PAGE), followed by NIRF imaging using a small-animal IVIS imaging system (Xenogen, Alameda, CA). The control NIRF imaging agent Dye-IgG was generated by conjugating isotype-matched control IgG (IgG2a, κ isotype; BioLegend, San Diego, CA) with DyLight680 using the same protocol.
(A) The synthesis scheme of Dye-anti-CD206. (B) SDS-PAGE and NIRF imaging of anti-CD206 antibody and Dye-anti-CD206. (C) CD206 and F4/80 staining of RAW 264.7 murine macrophage cells. (D) Direct fluorescence staining of RAW 264.7 and 4T1 cells using Dye-anti-CD206 or Dye-IgG.
Cell culture and cell staining
The 4T1 murine breast cancer and RAW 264.7 murine macrophage cells (CD206-positive [7]) were purchased from American Type Culture Collection (ATCC, Manassas, VA). Cells were grown in RPMI 1640 medium (Invitrogen, Carlsbad, CA) supplemented with 10% fetal bovine serum (FBS) at 37°C in a humidified atmosphere containing 5% CO2.
For overlay staining of CD206 and F4/80, RAW 264.7 cells grown on 35 mm MatTek glass-bottom culture dishes were incubated with rat anti-mouse CD206 (BioLegend, San Diego, CA) and rabbit anti-mouse F4/80 (Abcam, Cambridge, MA) primary antibodies for 1 h at room temperature, and then incubated with dye-conjugated secondary antibodies for 1 h. Cells were mounted with medium containing DAPI (Vector Laboratories, Burlingame, CA) and examined under a confocal microscope (Wetzler, Heidelberg, Germany).
To determine the immunoreactivity of Dye-anti-CD206, RAW 264.7 or 4T1 cells were incubated with Dye-anti-CD206 (10 nmol/L in PBS) or Dye-IgG (10 nmol/L in PBS) for 1 h at room temperature. After washing with PBS and mounting with medium containing DAPI, cells were examined under a confocal microscope.
Small-animal NIRF imaging
All animal experiments were performed in accordance with the Guidelines of Peking University Animal Care and Use Committee. The 4T1 tumor-bearing mouse model was established by subcutaneously inoculating 2×10⁶ cells into the right front flanks of female BALB/c normal mice (4~5 weeks of age; Department of Laboratory Animal Science, Peking University). To determine the in vivo tumor specificity of Dye-anti-CD206, each 4T1 tumor-bearing mouse was intravenously injected with 0.2 nmol of Dye-anti-CD206 (n = 5) or Dye-IgG (as a control; n = 5). At 2, 8, 24, and 48 h postinjection (p.i.), the mice were NIRF imaged using a small-animal IVIS imaging system (Xenogen, Alameda, CA). For each scan, an aliquot with a known amount of injectate was simultaneously imaged. The region-of-interest (ROI) was drawn for each tumor from the images by using Living Image software (Xenogen, Alameda, CA) as previously described [20, 21]. Results were expressed as the percentage of fluorescence intensity by normalizing tumor uptake values ([p/sec/cm2/sr]/[μW/cm2]) to total injection dose.
For ex vivo NIRF imaging, two groups (n = 4 per group) of 4T1 tumor-bearing mice were intravenously injected with 0.2 nmol of Dye-anti-CD206 and Dye-IgG, respectively. At 24 h p.i., the mice were sacrificed, and the blood, tumor, and major organs of each mouse were harvested, weighed, and placed on a blank paper along with an aliquot of a known amount of injectate. NIRF imaging was then performed, and the results were presented as the percentage of injected dose per gram (%ID/g).
For longitudinal NIRF imaging of tumor response to ZA using Dye-anti-CD206, two groups of 4T1 tumor-bearing mice were used (n = 5 per group). Each mouse was intraperitoneally injected with ZA (150 μg/kg in PBS, daily) or PBS (vehicle control) for 7 days (from days 0 to 6) after completing the baseline NIRF imaging scan (day 0). The animals were NIRF imaged again on days 3, 7, and 11. For each scan, mice were injected via tail vein with 0.2 nmol of Dye-anti-CD206, and NIRF imaging was performed at 24 h p.i.
Intratumoral microbiodistribution
To investigate the microdistribution of Dye-anti-CD206 in 4T1 tumor tissues, one 4T1 tumor-bearing BALB/c mouse was intravenously injected with 1 nmol of Dye-anti-CD206. At 24 h p.i., the mouse was sacrificed; the tumor was harvested, immediately frozen in optimal-cutting-temperature (OCT) medium, and then cut into 5-μm-thick slices. The tumor slices were incubated with rabbit anti-mouse F4/80 antibody (Abcam, Cambridge, MA) for 1 h at room temperature, and then visualized using fluorescein isothiocyanate (FITC)-conjugated secondary antibody under a confocal microscope. The intratumoral microdistribution of Dye-IgG (as a control) was also determined using the same protocol.
Cell proliferation and colony formation assays
Cell viability and colony formation assays were performed to investigate the effect of ZA, DTX, or both on the cytotoxicity of 4T1 tumor cells. For the cell viability assay, 4T1 cells (2 × 10³/well) were seeded in 96-well plates and incubated at 37°C overnight. Cells were then treated with increasing concentrations of ZA or DTX (with or without the combination of 1 µM ZA). After incubation at 37°C for 72 h, cell viability was determined using the Cell Counting Kit-8 (Dojindo Laboratories, Kumamoto, Japan).
For the colony formation assay, 4T1 cells (1 × 10³/well) were seeded in a 12-well plate and incubated at 37°C overnight. Cells were treated with culture medium containing the vehicle control, ZA (10 nM), DTX (10 nM), or both ZA (10 nM) and DTX (10 nM) for 48 h. Afterwards, cell culture medium was changed, and cells were allowed to grow for another 120 h at 37°C until cell colonies were visible. Cells were then stained with 0.1% Coomassie Brilliant Blue and examined by microscopy.
In vivo tumor therapy and lung metastasis examination
4T1 tumor-bearing mice with tumors approximately 150 mm3 were segregated into four groups: vehicle control (n = 24), ZA treatment (n = 24), DTX treatment (n = 8), and ZA plus DTX treatment (n = 8) groups. Animals were intraperitoneally injected with vehicle control, ZA (150 μg/kg in PBS, daily), DTX (5 mg/kg in 13% ethanol, daily), and both ZA (150 μg/kg in PBS, daily) and DTX (5 mg/kg in 13% ethanol, daily) for 7 days (from day 0 to day 6). Tumor growth was measured using a caliper, and tumor volume was calculated using the formula: volume = length × width2/2. Four mice from each of the vehicle control and ZA treatment groups were sacrificed each day on days 0, 3, 7, and 11. Tumor tissues were harvested, frozen in OCT medium, and cut into 5-μm-thick slices. Immunofluorescence staining was then performed to determine CD206 and F4/80 expression levels.
At the end (day 12) of the in vivo therapy study, tumor tissues from each group were harvested, and frozen cut into 5-μm-thick slices for immunofluorescence staining of Ki67 levels. Tumor lung metastasis was examined using a previously described method [22]. Briefly, the lungs of each mouse were filled with 15% India ink through the upper trachea and fixed in Fekete's solution (100 mL of 70% alcohol, 10 mL of 4% formalin, and 5 mL glacial acetic acid). The metastatic lesions appear as white nodules on the black lung surfaces after this procedure. After being photographed, the lungs were embedded in paraffin, cut into sections, and subjected to hematoxylin and eosin (H&E) staining.
Tissue immunofluorescence staining
Ex vivo immunofluorescence staining of 4T1 tumor or normal tissues was performed to validate the results of in vivo studies. The experiments were performed, and the staining results were analyzed by two investigators (D. Gao and C. Zhang) who were blinded to the results of in vivo NIRF imaging and tumor therapy.
For CD206 and F4/80 overlay staining, 4T1 tumor, muscle, liver, or spleen tissue slices were incubated with rat anti-mouse CD206 (BioLegend, San Diego, CA) and rabbit anti-mouse F4/80 (Abcam, Cambridge, MA) primary antibodies for 1 h at room temperature, and then visualized with Cy3- or FITC-conjugated secondary antibodies under a confocal microscope. For Ki67 staining, the tumor slices were incubated with rabbit anti-Ki67 antibody (Millipore, Billerica, MA). The slices were then visualized with Cy3-conjugated secondary antibody under a confocal microscope. After staining, 10 random views in the tumor slices were selected for the analyses. The murine CD206 expression level was calculated by measuring the integrated optical density of images of an equivalent area using a previously described method [23]. The tumor cell proliferation index was calculated as the percentage Ki67-positive cells [24].
Statistical analysis
Quantitative data are expressed as means ± SD. Data were analyzed using GraphPad version 5.0 (GraphPad Software, San Diego, CA). Differences are analyzed by Student t test or ANOVA, and results were considered statistically significant at P values of <0.05.
Results
Synthesis of Dye-anti-CD206
We synthesized the CD206-targeting NIRF imaging agent, Dye-anti-CD206, by directly conjugating the anti-CD206 antibody with a NIRF dye (Figure 1A). The dye-to-protein ratio for Dye-anti-CD206 was calculated to be 3.2 based on ultraviolet measurements of A280 and A684. By SDS-PAGE and subsequent NIRF imaging, no free dye was observed in the final product (Figure 1B), demonstrating its high purity.
In vitro cell staining
We next investigated the in vitro immunoreactivity of Dye-anti-CD206. Since CD206 is expressed on the surface of macrophages in tumor tissues rather than on the tumor cells themselves, we chose RAW 264.7 mouse macrophage cells as a CD206-positive tumor cell line. Our cell staining results clearly confirmed that RAW 264.7 cells were CD206-positive, and that these cells highly expressed F4/80 (Figure 1C), another biomarker of macrophages. We then stained the CD206-positive RAW 264.7 cells using Dye-anti-CD206. As shown in Figure 1D, Dye-anti-CD206 can specifically label the CD206-positive RAW 264.7 cells, whereas Dye-IgG was unable to stain these cells, demonstrating the CD206-specificity of Dye-anti-CD206. The 4T1 cells incubated with Dye-anti-CD206 exhibited no staining, confirming that CD206 is not expressed on the 4T1 tumor cell surface.
Biodistribution of Dye-anti-CD206 in vivo
We next determined the in vivo tumor targeting characteristics of Dye-anti-CD206 in 4T1 tumor-bearing BALB/c mice. Representative fluorescence images at different times after injection of Dye-anti-CD206 are shown in Figure 2A. Dye-IgG was used as a control. The 4T1 tumors were clearly visible with high contrast relative to the background beginning at 8 h p.i. Dye-IgG showed low tumor uptake due to the non-targeting of this agent. The quantified tumor uptake of Dye-anti-CD206 was significantly higher than that of Dye-IgG at all-time points examined (P <0.001; Figure 2B).
(A) In vivo NIRF imaging of 4T1 tumor-bearing BALB/c normal mice at 2, 8, 24, and 48 h after intravenous injection of Dye-anti-CD206 or Dye-IgG. Tumors are indicated by the dashed circles. (B) Quantification and kinetics of in vivo tumor targeting characteristics of Dye-anti-CD206 or Dye-IgG. (C) Representative images of dissected organs of 4T1 tumor-bearing mice sacrificed at 24 h after intravenous injection of Dye-anti-CD206 or Dye-IgG. (D) Quantified biodistribution of Dye-anti-CD206 and Dye-IgG in 4T1 tumor-bearing mice at 24 h postinjection. *, P <0.05; **, P <0.01.
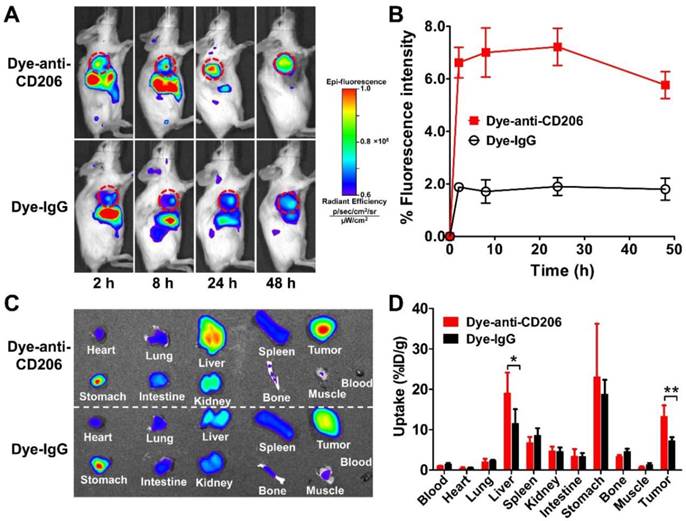
To investigate the biodistribution of Dye-anti-CD206 or Dye-IgG in the 4T1 tumors and normal tissues, we performed ex vivo NIRF imaging at 24 h p.i. in another study. Blood, tumor, and normal organs were weighed, the total fluorescence signal was determined, and the %ID/g was calculated. As shown in Figure 2C, D, the uptake of Dye-anti-CD206 in most normal organs was comparable to that of Dye-IgG. However, the tumor uptake of Dye-anti-CD206 was significantly higher than that of Dye-IgG (13.23 ± 2.78 % vs. 7.30 ± 0.84 %, P <0.01), which is consistent with the in vivo NIRF imaging data in living mice. We observed that the uptake of Dye-anti-CD206 in the liver was also significantly higher than that of Dye-IgG (19.07 ± 4.12 % vs. 11.55 ± 3.03 %, P <0.05).
Immunofluorescence staining
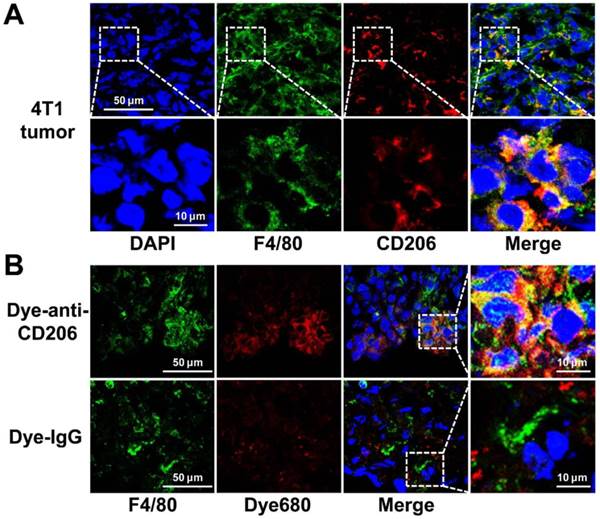
We investigated the CD206 expression patterns in 4T1 tumor tissues by immunofluorescence staining. As shown in Figure 3A, 4T1 tumor tissues were positive for both F4/80 and CD206. Overlay staining showed that most of the CD206-positive area also stained for F4/80, as expected in macrophages. The results confirmed the positive expression of CD206 in macrophages of 4T1 tumor tissues. For normal tissue examined, muscle did not express F4/80 or CD206, while liver and spleen expressed high levels of F4/80 and CD206 (Supplementary Material: Figure S1).
(A) Overlay immunofluorescence staining of F4/80 and CD206 in 4T1 tumor tissue. (B) Immunofluorescence staining of F4/80 in 4T1 tumor tissues harvested from tumor-bearing mice 24 h postinjection of Dye-anti-CD206 or Dye-IgG. Green color from FITC for murine F4/80, red color from DyLight680 (Dye680) for Dye-anti-CD206, blue color from DAPI for visualization of nuclei.
Intratumoral microbiodistribution of Dye-anti-CD206
We further investigated the intratumoral microdistribution of Dye-anti-CD206 in 4T1 tumor tissues. We harvested the tumor tissue from a 4T1 tumor-bearing mouse at 24 h p.i. of Dye-anti-CD206. The tumor tissues were stained for F4/80 to locate macrophages. As shown in Figure 3B, compared with the signals of Dye-IgG, stronger DyLight680 signals were observed in the 4T1 tumor tissues. Importantly, most of the Dye-anti-CD206-positive area was also positive for F4/80 staining, whereas the location of Dye-IgG did not show evident co-localization with F4/80. These results demonstrated the macrophage-targeted location of Dye-anti-CD206 in 4T1 tumors.
Longitudinal NIRF imaging of Dye-anti-CD206 in vivo
We performed serial NIRF imaging using Dye-anti-CD206 in the 4T1 tumor-bearing mouse model to determine whether it can be used to dynamically monitor CD206 expression during anti-macrophage therapy using ZA. NIRF scans of both control and ZA-treated 4T1 tumor mice were acquired on days 0, 3, 7, and 11. As shown in Figure 4A, Dye-anti-CD206 showed high-contrast uptake in the control and ZA-treated 4T1 tumors on day 0. With the ZA treatment, the fluorescence intensity of Dye-anti-CD206 in the ZA-treated tumors gradually decreased relative to that of the control tumors. The quantified tumor uptake of Dye-anti-CD206 in the ZA-treated tumors was significantly lower than that in the control tumors on days 3 (5.27 ± 0.86 % vs. 7.22 ± 1.36 %, P <0.05), 7 (5.40 ± 0.69 % vs. 7.63 ± 0.85 %, P <0.01), and 11 (6.27 ± 0.11 % vs. 7.76 ± 0.84 %, P <0.05) (Figure 4B). The lower tumor uptake of Dye-anti-CD206 in the ZA-treated tumors compared to that in the control tumors suggested a decrease in the expression of CD206.
Longitudinal in vivo NIRF images (A) and quantified tumor uptake (B) of 4T1 tumor-bearing mice at 24 h after Dye-anti-CD206 injection on days 0, 3, 7, and 11 after zoledronic acid (ZA; 150 μg/kg in PBS daily for 7 days) or PBS treatment (control). Tumors are indicated by the dashed circles. (C-D) Immunofluorescence staining (C) and quantified integrated optical density (IOD) expressed in relative percentages (D) of murine CD206 in 4T1 tumor tissues on days 0, 3, 7, and 11 after ZA or PBS treatment. *, P <0.05; **, P <0.01; ***, P <0.001.
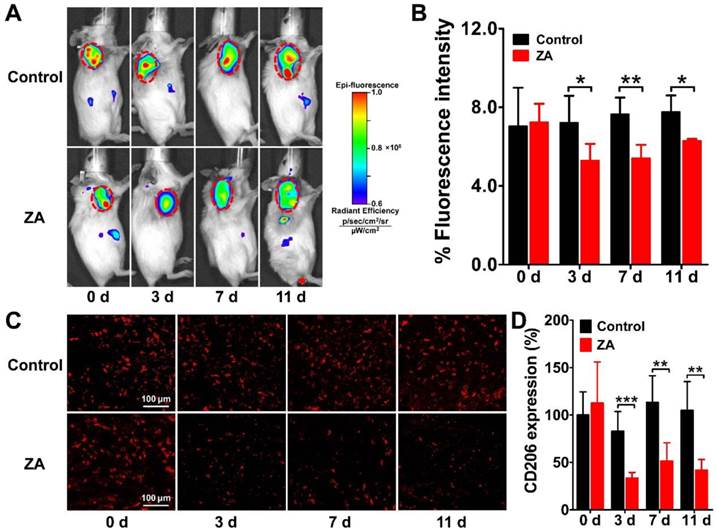
To validate the in vivo dynamic imaging results, we performed ex vivo immunofluorescence staining of both CD206 and F4/80. The overlay staining results of CD206 and F4/80 are shown in Supplementary Material: Figure S2, and the staining results for CD206 only are shown in Figure 4C. The expression of CD206 in the ZA-treated tumors was significantly lower on days 3 (33.41 ± 6.03 % vs. 82.99 ± 20.73 %, P <0.001), 7 (51.29 ± 19.50 % vs. 113.43 ± 28.04 %, P <0.01), and 11 (42.08 ± 10.91 % vs. 104.89 ± 30.49 %, P <0.01) compared to that in the control tumors (Figure 4D), which confirmed the reduction of CD206 expression in the 4T1 tumor after ZA treatment. These results demonstrated that ZA treatment can indeed result in the depletion of CD206-positive macrophages, and this depletion can be noninvasively visualized in vivo by Dye-anti-CD206 NIRF imaging.
Combined therapy using ZA and DTX
The in vitro cytotoxicity of ZA and DTX was determined in 4T1 tumor cells. As shown in Figure 5A, treatment with ZA alone did not have an evident effect on the proliferation of 4T1 cells, suggesting that ZA has no cytotoxic effect on tumor cells. In contrast, a remarkable anti-proliferation effect of treatment with DTX alone was observed, with cell viability less than 30% of the control after treatment with doses greater than 10 nM. Combined therapy using DTX and ZA showed an almost identical tumor cell inhibition curve to that of DTX alone, suggesting that there was no increase in antitumor effect when combining DTX and ZA treatment in vitro.
(A) In vitro cytotoxic effect of zoledronic acid (ZA), docetaxel (DTX), or ZA plus DTX on 4T1 tumor cells. (B-C) Photography of the 12-well-plate (B) and microscopy examination (C) of the colony formation of 4T1 cells treated with the vehicle control, ZA, DTX, or ZA plus DTX. (D) Tumor growth curves of the 4T1 tumor bearing mice after treatment with the vehicle control, ZA (150 μg/kg daily for 7 days), DTX (5 mg/kg daily for 7 days), or ZA (150 μg/kg daily for 7 days) plus DTX (5 mg/kg daily for 7 days). *, P <0.05; **, P <0.01.
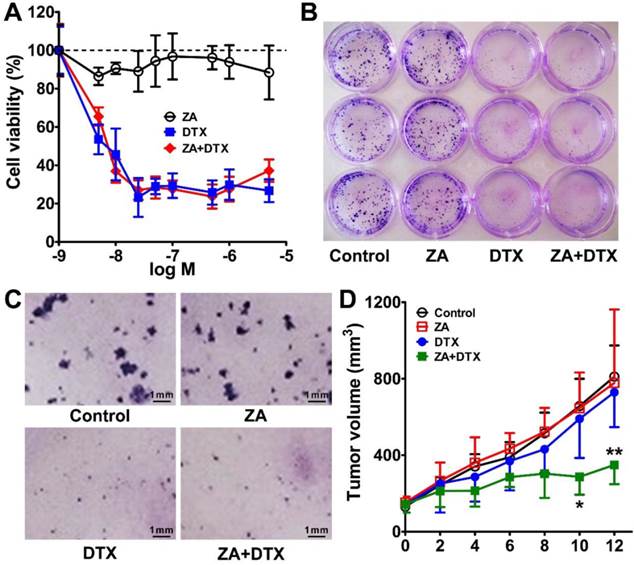
Similar results were observed in the 4T1 cell colony formation assay. As shown in Figure 5B, C, in the ZA treatment group, the cell colonies formed were comparable with that of the control group. However, DTX or both DTX and ZA treatment led to significant inhibition in the colony formation of 4T1 cells. Overall, the in vitro cell proliferation and colony formation studies demonstrated that ZA did not have an anti-tumor effect, whereas DTX had remarkable cytotoxicity in vitro.
We next moved to in vivo combined therapy studies in the 4T1 tumor-bearing mice. We chose a relatively low dose (5 mg/kg) of DTX in order to observe the antitumor effect of combined therapy. As shown in Figure 5D, the tumor growth curve in the ZA-treated group was almost identical to that in the control group. DTX treatment led to slight tumor growth inhibition on day 8, but no statistically significant difference was found in tumor growth as compared to that in the control group. In contrast, treatment with DTX plus ZA began to show a trend of therapeutic effect on day 4, and significantly less tumor growth was observed from day 10 (286.84 ± 93.42 vs. 657.09 ± 377.98 mm3; P <0.05) to day 12 (349.18 ± 100.58 vs. 810.97 ± 431.91 mm3; P <0.01) compared with that in the control group. These findings suggest that combined macrophage depletion (ZA) and cytotoxic therapy (DTX) exerted a strong therapeutic effect against 4T1 tumors in vivo.
Validation of the efficacy of combined therapy
We performed Ki67 immunofluorescence staining to examine cell proliferation in the tumors receiving ZA, DTX, or both ZA and DTX treatments. As shown in Figure 6A, B, ZA treatment did not cause a significant decrease in the cell proliferation index (P >0.05). In contrast, the cell proliferation index in the ZA and DTX combined therapy group (5.38 ± 1.07 %) was significantly lower than that in the control (46.24 ± 7.15 %; P <0.001) and DTX-treated (17.97 ± 4.76 %; P <0.05) tumors.
(A-B) Immunofluorescence staining of Ki67 (A) and percent Ki67-positive cells (B) in 4T1 tumor tissues harvested on day 12 from mice treated with vehicle (control), zoledronic acid (ZA), docetaxel (DTX), or ZA plus DTX. (C-E) Photographs of India ink-filled lungs (C), counted average of tumor metastatic lesions in the lungs (D), and the H&E staining of lung slices (E) from 4T1 tumor-bearing mice (on day 12) treated with vehicle (control), ZA, DTX, or ZA plus DTX. Tumor metastases appear as white nodules on the black lung surfaces and are indicated by red arrows. Tumor metastases in the H&E stained lung slices are indicated by the dashed circles. *, P <0.05; ***, P <0.001.
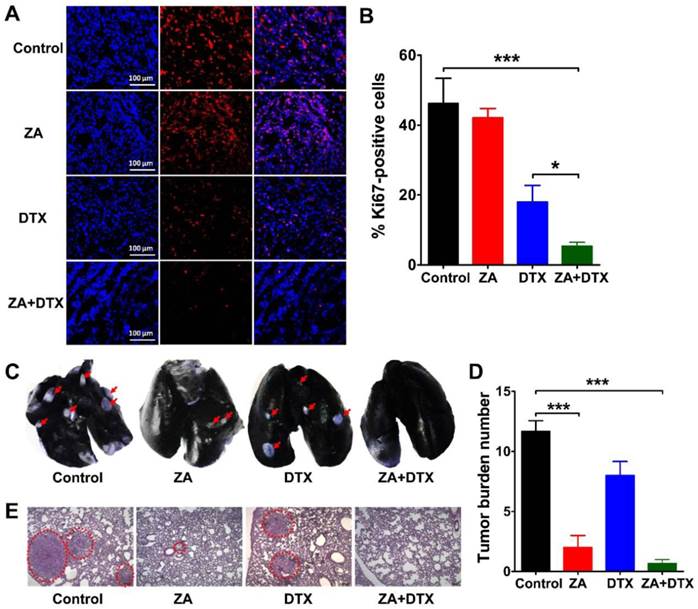
4T1 cells are highly metastatic breast cancer cells, which can lead to evident metastasis in mice after inoculation [25, 26]. Therefore, we further investigated the anti-metastatic effect of ZA, DTX, and ZA plus DTX in the 4T1 tumor-bearing mice. The representative images of the lungs and the counted numbers of metastatic lesions in different groups are shown in Figure 6C and Figure 6D, respectively. In the control group, all mice had extensive tumor metastasis in their lungs on day 12. The counted numbers of tumors in the lungs were 11.67 ± 1.52, 2.00 ± 1.73, 8.00 ± 2.00, and 0.67 ± 0.58 for the control, ZA, DTX, and ZA plus DTX groups, respectively. ZA treatment led to the formation of a significantly smaller number of lung metastatic lesions compared with that in the control group (P <0.001). No evident lung metastasis was observed in the ZA plus DTX treatment group. Histological examination by H&E staining confirmed reduction in tumor lesions after treatment with ZA or both ZA and DTX (Figure 6E). These results suggested that ZA had significant effects on the inhibition of tumor metastasis, and that ZA plus DTX almost completely inhibited metastasis of tumors to the lungs.
Discussion
In this study, we prepared a mouse CD206-targeted NIRF imaging agent, Dye-anti-CD206, and demonstrated its potential in the noninvasive visualization of TAMs in vivo by NIRF imaging using Dye-anti-CD206. We evaluated the effectiveness of Dye-anti-CD206 in the 4T1 mouse breast cancer model, in which both the macrophages and tumor cells were of murine origin. We believe that this model better mimics the clinical situation compared to a mouse model bearing human tumor xenografts. We observed that the macrophage cell line RAW 264.7, but not the 4T1 tumor cells, expressed CD206. With intratumoral microdistribution studies, we confirmed that Dye-anti-CD206 localized to the macrophages of 4T1 tumor tissues (Figure 3B).
Due to the pivotal roles of TAMs in the progression, invasion, and metastasis of cancers, several pioneering studies have recently been conducted to develop radiolabeled agents for the molecular imaging of TAMs in animal models. Movahedi et al. [14] reported the development of 99mTc-labled anti-CD206 nanobodies for in vivo SPECT imaging of TAMs. High CD206 specificity of 99mTc-labled anti-CD206 nanobodies was observed in solid tumors, which demonstrated the possibility for CD206-targeted imaging of TAM subpopulations in vivo [14]. Besides anti-CD206 nanobodies, several nanoparticles modified by the natural ligand of CD206, mannose, were also investigated for TAM-targeted imaging [27] and molecular image-guided delivery of chemical drugs [28]. Compared with radiotracers that have been described previously [14, 15, 27], NIRF imaging agents like Dye-anti-CD206 are relatively low cost. Their synthesis is also straightforward and does not carry the risk of radiation exposure. Moreover, fluorescence imaging is polychromatic, which allows multicolor imaging using fluorophores with different emission wavelengths [29, 30]. Agents to target the 4T1 tumor cells were not available to us; therefore, we decided to test two-color imaging in the A549 tumor-bearing nude mouse model, in which the A549 cells are human epidermal growth factor receptor 2 (HER2)-positive [31], and the tumor-infiltrating macrophages are CD206-positive (Supplementary Material: Figure S3B). Through simultaneous HER2-specific (using DyLight755 labeled anti-HER2 antibody [Dye755-anti-HER2]) and CD206-specific (using Dye-anti-CD206) NIRF imaging, we could simultaneously image tumor cells and macrophages in vivo (Figure S3A). By ex vivo fluorescence staining, we demonstrated that no overlay was found between HER2 and CD206 (Figure S3B), thus confirming the distinct expression of these markers in tumor cells and tumor infiltrating macrophages, respectively. These results further confirmed that the imaging agent Dye-anti-CD206 binds in vivo to TAMs but not to tumor cells.
By using in vivo NIRF imaging, we demonstrated the specific targeting of Dye-anti-CD206 in 4T1 tumor tissues, as evidenced by the significantly higher tumor uptake of Dye-anti-CD206 compared to that of Dye-IgG (Figure 2A, B). Since fluorescence imaging has limitations in tissue penetration and fluorescence intensity quantification [32], we performed ex vivo biodistribution studies to validate the in vivo imaging results. Ex vivo biodistribution results were consistent with the results of in vivo imaging in the living animals, showing significantly higher tumor uptake of Dye-anti-CD206 compared to the isotype-matched control (Figure 2C, D). A previous study [14] using 99mTc-labled anti-CD206 nanobodies have demonstrated high uptake in the spleen due to the high CD206 expression in this organ (Supplementary Material: Figure S1). Surprisingly, in the ex vivo biodistribution study we did not observe a significant uptake of Dye-anti-CD206 in the spleen. This result was consistent with that of a recently published study [28], which also showed low uptake of a CD206-targeted agent in the spleen in vivo, despite the spleen showing strong staining for CD206. This phenomenon may be explained by different kinetics of the CD206-targeted probes in the tumor and the spleen due to the distinct physiological properties (e.g., blood flow, vascular permeability, and physiologic pressure) of these organs. The CD206-positive macrophages in the tumor and the spleen may also differ significantly as a result of differences in their microenvironments. In addition, we only determined the in vivo biodistribution of Dye-anti-CD206 at one time point (24 h), which may not have captured the peak uptake of this probe in the spleen. In future studies, long-term observation (e.g. from 1 h to 240 h) of the in vivo behaviors of Dye-anti-CD206 may be needed to better characterize the uptake of this optical imaging probe in normal organs.
In contrast to the spleen, the liver, another high CD206-expressing organ (Supplementary Material: Figure S1), showed high and specific accumulation of Dye-anti-CD206, as evidenced by the significantly higher uptake of Dye-anti-CD206 compared to that of Dye-IgG in this organ (Figure 2D). Niu et al. [28] recently also showed that depletion of macrophages by ZA led to a reduction in signal from the CD206-targeted fluorescent nanoparticles in the liver. However, in a recent study [33], it was shown that the vast majority of CD206-positive cells in the liver are CD31-positive endothelial cells (rather than macrophages) and that macrophage depletion did not lead to signal reduction in the liver. A possible explanation for the discordance in these results is that the liver is not only a CD206-positive organ, but also a clearance organ, so that the signal-carrying macromolecules such as the intact antibody (used in this study) and nanoparticles (used in [28]) are cleared via the hepatic route.
In this study, we examined the effect of ZA treatment in the 4T1 tumor-bearing mouse model. ZA has been demonstrated to decrease the number of tumor-infiltrating macrophages [34, 35]; also, more specifically, to be able to deplete TAMs by reverting the polarization of macrophages from an M2 to an M1 phenotype [36, 37]. By immunofluorescence staining, we observed that ZA treatment led to the depletion of CD206-positive macrophages (Figure 4C). However, the F4/80-positive macrophages did not show an identical trend as CD206-positive macrophages in responding to ZA treatment (Supplementary Material: Figure S2), which may result from the fact that ZA treatment can not only lead to the depletion of M2 macrophages, but can also repolarize macrophages from M2 to M1.
The noninvasive quantification of macrophage levels is key to visualizing tumor progression and responses to therapy. We thus performed longitudinal imaging to visualize the changes in macrophage numbers upon ZA treatment, and found that the depletion of macrophages could be noninvasively visualized by Dye-anti-CD206 NIRF imaging in vivo (Figure 4A). To the best of our knowledge, this is the first report of noninvasive and long-term dynamic imaging of macrophages in vivo. This finding will be valuable in the real-time monitoring of macrophages in the tumor microenvironment, in facilitating investigations of the cross-talk between tumor cells and infiltrating macrophages, in developing new anti-macrophage drugs, and in elucidating mechanisms that underlie the development of tumor microenvironments.
Although ZA can lead to the depletion of macrophages and inhibit tumor metastasis to the lung, we found that ZA treatment did not cause the inhibition of tumor growth directly (Figure 5D). Therefore, we decided to introduce combined therapy to effectively inhibit tumor growth along with its ability to metastasize. We chose the cytotoxic agent DTX because we hypothesized that combined therapy for attacking tumor cells and the tumor microenvironment would be beneficial. The results of the in vivo combined therapy study clearly supported our hypothesis, as combined therapy exhibited remarkably improved antitumor effects in vivo. Importantly, the ex vivo cell proliferation assay and metastasis examination confirmed that combined therapy can lead to significant inhibition of tumor cell proliferation, as well as significant inhibition of tumor cell metastasis to the lungs. These results highlighted the benefits of this combination strategy for better management of tumors by targeting the tumor cells and tumor microenvironment simultaneously, and suggested that this combination strategy holds promise as an effective treatment for solid tumors.
Conclusions
In this study, we prepared a CD206-targeting NIRF imaging agent, Dye-anti-CD206, and demonstrated that NIRF imaging using this agent would allow noninvasive visualization of tumor-infiltrating macrophages in vivo in a breast cancer mouse model. In addition, we found that depletion of macrophages in the 4T1 mouse model was not sufficient to inhibit tumor growth. Instead, combined macrophage depletion and cytotoxic tumor therapy could lead to a remarkable antitumor effect. The results presented in this study provide valuable information for developing clinical therapies for solid tumors, including those of breast cancer.
Supplementary Material
Supplementary Methods, Fig.S1 - S3.
Acknowledgements
This work was supported, in part, by “973” projects (2013CB733802 and 2011CB707705), National Natural Science Foundation of China (NSFC) projects (81222019, 81125011, 81471712, 81371614, and 81321003), grants from Beijing Natural Science Foundation (7132131 and 7132123), and a grant from Beijing Nova Program (Z121107002512010).
Competing Interests
The authors have declared that no competing interest exists.
References
1. Weigelt B, Peterse JL, van 't Veer LJ. Breast cancer metastasis: markers and models. Nat Rev Cancer. 2005;5:591-602
2. Jemal A, Siegel R, Ward E. et al. Cancer statistics, 2009. CA Cancer J Clin. 2009;59:225-49
3. Berry DA, Cronin KA, Plevritis SK. et al. Effect of screening and adjuvant therapy on mortality from breast cancer. N Engl J Med. 2005;353:1784-92
4. Noy R, Pollard JW. Tumor-associated macrophages: from mechanisms to therapy. Immunity. 2014;41:49-61
5. Pollard JW. Tumour-educated macrophages promote tumour progression and metastasis. Nat Rev Cancer. 2004;4:71-8
6. Pollard JW. Macrophages define the invasive microenvironment in breast cancer. J Leukoc Biol. 2008;84:623-30
7. Luo Y, Zhou H, Krueger J. et al. Targeting tumor-associated macrophages as a novel strategy against breast cancer. J Clin Invest. 2006;116:2132-41
8. Condeelis J, Pollard JW. Macrophages: obligate partners for tumor cell migration, invasion, and metastasis. Cell. 2006;124:263-6
9. Tang X. Tumor-associated macrophages as potential diagnostic and prognostic biomarkers in breast cancer. Cancer Lett. 2013;332:3-10
10. Mantovani A, Sozzani S, Locati M. et al. Macrophage polarization: tumor-associated macrophages as a paradigm for polarized M2 mononuclear phagocytes. Trends Immunol. 2002;23:549-55
11. Ruffell B, Affara NI, Coussens LM. Differential macrophage programming in the tumor microenvironment. Trends Immunol. 2012;33:119-26
12. Ezekowitz RA, Gordon S. Alterations of surface properties by macrophage activation: expression of receptors for Fc and mannose-terminal glycoproteins and differentiation antigens. Contemp Top Immunobiol. 1984;13:33-56
13. Choi KM, Kashyap PC, Dutta N. et al. CD206-positive M2 macrophages that express heme oxygenase-1 protect against diabetic gastroparesis in mice. Gastroenterology. 2010;138:2399-409 409 e1
14. Movahedi K, Schoonooghe S, Laoui D. et al. Nanobody-based targeting of the macrophage mannose receptor for effective in vivo imaging of tumor-associated macrophages. Cancer Res. 2012;72:4165-77
15. Put S, Schoonooghe S, Devoogdt N. et al. SPECT imaging of joint inflammation with Nanobodies targeting the macrophage mannose receptor in a mouse model for rheumatoid arthritis. J Nucl Med. 2013;54:807-14
16. Green JR. Antitumor effects of bisphosphonates. Cancer. 2003;97:840-7
17. Teitelbaum SL. Bone resorption by osteoclasts. Science. 2000;289:1504-8
18. Berenson JR, Rosen LS, Howell A. et al. Zoledronic acid reduces skeletal-related events in patients with osteolytic metastases. Cancer. 2001;91:1191-200
19. Rogers MJ, Gordon S, Benford HL. et al. Cellular and molecular mechanisms of action of bisphosphonates. Cancer. 2000;88:2961-78
20. Liu Z, Sun X, Liu H. et al. Early assessment of tumor response to gefitinib treatment by noninvasive optical imaging of tumor vascular endothelial growth factor expression in animal models. J Nucl Med. 2014;55:818-23
21. Sun X, Ma T, Liu H. et al. Longitudinal monitoring of tumor antiangiogenic therapy with near-infrared fluorophore-labeled agents targeted to integrin alphavbeta3 and vascular endothelial growth factor. Eur J Nucl Med Mol Imaging. 2014;41:1428-39
22. Liang C, Diao S, Wang C. et al. Tumor metastasis inhibition by imaging-guided photothermal therapy with single-walled carbon nanotubes. Adv Mater. 2014;26:5646-52
23. Sun X, Yan Y, Liu S. et al. 18F-FPPRGD2 and 18F-FDG PET of response to Abraxane therapy. J Nucl Med. 2011;52:140-6
24. Zhang F, Zhu L, Liu G. et al. Multimodality imaging of tumor response to doxil. Theranostics. 2011;1:302-9
25. Yoneda T, Michigami T, Yi B. et al. Actions of bisphosphonate on bone metastasis in animal models of breast carcinoma. Cancer. 2000;88:2979-88
26. Samoszuk M, Corwin MA. Mast cell inhibitor cromolyn increases blood clotting and hypoxia in murine breast cancer. Int J Cancer. 2003;107:159-63
27. Locke LW, Mayo MW, Yoo AD. et al. PET imaging of tumor associated macrophages using mannose coated 64Cu liposomes. Biomaterials. 2012;33:7785-93
28. Niu M, Naguib YW, Aldayel AM. et al. Biodistribution and in vivo activities of tumor-associated macrophage-targeting nanoparticles incorporated with doxorubicin. Mol Pharm. 2014;11:4425-36
29. Barrett T, Koyama Y, Hama Y. et al. In vivo diagnosis of epidermal growth factor receptor expression using molecular imaging with a cocktail of optically labeled monoclonal antibodies. Clin Cancer Res. 2007;13:6639-48
30. Yang L, Sajja HK, Cao Z. et al. uPAR-targeted optical imaging contrasts as theranostic agents for tumor margin detection. Theranostics. 2013;4:106-18
31. Ma T, Sun X, Cui L. et al. Molecular imaging reveals trastuzumab-induced epidermal growth factor receptor downregulation in vivo. J Nucl Med. 2014;55:1002-7
32. Kobayashi H, Ogawa M, Alford R. et al. New strategies for fluorescent probe design in medical diagnostic imaging. Chem Rev. 2010;110:2620-40
33. Zheng F, Devoogdt N, Sparkes A. et al. Monitoring liver macrophages using nanobodies targeting Vsig4: Concanavalin A induced acute hepatitis as paradigm. Immunobiology. 2015;220:200-9
34. Melani C, Sangaletti S, Barazzetta FM. et al. Amino-biphosphonate-mediated MMP-9 inhibition breaks the tumor-bone marrow axis responsible for myeloid-derived suppressor cell expansion and macrophage infiltration in tumor stroma. Cancer Res. 2007;67:11438-46
35. Zhang W, Zhu XD, Sun HC. et al. Depletion of tumor-associated macrophages enhances the effect of sorafenib in metastatic liver cancer models by antimetastatic and antiangiogenic effects. Clin Cancer Res. 2010;16:3420-30
36. Coscia M, Quaglino E, Iezzi M. et al. Zoledronic acid repolarizes tumour-associated macrophages and inhibits mammary carcinogenesis by targeting the mevalonate pathway. J Cell Mol Med. 2010;14:2803-15
37. Veltman JD, Lambers ME, van Nimwegen M. et al. Zoledronic acid impairs myeloid differentiation to tumour-associated macrophages in mesothelioma. Br J Cancer. 2010;103:629-41
Author contact
![]() Corresponding author: Zhaofei Liu, Ph.D., Medical Isotopes Research Center and Department of Radiation Medicine, School of Basic Medical Sciences, Peking University, Beijing 100191, China. Phone: +86-10-82802871; Fax: +86-10-82802871; E-mail: liuzfedu.cn.
Corresponding author: Zhaofei Liu, Ph.D., Medical Isotopes Research Center and Department of Radiation Medicine, School of Basic Medical Sciences, Peking University, Beijing 100191, China. Phone: +86-10-82802871; Fax: +86-10-82802871; E-mail: liuzfedu.cn.