Impact Factor
 Global reach, higher impact
Theranostics 2015; 5(3):267-276. doi:10.7150/thno.10349 This issue Cite
Research Paper
Serum Fucosylated Prostate-specific Antigen (PSA) Improves the Differentiation of Aggressive from Non-aggressive Prostate Cancers
Qing Kay Li ![]() , Li Chen, Ming-Hui Ao, Joyce Hanching Chiu, Zhen Zhang, Hui Zhang, Daniel W Chan
, Li Chen, Ming-Hui Ao, Joyce Hanching Chiu, Zhen Zhang, Hui Zhang, Daniel W Chan
Departments of Pathology, The Johns Hopkins Medical Institutions, Baltimore, MD 21287, USA.
Received 2014-8-16; Accepted 2014-11-1; Published 2015-1-1
Abstract
Background: Clinically, it is still challenging to differentiate aggressive from non-aggressive prostate cancers (Pca) by non-invasive approaches. Our recent studies showed that overexpression of alpha (1-6) fucosyltransferase played an important role in Pca cells. In this study, we have investigated levels of glycoproteins and their fucosylated glycoforms in sera of Pca patients, as well as the potential utility of fucosylated glycoproteins in the identification of aggressive Pca.
Material and Methods: Serum samples from histomorphology-proven Pca cases were included. Prostate-specific antigen (PSA), tissue inhibitor of metallopeptidase 1 (TIMP1) and tissue plasminogen activator (tPA), and their fucosylated glycoforms were captured by Aleuria Aurantia Lectin (AAL), followed by the multiplex magnetic bead-based immunoassay. The level of fucosylated glycoproteins was correlated with patients' Gleason score of the tumor.
Result: Among three fucosylated glycoproteins, the fucosylated PSA was significantly increased and correlated with the tumor Gleason score (p<0.05). The ratio of fucosylated PSA showed a marked increase in aggressive tumors in comparison to non-aggressive tumors. ROC analysis also showed an improved predictive power of fucosylated PSA in the identification of aggressive Pca.
Conclusions: Our data demonstrated that fucosylated PSA has a better predictive power to differentiate aggressive tumors from non-aggressive tumors, than that of native PSA and two other glycoproteins. The fucosylated PSA has the potential to be used as a surrogate biomarker.
Keywords: prostate cancer, multiplex immunoassay, fucosylated glycoprotein, prostate-specific antigen, TIMP1.
Introduction
Prostate cancer (Pca) is the most common cancer of men in the United States and worldwide [1]. Although the estimated new cases in the United States will exceed 200,000 annually [1], the majority of Pca is presented as a localized and/or slow-growing disease, which does not need invasive treatments [2]. Currently, prostate-specific antigen (PSA) is the most commonly used serum biomarker for the detection of Pca in high risk populations [3-6]. However, there are controversies regarding its clinical usefulness and benefits for prostate cancer patients [2,6,7]. The European Randomized Study of Screening for Prostate Cancer (ERSPC) revealed a 20% reduction of mortality in prostate cancer patients, but also demonstrated a high overdiagnostic rate in the screening populations [4]. Whereas, the United States Prostate, Lung, Colorectal, and Ovarian (PLCO) cancer screening trial revealed no statistically significant differences of cumulative mortality rates between screening population and controls [5]. Recently, the US Preventive Services Task Force (USPSTF) has recommended against serum PSA-based screening for Pca (Grade D rating) [7]. Limitations of the serum PSA, such as lack of sensitivity and specificity, are well documented during clinical practices [2, 4-7]. It is also well-known that the outcome of Pca patients correlates with the clinical behavior of the tumor, and serum PSA cannot be used reliably to differentiate slow-growing tumors from aggressive fatal tumors in Pca patients [4-11]. Thus, this causes the clinical problem of under-treatment of aggressive tumors (AG), and over-treatment of non-aggressive tumors (NAG) [4-11].
In recent years, tremendous efforts have been focused on the discovery of novel biomarkers to improve the detection of Pca, particularly in the differentiation of aggressive subtypes of Pca from slow growing non-aggressive subtypes [6,8,11-14]. Several new biomarkers have been reported, including serum markers of human kallikrein 2, tissue markers of urokinase-type plasminogen activator receptor (uPAR), α-methylacyl-CoA-racemase (AMACR), urine markers of uPAR, TMPRSS2-ERG, and others [8, 11-14]. However, clinical utilities of these biomarkers are still under evaluation or in the validation phase. Other clinical tests, including non-invasive tests (serum proPSA as part of the prostate health index (phi) and urine prostate cancer antigen 3 (PCA3)), and invasive tests (using tumor tissue) such as Oncotype DX and Prolaris score (offered by the CLIA certified laboratories), have been approved by the US Food and Drug Administration and are used in the clinical practice [6]. However, none of these markers and/or tests including serum PSA can be reliably used to distinguish AG from NAG Pca.
Glycosylation is one of the most common post-translation modifications of proteins and plays an important role in cellular functions and cancer biology [15-21]. Studies have shown that aberrant glycosylations occur in many intracellular signaling pathways and eventually lead to the development of cancers [15-21]. Currently, most clinical cancer biomarkers are glycoproteins, such as PSA for Pca [3-5], alpha-fetoprotein (a-AFP) for hepatocellular carcinoma (HCC) [22], and carbohydrate antigen 125 (CA125) for ovarian cancer [23, 24]. It has been suggested that specific glycoforms of glycoproteins may be involved in a particular disease and/or subtype of cancers. For example, AFP-L3 is a core-fucosylated glycoform of AFP detected in serum of HCC patients, and it provides better specificity for diagnosing HCC [25]. Aberrant glycosylation of glycoproteins has also been related to accelerated tumor growth and the development of metastasis in a variety of cancers [26], features seen in aggressive cancers. Taken together, these findings indicate that specific glycoforms of glycoproteins have the potential to be used as biomarkers not only to improve the diagnostic accuracy of cancer, but also to detect AG tumors.
In this study, we analyzed serum samples from Pca patients using multiplex immunoassay, based on lectin-affinity capturing of fucosylated glycoprotein and protein-antibody immunoreactivity. Levels of glycoproteins and their fucosylated glycoforms were measured and correlated with the Gleason score of the tumor. The purposes of our study are to identify fucosylated glycoproteins in serum samples from Pca patients, and to evaluate their potential clinical utilities in the differentiation of AG from NAG tumors.
Materials and methods
Serum sample collection
Serum samples from 47 Pca patients were collected from the Johns Hopkins hospitals. All patients had either biopsy or surgical resection of the tumor. The criteria of the International Society of Urological Pathology (ISUP) Consensus were used to determine Gleason scores of tumors [9]. Serum samples were aliquoted and stored at -80°C prior to the analysis. Each serum sample underwent no more than three freeze/thaw cycles prior to the test. The clinical information, including serum PSA levels and the Gleason score of the tumor were correlated. The use of clinical samples was approved by the Johns Hopkins Institutional Review Board. All study cases were annotated with available clinical information in a manner that protected patient identities.
Reagents
Agarose-bound Aleuria Aurantia Lectin (AAL) beads were purchased from Vector Labs (Burlingame, CA). Multiscreen filter plates were from Millipore (Billerica, MA). Bio-Plex ProTM magnetic COOH beads, amine coupling kits, and cytokine assay kits were purchased from Bio-Rad Laboratories (Hercules, CA). Biotinylated AAL was purchased from Vector Labs (Burlingame, CA). Biotinylated detection antibody was prepared with Thermo Scientific (Rockford, IL) EZ-link Sulfo-NHS-Biotin (Catalog #21326).
Human recombinant PSA (Catalog #PO725), human PSA mouse monoclonal antibody (Catalog #MP077-BP001) for capture, and biotinylated mouse monoclonal antibody (Catalog #MP007-AP002S) for detection were purchased from Scripps Laboratories (San Diego, CA). Mouse myeloma cell line NS0-derived human recombinant TIMP1 (Catalog #970-TM-010), human TIMP1 mouse monoclonal IgG2B antibody (Catalog #MAB970, clone #63515) for capture, and biotinylated human TIMP1 goat polyclonal IgG antibody (Catalog # BAF970) for detection were purchased from R&D Systems (Minneapolis, MN). Chinese Hamster ovary cell line CHO-derived human recombinant tPA protein (Catalog #ab92637), human tPA mouse monoclonal antibody (Catalog # ab82249) for capture, and biotinylated human tPA rabbit polyclonal IgG antibody (Catalog #ab28208) for detection were purchased from Abcam (Cambridge, MA).
Capture of fucosylated glycoproteins
Agarose AAL Lectin beads were deposited, 100µl per well, into multiscreen filter plates and subsequently washed three times with 150µl of a sample diluent (from the Cytokine Assay Kit) as the binding buffer via the centrifugation. Multiscreen filter plates containing agarose beads were then mixed well with the sample diluent on a shaker for 10 minutes and centrifuged at 2700 rpm for 5 minutes to remove the solution. Thirty microliter of serum sample was diluted with the sample diluent at 1:4 ratios to a total volume of 120 µl. Then, diluted sera at 120 µl per well were added to multiscreen filter plates containing agarose beads and incubated on a shaker for 1 hour at the room temperature. After incubation, the flow through was collected by centrifuging at 2700 rpm for 5min. Then, AAL beads were washed three times with sample diluent to remove non-specific bindings. Target glycoproteins were eluted out with 120µl of 100 mM fucose in sample diluent by gentle shaking on a shaker for 1hr and elution was collected by centrifugation.
Detection of glycoproteins
Following manufacturer's protocol, capture antibodies of PSA, TIMP1 and tPA were coupled to Bio-Plex ProTM magnetic COOH beads using the BioRad Amine Coupling Kit. The magnetic beads were validated with IgG antibodies and determined its beads concentration with hemocytometer before storage at 4˚C.
Fifty microliter of the serum samples obtained using the AAL glycoprotein capturing method stated above were incubated with 2500 coupled magnetic beads per antibody for 1 hour at the room temperature. Prior to perform the multiplex assay, biotinylated detection antibody of PSA, TIMP1 and tPA were prepared and diluted to 2µg/mL with a detection antibody diluent (supplied in the Cytokine Assay kit). After incubation of samples with magnetic beads, the beads were washed and incubated with 25µl of detection antibody mixture for 30 minutes at the room temperature. Once again, beads were washed before incubation with 50µL of 2µg/mL streptavidin-phycoerythrin for 10 minutes at the room temperature. After washing steps, the individual glycoprotein was analyzed by the multiplex assays using the Bioplex 200 System.
For the multiplex immunoassay, three calibration curves were established using 8 calibrators of 100, 25, 6.25, 1.56, 0.39, 0.1, 0.025, and 0 ng/mL of human recombinant PSA, tPA or TIMP1. The same calibrators were used for the comparison of multiplex and single immunoassays. Calibration curves for protein quantification were established using the 5-parameter nonlinear regression model of Bio-Plex Manager™ 6.0. Protein concentrations were calculated using calibration curves and reported by Bio-Plex Manager™ 6.0.
Data Analysis
The ratio (percentage) of fucosylated glycoproteins was calculated by using the value of individual fucosylated glycoprotein against its total value in the serum. The statistical analysis and linear regression were performed by the KaleidaGraph (version 4.5.0, Synergy Software). The predictive power of individual glycoprotein was assessed using the receiver operating characteristics (ROC) curve. The value of area under curve (AUC) was calculated as an indication of the accuracy prediction. The ROC curves were generated using the program written in Matlab. Kolmogorov-Smirnove test (K-S test) was used to compare the result of two ROC analyses. A P-value of <0.05 was considered as statistically significant.
Results
Clinical information
A total of 47 histomorphology-proven Pca patients were included in our study. The average age of patients was 60.0±7.9 years (ranged from 44 to 79 years). The average level of serum PSA was 15.13±2.14 ng/mL, ranging from 1.9 to 54.5 ng/mL. Among patients, 29.8% tumors (n=14) were Gleason score 6, 27.7% (n=13) were Gleason score 7, 21.3% (n=10) were Gleason score 8, and 21.3% (n=10) were Gleason score 9. Gleason scores of 47 tumors at the initial diagnosis and patients' corresponding serum PSA levels were summarized in Table 1. Average levels of serum PSA in the Gleason score 6, 7, 8 and 9 were 9.3±2.1, 6.1±1.5, 19.9±4.7 and 30.2±5.5 ng/mL. Our data also demonstrated that serum PSA was not always elevated in high Gleason score tumors as indicated in Table 1. For example, the serum PSA level in the Gleason score 6 tumor ranged from 1.9 to 26.6 ng/mL, whereas, the average serum PSA level in the Gleason score 9 tumor ranged from 2.2 to 54.5 ng/mL.
Correlation of Gleason scores of tumors with patients' age and serum PSA levels.
| Cases | Gleason Score of the tumor Number (%) | Patients Age Average±SD (range) years | Serum PSA Level X±SE (range) ng/mL | |
|---|---|---|---|---|
| Pca (n=47) | Gleason Score 6 | 14 (29.8%) | 59.4±6.8 (49-72) | 9.3±2.1 (1.9-26.6) |
| Gleason Score 7 | 13 (27.7%) | 60.1±5.9 (50-74) | 6.1±1.5 (2.1-21.1) | |
| Gleason Score 8 | 10 (21.3%) | 58.8±7.6 (44-79) | 19.9±4.7 (3.2-49.7) | |
| Gleason Score 9 | 10 (21.3%) | 62.7±8.12 (49-75) | 30.2±5.5 (2.2-54.5) | |
Pca: prostate cancer. PSA: prostate-specific antigen.
Serum glycoproteins and their fucosylated forms in Pca patients
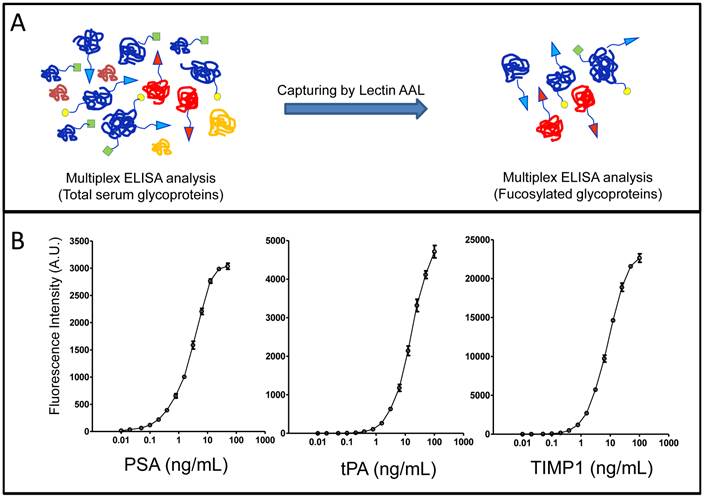
Glycoproteins in sera of Pca patients were analyzed using our recently developed the multiplex immunoassay with modifications [27]. The system contains two steps, lectin AAL affinity capture and monoclonal antibody detection, based on protein sequences and glycan structure/linkage (e.g. core α1-6- and α1-3-linked fucosylation). Briefly, AAL lectin beads were used to capture glycoproteins containing fucosylated glycans, then, individual glycoprotein was identified by protein-antibody immunoassay (Figure 1A). The standard curves of individual glycoprotein were established using human recombinant PSA, TIMP1 and tPA, and were used for quantifications of serum glycoproteins (Figure 1B). By using this approach, we were able to detect not only candidate glycoproteins in the serum but also their fucosylated forms.
The detection of glycoproteins and their fucosylated forms in sera from Pca patients. (A), workflow of multiplex immunoassays. (B), standard curves of immunoassays for candidate glycoproteins.
Levels of glycoprotein PSA, TIMP1 and tPA, and their fucosylated forms, were summarized in the Table 2. Average serum levels of PSA, TIMP1 and tPA were 15.13±2.14 ng/mL, 80.80±4.44 ng/mL and 4.89±0.32 ng/mL, average levels of fucosylated PSA, TIMP1 and tPA were 6.27±1.99 ng/mL, 25.34±1.84 ng/mL and 1.59±0.13 ng/mL, whereas, the % fucosylated PSA, TIMP1 and tPA were 27.01%±3.62%, 34.42%±2.83% and 33.95%±1.94%.
Serum levels of glycoproteins and their fucosylated glycoforms in prostate cancer patients detected by multiplex immunoassay.
| Glycoproteins X±SD (range) ng/mL | Fucosylated form X±SD (range) ng/mL | % Fucosylated X±SD (range) | |
|---|---|---|---|
| PSA | 15.13±2.14 (1.93-54.47) | 6.27±1.99 (0.24-8.76) | 27.01%±3.62% (8.31%-170.06%) |
| TIMP1 | 80.80±4.44 (40.75-173.41) | 25.34±1.84 (8.28-58.36) | 34.42%± 2.83% (8.66%-92.87%) |
| tPA | 4.89±0.32 (1.12-10.39) | 1.59±0.13 (0.47-5.82) | 33.95%± 1.94% (18.31%- 80.06%) |
PSA: prostatic-specific antigen; TIMP1: tissue inhibitor of metallopeptidase 1; tPA: tissue plasminogen activator; Pca: prostate carcinoma.
Correlation of serum glycoproteins with tumor Gleason scores
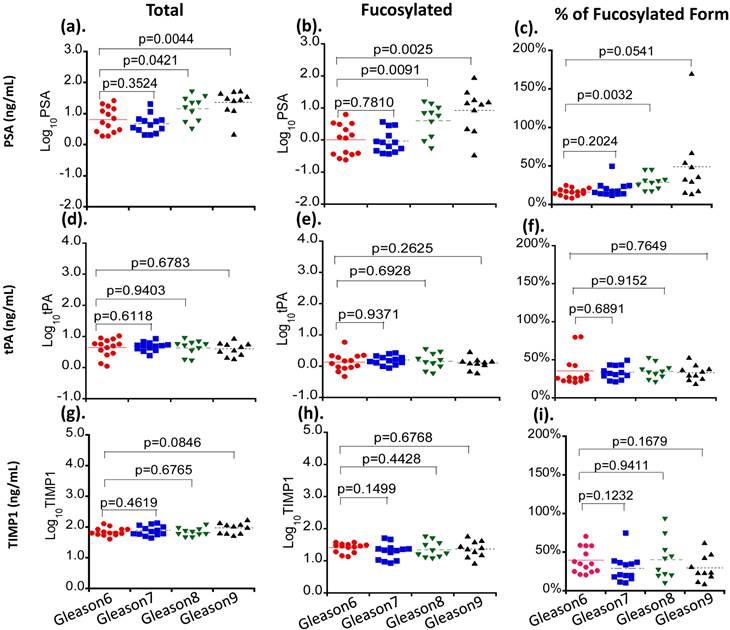
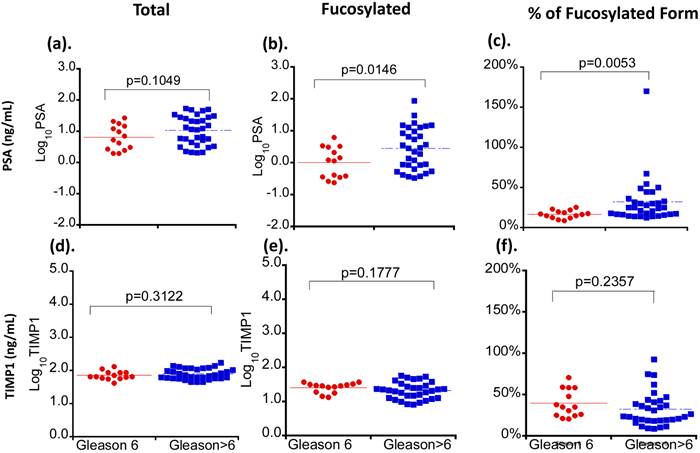
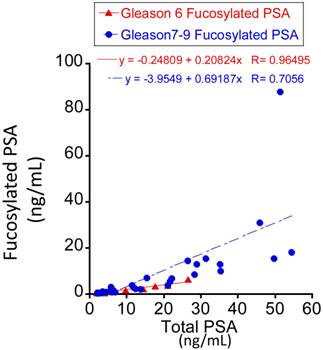
Three serum glycoproteins of PSA, TIMP1 and tPA showed variable levels in Pca patient sera when correlated with patients' tumor Gleason scores (Figure 2). For total and fucosylated PSA, their levels correlated with the Gleason score of tumors. In particular, fucosylated PSA and % fucosylated PSA levels showed significant differences between patients with Gleason score >6 tumors and tumors with Gleason score equal to 6 (p values of 0.0146 and 0.0053 respectively) (Table 3 and Figure 3). The correlation coefficient of total serum PSA versus fucosylated PSA in patients with different Gleason scores was summarized in Figure 4. Levels of total PSA and fucosylated PSA showed strong correlation coefficients in both groups of Gleason score 6 and Gleason score >6 tumors. Slopes of the linear equation in Gleason 6 and >6 group were quite different, 0.208 and 0.692, respectively.
The correlation of serum levels of PSA, TIMP1 and tPA with tumor Gleason scores. Different serum glycoproteins are shown in panel a, d and g. Different fucosylated glycoproteins are shown in panel b, e and h. Percentages of fucosylated glycoproteins are shown in panel c, f and i. Colored lines indicate mean values in each group.
Correlation of serum glycoproteins and their fucosylated glycoforms with tumor Gleason scores in prostate cancer patients.
| Serum glycoproteins X±SE, ng/mL | Fucosylated form X±SE, ng/mL | % of Fucosylated form X±SE | |||||||
|---|---|---|---|---|---|---|---|---|---|
| Gleason 6 | Gleason 7-9 | P value | Gleason 6 | Gleason 7-9 | P value | Gleason 6 | Gleason 7-9 | P value | |
| PSA | 9.32±2.14 | 17.59±2.82 | 0.1049 | 1.69±0.46 | 8.21±2.76 | 0.0146 | 16.3±1.3 | 34.9±5.4 | 0.0053 |
| TIMP1 | 73.56±6.33 | 83.88±5.70 | 0.3122 | 26.73±2.09 | 24.76±2.48 | 0.1777 | 39.2±4.4 | 32.4±3.6 | 0.2357 |
| tPA | 5.20±0.76 | 4.67±0.33 | 0.9812 | 1.66±0.35 | 1.55±0.12 | 0.8275 | 34.9±5.4 | 33.6±1.6 | 0.8552 |
PSA: prostatic-specific antigen; TIMP1: tissue inhibitor of metallopeptidase 1; tPA: tissue plasminogen activator; Pca: prostate cancer.
The correlation of serum levels of PSA and TIMP1 with tumor Gleason scores. Different serum glycoproteins are shown in panel a and d. Different fucosylated glycoproteins are shown in panel b and e. Percentages of fucosylated glycoproteins are shown in panel c and f. Colored lines indicate mean values in each group.
The correlation coefficient of total serum PSA versus fucosylated PSA between the Gleason score 6 and >6 tumors.
For TIMP1, total levels of the protein were not significantly changed among tumors with different Gleason scores (Table 3, Figure 2 and Figure 3). Although the fucosylated form showed a decreased trend in patients with Gleason score >6 tumors, it did not reach the statistical significance (P>0.05) (Table 3). Similar to TIMP1, tPA did not show significant changes of either total or fucosylated form between Gleason score >6 and Gleason 6 tumors (P>0.05) (Table 3, Figure 2 and Table 3).
Taken together, our data demonstrated that PSA, including its native and fucosylated form, was clearly superior to that of TIMP1 and tPA in the separation of Gleason score >6 tumors from Gleason score 6 tumors. These changes of PSA were correlated significantly with tumor Gleason scores (Figure 2, Table 3). It was also interesting that the ratio of fucosylated PSA was significantly elevated in Pca patients.
Fucosylated PSA in the differentiation of Gleason score >6 from Gleason score 6 tumors
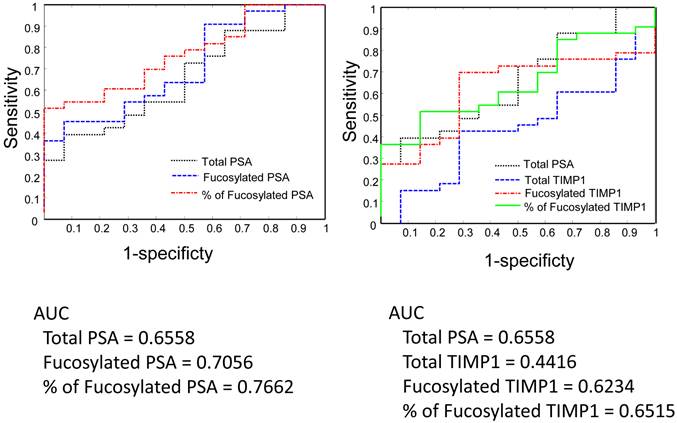
We analyzed serum PSA, fucosylated PSA, and the ratio of fucosylated PSA (fucosylated PSA/total PSA) in the differentiation of Gleason score >6 from 6 tumors by receive operating characteristic (ROC) curves (Figure 5 and Figure 6). We also compared the performance of PSA with TIMP1, since the fucosylated TIMP1 showed variable changes in Pca.
Serum PSA, TIMP1 and their fucosylated forms in the separation of Gleason score 6 and Gleason score 7-9 tumors by the receive operating characteristic (ROC) analysis.
Serum PSA, TIMP1, and their fucosylated forms in the separation of Gleason score 6 and Gleason score 8-9 by the receive operating characteristic (ROC) analysis.
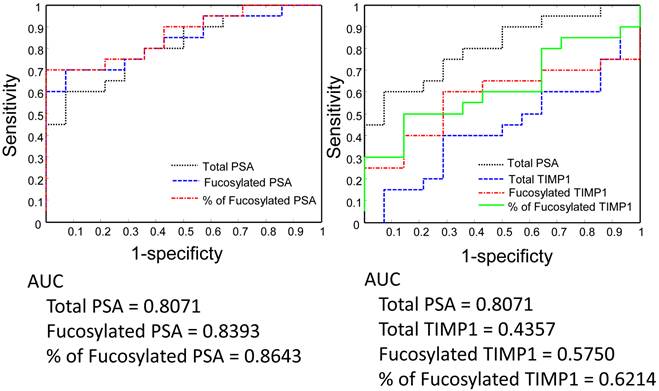
Between Gleason score 6 and Gleason score >6 tumors, the fucosylated PSA achieved a better predictive power (AUC=0.7056) when compared with the total serum PSA (AUC= 0.6558) (Figure 5). Moreover, by using the ratio of fucosylated PSA as predictive marker, it achieved even better performance when compared with the total serum PSA (AUC=0.7762, P<0.05, P=0.036) (Figure 5). We further investigated the performance of fucosylated PSA and the ratio of fucosylated PSA in the differentiation of Gleason score 8-9 tumors from Gleason score 6 tumors by the ROC analysis (Figure 6). They showed significantly higher predictive powers (AUC=0.8393 and 0.8643, respectively, P<0.05). Our data demonstrated that the fucosylated PSA, particularly the ratio of fucosylated PSA, could improve the predictive power and might provide additional information in the differentiation of Gleason score >6 from Gleason score 6 tumors (P<0.05).
In comparison to PSA, native TIPM1 had a suboptimal performance (AUC=0.4416) (Figure 5). Similarly, both fucosylated TIMP1 and the ratio of fucosylated TIMP1 showed better predictive powers (AUC=0.6234 and 0.6515, respectively). However, the overall performance of fucosylated TIMP1was still suboptimal when compared to the fucosylated PSA (Figure 5 and Figure 6).
Discussion
The recent US Prostate, Lung, Colorectal, and Ovarian Cancer Screening Trial (PLCO) had shown that among clinically diagnosed Pca, 77.2% of them were Gleason score 6 tumors and 22.8% were Gleason score great than 6 tumors [2]. Pca with the Gleason score 6 or less is considered as a clinically indolent/non-aggressive tumor, which is unlikely to cause significant symptoms or mortality [9,28-30]. Pca with the Gleason score greater than 6, particularly those with the Gleason score great than 7 tumor is considered to be an AG tumor which needs an optimal clinical management [9,28-30]. Evaluation of the tumor's Gleason score is an invasive biopsy procedure, which has the risk of developing serious complications [4, 5, 7, 29, 30]. Clinically, it is notoriously difficult to separate aggressive tumors from indolent low Gleason score non-aggressive tumors without invasively biopsying of the tumor tissue.
Although a high level of serum PSA has been considered an indicator of a clinical aggressive tumor, our study and others have shown that not all patients with aggressive tumors have elevated levels of serum PSA. We have compared levels of serum PSA in prostate cancer patients with their individual Gleason score (Table 1 and Figure 2) as well as in groups (i.e. Gleason score 6 versus >Gleason score 6 in Figure 3). Levels of serum PSA increased as the tumor Gleason score increased, particularly in Gleason score 8 and 9 tumors (Table 1 and Figure 2), however, if we compared serum PSA of Gleason score 6 tumor (non-aggressive tumor) with Gleason score >6 tumor (aggressive tumor), serum PSA levels were not significantly different (P> 0.05, P=0.1049 in Figure 3). Our data were consistent with previous reports (shown in reference 2, 4-7) that serum PSA had a limited ability in the separation of aggressive tumors from non-aggressive tumors. Furthermore, the United States Preventive Services Task Force (USPSTF) has recently recommended against PSA-based screening for Pca (Grade D rating) due to over-diagnosis (approximately 80% of PSA test results were false-positive when cutoff values from 2.5 to 4.0 ug/L were used) [4], and lack of evidence to improve Pca patient survival [7]. Thus, it is crucial to differentiate aggressive tumors from non-aggressive tumors using a non-invasive approach to guide the optimal management of the Pca patient.
In addition of analyzing serum levels of PSA, TIMP1 and tPA, we also investigated their fucosylated glycoforms in Pca patients using the multiplex immunoassay, and correlated levels of these serum glycoproteins with the Gleason score of the tumor. All Pca patients in our study had either biopsy proven or surgical resection of the tumor, which confirmed the histological diagnosis and the Gleason score of the tumor. By analyzing total serum PSA, TIMP1, and tPA, and their AAL-bound fucosylated glycoproteins in well-annotated prostate cancer patients, we demonstrated that levels of fucosylated PSA, TIMP1, tPA were differentially present. Among these fucosylated glycoproteins, changes of TIMP1 and tPA as well as their fucosylated forms were not significantly different between Gleason score <6 and >6 tumors (P>0.05). Only fucosylated PSA wa significantly elevated and positively correlated with the tumor Gleason score. The fucosylated PSA was 1.69±0.46 ng/mL in patients with Gleason score 6 tumors, and 8,21±2.76 ng/mL in patients with Gleason score >6 tumors (p<0.05).
Based on above findings, we further analyzed the ratio of fucosylated PSA in total serum PSA, and find that the ratio of fucosylated PSA was 16.3%±1.3% in Gleason score 6 tumors and 34.9%±5.4% in Gleason score >6 tumors, respectively (P<0.01). ROC analyses showed that the fucosylated PSA achieved a better predictive power for identification of AG tumors (Gleason score >6 tumors, AUC=0.7056) when compared with the total serum PSA (AUC=0.6558) as well as other fucosylated glycoproteins. Moreover, by using the ratio of fucosylated PSA as predictive marker, it achieved even more significantly better performance for the identification of AG tumors, representing in Gleason score of 8-9 group (AUC=0.8643, P<0.05). Our findings indicated that the measurement of fucosylated PSA, particularly the ratio of fucosylated PSA might provide a valuable clinical information to aid in the separation of AG from NAG tumor without biopsying the tumor. The detection of the ratio of fucosylated PSA in serum is a minimally invasive procedure, therefore, it may be used as a surrogate test to separate AG/high Gleason score tumors from NAG tumors and to guide optimal clinical management for Pca patients.
Our data showed a relatively wider distribution of fucosylated PSA than native PSA (Figure 3b). This could be caused by several reasons. Frist, the native PSA might not be equally fucosylated, i.e. some native PSA were heavily fucosylated, showing higher values and causing a wider distribution of data. Second, it might be caused by the analytic bias, i.e. the sensitivity of the detection method might need to be further improved. Finally, our findings were based on a small sample size, a larger scale study might be necessary to further validate our findings.
In Pca, several recent studies using mass spectrometry (MS)-based proteomics have found that glycoproteins, including tissue inhibitor of metallopeptidase 1 (TIMP1), tissue plasminogen activator (tPA) and membrane metallo-endopeptidase (MME), and dipeptidyl peptidase-IV (DPP-4) are differentially expressed in Pca tumor tissue [31, 32]. Recently, we developed a novel multiplex detection system to further analyze these glycoproteins and their glycoforms in tumor tissues as potential candidate biomarkers for the separation of AG from NAG; we found that several aberrant glycosylations of these proteins were present in tumor tissues [27, 33]. For example, increased β1-6 branching of N-glycans and α1-2 fucosylation was detected by phytohemagglutinin-L (PHA-L) and ulex europaeus agglutinin (UEA) lectin affinity chromatography [27,33]. Others using quantitative real-time polymerase chain reaction (RT-PCR) analysis of glycosyltransferases in Pca cell lines and tumor tissue demonstrated elevated mRNA levels of fucosyltransferase 1 (Fut1) genes in cancer cases [34]. Saldova R, et al reported that levels of core-fucosylated biantennary glycans were significantly increased in serum from Pca patients [35]. Several recent studies have also demonstrated the aberrant fucosylation in Pca [36, 37]. Kyselova et al. described a significant increase in fucosylation in 24 Pca patients' sera in comparison to 10 healthy control males, and the elevated fucosylation was found in metastatic Pca [37]. Our recent study demonstrated that the overexpression of fucosyltransferase (FUT8) in prostate cancer tissues, the major enzyme responsible for alpha (1,6) core fucosylation, correlated with high Gleason scores of tumors, and could be detected in metastatic Pca [38]. These studies demonstrated that fucosylation plays an important role in Pca, and elevated level of fucosylated PSA in the serum could represent the aggressiveness of prostate cancer. For the first time, we demonstrated that fucosylated serum PSA could be used to distinguish the aggressive prostate cancer from non-aggressive cancer.
In addition to fucosylated PSA, other glycoforms of PSA can also be detected in the serum of Pca patients. For example, sialylated PSA has been detected in the serum of Pca patients [33]. The sialylated PSA has been shown to be better in the detection of higher grade Pca than that of native PSA by ROC analysis (AUC=0.54). However, in the current study fucosylated PSA appeared to be better than sialylated PSA in the detection of aggressive Pcas as indicated by the ROC analysis (AUC=0.7056). Taken together, these data suggest that glycosylation of PSA is promising and further validation will be useful.
In summary, we used a non-invasive approach and analyzed serum fucosylated glycoproteins from Pca patients using multiplex immunoassays, based on AAL lectin-affinity capturing and protein-antibody immunoreactivity. Our data demonstrated that the fucosylated PSA was elevated and correlated with tumor Gleason scores. Both fucosylated PSA and the ratio of fucosylated PSA have better predictive powers to separate Gleason score >6 tumors (representing aggressive Pca) than that of native PSA and other fucosylated glycoproteins. Our data suggested that the fucosylated PSA had the potential to be used as a biomarker to separate aggressive from non-aggressive prostate cancers.
Acknowledgements
This work is partially supported by Drs. Ji & Li Family Cancer Research Foundation (QKL); and by National Cancer Institute, The Early Detection Research Network (EDRN grant U01CA152813 (HZ) and U24CA115102 (DWC)) and The Clinical Proteomic Tumor Analysis Consortium (CPTAC U24CA160036) (DWC, HZ, ZZ). We thank Ms. Makeda Heard for her assistance in proofreading the manuscript.
Competing Interests
The authors have declared that no competing interest exists.
References
1. Siegel R, Ma J, Zhou Z, Jemal A. Cancer statistics, 2014. CA Cancer J Clin. 2014;64:9-29
2. Taylor KL, Luta G, Miller AB. et al. Long-term disease-specific functioning among prostate cancer survivors and noncancer controls in the prostate, lung, colorectal, and ovarian cancer screening trial. J Clin Oncol. 2012;30:2768-75
3. Chan DW, Bruzek DJ, Oesterling JE, Rock RC, Walsh PC. Prostate-specific antigen as a marker for prostatic cancer: a monoclonal and a polyclonal immunoassay compared. Clin. Chem. 1987;33:1916-20
4. Schröder FH, Hugosson J, Roobol MJ. et al. Screening and prostate-cancer mortality in a randomized European study. N Engl J Med. 2009;360:1320-28
5. Andriole GL, Crawford ED, Grubb RL 3rd. et al. Prostate cancer screening in the randomized Prostate, Lung, Colorectal, and Ovarian Cancer Screening Trial: mortality results after 13 years of follow-up. J Natl Cancer Inst. 2012;104:125-32
6. Sartori DA, Chan DW. Biomarkers in prostate cancer: what's new? Curr Opin Oncol. 2014;26:259-64
7. Screening for Prostate Cancer: US Preventive Services Task Force recommendation statement. US Preventive Services Task Force. http://www.uspreventiveservicestaskforce.org/prostatecancerscreening/prostatefinalrs.htm
8. Prensner JR, Rubin MA, Wei JT, Chinnaiyan AM. Beyond PSA: the next generation of prostate cancer biomarkers. Sci Transl Med. 2012;4(127):127rv3
9. Epstein JI, Allsbrook WC Jr, Amin MB, Egevad LL; ISUP Grading Committee. The 2005 International Society of Urological Pathology (ISUP) Consensus Conference on Gleason Grading of Prostatic Carcinoma. Am J Surg Pathol. 2005;29:1228-42
10. Gulati R, Gore JL, Etzioni R. Comparative effectiveness of alternative prostate-specific antigen--based prostate cancer screening strategies: model estimates of potential benefits and harms. Ann Intern Med. 2013;158:145-53
11. Tradonsky A, Rubin T, Beck R, Ring B, Seitz R, Mair S. A search for reliable molecular markers of prognosis in prostate cancer: a study of 240 cases. Am J Clin Pathol. 2012;137:918-30
12. Nogueira L, Corradi R, Eastham JA. Other biomarkers for detecting prostate cancer. BJU Int. 2010;105:166-9
13. Martin SK, Vaughan TB, Atkinson T, Zhu H, Kyprianou N. Emerging biomarkers of prostate cancer. Oncol Rep. 2012;28:409-17
14. Oon SF, Fanning DM, Fan Y. et al. The identification and internal validation of a preoperative serum biomarker panel to determine extracapsular extension in patients with prostate cancer. Prostate. 2012;72:1523-31
15. Gilgunn S, Conroy PJ, Saldova R, Rudd PM, O'Kennedy RJ. Aberrant PSA glycosylation. A sweet predictor of prostate cancer. Nat Rev Urol. 2013;10:99-107
16. Helenius A, Aebi M. Intracellular functions of N-linked glycans. Science. 2001;291:2364-9
17. Rudd PM, Elliott T, Cresswell P, Wilson IA, Dwek RA. Glycosylation and the immune system. Science. 2001;291:2370-6
18. Drake PM, Cho W, Li B. et al. Sweetening the pot: adding glycosylation to the biomarker discovery equation. Clin. Chem. 2010;56:223-36
19. Tian Y, Zhang H. Characterization of disease-associated N-linked glycoproteins. Proteomics. 2013;13:504-11
20. Dube DH, Bertozzi CR. Glycans in cancer and inflammation--potential for therapeutics and diagnostics. Nat Rev Drug Discov. 2005;4:477-88
21. Meany DL, Chan DW. Aberrant glycosylation associated with enzymes as cancer biomarkers. Clin Proteomics. 2011;8:7
22. Taketa K, Endo Y, Sekiya C. et al. A collaborative study for the evaluation of lectin-reactive alpha-fetoproteins in early detection of hepatocellular carcinoma. Cancer Res. 1993;53:5419-23
23. Carlson KJ, Skates SJ, Singer DE. Screening for ovarian cancer. Ann Intern Med. 1994;121:124-32
24. Jacobs I, Bast RC Jr. The CA 125 tumor-associated antigen: a review of the literature. Hum Reprod. 1989;4:1-12
25. Li D, Mallory T, Satomura S. AFP-L3: a new generation of tumor marker for hepatocellular carcinoma. Clin Chim Acta. 2001;313:15-9
26. Gorelik E, Galili U, Raz A. On the role of cell surface carbohydrates and their binding proteins (lectins) in tumor metastasis. Cancer Metastasis Rev. 2001;20:245-77
27. Li D, Chiu H, Chen J, Zhang H, Chan DW. Integrated analyses of proteins and their glycans in a magnetic bead-based multiplex assay format. Clin Chem. 2013;59:315-24
28. Gleason DF, Mellinger GT. Prediction of prognosis for prostatic adenocarcinoma by combined histological grading and clinical staging. J. Urol. 1974;111:58-64
29. Heidenreich A, Bastian PJ, Bellmunt J. et al. EAU guidelines on prostate cancer. part 1: screening, diagnosis, and local treatment with curative intent-update 2013. Eur Urol. 2014;65:124-37
30. Makarov DV, Trock BJ, Humphreys EB. et al. Updated nomogram to predict pathologic stage of prostate cancer given prostate-specific antigen level, clinical stage, and biopsy Gleason score (Partin tables) based on cases from 2000 to 2005. Urology. 2007;69:1095-101
31. Liu AY, Zhang H, Sorensen CM, Diamond DL. Analysis of prostate cancer by proteomics using tissue specimens. J Urol. 2005;173:73-8
32. Li Y, Tao SC, Bova GS. et al. Detection and verification of glycosylation patterns of glycoproteins from clinical specimens using lectin microarrays and lectin-based immunosorbent assays. Anal Chem. 2011;83:8509-16
33. Meany DL, Zhang Z, Sokoll LJ, Zhang H, Chan DW. Glycoproteomics for prostate cancer detection: changes in serum PSA glycosylation patterns. J Proteome Res. 2009;8:613-9
34. Fukushima K, Satoh T, Baba S, Yamashita K. alpha1,2-Fucosylated and beta-N-acetylgalactosaminylated prostate-specific antigen as an efficient marker of prostatic cancer. Glycobiology. 2010;20:452-60
35. Saldova R, Fan Y, Fitzpatrick JM, Watson RW, Rudd PM. Core fucosylation and alpha2-3 sialylation in serum N-glycome is significantly increased in prostate cancer comparing to benign prostate hyperplasia. Glycobiology. 2011;21:195-205
36. Tabares G, Radcliffe CM, Barrabes S. et al. Different glycan structures in prostate-specific antigen from prostate cancer sera in relation to seminal plasma PSA. Glycobiology. 2006;16:132-45
37. Kyselova Z, Mechref Y, Al Bataineh MM. et al. Alterations in the serum glycome due to metastatic prostate cancer. J Proteome Res. 2007;6:1822-32
38. Wang XC, Chen J, Li QK. et al. Overexpression of alpha (1,6) fucosyltransferase associated with aggressive prostate cancer. Glycobiology. 2014;24:935-44
Author contact
![]() Corresponding author: Qing Kay Li MD. PhD. Associate Professor, Department of Pathology, The Johns Hopkins Medical Institutions, Johns Hopkins Bayview Medical Center, Baltimore, MD 21224. Phone: 410-550-0671. Fax: 410-550-0075 Email: qli23edu.
Corresponding author: Qing Kay Li MD. PhD. Associate Professor, Department of Pathology, The Johns Hopkins Medical Institutions, Johns Hopkins Bayview Medical Center, Baltimore, MD 21224. Phone: 410-550-0671. Fax: 410-550-0075 Email: qli23edu.