Impact Factor
 Global reach, higher impact
Theranostics 2015; 5(2):206-217. doi:10.7150/thno.9847 This issue Cite
Research Paper
Ultrasound Molecular Imaging of Vascular Endothelial Growth Factor Receptor 2 Expression for Endometrial Receptivity Evaluation
Hongmei Liu1, 2 *, Yihan Chen1, 2 *, Fei Yan1, 3, 4 ![]() , Xiaohua Han1, Junru Wu5, Xin Liu3, Hairong Zheng1, 3, 6
, Xiaohua Han1, Junru Wu5, Xin Liu3, Hairong Zheng1, 3, 6 ![]()
1. Department of Ultrasonography, The Third Affiliated Hospital of Southern Medical University, Guagnzhou, China;
2. Institute of Musculoskeletal Medical Imaging, Academy of Orthopaedics in Guangdong Province, Guagnzhou, China;
3. Paul C. Lauterbur Research Center for Biomedical Imaging, Institute of biomedical and Health Engineering, Shenzhen Institutes of Advanced Technology, Chinese Academy of Sciences, Shenzhen, China;
4. Shenzhen Key Laboratory for Molecular Imaging, Shenzhen, China.
5. Department of Physics, University of Vermont, Burlington, VT, USA.
6. Shenzhen Key Laboratory of Nanobiomechanics, Shenzhen Institutes of Advanced Technology, Chinese Academy of Sciences, Shenzhen, China.
*Both authors contributed equally to this manuscript.
Received 2014-6-8; Accepted 2014-10-5; Published 2015-1-1
Abstract

Purpose: Ultrasound (US) molecular imaging by examining the expression of vascular endothelial growth factor receptor 2 (VEGFR2) on uterus vascular endothelium was applied to evaluate the endometrial receptivity.
Methods: VEGFR2-targeted ultrasound contrast agents (UCA) and the control UCA (without VEGFR2) were prepared and characterized. Adhesion experiment in vitro was performed with mouse microvascular endothelial cells (bEnd.3) and the ratio of the number of UCA to that of cells at the same field was compared. In vivo study, randomized boluses of targeted or control UCA were injected into the animals of non-pregnancy (D0), pregnancy on day 2 (D2) and day 4 (D4), respectively. Sonograms were acquired by an ultrasound equipment with a 40-MHz high-frequency transducer (Vevo 2100; VisualSonics, Toronto, Canada). The ultrasonic imaging signals were quantified as the video intensity amplitudes generated by the attachment of VEGFR2-targeted UCA. Immunoblotting and immunofluorescence assays were used for confirmation of VEGFR2 expression.
Results: Our results showed that VEGFR2-targeted UCA could bind to bEnd.3 cells with significantly higher affinity than the control UCA (9.8 ± 1.0 bubbles/cell versus 0.7 ± 0.3 bubbles/cell, P < 0.01) in vitro. The mean video intensity from the US backscattering of the retained VEGFR2-targeted UCA was significantly higher than that of the control UCA in D2 and D4 mice (D2, 10.5 ± 2.5 dB versus 1.5 ± 1.1 dB, P < 0.01; D4, 15.7 ± 4.0 dB versus 1.5 ± 1.2 dB, P < 0.01), but not significantly different in D0 mice (1.0 ± 0.8 dB versus 0.9 ± 0.6 dB, P > 0.05). Moreover, D4 mice showed the highest video intensity amplitude, indicating the highest VEGFR2 expression when compared with D2 and D0 mice (P < 0.01). This was further confirmed by our immunoblotting and immunofluorescence experiments.
Conclusion: Ultrasound molecular imaging with VEGFR2-targeted UCA may be used for noninvasive evaluation of endometrial receptivity in murine models.
Keywords: Endometrial receptivity, Ultrasound molecular imaging, Vascular endothelial growth factor receptor 2.
Introduction
In vitro fertilization (IVF) is a common and effective alternative reproductive technology which assists women become pregnant. However, more than half cases still fail to implant due to the inadequate endometrial receptivity, even the transferred embryos are apparently normal [1]. Endometrial receptivity, also called the 'window' of implantation, refers to the state of the endometrium when the endometrial epithelium is structurally and functionally ready to accept the embryo for implantation [2-4]. Normally, it is a spatiotemporally restricted window. This period begins 6-8 days after the luteinizing hormone (LH) surges and lasts about 48 h in humans [1]. In mice, the window is only opened around midnight on day 4 of pregnancy (day 1 = vaginal plug) [5]. Since endometrial receptivity is considered the primary factor to determine the pregnancy rate of IVF, how to evaluate the receptivity of endometrium becomes challenge to improve the rate of embryo implantation in reproductive medicine.
In the clinical practice, assessment of endometrial receptivity mainly relies on endometrial biopsy, ultrasonography, and biochemical detection of various markers such as serum estrogen/progesterone and their receptors, VEGF and their receptors, leukemia inhibitor factor, epidermal growth factor, hCG, ανβ3 and so on [6]. Indeed, endometrial biopsy and biochemical detection of these markers can provide microarchitecture and molecular biological information. But the invasiveness nature of these techniques has made them unwelcome in the clinical context during the reproduction treatment cycles. Ultrasonography is an alternative non-invasive method and has been used to assess endometrial receptivity for many years in the clinical setting. Many characteristics, such as endometrial thickness, endometrial pattern, uterine blood flow and endometrial volume can be visibly detected and used to assess endometrial receptivity. However, the diagnostic criteria from conventional ultrasonography have been not been standardized and its accuracy has been always questioned [7-10].
Nowadays, ultrasound molecular imaging has emerged as a promising non-invasive imaging strategy for biological processes at the molecular level. It can not only provide morphological changes of tissues or organs, but also provide cellular and molecular anomalies. Taking advantage of this technology, various diseases or disorders such as arteriosclerosis [11], thrombosis [12], inflammations [13], as well as tumor angiogenesis [14, 15] have been characterized and evaluated.
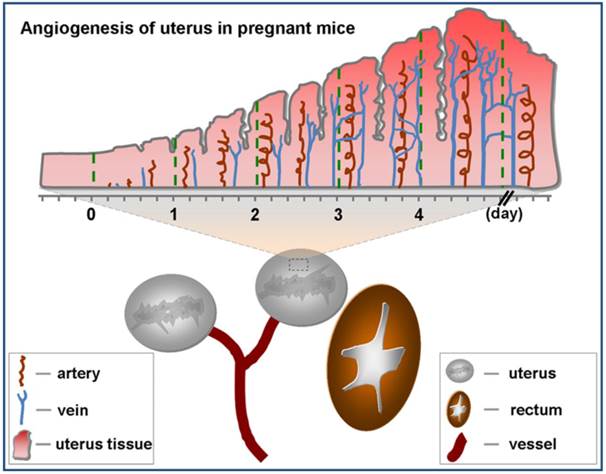
Angiogenesis is considered a critical component of normal implantation in early stages of pregnancy [16]. Upon fertilization, angiogenesis which primarily occurs in the uterus makes endometrium fertile enough to receive the embryo (Fig.1). Klauber et al indicated that administration of angiogenetic inhibitor before or after implantation in mice resulted in resorption of all embryos [17]. As a marker of angiogenesis, VEGFR2 is one of significant and necessary molecular signals for endometrial receptivity [18]. Douglas NC et al demonstrated that decidual vascular density and stromal cell differentiation were decreased and the progression of pregnancy was disrupted after blocking with anti-VEGFR2 antibody [19].
Angiogenesis of uterus in pregnant mice. There are two uteruses near bladder in mice. Angiogenesis of uterus rarely occurs before pregnancy (day 0). Upon pregnancy, angiogenesis of uterus springs up and uterus comes into prereceptive stage (day 1-3). Along with angiogenesis, uterus becomes receptive (day 4) from prereceptive stage.
VEGFR2-targeted UCA is able to characterize in vivo the VEGFR-2 expression and has been used in various preclinical models related to angiogenesis [20-26]. In the present study, we hypothesized that ultrasound molecular imaging via VEGFR2-targeted UCA would detect and evaluate endometrial receptivity noninvasively. The VEGFR2-targeted UCA were prepared and the effectiveness to detect endometrial angiogenesis and to evaluate endometrial receptivity was examined.
Materials and Methods
Materials
1,2-distearoyl-sn-glycero-3-phosphatidylcholine (DSPC), 1,2-distearoyl-sn-glycero-3-phosphoethanolamine-N-[Methoxy(Polyethyleneglycol)-2000](DSPE-PEG2000) and 1,2-distearoyl-sn-glycero-3-phosphoethanolamine-N-[Biotinyl(PolyethyleneGlycol)2000] (DSPE-PEG2000-Biotin) were purchased from Avanti Polar Lipids Inc. (Alabaster, AL,USA). Avidin and DiI (red) were obtained from Sigma-Aldrich (St. Louis, MO, USA). Biotinylated anti-mouse CD309 (FLK1) antibody, anti-mice CD31 (PECAM-1) antibody and fluorescein isothiocyanate (FITC)-labeled anti-rat IgG2a antibody were purchased from eBiosciences (San Diego, CA, USA). Rabbit anti-mouse VEGF receptor 2 antibody and HRP-linked goat anti-rabbit IgG antibody were purchased from Cell Signaling (Cell Signaling Technology Inc., Danvers, MA). Goat anti-rabbit IgG conjugated to Cy3 antibody was obtained from Biorbyt (Biorbyt Limited, Cambridge, UK). All other reagents were of analytical grade. Mice brain microvascular endothelial cells (bEnd.3) were purchased from the American Type Culture Collection (Manassas, VA, USA). Female and male KM mice, weighing about 30 g (8-10 weeks old), were obtained from medical experimental animal center of Guangdong province. (Guangzhou, China).
Preparation of targeted-UCA and control UCA
The targeted-UCA and control UCA were prepared according to previous report [27]. In brief, DSPC: DSPE-PEG2000: DSPE-PEG2000-biotin (molar ratios = 9:0.5:0.5) were blended in chloroform and the solvent was removed under nitrogen flow at room temperature, followed by vacuum treatment over 2 h. The dried blends were hydrated at 60℃ with phosphate buffered saline (PBS), and sub-packaged into vials (1 mL each vial). After that, perfluoropropane (C3F8; Flura, Newport, TN, USA) was added and the admixture was mechanically vibrated for 45 s. The resulting biotinylated-UCA were rinsed and incubated with avidin (3 μg avidin per 107 bubbles according to Bachmann C, et al [28]) in a 20-mL syringe. After washing to eliminate free avidin, these UCA (about 9.8×10⁸ microbubbles) were further incubated with 30 μg biotinylated anti-mouse VEGFR2 antibodies (clone Avas12a1) or biotinylated immunoglobulin G (IgG) isotype control antibodies (eBioscience, Inc, San Diego, CA).
Characterization of VEGFR2-targeted UCA
VEGFR2-targeted UCA was incubated with FITC-conjugated anti-rat secondary antibodies (eBioscience, San Diego, CA) at room temperature for 30 min. After rinse and removing the free secondary antibodies, FITC-labeled targeted UCA was acquired. The antibody conjugation efficiency of VEGFR2-targeted UCA was detected according to fluorescent intensity of FITC-conjugated secondary antibodies. Particle size, size distribution and concentration of UCA were measured with the Accusizer 780 Optical Particle Sizer (Particle Sizing Systems, Santa Barbara, CA, USA). A drop of FITC-labeled targeted UCA suspension (about 50 μL in 1×10⁸ particles /mL) was applied to the microscope slide and examined under a fluorescent microscope (Olympus, Tokyo, Japan).
Cell culture and in vitro adhesion experiment
The murine bEnd.3 endothelial cells were cultured in a 6-well plate (1×10⁵ cells per well) for overnight in DMEM, supplemented with 10% FBS and 1% penicillin-streptomycin solution. The plate was maintained in a humidified atmosphere containing 5% CO2 at 37℃. Static adhesion of VEGFR2-targeted UCA to cells was performed. For better visual observation, the cells were stained with DiI. Then,the media were removed and 1 mL of 1×10⁸ particles/mL FITC-labeled VEGFR2-targeted UCA was added into the cell monolayer. The cell culture plates were sealed, inverted and rotated for 5 min. After that, free UCA were removed by a PBS rinse. The fluorescence image of UCA binding to cell was observed under a fluorescent microscope. Considering that the targeted UCA used in in vivo experiment were not labeled by FITC, we used unlabeled VEGFR2-targeted UCA and control UCA for quantitative analysis. To test the binding specificity of VEGFR2, cell monolayer was also pre-blocked by an excess of anti-VEGFR2 monoclonal antibody (60μg/mL) for 30 min before adding VEGFR2-targeted UCA. The number of attached UCA was determined under an optical microscope (Olympus, Tokyo, Japan) at five random fields of view. The result was expressed as the ratio of UCA to cell number at the same field.
Development of pregnant mice model
All animal experiments were performed in compliance with the relevant laws and institutional guidelines. Eight to nine-week-old female and male Kunming (KM) mice were caged in a specific pathogen-free animal room with 14 h light and 10 h dark. The estrous female mice were mated with fertile male mice from 17:00 - 23:00 h. Identification of a vaginal plug on the following morning was interpreted as mating success. Given that the implantation of blastocyst happens at the night of the fourth day post coitum when there has highest endometrial receptivity, the mice being non-pregnant (Day 0, D0; n = 8), pregnant for 2 days (Day 2, D2; n = 10) and for 4 days (Day 4, D4; n = 7) were selected as subjects in the study. All the mice were performed with ultrasound molecular imaging around at 14:00. After ultrasound imaging, the pregnant mice at D2 and D4 were confirmed by flushing embryos from the reproductive tract [29].
In vivo ultrasound molecular imaging
Mice were kept anesthetized with 2% isoflurane in oxygen (2 L/min) on a heated stage throughout the ultrasound imaging sessions. Pre-warmed ultrasound gel was used as a coupling agent on the skin of the mice. Ultrasound molecular imaging was performed using a dedicated small-animal high resolution ultrasound imaging system (Vevo 2100; VisualSonics, Toronto, Canada). Image acquisition and quantification were performed according to the report described by Lyshchik et al [20]. Images were acquired by a high-resolution transducer, and all imaging parameters (lateral and axial resolution of 40 μm and 90 μm, respectively; grain, 25 dB; focal depth, 4∼6 mm; transmit power, 30%; mechanical index, 0.2; dynamic range, 60 dB, frame rate, 25 Hz and a center frequency of 40 MHz) were kept constant during all imaging sessions. The image plane was positioned in the transverse section of the uterine horn. To decrease speckle variance, both the ultrasound probe and the animal were fixed and remained at the same position throughout the study. 5×10⁷ VEGFR2-targeted UCA or nontargeted UCA (in 100 μL PBS) were administered through intravenous injection into tail veins. After the 4-minute waiting period, approximately 200 ultrasonographic frames of the uterus were acquired. Then a high-power ultrasound destruction sequence (frequency: 10 MHz, and a mechanical index (MI): 0.59) was applied for 1 second to destroy these UCA. Following destruction, another 200 imaging frames were acquired. To minimize the bias and test the specificity of the signal coming from adherent targeted UCA, we injected VEGFR2-targeted UCA and nontargeted UCA into the same mice in random order. A 30-minute waiting time was allowed to clear UCA from previous injections [30].
Imaging data analysis
The imaging data sets of all mice were analyzed by Vevo2100 built-in software (VevoCQ; Visualsonics, Toronto, Ontario, Canada). Regions of interest were drawn covering the entire area of the uterus. Image processing for each uterus relied on two sets of images: a predestruction data set and a postdestruction (reference) data set. The predestruction data set was composed of three components: (a) the imaging signal from the uterine tissue, (b) signal from circulating UCA that were not attached to the receptors, and (c) signal from UCA attached to the receptors on the endothelial cells. The postdestruction reference data set consisted of two components: (a) the imaging signal from the uterine tissue and (b) signal from UCA that were freely circulating in the vessels. The imaging signal from attached UCA was assessed by calculating an average for pre- and postdestruction imaging signals and subtracting the average postdestruction signal from the average predestruction signal. The subtracted signal was coloured green and then displayed as a coloured overlay on the B-mode images.
Immunofluorescence staining
After ultrasound imaging, the mice were sacrificed immediately and uterus were harvested for the histological study. Double staining for VEGFR2 and CD31 was performed to confirm co-localization of VEGFR2 on CD31-positive vascular endothelial cells. Briefly, the dissected uterus samples were covered with Tissue-Tek (Sakura), and then frozen in liquid nitrogen vapor. The tissue sections (10 μm) were cut with a cryostat microtome (CM1950; Leica, Heidelberg, Germany) and fixed with pre-cooled acetone for 2 min, followed by drying in air for at least 1 h. Then, the sections were rinsed with PBS for 5 min and incubated with 0.03% H2O2 in PBS, and subsequently blocked with 5% goat serum for 1 h at room temperature. After that, slides were co-incubated with rabbit anti-mouse VEGFR2 antibody (Cell Signaling Technology Inc., Danvers, MA) and rat anti-mouse CD31 antibody (eBioscience, San Diego, CA) at a dilution of 1:200 overnight at 4°C. Cy3-conjugated anti-rabbit (biorbyt, Cambridge, UK) and FITC-conjugated anti-rat secondary antibodies (eBioscience, San Diego, CA) were used to visualize the expressions of VEGFR2 and CD31, respectively. Fluorescent images were acquired at × 200 magnifications with a laser scanning confocal microscope (TCS SP5, Leica, Germany).
Immunoblotting
Protein lysates from uterus were prepared with the RIPA Lysis Buffer (Beyotime, Shanhai, China) containing with protease inhibitor Cocktail Set I (Merck, Darmstadt, Germany). Lysates were centrifuged (12,000 rpm) for 5 min at 4°C. A loading buffer (0.5 mol/L Tri-HCl, 10% sodium dodecyl sulfate, 0.5 mol/L DTT, 0.5% bromophenol blue and 50% glycerol, pH6.8) was added to the lysate. Thirty micrograms of each protein sample was then separated in 10% precast SDS-PAGE gels and transferred onto the nitrocellulose membrane. After blocked with 5% milk in 1×Tris-buffered saline-Tween 20 (TBST) for 1 h at room temperature, the membrane was further incubated with primary rabbit anti-mouse VEGFR2 antibody (1:1000 dilution; Cell Signaling, MA) and the secondary HRP conjugated anti-rabbit IgG (1:5000 dilution; Cell Signaling, MA). As a control, the mice anti-β-actin-HRP antibody (1:20,000 dilution; Sigma, St. Louis, MO) was used. The immunoblots were visualized by an enhanced chemiluminescence (ECL) detection system (Pierce, IL, USA) and images were acquired by a Kodak Image Station 4000 MM PRO Digital Imaging System (Eastman Kodak Company, Rochester, NY, USA).
The VEGFR2 expression level was quantified with Image J software. The mean gray intensity of VEGFR2 and corresponding β-actin bands, which served as internal controls, were measured for each uterus sample. The background intensity of the membrane was also measured and subtracted from each sample. The ratio of VEGFR2 to β-actin band density was calculated, expressed as a percentage, and used as a relative measure of VEGFR2 expression.
Statistical Analysis
All results are presented as mean ± standard deviation (SD). Comparisons between bubble sizes, binding affinity of targeted UCA with and without preincubation of the cells with antibodies were compared using one tailed unpaired Student test. Comparisons within each uterus of targeted UCA signal intensity versus control UCA signal intensity were made with 2-sided paired Wilcoxon tests. Comparisons of targeted signal intensity, immunoblotting band density in D0, D2 or D4 mice were made with a 2-sided unpaired Wilcoxon test. The differences were considered to be significant for * P < 0.05, and to be very significant for ** P < 0.01.
Results
Characterization of VEGFR2-targeted and control UCA
Fig. 2 showed the green fluorescent image (Fig. 2A) and its corresponding transmission image (Fig. 2B) of FITC-labeled VEGFR2-targeted UCA, indicating the successful conjugation of anti-VEGFR2 antibodies to the surface of UCA. Quantitatively, there are about 4.86 × 10⁵ antibody molecules conjugated to a microbubble. The mean sizes of VEGFR2-targeted UCA and control UCA were similar, with 2.67 ± 0.30 μm and 2.47 ± 0.45 μm, respectively (P > 0.05). Typical size distributions of the control and VEGFR2-targeted UCA are shown in Fig. 2C. The size distribution for VEGFR2-targeted UCA was centered at ~ 1.68 μm diameter with secondary peaks at ~ 4.21 and ~ 6.85 μm diameters, with a slight different distribution for non-targeted UCA, which was centered at ~ 1.78 μm diameter with secondary peaks at ~ 4.45 μm diameter.
Characterization of the VEGFR2-targeted ultrasound contrast agents. (A) Fluorescent micrograph of FITC-labeled VEGFR2-targeted UCA, indicating the successful conjugation of anti-VEGFR2 antibodies to the surface of UCA. (B) Corresponding transmission image of FITC-labeled VEGFR2-targeted UCA. (C) Size distribution of the targeted UCA and non-targeted UCA. A similar size distribution can be observed. (scale bar = 20 μm)

Examination of VEGFR2-targeted UCA binding affinity to bEnd.3 cells
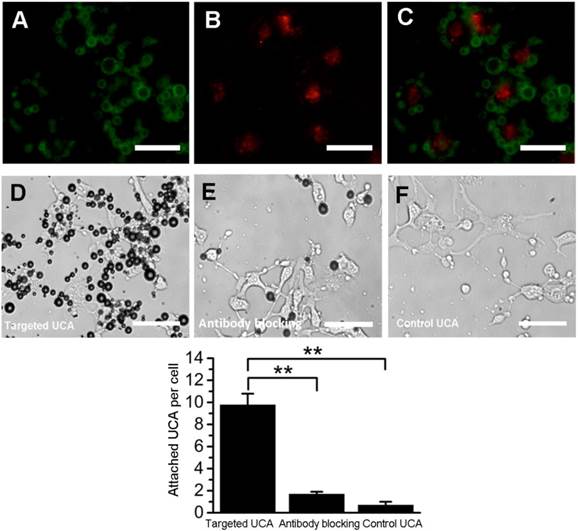
Fig. 3A-C showed fluorescence micrographs of FITC-labeled VEGFR2-targeted UCA (green, Fig. 3A) binding to DiI-stained bEend.3 cells (red, Fig. 3B). Merged image exhibited that cells were surrounded by targeted UCA (Fig. 3C). In bright field, a large number of VEGFR2-targeted UCA were bound to bEnd.3 cells (Fig. 3D). But pre-blocking by an excess of anti-VEGFR2 monoclonal antibody significantly decreased the number of VEGFR2-targeted UCA attached to bEnd.3 cells, with 1.7 ±_0.2 bubbles per cell (Fig. 3E and 3G). In addition, it was found there was few control UCA to be able to bind to bEnd.3 cells (Fig. 3F). Quantitative analysis showed that the binding affinity of VEGFR2-targeted UCA was significantly larger than that of control UCA (9.8 ± 1.0 versus 0.7 ± 0.3, **P< 0.01) (Fig. 3G).
In vitro adhesion of targeted UCA to bEnd.3 cells. (A) Representative fluorescence micrograph for FITC-labeled VEGFR2-targeted UCA. (B) DiI-stained bEnd.3 cells. (C) The overlaid image from image A and image B, showing the attachment of FITC-labeled VEGFR2-targeted UCA with bEnd.3 cells. (D) White light micrograph after incubating VEGFR2-targeted UCA with bEnd.3 cells. (E) White light micrograph after incubating VEGFR2-targeted UCA with bEnd.3 cells blocked with anti-VEGFR2 antibody. A significant decrease of VEGFR2-targeted UCA can be observed. (F) White light micrograph after incubating control UCA with bEnd.3 cells. No UCA can be observed. (G) Quantitative assay of the number of targeted UCA and control UCA adhered onto bEnd.3 cells from five at random view fields. **P < 0.01 (n = 5) (scale bar = 20 μm)
In vivo ultrasound molecular imaging
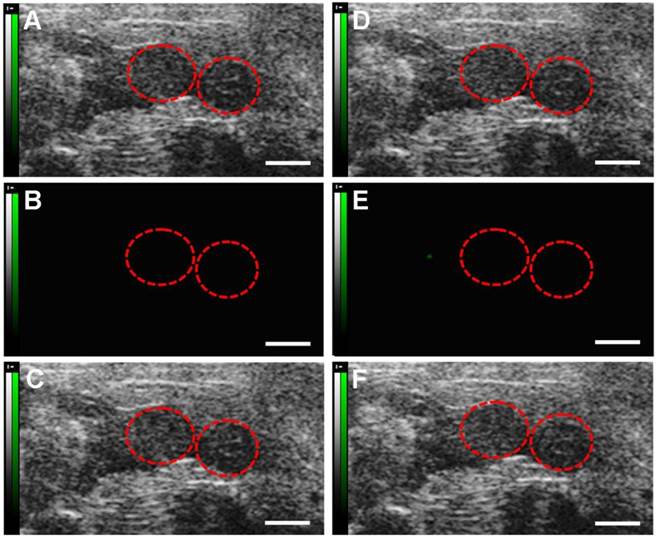
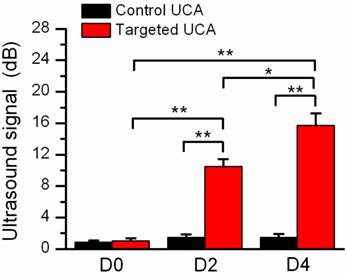
Fig.4 showed representative B-mode, background-subtracted, and molecular sonograms of the D0 murine uterus by using of the control UCA and VEGFR2-targeted UCA. Similar with the control UCA (Fig.4B, 4C), the imaging signal was very low after injection of VEGFR2-targeted UCA (Fig.4E, 4F). Quantitative analysis of imaging signal intensity showed there was not significantly different for the two UCA (0.9 ± 0.6 dB for the control UCA versus 1.0 ± 0.8 dB for the VEGFR2-targeted UCA, P > 0.05). Fig.5 showed representative B-mode, background-subtracted, and molecular sonograms of the D2 uterus after administration of the control UCA and VEGFR2-targeted UCA. In D2 pregnant mouse, the imaging signal of the uterus from the VEGFR2-targeted UCA (Fig.5E, 5F) was higher than that from the control UCA (Fig.5B, 5C). There was 10.5 ± 2.5 dB for the VEGFR2-targeted UCA versus 1.5 ± 1.1 dB for the control UCA (P < 0.01). The representative B-mode, background-subtracted, and molecular sonograms of the D4 uterus were showed in Fig.6. Interestingly, retention of the VEGFR2-targeted UCA resulted in a further increase in the ultrasound signals (Fig.6E, 6F), comparing with that of the control UCA in uterus (Fig.6B, 6C). Quantitatively, the imaging signal intensity of the VEGFR2-targeted UCA and the control UCA in the D4 uterus were 15.7 ± 4.0 dB and 1.5 ± 1.2 dB, respectively (P < 0.01). An obvious increasing trend in the imaging signals from the VEGFR2-targeted UCA but not the control UCA can be found in Fig.7 when plotting the ultrasound signal intensities from the uterus of the D0, D2 and D4 pregnant mice versus mouse pregnancy time. Compared with D0 mice, there were 10.5- and 15.7-fold higher ultrasound signal intensities from VEGFR2-targeted UCA for D2 and D4 pregnant mice, respectively (P < 0.01). Also, the ultrasound signal from the uterus of the D4 pregnant mice was 1.5-fold higher than that of the D2 pregnant mice (P < 0.05). No significant increase can be found for the control UCA.
Molecular sonograms from D0 murine uteruses showing no difference of ultrasonic signals from VEGFR2-targeted UCA and control UCA. (A) Control UCA enhanced B-mode sonogram, (B) color-coded background-subtracted image, and (C) background-subtracted image overlaid on a predestruction B-mode image. (D) VEGFR2-targeted UCA enhanced B-mode sonogram, (E) color-coded background-subtracted image, and (F) background-subtracted image overlaid on a predestruction B-mode image. Red circles are for uteruses. (scale bar = 1 mm)
Molecular sonograms from D2 murine uteruses showing a significant increase of ultrasonic signals from VEGFR2-targeted UCA in comparison with control UCA. (A) Control UCA enhanced B-mode sonogram, (B) color-coded background-subtracted image, and (C) background-subtracted image overlaid on a predestruction B-mode image. (D) VEGFR2-targeted UCA enhanced B-mode sonogram, (E) color-coded background-subtracted image, and (F) background-subtracted image overlaid on a predestruction B-mode image. Red circles are for uteruses. (scale bar = 1 mm)
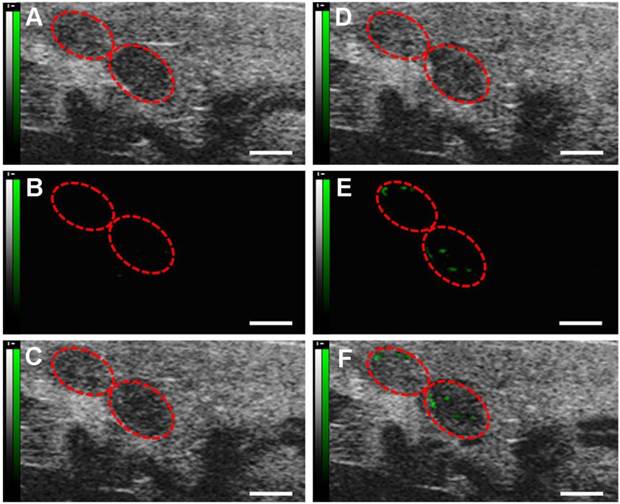
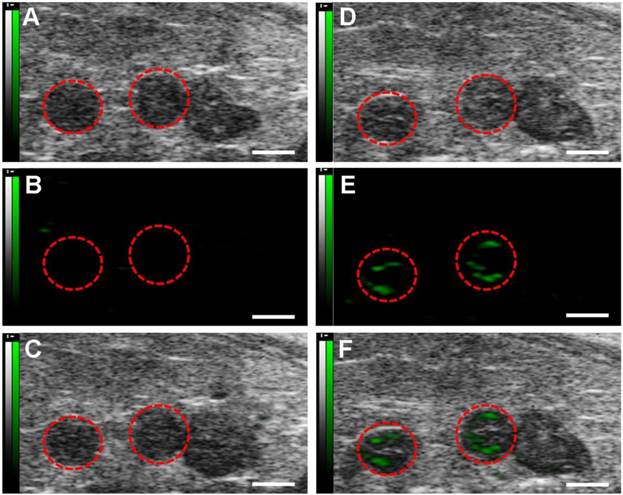
Molecular sonograms from D4 murine uteruses showing further increase of ultrasonic signals from VEGFR2-targeted UCA in comparison with control UCA. (A) Control UCA enhanced B-mode sonogram, (B) color-coded background-subtracted image, and (C) background-subtracted image overlaidon a predestruction B-mode image. (D) VEGFR2-targeted UCA enhanced B-mode sonogram, (E) color-coded background-subtracted image, and (F) background-subtracted image overlaid on a predestruction B-mode image. Red circles are for uteruses. (scale bar = 1 mm)
Quantitative assay of video intensity amplitudes for the control and VEGFR2-targeted UCA in mice with pregnancy time, showing an obvious increasing trend in the mean video intensity from the VEGFR2-targeted UCA, but not from the control UCA. *P<0.05, **P<0.01.
Immunoblotting and Immunofluorescence
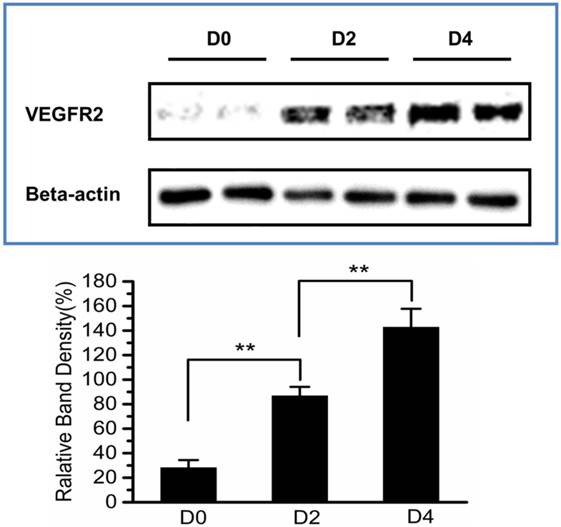
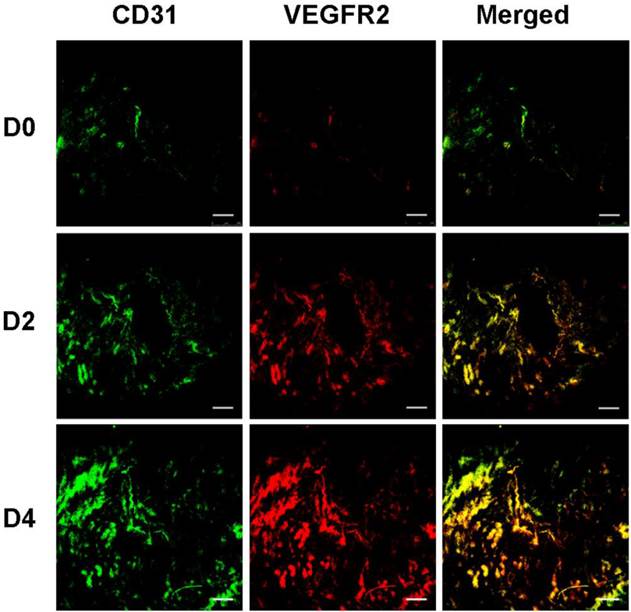
To validate the results of ultrasonography using the VEGFR2-targeted UCA, uterus of D0, D2 and D4 mice were harvested and subsequently analyzed for VEGFR2 expression by immunoblotting and immunofluorescence assay. Immunoblotting results were presented in Fig. 8, demonstrating relatively lower VEGFR2 expression in the uterus of D0 non-pregnant mice (relative band density, 28.2% ± 6.2%). In comparison, there was a significant higher VEGFR2 expression in the uterus of D2 pregnant mice (86.8% ± 7.3%, P < 0.01) and D4 pregnant mice (142.8% ± 15.0%, P < 0.01), showing a similar trend with the result of ultrasound molecular imaging. The data of immunofluorescence assay for uterus VEGFR2 and CD31 were showed in Fig.9. From these images, we can see that the expression of VEGFR2 (red) can be co-localizated with CD31 endothelium marker (green), confirming presence of VEGFR2 on endothelial cells within uterus in our study. In addition, just as CD31-positive cells (CD31 is a marker for vascular endothelial cells), VEGFR2-positive cells was also gradually increased as the pregnancy time from D0, D2 and D4 mice. Taken together, the results of immunoblotting and histological evaluation of D0, D2 and D4 uterus correlated with the ultrasound signal intensities obtained with the VEGFR2-targeted UCA.
Immunoblotting assay for the expression of VEGFR2 in murine uteruses at D0, D2 and D4. The relative VEGFR2 expression level was calculated by the signal intensity of the protein bands with Image J software. A gradually increasing expression of VEGFR2 can be observed. *P<0.05, **P<0.01.
VEGFR2 and blood vessel staining in murine uteruses with immunofluorescence. Uterus sections at D0, D2 and D4 were detected by immunofluorescence double staining for VEGFR2 and CD31. CD31 was stained green (first column) and VEGFR2 was stained red (second column). Merged images (yellow, third column) show expression of VEGFR2 on vascular endothelial cells. (scale bar = 200 μm)
Discussion
Pregnancy is a complicated, irreversible biological process involving the following discrete stages: implantation, decidualization, placentation and the birth of offspring [31, 32]. For a successful pregnancy, each stage is essential and highly organized by a series of physiological and molecular processes. Embryo implantation comprises the adhesion of the competent embryo to the endometrial luminal epithelium and the invasion of the stromal compartment underneath. The stromal cells that surround the embryonic implantation site suffer a differentiation process (decidualization). Decidualization is linked to morphological, biochemical and genetic changes, resulting in the trophoblast invasion, the development of blood vessels and the formation of the placenta [33]. Despite lack of sufficient understanding of the molecular and functional mechanisms that control these processes and how the angiogenesis is associated to implantation and decidualization defects, evidences have showed that angiogenesis primarily occurs in the uterus which makes endometrium fertile enough and ready to receive the embryo after fertilization [17, 34].
Recently various methods, such as endometrial biopsy, ultrasonography and biochemical or biologically molecular examination, have been developed for evaluation of endometrial receptivity [6]. But most of them are invasive and inaccurate which make them controversial in clinical applications [35]. In our study, the use of ultrasound molecular imaging (USMI) based on VEGFR2-targeted UCA is a new approach of great potential. Our in vivo animal experiments demonstrated USMI not only provides morphological but also functional information at the molecular level non-invasively.
We selected non-pregnant (D0), pregnant on day 2 (D2) and day 4 (D4) mice as subjects to investigate the difference of endometrial receptivity. Generally, uterine sensitivity to implantation in mice may be divided into three principal phases: prereceptive (days 1-3), receptive (day 4) and nonreceptive (refractory; day 5 onward)[32, 36]. Embryos cannot be implanted during the prereceptive (preparatory) phase; implantation can take place only during the receptive period. The prereceptive uterus on day 1-3 becomes fully receptive on day 4 in normal pregnant or pseudopregnant mice. Upon closure of the receptive window, the uterus spontaneously transits to the refractory phase [37].
In our study, the ultrasound signal intensity from targeted UCA increased gradually as pregnancy time passes from D0, D2 to D4, indicating a gradual increase of expression level of VEGFR2 proteins. This change also corresponds to the trend of endometrial receptivity. Indeed, our immunoblotting and immunofluorescent results further confirmed the changes of VEGFR2 expression in the uterus. In all experiments, D4 uterus in pregnant mice showed highest protein expression level or density of VEGFR2-positive vascular structures, while rare expression in D0 uterus. Moreover, although all of control UCA showed significantly lower retention compared with the VEGFR2-targeted UCA in every group, it is still noticeable that retention of the control UCA in D4 and D2 uterus were slightly higher than in D0. It can possibly contribute to the more abundant veins or angiogenesis of uterus in D4 and D2 mice, resulting in more non-specific retention of the control UCA.
There are several limitations of this study. First, some of the targeted UCA (less than 4%) is larger than 7 μm. Embolic event perhaps occurs in the capillary vessel since the capillary vessel is below 7 μm. A possible reason may result from particle aggregation due to the insufficient avidin used in the preparation procedure. Although the percentage of these bubbles is small, the potential risks should be noticed and further works (such as optimizing the avidin concentrations) need to be investigated. Second, backscatter imaging technology was used in this current study. Indeed, it would be better to take advantage of the non-linear imaging technology. In a linear imaging mode, the acoustic signals received by transducer not only come from UCA, but also from tissue. By contrast, the acoustic signals just come from UCA in a non-linear imaging mode. In addition, the concentrations of targeted UCA used in mice may be further optimized to increase the sensitivity of targeted UCA for molecular imaging of uterus angiogenesis.
In conclusion, our study has shown that VEGFR2-targeted UCA can be used to improve in vivo US imaging's contrast and resolution for evaluation of VEGFR2 expression on uterus vascular endothelium. This imaging modality may provide an effective means to assess function of uterus angiogenesis before implantation on the molecular level.
Acknowledgements
The work was supported by National Key Basic Research Program of China (973 Program) (Grant Nos. 2015CB755500, 2014CB744502, 2012CB733800), National High Technology Research and Development Program of China (863 Program) (Grant No. 2014AA020503), National Natural Science Foundation of China (Grant Nos. 81101063, 81371563, 11325420, 61020106008, 61327001), Natural Science Foundation of Guangdong Province (S2012010008115) and Planning Project of Science and Technology of Guangdong Province (2010B031600244).
Competing interests
All the authors declare they have no competing of interests.
References
1. Achache H, Revel A. Endometrial receptivity markers, the journey to successful embryo implantation. Hum Reprod Update. 2006;12(6):731-46
2. Aplin JD. The cell biological basis of human implantation. Baillieres Best Pract Res Clin Obstet Gynaecol. 2000;14(5):757-64
3. Ghosh D, Sengupta J. Endocrine and paracrine correlates of endometrial receptivity to blastocyst implantation in the human. Indian J Physiol Pharmacol. 2004;48(1):6-30
4. Salilew-Wondim D, Schellander K, Hoelker M. et al. Oviductal, endometrial and embryonic gene expression patterns as molecular clues for pregnancy establishment. Anim Reprod Sci. 2012;134(1):9-18
5. Paria B, Lim H, Das S. et al. Molecular signaling in uterine receptivity for implantation. Semin Cell Dev Biol. 2000;11(2):67-76
6. Makker A, Singh M. Endometrial receptivity: clinical assessment in relation to fertility, infertility, and antifertility. Med Res Rev. 2006;26(6):699-746
7. Sterzik K, Grab D, Schneider V. et al. Lack of correlation between ultrasonography and histologic staging of the endometrium in in vitro fertilization (IVF) patients. Ultrasound Med Biol. 1997;23(2):165-70
8. Bassil S. Changes in endometrial thickness, width, length and pattern in predicting pregnancy outcome during ovarian stimulation in in vitro fertilization. Ultrasound Obstet Gynecol. 2001;18(3):258-63
9. Schild RL, Knobloch C, Dorn C. et al. Endometrial receptivity in an in vitro fertilization program as assessed by spiral artery blood flow, endometrial thickness, endometrial volume, and uterine artery blood flow. Fertil Steril. 2001;75(2):361-6
10. Salle B, Bied-Damon V, Benchaib M. et al. Preliminary report of an ultrasonography and colour Doppler uterine score to predict uterine receptivity in an in-vitro fertilization programme. Hum Reprod. 1998;13(6):1669-73
11. Kaufmann BA. Ultrasound molecular imaging of atherosclerosis. Cardiovasc Res. 2009;83(4):617-25
12. Alonso A, Della Martina A, Stroick M. et al. Molecular imaging of human thrombus with novel abciximab immunobubbles and ultrasound. Stroke. 2007;38(5):1508-14
13. ten Kate GL, Sijbrands EJ, Valkema R. et al. Molecular imaging of inflammation and intraplaque vasa vasorum: A step forward to identification of vulnerable plaques? J Nucl Cardiol. 2010;17(5):897-912
14. Anderson CR, Rychak JJ, Backer M, Ley Klaus KAL. scVEGF microbubble ultrasound contrast agents: a novel probe for ultrasound molecular imaging of tumor angiogenesis. Invest Radiol. 2010;45(10):579
15. Grouls C, Hatting M, Rix A. et al. Liver dysplasia: US molecular imaging with targeted contrast agent enables early assessment. Radiology. 2013;267(2):487-95
16. Silva LA, Klein C, Ealy AD, Sharp DC. Conceptus-mediated endometrial vascular changes during early pregnancy in mares: an anatomic, histomorphometric, and vascular endothelial growth factor receptor system immunolocalization and gene expression study. Reproduction. 2011;142(4):593-603
17. Klauber N, Rohan RM, Flynn E. et al. Critical components of the female reproductive pathway are suppressed by the angiogenesis inhibitor AGM-1470. Nat Med. 1997;3(4):443-6
18. Douglas NC, Tang H, Gomez R. et al. Vascular endothelial growth factor receptor 2 (VEGFR-2) functions to promote uterine decidual angiogenesis during early pregnancy in the mouse. Endocrinology. 2009;150(8):3845-54
19. Wang H, Dey SK. Roadmap to embryo implantation: clues from mouse models. Nat Rev Genet. 2006;7(3):185-99
20. Lyshchik A, Fleischer AC, Huamani J. et al. Molecular imaging of vascular endothelial growth factor receptor 2 expression using targeted contrast-enhanced high-frequency ultrasonography. J Ultrasound Med. 2007;26(11):1575-86
21. Korpanty G, Carbon JG, Grayburn PA. et al. Monitoring response to anticancer therapy by targeting microbubbles to tumor vasculature. Clin Cancer Res. 2007;13(1):323-30
22. Willmann JK, Paulmurugan R, Chen K. et al. US imaging of tumor angiogenesis with microbubbles targeted to vascular endothelial growth factor receptor type 2 in mice. Radiology. 2008;246(2):508-18
23. Palmowski M, Huppert J, Ladewig G. et al. Molecular profiling of angiogenesis with targeted ultrasound imaging: early assessment of antiangiogenic therapy effects. Mol Cancer Ther. 2008;7(1):101-9
24. Lee DJ, Lyshchik A, Huamani J. et al. Relationship between retention of a vascular endothelial growth factor receptor2 (VEGFR2)-targeted ultrasonographic contrast agent and the level of VEGFR2 expression in an in vivo breast cancer model. J Ultrasound Med. 2008;27(6):855-66
25. Pysz MA, Foygel K, Rosenberg J. et al. Antiangiogenic cancer therapy: monitoring with molecular US and a clinically translatable contrast agent (BR55). Radiology. 2010;256(2):519-27
26. Denbeigh JM, Nixon BA, Hudson JM. et al. VEGFR2-targeted molecular imaging in the mouse embryo: an alternative to the tumor model. Ultrasound Med Biol. 2014;40(2):389-99
27. Stieger SM, Dayton PA, Borden MA, Caskey CF, Griffey SM, Wisner ER, Ferrara KW. Imaging of angiogenesis using Cadence contrast pulse sequencing and targeted contrast agents. Contrast Media Mol Imaging. 2008;3(1):9-18
28. Bachmann C, Klibanov AL, Olson TS. et al. Targeting mucosal addressin cellular adhesion molecule (MAdCAM)-1 to noninvasively image experimental Crohn's disease. Gastroenterology. 2006;130(1):8-16
29. Dunning KR, Cashman K, Russell DL. et al. Beta-oxidation is essential for mouse oocyte developmental competence and early embryo development. Biol Reprod. 2010;83(6):909-18
30. Willmann JK, Cheng Z, Davis C. et al. Targeted microbubbles for imaging tumor angiogenesis: assessment of whole-body biodistribution with dynamic micro-PET in mice. Radiology. 2008;249(1):212-9
31. Carson DD, Bagchi I, Dey SK. et al. Embryo implantation. Dev Biol. 2000;223(2):217-37
32. Dey SK, Lim H, Das SK. et al. Molecular Cues to Implantation. Endocr Rev. 2004;25(3):341-73
33. Ramathal CY, Bagchi IC, Taylor RN, Bagchi MK. Endometrial decidualization: of mice and men. Semin Reprod Med. 2010;28(1):17-26
34. Plaks V, Kalchenko V, Dekel N. et al. MRI analysis of angiogenesis during mouse embryo implantation. Magn Reson Med. 2006;55(5):1013-22
35. Raga F, Bonilla-Musoles F, Casan EM. et al. Assessment of endometrial volume by three-dimensional ultrasound prior to embryo transfer: clues to endometrial receptivity. Hum Reprod. 1999;14(11):2851-4
36. Paria B, Huet-Hudson Y, Dey S. Blastocyst's state of activity determines the" window" of implantation in the receptive mouse uterus. Proc Natl Acad Sci USA. 1993;90(21):10159-62
37. Cha J, Sun X, Dey SK. Mechanisms of implantation: strategies for successful pregnancy. Nat Med. 2012;18(12):1754-67
Author contact
![]() Corresponding author: Fei Yan, PhD and, Hairong Zheng PhD, 1068 Xueyuan Avenue, Shenzhen University Town, Shenzhen, P.R. China 518055, E-mails: fei.yanac.cn and hr.zhengac.cn. Telephone: +86 755 86392284, Fax: +86 755 96382299.
Corresponding author: Fei Yan, PhD and, Hairong Zheng PhD, 1068 Xueyuan Avenue, Shenzhen University Town, Shenzhen, P.R. China 518055, E-mails: fei.yanac.cn and hr.zhengac.cn. Telephone: +86 755 86392284, Fax: +86 755 96382299.