Impact Factor
- Issue 14; 2026
- Issue 13; 2026
- Issue 12; 2026
- Issue 11; 2026
- Issue 10; 2026
- Volume 16; 2026
- Advance Articles
- Past Issues
- Cover Images
- Cover Suggestion
- Index & Coverage
- Special Issues
Introduction
Materials and methods
Results and discussion
Conclusions
Supplementary Material
Acknowledgements
References
International Journal of Biological Sciences
International Journal of Medical Sciences
 Global reach, higher impact

Theranostics 2014; 4(12):1164-1175. doi:10.7150/thno.8502 This issue Cite
Research Paper
Quantitative Proteomics Analysis Identifies Mitochondria as Therapeutic Targets of Multidrug-Resistance in Ovarian Cancer
Xiulan Chen1*, Shasha Wei1,2*, Ying Ma3, Jie Lu3, Gang Niu3, Yanhong Xue4, Xiaoyuan Chen3 ![]() , Fuquan Yang1
, Fuquan Yang1 ![]()
1. Key Laboratory of Protein and Peptide Pharmaceuticals & Laboratory of Proteomics, Institute of Biophysics, Chinese Academy of Sciences, Beijing 100101, China;
2. University of Chinese Academy of Sciences, Beijing100049, China;
3. Laboratory of Molecular Imaging and Nanomedicine, National Institute of Biomedical Imaging and Bioengineering, NIH, Bethesda, MD20892, USA
4. National Laboratory of Biomacromolecules, Institute of Biophysics, Chinese Academy of Sciences, Beijing 100101, China.
* These authors contributed equally to this work.
Received 2014-1-24; Accepted 2014-3-14; Published 2014-9-18
Abstract

Doxorubicin is a widely used chemotherapeutic agent for the treatment of a variety of solid tumors. However, resistance to this anticancer drug is a major obstacle to the effective treatment of tumors. As mitochondria play important roles in cell life and death, we anticipate that mitochondria may be related to drug resistance. Here, stable isotope labeling by amino acids in cell culture (SILAC)-based quantitative proteomic strategy was applied to compare mitochondrial protein expression in doxorubicin sensitive OVCAR8 cells and its doxorubicin-resistant variant NCI_ADR/RES cells. A total of 2085 proteins were quantified, of which 122 proteins displayed significant changes in the NCI_ADR/RES cells. These proteins participated in a variety of cell processes including cell apoptosis, substance metabolism, transport, detoxification and drug metabolism. Then qRT-PCR and western blot were applied to validate the differentially expressed proteins quantified by SILAC. Further functional studies with RNAi demonstrated TOP1MT, a mitochondrial protein participated in DNA repair, was involved in doxorubicin resistance in NCI_ADR/RES cells. Besides the proteomic study, electron microscopy and fluorescence analysis also observed that mitochondrial morphology and localization were greatly altered in NCI_ADR/RES cells. Mitochondrial membrane potential was also decreased in NCI_ADR/RES cells. All these results indicate that mitochondrial function is impaired in doxorubicin-resistant cells and mitochondria play an important role in doxorubicin resistance. This research provides some new information about doxorubicin resistance, indicating that mitochondria could be therapeutic targets of doxorubicin resistance in ovarian cancer cells.
Keywords: Doxorubicin, multidrug resistance, ovarian cancer, quantitative proteomics, mitochondria.
Introduction
Ovarian cancer is one of the most commonly diagnosed malignant tumors that threaten the health of women. A total of 22,240 new cases and 14,030 deaths were reported in the United States in 2013 [1]. Chemotherapy is an adjunctive therapy for ovarian cancer patients treated with surgery. Doxorubicin (DOX), also known as adriamycin (ADR), is an anthracycline antibiotic that is widely used as a chemotherapeutic agent for the treatment of a variety of solid tumors, including ovarian cancer [2]. Previously reported anticancer effects of DOX include DNA intercalation, which interferes with the biosynthesis of macromolecules; inhibition of topoisomerase II enzyme activity, which initializes DNA damage; increased production of reactive oxygen species (ROS) and direct membrane effects [3, 4]. Despite the extensive and long-standing clinical application of DOX in cancer treatment, cancer cells always develop resistance to this drug. Once tumor cells develop drug resistance, they become resistant not only to the drug used but also to a broad range of structurally and functionally unrelated compounds. This phenomenon, known as multidrug resistance (MDR) [5], is a major obstacle towards the successful treatment of ovarian cancer and is the main cause of the failure of chemotherapy.
To date, several mechanisms, such as increased efflux of drugs out of cancer cells to reduce the uptake of drug into cells through ATP-dependent pump P-glycoproteins [5], have been proposed to explain MDR. However, MDR is a multifactorial process which involves altered expression of many proteins; therefore, proteomic approaches are well-suited for investigating the mechanisms of MDR [6-8]. Recently, it has been suggested that the resistance of tumor cells to anticancer drugs is related to the capacity of cells to escape apoptosis [9, 10], and mitochondria is the 'housekeeper' of cell apoptosis, thus it is rational to apply quantitative proteomics [11] to systematically analyze the differentially expressed proteins in the mitochondria of drug-resistant tumor cells. Doxorubicin-resistant cell line NCI_ADR/RES is a cell line derived from OVCAR8 ovarian cancer cell line by continuous in vitro exposure to increasing concentrations of doxorubicin. NCI_ADR/RES shows resistance not only to doxorubicin itself, but also to a broad range of structurally and functionally unrelated compounds, and is thus considered as a good model for studying the mechanism of drug-induced acquired resistance. Our studies showed that other than change of mitochondrial protein expression, mitochondrial morphology, localization and activity were also greatly altered in drug-resistant NCI_ADR/RES cells, indicating that mitochondria could be potential therapeutic targets of doxorubicin resistance in ovarian cancer cells.
Materials and methods
Cell culture and SILAC labeling
The human ovarian tumor cell line OVCAR8 and its doxorubicin resistant subline NCI_ADR/RES were gifts from Dr. Nouri Neamati of the University of Southern California. OVCAR8 cells were maintained in RPMI 1640 medium supplemented with 10% heat-inactivated FBS, 2 mM L-glutamine, 100 U/ml penicillin and 100 µg/ml streptomycin in a humidified incubator with 5% CO2 at 37°C. Culture conditions for NCI_ADR/RES cells were identical with OVCAR8 cells except that the concentration of L-glutamine was 5 mM. Cell culture media were changed every two days.
For forward SILAC labeling, OVCAR8 cells were grown in RPMI 1640 medium supplemented with “light” amino acids (L-[12C6,14N4]-arginine (Arg0) and L-[12C6,14N2]-lysine (Lys0)), and NCI_ADR/RES cells were cultured in 1640 medium supplemented with “heavy” amino acids(L-[13C6,15N4]-arginine (Arg10) and L-[13C6,15N2]-lysine (Lys8). For reverse labeling, the OVCAR8 cells were grown in “heavy” SILAC medium, and NCI_ADR/RES cells were grown in “light” SILAC medium. For SILAC cell culture, cells were grown in SILAC medium supplemented with 10% heat-inactivated dialyzed fetal bovine serum (Invitrogen, Carlsbad, CA), streptomycin and penicillin for at least six cell population-doubling times to achieve complete isotope incorporation(>97%).Media used for SILAC labeling were renewed every two days.
Measurement of doxorubicin resistance by MTT analysis in OVCAR8 and NCI_ADR/RES cells
The toxicity of doxorubicin to OVCAR8 and NCI_ADR/RES cells was determined with an MTT assay. All studies were performed with triplicate samples and repeated at least three times. Briefly, cells were harvested by trypsinization, resuspended in RPMI1640 medium, and plated in a 96-well plate at 3,000 cells per well. The culture medium was replaced 48 h after treatment with different doses of doxorubicin (ranging from 0.1 nM to 100 μM), and 50 μL of 1.0 mg/ml sterile filtered 3-(4, 5-dimethylthiazol-2-yl)-2, 5-diphenyl tetrazolium bromide (MTT; Sigma) was added to each well. Unreacted dye was removed after 4 h and insoluble formazan crystals were dissolved in 150 µl of DMSO. Absorbance at 570 nm (reference wavelength: 630 nm) was measured with a Synergy 2 multi-mode microplate reader (BioTek, Winooski, VT).
Purification of mitochondria
For mitochondria isolation from SILAC labeled cells, equal number of two types of cells grown in light or heavy SILAC media were combined and mitochondria were isolated by Nycodenz density gradient centrifugation as described previously [12, 13].
Validation of mitochondrial purity by western blot
The purity of isolated mitochondria was assessed with western blot against marker proteins from different cellular compartments as described previously [13].
In-solution digestion
In-solution digestion of SILAC-labeled mitochondrial proteins was performed as described previously with slight modifications [14]. Briefly, 100 μg of protein mixture was reduced and alkylated before Lys-C was added and digested at 37°C for 6 h. After diluting the concentration of urea to 1 M with 25 mM NH4HCO3, sequence grade trypsin (Promega, Madison, WI) was added at an enzyme/protein ratio of 1:50 and digested at 37°C overnight. Digestion was stopped by adding formic acidto a final concentration of 0.1%. The digested peptide mixture was centrifuged at 13,000g for 10 min and the resulting supernatant was collected for MS analysis.
2D-LC-MS/MS analysis for protein identification and quantification
2D-LC-MS/MS analysis was performed using an Eksigent HPLC system (Dublin, C, USA) interfaced to an LTQ-Orbitrap XL (Thermo Fisher Scientific, Waltham, USA) equipped with an in-house built nanoelectrospray device as described previously [13].
For a single analysis, 100 μg of peptide mixtures were pressure loaded onto a 2D silica capillary column (200 μm id) packed with 3 cm of C18 resin (sunchrom 5μ, Friedrichsdorf, Germany) and 3 cm of strong cation exchange resin (Luna 5μ, SCX 100A, Phenomenex, USA) . The buffer solutions used and salt elution gradients were identical as described previously [13].
Data processing and bioinformatics analysis
SILAC-based quantification was conducted using MaxQuant (version 1.2.2.5) [15] against UniportKB human database (downloaded on November 28, 2012) with 131,282 entries to which 175 commonly observed contaminants and all the reverse sequences were added. Carbamidomethylation was set as a fixed modification. Variable modifications included oxidation of methionine residues and N-terminal protein acetylation. Full tryptic specificity was required. Up to three missed cleavage and three labeled amino acids (arginine and lysine) were allowed. The minimum required peptide length was set to six amino acids. The initial precursor and fragment ion maximum mass tolerance in the database search were set to 10 ppm and 0.5 Da, respectively. To pass statistical evaluation, the false discovery rate (FDR) for both the peptides and proteins were set to 0.01 to ensure a maximum of 1% false identification hits. Proteins with at least two peptides (with one unique peptide) were considered as valid identifications.
UniprotKB database and bioinformatic tool Panther [16] were used for functional annotation to interpret the relationship between protein expression and the molecular mechanisms of doxorubicin resistance in ovarian cancer cells. Cellular localization of the differentially expressed proteins was annotated with UniprotKB database.
RNA extraction and quantitative real-time RT-PCR
RNA of the OVCAR8 or NCI_ADR/RES cells was extracted with TRIzol reagent (Invitrogen, Carlsbad, CA) following the product manual. The concentration of RNA was determined by measuringthe absorbance at 260nm in Nanodrop(Thermo Fisher Scientific), and the quality was examined by the ratio of absorbance at 260-280 nm. Then RNA was reverse transcribed into cDNA with Promega A5000 Reverse Transcription System (Promega, Madison, WI) according to the manufacturer's protocol. Quantitative real-time RT-PCR analysis was performed on Bio-Rad CFX real-time PCR detection system (Bio-rad) using SYBR Green detection kit (Applied Biosystems) according to the manufacturer's instructions. The specific primers for MDR1 were 5'-GGGAGCTTAACACCCGACTTA-3' (sense) and 5'-GCCAAAATCACAAGGGTTAGCTT-3'(antisense), for Sirt4 were 5'-CCGTAGAGCTGTGAGAGAATGAA-3'(sense) and 5'-AGGGTCCAGAGGAGGACTTG -3'(antisense), for PCCA were 5'-AAGCTACCTCAACATGGATGC-3' (sense) and 5'-GTGTCAGGTCCAATGAAAACGA-3'(antisense), for Foxred1 were 5'-CTCAGTAGGTGGGATTTGTCAGC-3' (sense) and 5'-CTCTGCACTTTCACGTTGCTC-3' (antisense), and for GAPDH were 5'-CTTCACCACCATGGAGGAGGC-3' (sense) and 5'-GGCATGGACTGTGGTCATGAG-3' (antisense). The relative quantification of gene expression was analyzed by the 2-ΔΔCT method. Real-time quantitative RT-PCR analysis was repeated at least three times.
Western blot to validate SILAC results
Proteins were extracted from OVCAR8 and NCI_ADR/RES cells as described previously [14] and protein concentration was determined with Bradford method. The protein samples (20 μg) were separated by SDS-PAGE and electro-transferred to PVDF membranes, which were then probed with indicated primary antibodies after blocked with 5% non-fat milk. The protein bands were visualized with enhanced chemiluminescence substrate after probed with indicated secondary antibodies. All of the western blot analyses were repeated three times and GAPDH was used as loading control.
siRNA design, construction and transfection
The siRNA against TOP1MT was synthesized by Gene Pharma (Shanghai, China). Three target sequences was synthesis: 5'-GAGGAUGUUAGAUCAUGAATT-3' and 5'-UUCAUGAUCUAACAUCCUCTT-3' (siRNA1), 5'-CCCUGUAUUUCAUCGAUAATT-3' and 5'-UUAUCGAUGAAAUACAGGGTT-3' (siRNA2), 5'-GGCAGGAGAAGACUUUGAATT-3' and 5'-UUCAAAGUCUUCUCCUGCCTT-3' (siRNA3), sequences which do not match any known human coding sequence were used for negative control against TOP1MT. Transfection was mediated with Lipofectamine 2000 transfection reagent according to the manufacturer's instruction. Briefly, OVCAR8 or NCI_ADR/RES cells were plated into 24-well plates at the density of 1.1*105 cells/well or 1.3*105 cells/well, respectively. When the cells were 40-50% confluence, they were transfected with 100 nmol/L of specific siRNAs or control siRNA after a pre-incubation for 20 min with Lipofectamine 2000 diluted in Opti-MEM. After 6 hours of transfection, the medium was replaced with normal cell culture medium. 72 hours after transfection, cell proteins were harvested and protein concentration was measured with Brandford method. The efficiency of siRNA knockdown was monitored with immunoblotting by using primary antibody against TOP1MT.
Measurement of the cell proliferative activity
As knockdown efficiency for TOP1MT siRNA2 is much more effective, measurement of cell proliferative activity was carried out following transfection of TOP1MT siRNA2 or control siRNA with the cell counting kit‑8 (CCK8; Dojindo, Tokyo, Japan). Briefly, OVCAR8 or NCI_ADR/RES cells were transfected as described above, then the transfected cells were plated into 96-well plates and cultured for 24 hours before incubated with different concentrations of doxorubicin. After treatment of doxorubicin for 48 hour, CCK8 solution was added 2 hour before the end of incubation. Cell viability was measured with a spectrophotometer at an absorbance of 450 nm. The inhibition rates of cell growth were calculated according to the formula: inhibition rate (%) = (1-mean absorbance of treatment group/mean absorbance of untreatment group) ×100%. Results shown are representative of three separate experiments.
Observation of mitochondrial morphology with transmission electron microscopy
OVCAR8 and NCI_ADR/RES cells were harvested by trypsinization, washed twice with PBS and fixed in 2.5% glutaraldehyde in PBS (pH 7.4) at room temperature for 30 min, then post-fixed with 1% osmium tetroxide in 0.1 M sodium cacodylate for 1 hour. Following dehydration in a graded series of acetone (2 hour each at 30, 50, 70, 80, 90and 100%), cell pellets were embedded in Embed 812 and sliced into 70 nm sections using a Leica ultramicrotome EM UC6 (Leica, Germany). After staining with uranyl acetate and lead citrate, sections were observed under a Spirit 120 kV transmission electron microscope (FEI, the Netherlands).
Observation of mitochondria with Mitotracker Green staining
OVCAR8 and NCI_ADR/RES cells were seeded in 35 mm Petri dishes, after reaching 50-70% confluence, the cells were stained with 50 nM Mitotracker Green (Molecular probes Invitrogen) diluted in the corresponding culture media for 20 min at 37°C. After incubation, cells were washed twice with PBS. A few microliters of PBS were added before the coverslip was put in place to prevent cell drying. Cell images were obtained with an Olympus FV1000 laser scanning confocal microscope under visible light or under fluorescence excitation at 520 nm.
Observation of mitochondrial localization with immunofluorescence microscopy
The localization of mitochondria was further assayed by immunofluorescence microscopy. OVCAR8 and NCI_ADR/RES cells were grown on 35 mm Petri dishes and fixed with 4% formaldehyde in PBS at room temperature for 15 min. Cells were permeabilized with 0.2% (v/v)Triton-X100 in PBS at room temperature for 10 min and blocked for 30min atroom temperature with PBS containing 5% BSA. After incubation with primary antibodies against mitochondrial ATP synthase β (ab14730,Abcam) in 0.05%Tritonatroom temperature for 2 hours, cells were washed three times with PBS, and then incubated withCF™488A fluorescent antibodies (Biotium) for 1hour. After wash three times with PBS, DAPI (Beyotime, China) was used to stain the cell nuclei. Cell images were obtained with an Olympus FV1000 laser scanning confocalmicroscope.
Mitochondrial membrane potential (∆Ψm) analysis with Rhodamine B
∆Ψm was measured with the fluorescent probe Rhodamine B (Sigma) as described by Reungpatthanaphong and coworkers [17]. Briefly, OVCAR8 and NCI_ADR/RES cells were collected by trypsinization and incubated with 50 nM Rhodamine B dissolved in serum-free culture medium at 37°C for 30 min and then washed twice with PBS and suspended in culture medium. Fluorescence was read with a FACSCalibur flow cytometer (Becton Dickinson, San Jose, CA) at 488 nm excitation and 580 nm emission. Approximately 105 cells were analyzed for each cell.
Results and discussion
Although the mechanisms of DOX-induced MDR in cancer cells have been widely explored, the exact reason for drug resistance has not been fully understood. Here, we systematically analyzed the differentially expressed proteins in the mitochondria of OVCAR8 and its DOX-resistant cell line NCI_ADR/RES with quantitative proteomics and mass spectrometry. NCI_ADR/RES cells, which were originally thought to be derived from a MCF-7 breast cancer cell line, were later identified to be derived from OVCAR8 ovarian adenocarcinoma cells [18]. NCI_ADR/RES is a multidrug resistance cell line, as shown in Additional file 3: supplementary Figure S1, treatment with doxorubicin produced marked inhibition of cell proliferation in OVCAR8 cells as determined by MTT assays, with an IC50 value of 24.1 nM at 48 hours after treatment. NCI_ADR/RES cells showed significant resistance to DOX with an IC50 value of 2.85 µM, which was more than 100 times higher than that of OVCAR8 cells.
Differential protein expression in the mitochondria of OVCAR8 and NCI_ADR/RES cells
As mitochondria play a central role in cell life and death, we anticipate that mitochondria play important roles in the MDR of cancer cells, thus comparative mitochondrial proteome was performed to systematically analyze the protein expression in the mitochondria. Western blot results showed that mitochondrial proteins were greatly enriched in the purified samples (Additional file 3: supplementary Figure S2).
To obtain reliable quantification results, we conducted SILAC experiments in triplicates, including one forward and two reverse labeling experiments (Additional file 3: supplementary Figure S3 depicts the flowchart for quantitative mitochondrial proteome). 2D-LC-MS/MS analysis allowed for the quantification of 1696, 1697 and 1667 proteins in one forwards and two reverse SILAC experiments, respectively. 63% of the proteins were quantified in all the three replicates, and nearly 80% proteins were quantified at least twice in the three replicates (Additional file 3: supplementary Figure S4), implying a good level of reproducibility in MS analysis. A total of 2085 proteins were quantified in this study (Additional file 1: supplementary Table S1). To improve the reliability of the quantification results, only the proteins quantified at least twice of SILAC labeling experiments were considered for further functional analysis. Since expression level of the majority of proteins were unchanged, and the mean value of the proteins quantified more than twice is 1.14, and SD value is 0.20, thus two-fold was chosen as threshold for significant changes of protein expression. With these criteria, the expression of 122 proteins was changed in the mitochondria of NCI_ADR/RES cells, including 40 proteins being down-regulated and 82 proteins being up-regulated in DOX-resistant NCI_ADR/RES cells (Additional file 2: Supplementary Table 2). 54 proteins annotated to be located in mitochondria in UniprotKB database was listed in Table 1.
Differentially expressed mitochondrial protein* between OVCAR8 and NCI_ADR/RES cells quantified by SILAC.
| Accession | Gene name | Protein name | SILAC ratio (NCI_ADR/RES/OVCAR8) |
|---|---|---|---|
| P08183 | MDR1 | ATP-binding cassette, sub-family B (MDR/TAP), member 1 | 24.16±5.56 |
| Q9BZF9 | UACA | Uvealautoantigen with coiled-coil domains and ankyrin repeats | 2.46±0.72 |
| Q9UQ90 | SPG7 | Spastic paraplegia 7 protein | 2.18±0.37 |
| Q9BX68 | HINT2 | Histidine triad nucleotide-binding protein 2, mitochondrial | 2.04±0.26 |
| P30536 | MBR | Mitochondrial benzodiazepine receptor | 2.41±0.60 |
| Q13232 | NME3 | Nucleoside diphosphate kinase 3 | 2.17±0.06 |
| P30048 | PRDX3 | Thioredoxin-dependent peroxide reductase, mitochondrial | 0.50±0.04 |
| P19367 | HK1 | Hexokinase-1 | 0.42±0.02 |
| Q969M1 | TOMM40B | Mitochondrial import receptor subunit TOM40B | 2.89±1.05 |
| Q6NUK1 | SCAMC1 | Mitochondrial ATP-Mg/Pi carrier protein 1 | 0.42±0.01 |
| E7FJF3 | GDAP1 | Ganglioside-induced differentiation-associated protein 1 | 2.55±0.89 |
| Q8N4T8 | CBR4 | Quinone reductase CBR4 | 2.51±0.05 |
| Q969P6 | TOP1MT | DNA topoisomerase I, mitochondrial | 2.32±0.36 |
| P13051 | UNG | Uracil-DNA glycosylase | 2.06±0.63 |
| Q9UHN1 | MTPOLB | DNA polymerase subunit gamma-2, mitochondrial | 2.00±0.53 |
| P55809 | OXCT1 | Succinyl-CoA:3-ketoacid-coenzyme A transferase 1 | 0.48±0.04 |
| Q5ST30 | VARS2 | Valyl-tRNAsynthetase, mitochondrial | 2.50±0.60 |
| Q9HA77 | CARS2 | Probable cysteinyl-tRNAsynthetase, mitochondrial | 0.30±0.03 |
| Q9UIJ7 | AK3 | GTP:AMP phosphotransferase mitochondrial | 2.58±0.22 |
| Q9Y6E7 | SIRT4 | NAD-dependent ADP-ribosyltransferase sirtuin-4 | 2.87±0.08 |
| O00746 | NME4 | Nucleoside diphosphate kinase, mitochondrial | 2.19±0.24 |
| Q9UDR5 | AASS | Alpha-aminoadipicsemialdehyde synthase, mitochondrial | 2.53±0.47 |
| P36957 | DLST | 2-oxoglutarate dehydrogenase complex component E2 | 2.48±1.20 |
| O14874 | BCKDK | [3-methyl-2-oxobutanoate dehydrogenase [lipoamide]] kinase, mitochondrial | 2.47±1.34 |
| P49419 | ALDH6A1 | Aldehyde dehydrogenase family 6 member A1 | 2.13±0.27 |
| Q9UKU7 | ACAD8 | Isobutyryl-CoA dehydrogenase, mitochondrial | 2.04±0.26 |
| Q96H96 | COQ2 | Para-hydroxybenzoate--polyprenyltransferase, mitochondrial | 2.08±1.05 |
| Q8NE62 | CHDH | Choline dehydrogenase, mitochondrial | 2.99±0.30 |
| O94925 | GLS | Glutaminase kidney isoform, mitochondrial | 2.02±0.13 |
| P30837 | ALDH1B1 | Aldehyde dehydrogenase X, mitochondrial | 2.17±0.16 |
| Q9NUB1 | ACAS2L | Acetyl-CoA synthetase 2 | 2.05±0.94 |
| P45954 | ACADSB | Short/branched chain specific acyl-CoA dehydrogenase, mitochondrial | 0.40±0.06 |
| Q9P2J9 | PDP2 | [Pyruvate dehydrogenase [acetyl-transferring]]-phosphatase 2, mitochondrial | 0.44±0.04 |
| Q8IW45 | CARKD | Carbohydrate kinase domain-containing protein | 0.47±0.13 |
| A3KMH1 | VWA8 | von Willebrand factor A domain-containing protein 8 | 0.45±0.05 |
| Q13423 | NNT | NAD(P) transhydrogenase, mitochondrial | 0.49±0.02 |
| Q13825 | AUH | Methylglutaconyl-CoA hydratase, mitochondrial | 0.19±0.06 |
| P05166 | PCCB | Propionyl-CoA carboxylase beta chain, mitochondrial | 0.43±0.07 |
| P05165 | PCCA | Propionyl-CoA carboxylase alpha chain, mitochondrial | 0.42±0.06 |
| P28288 | ABCD3 | ATP-binding cassette sub-family D member 3 | 0.40±0.03 |
| Q305V2 | ND2 | NADH-ubiquinone oxidoreductase chain 2 | 2.17±1.23 |
| P13498 | CYBA | Cytochrome b(558) alpha chain | 2.07±1.46 |
| A7UNU5 | ETFDH | Electron transfer flavoprotein-ubiquinone oxidoreductase, mitochondrial | 2.05±0.18 |
| E5KRX5 | SURF1 | Surfeit locus protein 1 | 2.44±0.77 |
| Q5TC12 | ATP11 | ATP synthase mitochondrial F1 complex assembly factor 1 | 0.36±0.01 |
| Q9NX18 | SDH5 | Succinate dehydrogenase assembly factor 2, mitochondrial | 0.28±0.07 |
| P21980 | TGM2 | Protein-glutamine gamma-glutamyltransferase 2 | 2.51±0.55 |
| P17931 | LGALS3 | Galactose-specific lectin 3 | 2.26±0.33 |
| Q96NE9 | FRMD6 | FERM domain-containing protein 6 | 2.32±0.16 |
| Q86UT6 | NLRX1 | NLR family member X1 | 4.02±0.16 |
| Q96CU9 | FOXRED1 | FAD-dependent oxidoreductase domain-containing protein 1 | 2.83±0.56 |
| Q3MIX3 | ADCK5 | Uncharacterized aarF domain-containing protein kinase 5 | 2.80±0.46 |
| Q53H82 | LACTB2 | Beta-lactamase-like protein 2 | 2.20±0.16 |
| Q9GZT6 | MDS025 | Coiled-coil domain-containing protein 90B, mitochondrial | 2.07±0.38 |
* Protein was annotated in Uniprot database as mitochondrial protein or to be located in mitochondria.
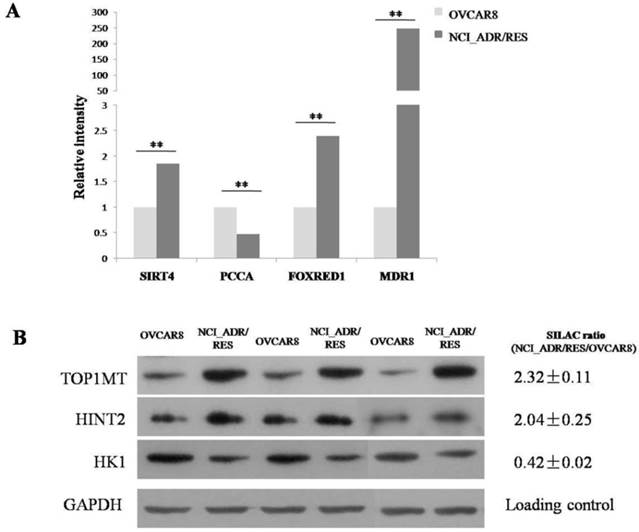
Validation of differential expressed proteins
The differential expression levels of proteins quantified by SILAC approach were validated using real-time quantitative RT-PCR. Figure 2A shows relative mRNA expression levels of MDR1, PCCA, FOXRED1 and Sirt4 normalized against GAPDH. Compared with OVCAR8, NCI_ADR/RES cells have a marked up-regulation of MDR1, FOXRED1 and Sirt4, and a down-regulation of PCCA, which were identical with SILAC results. Figure 2B shows the western blot results of TOP1MT, HINT2 and HK1 expression in the two cell lines. Compared to OVCAR8 cells, the protein expression of TOP1MT and HINT2 were up-regulated in NCI_ADR/RES cells, whereas the expression of HK1 was down-regulated, which were consistent with SILAC quantification results.
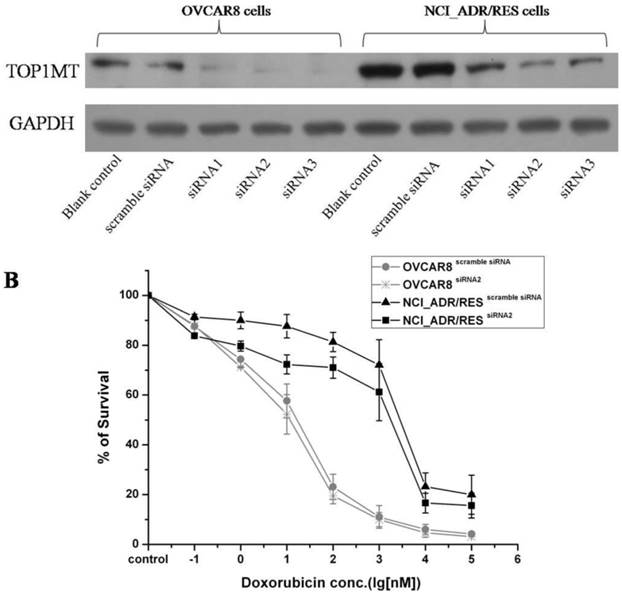
Evaluation of the roles of TOP1MT on doxorubicin resistance in ovarian cancer using RNAi
SILAC results shown that TOP1MT are up-regulated in doxorubicin resistant NCI_ADR/RES cells compared to doxorubicin-sensitive OVCAR8 cells. Western bolt results also validated the SILAC results (Figure 2B). Then, we performed knockdown experiments in OVCAR8 and NCI_ADR/RES cells to evaluate the roles of TOP1MT in doxorubicin resistance. Three pairs of TOP1MT target siRNAs were selected to performed RNAi experiment and immunoblot analysis showed that siRNA 2 and siRNA 3 could conduct greater than 90% efficiency in the reduction of the protein level of TOP1MT in OVCAR8 cells and more than 80% efficiency in the reduction of the protein level of TOP1MT in NCI_ADR/RES cells when GAPDH was used as the internal standard (Figure 3A). Since siRNA2 is much more effective, it was chosen for further functional study. As shown in Figure 3B, no decreased viability in TOP1MT knockdown OVCAR8 cells, and 13% reduction in the viability of TOP1MT knockdown NCI_ADR/RES cells following treatment with indicated concentrations of doxorubicin compared to scramble siRNA transfected controls. This result clearly demonstrated that TOP1MT involved in MDR in ovarian cancer.
Functional classification of dysregulated mitochondrial proteins
The functional annotation of the dysregulated proteins with Uniprot and Panther revealed that most of these proteins are related to cell apoptosis, substance metabolism, cell adhesion, transport, detoxification and drug metabolism (Figure 1). Some of the key proteins that may contribute in part to DOX resistance in ovarian cancer cells are discussed below.
Functional annotation of dysregulated proteins in the mitochondria of NCI_ADR/RES cells as compared to OVCAR8 cells.
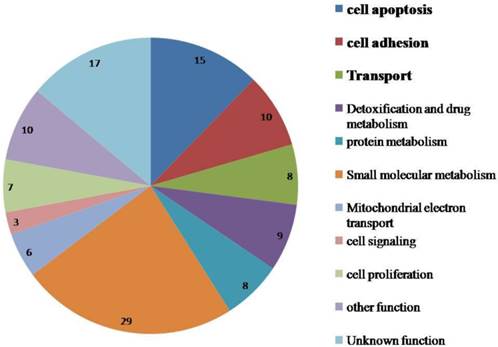
Cell death Since most anticancer agents exert anticancer effects through induction of apoptosis, the escape of apoptosis or increase of anti-apoptosis activities presents a key mechanism of acquired drug resistance in the cancer cells [10, 19]. Since mitochondria are critical “gatekeepers” to the apoptosis process, as expected, the expression levels of 15 mitochondrial proteins that play important roles in the apoptosis were changed in NCI_ADR/RES cells. P-gp1, the protein product of the MDR1 (multidrug resistance protein 1) gene, is responsible for pumping DOX out of the cells in an ATP-dependent manner to reduce the accumulation of DOX in cells, thus accounting partially for the mechanism of DOX resistance[20]. However, P-gp1 has also been identified to be expressed in the mitochondria and has a functional activity in the mitochondria of MDR cells [21-23]. Besides acting as drug pump, P-gp1 was also reported to protect resistant tumor cells from caspase-dependent apoptosis in the mitochondria [24, 25], thus accounting for drug-resistance. Here, qRT-PCR showed that the mRNA expression level of P-gp1was up-regulated by 240 fold (Figure 2A) and protein level of this protein was up-regulated by 24-fold (SILAC ratio = 24.2 ± 5.56) in NCI_ADR/RES cells. However, most previously published proteomic studies on DOX resistance didn't identify this 170 kD membrane protein due to the limitation of the 2-DE method used[8, 26], which is biased against membrane proteins and the extremely low and high molecular weight proteins.
Validate SILAC results with qRT-PCR and western blot A: Relative mRNA expression levels of Sirt4, PCCA, FOXRED1, MDR1 after normalization with GAPDH mRNA levels as determined by qRT-PCR. B: Western blot analysis of TOP1MT, HINT2 and HK1 expression in the two cell lines.
SLK(STE20-related serine/threonine-protein kinase), a caspase 3-activated kinase, plays a role in the induction of apoptosis [27, 28], its expression was found to be down-regulated in NCI_ADR/RES cells. Hexokinase 1 (HK1), an important protein to coordinate glycolysis and oxidative phosphorylation, was also found to inhibit cell apoptosis by modulating Bax, Bak and Bad [29]. Here, its expression was down-regulated in NCI_ADR/RES cells (Figure 2B). However, histidine triad nucleotide-binding protein 2(HINT2), a mitochondrial apoptotic sensitizer [30], was up-regulated in DOX-resistant cells (Figure 2B).The exact mechanism for its up-regulation in DOX-resistant NCI_ADR/RES cells is still unknown. Collectively, dysregulated anti-apoptotic protein P-gp1and these apoptosis-related proteins might increase the antiapoptotic ability of NCI_ADR/RES cells, thus contribute to drug resistance.
Substance metabolism As mitochondria play a key role in substance metabolism, the expression of some proteins participating in metabolism including protein metabolism, nucleotide metabolism, amino acid metabolism and small molecular metabolism were changed in NCI_ADR/RES cells. In agreement with previous findings that DOX could affect fatty acid metabolism in the heart [2], the levels of several proteins participating in fatty acid beta-oxidation, including ABCD3,PCCB,PCCA, decreased in NCI_ADR/RES cells. As impairment of essential fatty acid metabolism plays a key role in DOX-induced damage in cultured rat cardiomyocytes [31], we speculate that down-regulation of these fatty acid metabolism related proteins may represent one aspect of DOX toxicity in NCI_ADR/RES cells.
Detoxification and drug metabolism One mechanism of MDR is that cancer cells up-regulate some DNA repair proteins, such as TOP1MT, UNG, and MTPOLB, to repair drug-induced damage, TOP1MT is a mitochondrial protein involved in mitochondrial DNA replication, and RNAi knockdown experiment demonstrated its involvement in doxorubicin resistance in NCI_ADR/RES cells (Figure 3). In addition, up-regulation of some drug-response proteins, such as xenobiotic metabolizing protein EPHX1 and doxorubicin metabolic enzyme CBR4, could also protect NCI_ADR/RES cells from drug insults. DOX treatment may cause adaptive response through the mitochondrial antioxidant defense system and detoxification enzymes, thus potentially contribute to the occurrence of multidrug resistance.
Evaluation of the role of TOP1MT on doxorubicin resistance in OVCAR8 and NCI_ADR/RES cells using siRNA knockdown A:Western blot analysis shown that transfection of OVCAR8 and NCI_ADR/RES cells with three pairs of TOP1MT siRNAs significantly reduced TOP1MT levels, whereas TOP1MT protein level was not significantly suppressed by control siRNA and Lipofectamine 2000(Blank control). B: CCK8 assay shown that transfection of NCI_ADR/RES cells with TOP1MT siRNA 2 reduced the cell viability following treatment with indicated concentrations of doxorubicin compared to sracmble siRNA transfected controls, whereas it has no effect in OVCAR8 cells.
Besides that, DOX also affect the expression of some mitochondrial enzymes involved in respiration and oxidative phosphorylation, such as ND2, CYBA, ETFDH, SURF1, ATP11, and SDH5. However, some key components of oxidative phosphorylation kept unchanged in NCI_ADR/RES cells (supplementary table 1), indicating that mitochondrial participation in DOX resistance is not related with mitochondrial energy production, but rather its role in cell apoptosis.
Several mitochondrial proteomic studies have been performed to screen for doxorubicin-resistant biomarkers of cancer. Strong et al. investigated mitochondrial proteome alterations in ADR/verapamil resistant MCF-7 breast cancer cells (MCF-7/ADRVp) with 2-DE and MS, and found that the abundance of 13 proteins was changed in the soluble mitochondrial fraction of MCF-7/ADRVp cells [32]. Although both MCF-7/ADRVp and NCI_ADR/RES cells showed resistance to DOX, the expression patterns of several proteins were different in these two types of drug resistant cells. Expression levels of cofilin, trifunctional enzyme subunit alpha and isoform 1 of 3,2-trans-enoyl-CoA isomerase were found to be up-regulated in MCF-7/ADRVp cells but were unchanged in NCI_ADR/RES cells. Jiang et al. investigated alterations in the mitochondrial proteome of Raji cells treated with ADR using 2D-DIGE and LTQ-MS/MS, and found altered expression of 37 proteins [33], some of which do not agree with the findings for MCF-7/ADRVp or NCI_ADR/RES. For example, PHB, which was up-regulated in DOX-treated Raji cells, was virtually unaltered in NCI_ADR/RES cells. The different origins of the cell lines may account for these differences.
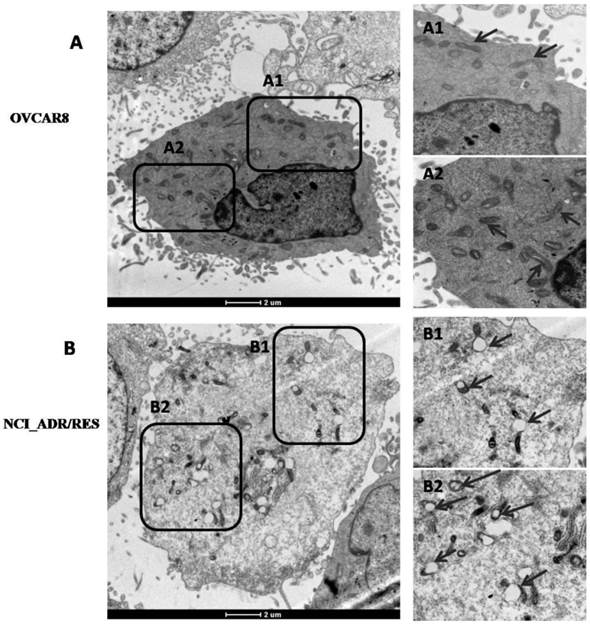
Mitochondrial morphology observation with electron microscopy (EM)
Besides changes of mitochondrial protein expression, mitochondrial morphology and its architecture were further observed with EM. Most of mitochondria in OVCAR8 cells were rod-like and elongated in shape and the cristae were regularly distributed (Figure 4A, A1), while those in NCI/ADR-RES cells were mainly round and swollen, with some vacuolation in the cristae (Figure 4B, B1). These observations are in agreement with previous studies on mitochondria in the human breast carcinoma MCF-7 cell line and its derived multidrug-resistant subline MCF-7/DX [34] and DOX-treated HepG2 cells [35]. Since mitochondrial swelling and vacuolation are signs of impaired mitochondrial function that ultimately result in mitochondrial energy deficit, mitochondrial impairment may be one of the underlying mechanisms accounting for DOX-induced MDR in ovarian cancer.
Ultrastructure of OVCAR8 and NCI_ADR/RES cells shown by electron microscopy. (A) Overview of the ultrastucture of OVCAR 8 cells. A1 and A2are the enlarged images of the selected areas of (A). Arrows: rod-like mitochondria with complete cristae. (B) Overview of the ultrastructure of NCI_ADR/RES cells. B1 and B2 are the enlarged images of the selected areas of (B). Arrows: Swollen mitochondria with vacuolation in the cristae.
Mitochondrial localization observation and mitochondrial membrane potential analysis
To investigate the localization of mitochondria in OVCAR8 and NCI_ADR/RES cells, mitochondria were stained with two different techniques: immunofluorescence (IF) and Mitotracker Green staining. With IF observation, mitochondria are crowded around the nucleus and spread toward the cell periphery with strong fluorescencein OVCAR8 cells, whereas the mitochondria are evenly distributed through the cytoplasm with weaker fluorescence in the drug-resistant NCI_ADR/RES cells (Figure 5A).
Analysis of mitochondrial function A: Immunofluorescence observation of mitochondria localization. The mitochondria of OVCAR8 cells and NCI_ADR/RES cells were detected with mitochondrial ATP synthase β antibody and CF™488A labeled fluorescent secondary antibody (green). Nuclei were stained with DAPI (blue). Magnification: all images 1200×. B: Fluorescence images of Mitotracker Green staining in OVCAR8and NCI_ADR/RES cells. Mitochondria in the cells were stained with 50 nM Mitotracker Green for 20 min and observed under a confocal microscope. C: Mitochondria membrane potential analysis in OVCAR8 and NCI_ADR/RES cells. Cells were stained with 50 nM Rhodamine B for 30 min and analyzed with a flow cytometer.
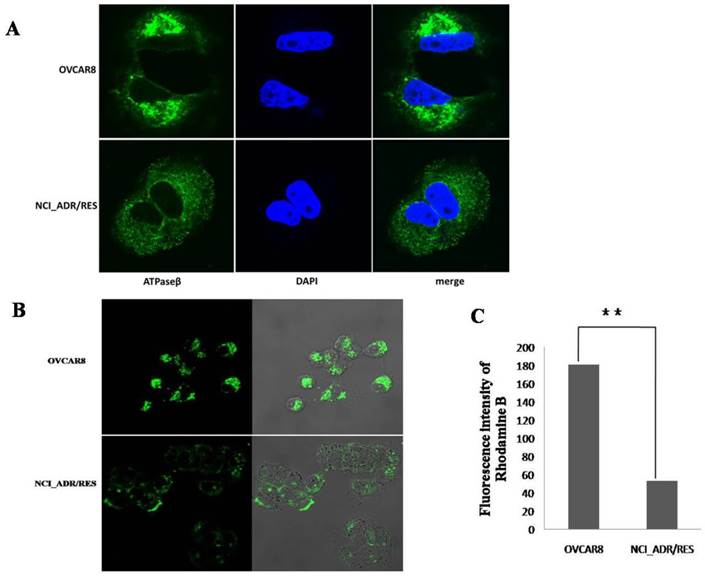
With Mitotracker Green staining, similar situation was observed in OVCAR8 cells with IF, however, mitochondria are only observed in the subplasmalemmal regions but not in the cytoplasm in NCI_ADR/RES cells (Figure 5B). The different findings in the NCI_ADR/RES cells may be related with the differences on these two methods in detecting mitochondria: Mitotracker Green staining of mitochondria is dependent on mitochondrial membrane potential (MMP), while IF detection of mitochondria is independent of MMP. Based on the different observations of mitochondria with IF and Mitotracker Green staining in NCI_ADR/RES cells, we speculate that there are two populations of mitochondria present in resistant NCI_ADR/RES cells: active peripheral mitochondria with MMP and central mitochondria with noMMP. Similar observations were reported in resistant MCF-7/DX cells[34].Cells adjust the localization of mitochondria to meet different functional needs: the role of peripheral mitochondria is to produce ATP for cell motility and secretion and to regulate calcium concentration at the plasma membrane [36, 37], while central mitochondria are involved in calcium signaling in the ER and in the cell apoptosis pathway[38, 39].The two populations of mitochondria in the NCI_ADR/RES cells may thus have different roles: peripheral mitochondria supply ATP for cell detoxification and cell motility, and central mitochondria with no MMP could interfere with the cell apoptosis and contribute to drug resistance. Consistent with this speculation, mitochondrial membrane potential (MMP, ΔΨm) measured with Rhodamine B was greatly decreased in NCI/ADR-RES cells (Figure 5C). As ΔΨm is essential for mitochondrial function, decreased ΔΨm indicate that NCI/ADR-RES cells have impaired mitochondrial functions.
In all, important mitochondrial protein expression, mitochondrial morphology, localization and activities were changed in NCI_ADR/RES cells, supporting the connection between mitochondrial activity and cell resistance to chemotherapeutic agents, indicating that the impairment of mitochondria plays an important role in DOX resistance in NCI_ADR/RES cells and mitochondria would be considered as therapeutic targets for cancer chemotherapy.
Conclusions
In this study, the SILAC-based quantitative proteomic strategy was applied to study protein changes in the mitochondria of OVCAR8 and its doxorubicin-resistant NCI_ADR/RES cells. Our results demonstrate that the expression of some proteins participating in cell apoptosis was changed in NCI_ADR/RES cells, indicating increased antiapoptotic activities in resistant cells. Further analysis showed that mitochondrial morphology, localization and mitochondrial membrane potential were greatly changed in doxorubicin-resistant NCI_ADR/RES cells, confirming that mitochondrial function is impaired in NCI_ADR/RES cells. All these results indicate that mitochondria play an important role in doxorubicin resistance in ovarian cancer cells and mitochondria could be novel therapeutic targets for overcoming drug resistance in ovarian and other human cancers.
Supplementary Material
Additional File 1Supplementary table S1.
Supplementary table S2.
Supplementary figures S1-S4.
Acknowledgements
We would like to thank all members of the Laboratory of Proteomics, Institute of Biophysics, Chinese Academy of Sciences, for their supports in this research. This research was supported in part by the National Basic Research Program of China (973) (Grant nos. 2010CB833703, 2012CB966803, 2011CB915501, 2013CB733802 and 2014CB744503, 2014CBA02003), the National Natural Science Foundation of China (Grant nos. 90919047 and 81371596) and the intramural research program of the National Institute of Biomedical Imaging and Bioengineering, National Institutes of Health. The authors gratefully acknowledge the support of K. C. Wong Education Foundation, Hong Kong. We would also like to thank the Center for Biological Imaging (CBI), Institute of Biophysics, Chinese Academy of Science, for our Confocal Microscopy work and acknowledge Chunli Jiang for her help of taking images.
Competing Interests
The authors have declared that no competing interest exists.
References
1. Siegel R, Naishadham D, Jemal A. Cancer statistics, 2013. CA Cancer J Clin. 2013;63:11-30
2. Tokarska-Schlattner M, Wallimann T, Schlattner U. Alterations in myocardial energy metabolism induced by the anti-cancer drug doxorubicin. C R Biol. 2006;329:657-68
3. Minotti G, Menna P, Salvatorelli E, Cairo G, Gianni L. Anthracyclines: molecular advances and pharmacologic developments in antitumor activity and cardiotoxicity. Pharmacol Rev. 2004;56:185-229
4. Gewirtz DA. A critical evaluation of the mechanisms of action proposed for the antitumor effects of the anthracycline antibiotics adriamycin and daunorubicin. BiochemPharmacol. 1999;57:727-41
5. Gottesman MM, Fojo T, Bates SE. Multidrug resistance in cancer: role of ATP-dependent transporters. Nat Rev Cancer. 2002;2:48-58
6. Righetti PG, Castagna A, Antonioli P, Cecconi D, Campostrini N, Righetti SC. Proteomic approaches for studying chemoresistance in cancer. Expert Rev Proteomics. 2005;2:215-28
7. Hammer E, Bien S, Salazar MG, Steil L, Scharf C, Hildebrandt P. et al. Proteomic analysis of doxorubicin-induced changes in the proteome of HepG2cells combining 2-D DIGE and LC-MS/MS approaches. Proteomics. 2009;10:99-114
8. Keenan J, Murphy L, Henry M, Meleady P, Clynes M. Proteomic analysis of multidrug-resistance mechanisms in adriamycin-resistant variants of DLKP, a squamous lung cancer cell line. Proteomics. 2009;9:1556-66
9. Pommier Y, Sordet O, Antony S, Hayward RL, Kohn KW. Apoptosis defects and chemotherapy resistance: molecular interaction maps and networks. Oncogene. 2004;23:2934-49
10. Preston TJ, Abadi A, Wilson L, Singh G. Mitochondrial contributions to cancer cell physiology: potential for drug development. Adv Drug Deliv Rev. 2001;49:45-61
11. Ong SE, Blagoev B, Kratchmarova I, Kristensen DB, Steen H, Pandey A. et al. Stable isotope labeling by amino acids in cell culture, SILAC, as a simple and accurate approach to expression proteomics. Mol Cell Proteomics. 2002;1:376-86
12. Cui Z, Hou J, Chen X, Li J, Xie Z, Xue P. et al. The profile of mitochondrial proteins and their phosphorylation signaling network in INS-1 beta cells. J Proteome Res. 2010;9:2898-908
13. Chen X, Cui Z, Wei S, Hou J, Xie Z, Peng X. et al. Chronic high glucose induced INS-1beta cell mitochondrial dysfunction: A comparative mitochondrial proteome with SILAC. Proteomics. 2013;13:3030-9
14. Cui Z, Chen X, Lu B, Park SK, Xu T, Xie Z. et al. Preliminary quantitative profile of differential protein expression between rat L6 myoblasts and myotubes by stable isotope labeling with amino acids in cell culture. Proteomics. 2009;9:1274-92
15. Cox J, Mann M. MaxQuant enables high peptide identification rates, individualized p.p.b.-range mass accuracies and proteome-wide protein quantification. Nat Biotechnol. 2008;26:1367-72
16. Thomas PD, Campbell MJ, Kejariwal A, Mi H, Karlak B, Daverman R. et al. PANTHER: a library of protein families and subfamilies indexed by function. Genome Res. 2003;13:2129-41
17. Reungpatthanaphong P, Dechsupa S, Meesungnoen J, Loetchutinat C, Mankhetkorn S. Rhodamine B as a mitochondrial probe for measurement and monitoring of mitochondrial membrane potential in drug-sensitive and -resistant cells. J BiochemBiophys Methods. 2003;57:1-16
18. Liscovitch M, Ravid D. A case study in misidentification of cancer cell lines: MCF-7/AdrR cells (re-designated NCI/ADR-RES) are derived from OVCAR-8 human ovarian carcinoma cells. Cancer Lett. 2007;245:350-2
19. Morisaki T, Katano M. Mitochondria-targeting therapeutic strategies for overcoming chemoresistance and progression of cancer. Curr Med Chem. 2003;10:2517-21
20. De Oliveira F, Chauvin C, Ronot X, Mousseau M, Leverve X, Fontaine E. Effects of permeability transition inhibition and decrease in cytochrome c content on doxorubicin toxicity in K562 cells. Oncogene. 2006;25:2646-55
21. Munteanu E, Verdier M, Grandjean-Forestier F, Stenger C, Jayat-Vignoles C, Huet S. et al. Mitochondrial localization and activity of P-glycoprotein in doxorubicin-resistant K562 cells. BiochemPharmacol. 2006;71:1162-74
22. Shen Y, Chu Y, Yang Y, Wang Z. Mitochondrial localization of P-glycoprotein in the human breast cancer cell line MCF-7/ADM and its functional characterization. Oncol Rep. 2012;27:1535-40
23. Jungsuwadee P, Nithipongvanitch R, Chen Y, Oberley TD, Butterfield DA, St Clair DK. et al. Mrp1 localization and function in cardiac mitochondria after doxorubicin. MolPharmacol. 2009;75:1117-26
24. Johnstone RW, Cretney E, Smyth MJ. P-glycoprotein protects leukemia cells against caspase-dependent, but not caspase-independent, cell death. Blood. 1999;93:1075-85
25. Smyth MJ, Krasovskis E, Sutton VR, Johnstone RW. The drug efflux protein, P-glycoprotein, additionally protects drug-resistant tumor cells from multiple forms of caspase-dependent apoptosis. ProcNatlAcadSci U S A. 1998;95:7024-9
26. Shen SH, Gu LJ, Liu PQ, Ye X, Chang WS, Li BS. Comparative proteomic analysis of differentially expressed proteins between K562 and K562/ADM cells. Chin Med J (Engl). 2008;121:463-8
27. Sabourin LA, Rudnicki MA. Induction of apoptosis by SLK, a Ste20-related kinase. Oncogene. 1999;18:7566-75
28. Sabourin LA, Tamai K, Seale P, Wagner J, Rudnicki MA. Caspase 3 cleavage of the Ste20-related kinase SLK releases and activates an apoptosis-inducing kinase domain and an actin-disassembling region. Mol Cell Biol. 2000;20:684-96
29. Danial NN, Gramm CF, Scorrano L, Zhang CY, Krauss S, Ranger AM. et al. BAD and glucokinase reside in a mitochondrial complex that integrates glycolysis and apoptosis. Nature. 2003;424:952-6
30. Martin J, Magnino F, Schmidt K, Piguet AC, Lee JS, Semela D. et al. Hint2, a mitochondrial apoptotic sensitizer down-regulated in hepatocellular carcinoma. Gastroenterology. 2006;130:2179-88
31. Bordoni A, Biagi P, Hrelia S. The impairment of essential fatty acid metabolism as a key factor in doxorubicin-induced damage in cultured rat cardiomyocytes. BiochimBiophysActa. 1999;1440:100-6
32. Strong R, Nakanishi T, Ross D, Fenselau C. Alterations in the mitochondrial proteome of adriamycin resistant MCF-7 breast cancer cells. J Proteome Res. 2006;5:2389-95
33. Jiang YJ, Sun Q, Fang XS, Wang X. Comparative mitochondrial proteomic analysis of Rji cells exposed to adriamycin. Mol Med. 2009;15:173-82
34. Villa AM, Doglia SM. Mitochondria in tumor cells studied by laser scanning confocal microscopy. J Biomed Opt. 2004;9:385-94
35. Qian H, Yang Y. Alterations of cellular organelles in human liver-derived hepatoma G2 cells induced by adriamycin. Anticancer Drugs. 2009;20:779-86
36. Lackner LL. Determining the shape and cellular distribution of mitochondria: the integration of multiple activities. CurrOpin Cell Biol. 2013;25:471-6
37. Quintana A, Schwarz EC, Schwindling C, Lipp P, Kaestner L, Hoth M. Sustained activity of calcium release-activated calcium channels requires translocation of mitochondria to the plasma membrane. J Biol Chem. 2006;281:40302-9
38. Campanella M, Pinton P, Rizzuto R. Mitochondrial Ca2+ homeostasis in health and disease. Biol Res. 2004;37:653-60
39. Brenner C, Le Bras M, Kroemer G. Insights into the mitochondrial signaling pathway: what lessons for chemotherapy? J ClinImmunol. 2003;23:73-80
Author contact
![]() Corresponding author: Fuquan Yang (fqyangac.cn); Xiaoyuan Chen (shawn.chengov).
Corresponding author: Fuquan Yang (fqyangac.cn); Xiaoyuan Chen (shawn.chengov).