Impact Factor
- Issue 14; 2026
- Issue 13; 2026
- Issue 12; 2026
- Issue 11; 2026
- Issue 10; 2026
- Volume 16; 2026
- Advance Articles
- Past Issues
- Cover Images
- Cover Suggestion
- Index & Coverage
- Special Issues
1. Introduction
2. Cytotoxic T lymphocytes and...
3. Tracking T cells by optical...
4. Tracking T cells by MRI
5. Tracking the T cells by...
6. Concluding remarks
References
International Journal of Biological Sciences
International Journal of Medical Sciences
 Global reach, higher impact

Theranostics 2014; 4(10):990-1001. doi:10.7150/thno.9268 This issue Cite
Review
Molecular Imaging in Tracking Tumor-Specific Cytotoxic T Lymphocytes (CTLs)
Zhiyi Liu, Zheng Li ![]()
Department of Translational Imaging, Houston Methodist Research Institute, Weill Medical College Cornell University, 6670 Bertner Avenue, Houston, TX 77030, USA.
Received 2014-3-31; Accepted 2014-6-30; Published 2014-7-28
Abstract
Despite the remarkable progress of adoptive T cell therapy in cancer treatment, there remains an urgent need for the noninvasive tracking of the transfused T cells in patients to determine their biodistribution, viability, and functionality. With emerging molecular imaging technologies and cell-labeling methods, noninvasive in vivo cell tracking is experiencing impressive progress toward revealing the mechanisms and functions of these cells in real time in preclinical and clinical studies. Such cell tracking methods have an important role in developing effective T cell therapeutic strategies and steering decision-making process in clinical trials. On the other hand, they could provide crucial information to accelerate the regulatory approval process on the T cell therapy. In this review, we revisit the advances in tracking the tumor-specific CTLs, highlighting the latest development in human studies and the key challenges.
Keywords: molecular imaging, noninvasive cell tracking, cytotoxic T cells, immunotherapy, adoptive T cell transfer, cell labeling.
1. Introduction
T lymphocytes (T cells) play a central role in cell-mediated immunity by regulating the functions of other immune cells (such as the B cells and macrophages) and attacking diseased cells and tumors. As a strategy to escape the surveillance by T cells, many cancer cells can sculpt a microenvironment that suppresses the activity, survival or migration of T cells, which disguises them from detection of the immune system. However, in immunotherapy, cytotoxic T cells can be manipulated to recognize tumor-specific antigens [1]. When infused into a patient, the engineered T cells actively attack and destroy the tumors displaying these antigens. Recent years have witnessed impressive progress in cancer immunotherapy. Transfusion of the tumor-specific cytotoxic T cells, or adoptive T cell therapy, has been in various clinical trials for personalized medicine [2]. As a result, the ability to track T cells in vivo to determine their homing and infiltration capacity into the tumor, the retention time within the tumor and the functionality highlights the urgent need for evaluating immunotherapies mediated by adoptively transferred T cells.
Conventional immune monitoring methods, such as histology, flow cytometry, and both “direct” and “indirect” T-cell frequency analysis, provide limited information for clinical assessment on the T-cell therapies. Currently the efficacy of the adoptive T-cell therapy in clinical trials is largely evaluated by reduction in tumor size after treatment, which cannot provide a prompt and accurate assessment. Challenging questions like biodistribution and functionality of the T cells following injection still remain; and noninvasive imaging may be a key to answering these questions. At present, various T cell tracking methods have been developed using noninvasive molecular imaging technologies, which allow the researchers to reveal the delicate biological/biochemical processes of the adoptive T cells in a living subject. The ultimate goal is to noninvasively track the infused tumor-specific T cells, and to unveil the biodistribution, mechanism and function of these cells for determining the efficacy of the T cell therapy in a timely manner and assisting decision-making in clinical trials. Although the field is experiencing a rapid progress, we still face challenges in developing safe and reliable methods for noninvasive tracking of the infused T cells in patients. As we know, indium-111 (111In)-oxiquinolon and technetium-99m-hexamethylpropylene amine oxime (99mTc-HMPAO) have been a clinical routine for ex vivo labeling of autologous leukocytes for detecting infections and inflammations [3]; yet until now few radiopharmaceutical tracking methods surpass them in clinical settings.
The imaging modalities applied for T cell tracking in both preclinical and clinical studies include optical fluorescence/bioluminescence imaging, computed tomography (CT), magnetic resonance imaging (MRI), positron emission tomography (PET), and single photon emission computed tomography (SPECT). Each modality has inherent advantages and limitations (Table 1). Selection of the optimal modality for a particular T-cell therapy study depends on relevant cellular process and expected readout. Optical fluorescence/bioluminescence imaging has high sensitivity, in which the lower limits of detection may reach picomolar or even femtomolar concentrations of the optical reporters or contrast agents. In small animal models, optical imaging technologies provide fast readouts of the biodistribution, function and survival information of the infused T cells longitudinally at low cost. It is a powerful imaging tool to study the cellular and molecular processes but its application in large animals and clinic is limited due to poor penetration in deep tissues. In contrast, PET/SPECT imaging offers high sensitivity with no penetration issue, which makes it more fitted for T-cell tracking in large animal models and clinical trials. The high sensitivity of PET/SPECT allows detection of as low as 1× 10⁵ infused cells. Furthermore, the combined PET/CT or PET/MRI solves the spatial resolution problem of PET. Although the short half-life of the radioisotopes for PET/SPECT imaging precludes tracking directly-labeled T cells over extended time, the use of reporter genes in PET imaging breaks through this barrier. A promising clinical study with a PET reporter probe 18F-FHBG demonstrated that tumor-specific T cells expressing the reporter gene herpes simplex virus thymidine kinase (HSV-tk) homed to not only the patient's primary tumor but the metastatic lesions [5]. MRI has high spatial resolution and yields the best soft tissue contrast but suffers from poor sensitivity. Superparamagnetic iron oxide (SPIO) nanoparticles have been widely used to label various cells for in vivo cell tracking and some of them have been explored in clinical trials [6-14]. Notably, 19F MRI using perfluorocarbon (PFC) emerges as a new tool for cell tracking that detects the 19F nuclei associated with the labeled T-cells and provides high specificity and improved quantification [15]. Molecular imaging plays an important role in answering compelling questions in T cell therapy. Besides providing insights in T cell functionality, real time in vivo cell tracking using molecular imaging technologies can give objective information on the homing and infiltration capacity of T cells into the tumor, quantity of viable T cells reaching the tumor and the retention time in the tumor, which will directly reflect the tumor microenvironment and therapy efficacy. Herein we review the applications of different molecular imaging technologies in tracking the tumor-specific CTLs, highlighting advances in human studies and key challenges.
Molecular imaging techniques for T cell tracking.
| Imaging Modality | Tissue Penetration | Sensitivity | Spatial Resolution | Cost | Clinical Translation |
|---|---|---|---|---|---|
| Optical fluorescence /bioluminescence | <2 cm | High (~10-9 to10-12 M for fluorescence; ~10-15 to 10-17 M for bioluminescence) | ~2-5 mm | Low | Limited1 |
| MRI | Unlimited | Low (10-3 to 10-5 M) | <0.1mm (preclinical) ~1 mm (clinical) | High | Yes |
| PET/SPECT | Unlimited | High (10-11 to 10-12 M for PET; 10-10 to 10-11 M for SPECT) | 1-2 mm (preclinical) 5-10 mm (clinical) | High | Yes |
1. Although clinical applications of optical fluorescence/bioluminescence imaging are limited, they are widely used for mechanistic studies in preclinical animal models. It is worth noting that fluorescence-guided surgery confers improved precision in tumor resection while preserving critical structures [4].
2. Cytotoxic T lymphocytes and cell labeling methods
Cancer immunotherapy harnesses the immune system to fight cancer. This burgeoning field is catalyzed by latest approvals of immunotherapy-based treatments for multiple cancer types. Currently human solid cancer immunotherapy is focused on three areas: (1) Non-specific immunomodulation such as those shaped by the T cell growth factor interleukin-2 (IL-2), which leads to activation of tumor-reactive cells and mediates tumor regression; (2) Cancer vaccines that elicit the immune system to attack existing cancers or prevent cancer development in high-risk populations; and (3) Adoptive cell transfer/therapy (ACT), a procedure that involves cytotoxic T cells (CTLs) [16]. ACT has been extensively studied and shown great promise in cancer treatment. In ACT, specialized antigen-presenting cells (such as the dendritic cells) process and present the tumor-associated antigens. Recognizing these antigens displayed on the surface of the tumor cells, the migrating T cells are quickly sequestered in the tumor, forming the tumor-infiltrating lymphocyte (TIL) populations [17]. The TILs can be isolated by surgical resection and fragmentation of a tumor mass from the patient. Addition of T cell growth factor IL-2 can selectively grow and expand the T cells with certain TCR specificity [18]. These ex vivo cultured TILs can then be infused back into the patient to mediate durable regression of certain tumors [19]. Alternatively, researchers can also genetically engineer the T cells by expressing tumor antigen-specific T cell receptors (TCRs) or chimeric antigen receptors (CARs) in them [20]. The latter method conveniently expands the populations of tumor-specific T cells that can be adopted for a wider range of anticancer immunotherapies. The engineered T cells, with high avidity due to specified tumor antigens, can target and attack the tumor cells [20-25].
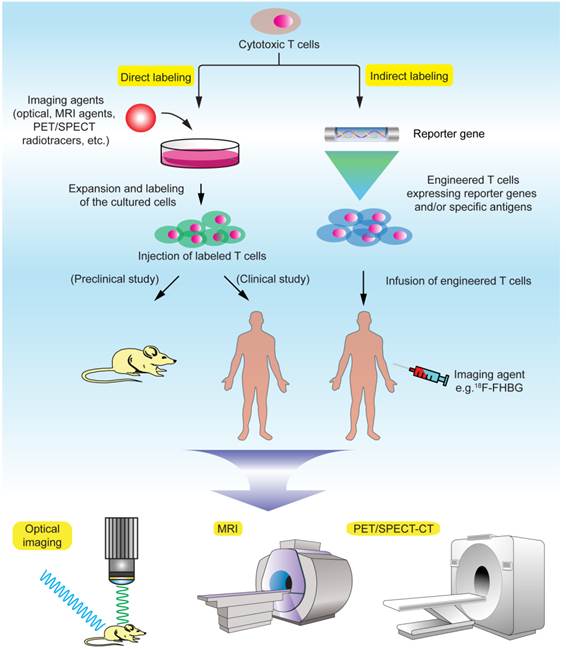
Obviously, the ability to track the infused T cells in the body over time has been a long cherished goal in understanding the mechanism and function of these cells and quickly evaluating T cell therapeutic efficacy in clinical trials [26]. There are two major principles in labeling the T cells for in vivo cell tracking: direct and indirect labeling (Fig. 1, Table 2). Direct labeling generally requires isolation and ex vivo expansion of the T cells from the subject, followed by labeling with a proper imaging probe in vitro and injection of these cells into the subject. Indirect labeling involves genetic engineering of the T cells by transfecting them with a reporter gene that encodes an enzyme or transporter, which can utilize the designated imaging probe as a substrate and allow for visualization and tracking of these T cells over time. Generally, direct labeling is relatively straightforward and widely used, but dilution of the probes caused by cell division may prevent accurate quantification of the signals, and extended cell tracking studies are difficult to perform. Indirect labeling methods, with T cells being engineered to stably express the reporters/enzymes, may allow in vivo longitudinal studies after the labeled cells are infused into the body. Another advantage is that signals given by indirect labeling methods are only from live cells, therefore permitting visualization of cell population expansion in vivo as long as the labeled T cells remain alive in the body [27]. But there is a concern that genetic engineering with reporter genes via complicated in vitro procedures may potentially affect the functionality, homing and viability of the T cells. In terms of labeling difficulty, indirect methods generally require complex genetic manipulations of the cells, and therefore are more challenging than direct methods. The choice of labeling methods and imaging modalities requires exquisite evaluation of the biological/biochemical process of the T cells in a particular study and desired readout.
Noninvasive T cell tracking by molecular imaging.
A comparison of direct and indirect labeling methods for T cell imaging.
| Labeling Methods | Advantages | Disadvantages | Impacts on T cell functions1 | Clinical Applicability |
|---|---|---|---|---|
| Optical | ||||
| Direct (fluorescent dyes) | Labeling procedure is relatively simple and straightforward Low cost Easy to perform | False signals from dead cells Probe dilution is an issue Toxicity concerns | Rarely affect T cell functions | No clinical application due to limited tissue penetration |
| Indirect (fluorescent proteins/bioluminescent agents) | Increased signal specificity Excellent for mechanistic studies | Genetic manipulation may affect cell functions Expression of exogenous proteins can be complicated | T cell functions may be altered by genetic manipulations | No clinical application due tolimited tissue penetration |
| MRI | ||||
| Direct (gadolinium complexes, SPIO, CEST and 19F-containing probes) | Labeling can be achieved by simple incubation Functionalization enables high labeling efficiency 19F-probes have no background noise (MRI signals directly correlate with labeled cells) | False signals from dead cells Probe dilution Toxicity should be addressed before application | Toxicity on T cells should be evaluated | Widely used for tracking stem cells and tumor cells in clinical trials, but no report on T cell tracking[27] |
| Indirect (MRI reporter genes) | Usage of both endogenous and exogenous substrates [38] | Genetic manipulation may affect cell functions Complex labeling protocols May have low sensitivity | T cell functions may be altered by genetic manipulations | No report on preclinical/ clinical T cell tracking |
| PET/SPECT | ||||
| Direct (e.g., 99mTc-HMPAO, 18F-FDG, 64Cu2+gold nanoparticles, etc.) | Labeling procedure is relatively simple | False signals from dead cells or probe leak Longitudinal studies are challenging due to short nuclide half life | Rarely affect T cell functions Ionizing radiation may affect cell viability | Widely used in preclinical studies but no report on clinical T cell tracking |
| Indirect (e.g., PET reporter genes such as HSV1-tk) | Longitudinal tracking | Complex steps of isolation, culturing and genetic manipulations for T cells Expensive costs | T cell functions may be altered by genetic manipulations | Cytotoxic T cells were modified to use 18F-FHBG and tracked in a GBM patient [5] |
1. Including homing, tumor infiltration and therapeutic capacity of T cells.
3. Tracking T cells by optical fluorescence and bioluminescence imaging
In optical fluorescence imaging, T cells are labeled by fluorophores, fluorescent proteins, or quantum dots (QDs). The fluorophores are usually near infrared (NIR) fluorescent dyes, such as indocyanine green, Cy5.5, IRDye800CW, VT680, and the Alexa Dye Series. Several reasons account for the preference of red (~625-740 nm) to NIR (~700-900 nm) fluorescent molecules to other fluorophores for molecular imaging: (1) minimum absorbance spectra for all biomolecules, (2) high photon count, (3) improved tissue penetration, and (4) reduced autofluorescence. The optical fluorescence imaging with fluorophores usually adopts a direct labeling strategy, while imaging with fluorescent proteins involves an indirect method. Bioluminescence optical imaging, on the other hand, is in principle distinct from the fluorescence imaging and involves an indirect labeling strategy.
Direct labeling methods
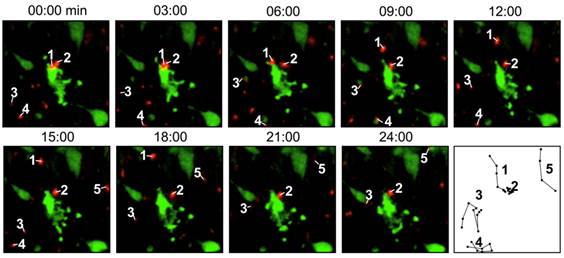
Direct labeling by fluorescent agents. In these studies, T cells are directly incubated and labeled with the fluorescent dyes. In a study to evaluate the migration and function of CTLs in a model of adoptive transfer immunotherapy, the CTLs were directly labeled with VT680 and the labeled cells could be detected by flow cytometry and multiphoton microscopy days after labeling. After injecting the cells into mice bearing xenograft tumors, the dynamic interactions between the labeled CTLs and the tumor cells could be detected by confocal intravital microscopy [28] (Fig. 2). Optical imaging using intravital two photon microscopy can precisely record the movements of the labeled T cells within the lymph nodes and tumor but poor tissue opacity limits its application in small animal studies. Quantum dots (QDs) are a class of semiconductor nanocrystals (2-6 nm in size) that have broad excitation spectra, high quantum yields and high molar extinction coefficients. Biocompatible QD conjugates have been used for sentinel lymph node mapping, tumor targeting and tumor angiogenesis imaging in preclinical settings [29]. A recent study described multicolor flow cytometry analysis of ex vivo QD-labeled T cells to investigate the immune response of CD8+ cytotoxic T cells in cancer development and immunotherapy [30]. But due to insufficient toxicity studies, the potential use of QD for in vivo T cell tracking has not been realized [31].
Intravital microscopy images showing the labeled T cells (red) are interacting with the tumor cells (green), which are undergoing apoptosis. The last panel records the migrating paths of the T cells. Reprinted with the permission of PLoS One, Swirski et al., 2007.
Indirect labeling methods
Indirect labeling by fluorescent proteins. Fluorescent proteins, such as green fluorescent protein (GFP) and red fluorescent protein (RFP), are also used to tag the T cells. A DNA construct carrying a coding sequence for GFP or RFP is introduced into the cell. The design of the construct has some flexibility - one can choose from various regulatory sequences to control the expression pattern of GFP/RFP - in desired cells/tissues, and at an appropriate timing. Overall, optical fluorescence imaging is relatively inexpensive and does not often cause biological safety concerns as those concomitant with radioactive probes. It has become a powerful means to probe the mechanisms for biological processes in vitro and in preclinical studies.
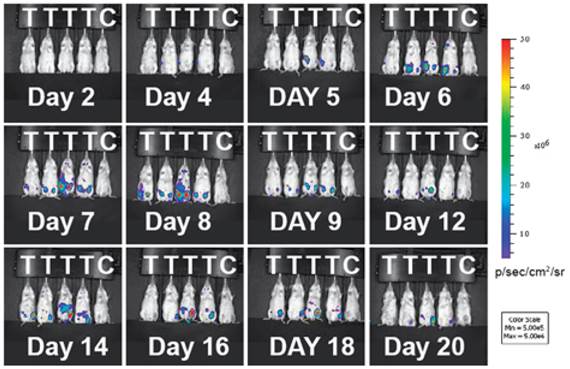
Indirect labeling by bioluminescent agents. Bioluminescence imaging (BLI) in T cells employs an indirect strategy: a luciferase enzyme is expressed in the cell; when its substrate luciferin is introduced, luciferase can catalyze the oxidation of luciferin in the presence of ATP and oxygen. The reaction emits photons and only living cells can produce signals - an excellent feature of BLI for following live cells and assessing cell viability in vivo [32]. BLI has been successfully used to monitor the spatiotemporal trafficking patterns of lymphocytes within the body [33-36]. A recent study highlights the power of BLI in demonstrating the population dynamics of adoptively transferred T cells during tumor rejection in adoptive cell transfer (ACT). The authors produced a transgenic bioluminescence mouse model from which they isolated the T cells that constantly expressed luciferase. The BLI results clearly showed these adoptively transferred T cells homed to the antigen-positive tumors. The authors further conducted longitudinal BLI on the transferred T cells and witnessed oscillating cycles of expansion and contraction in T cell population during the tumor rejection process (Fig. 3) [37]. This study underscores BLI as a useful means for longitudinal tracking of live T cells in vivo. BLI has high sensitivity due to enzymatic amplification of signal; and the background signal is low because natural bioluminescence is absent in the host tissues. Although BLI meets difficulty in human studies, it is still a powerful method in preclinical models to reveal the mechanisms for T cell-mediated immunomodulation and immunotherapy.
Adoptively transferred T-cells expand and accumulate in tumor-bearing mice. Immunodeficient mice (RAG-/-) were inoculated with tumors expressing the tumor specific antigen (T) or without (C). Luciferase-expressing T cells were infused into the mice 16 days later. During tumor rejection by the injected T cells, the expansion and contraction of the T cell population are clearly mapped by changes in the intensity of the bioluminescent signals. The T cell signals predominantly accumulate at the tumor sites. Reprinted with the permission of the European Journal of Immunology, Charo et al., 2011.
4. Tracking T cells by MRI
MRI is widely used in clinical studies. Its applications cover a wide range of medical practice, including diagnosis, functional and anatomical investigations of progression of diseases. Some features make it a preferred method to other modalities in many cases. For example, the imaging process does not involve ionizing radiation; and it yields the best soft tissue contrast among all imaging modalities. MRI provides high spatial resolution but suffers low sensitivity. Four classes of MR contrast agents have been developed: (1) Positive contrast agents containing paramagnetic gadolinium (Gd) complexes, (2) Negative contrast agents containing superparamagnetic iron oxide (SPIO) nanoparticles, (3) Chemical exchange saturation transfer (CEST) probes, and (4) 19F-containing probes [38].
Direct labeling methods
Most MRI studies for T cell tracking mainly involve direct labeling strategies using Gd complexes, SPIOs and perfluorocarbon (PFC) nano-emulsions. Gd complexes strengthen the MR signal intensity (T1-weighted), while SPIO is comprised of crystalline particles of iron oxide that can strongly perturb the neighboring magnetic field, resulting in a signal loss (T2-weighted). Gadolinium complexes are often functionalized or modified to enhance their uptake efficiency in cancer or stem cells [39, 40], but their application in T cell tracking is rarely reported. Recently developed 19F MRI with perfluorocarbon (PFC) nano-emulsions directly detects the signal given by 19F-labeled cells with no background noise - an advantage with extraordinary specificity and quantification for the in vivo cell tracking. At present, poor labeling efficiency persists to be a bottleneck of direct tracking of CTLs by MRI - because T cells are non-phagocytic and do not actively take up extracellular particles; and dilution of the labeled cells in the body may also diminish the MRI signals. A key to obtain high resolution MR images of CTLs is to “functionalize” the contrast agent to make it more accessible to the cells.
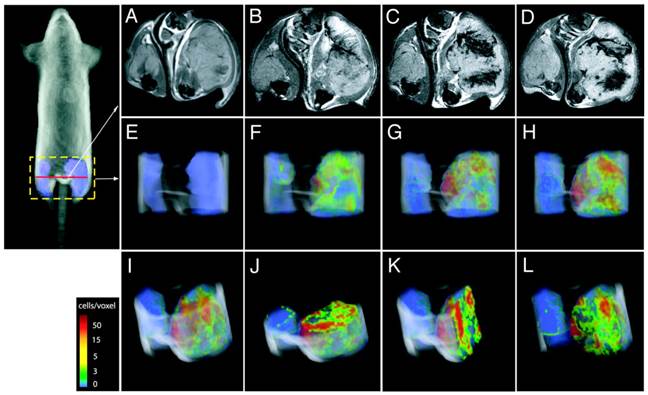
Direct labeling of T cells by SPIOs. Compared with Gd-complexes, SPIO nanoparticles strongly disturb the surrounding magnetic field, hence offering higher signal sensitivity. A group systematically examined the effects of size, charge and dosage on the labeling efficiency of SPIOs in T cells [41]. They reported that particles greater than 300 nm generally yielded poor cell labeling and the uptake of the particles was dose-dependent but plateaued quickly. On the other hand, SPIOs with aminated particle surface (positive charged) maximized internalization of the particles. The study is instructive in establishing guidelines and considerations for labeling T cells with SPIOs in vitro but with no further in vivo assessments. Another research team labeled myelin-reactive T cells with SPIOs by co-incubation with poly-L-lysine (PLL) as a transfection agent, and demonstrated the distinct distributions of the labeled T cells in naïve and primed experimental autoimmune encephalomyelitis (EAE) rat brains by MRI, suggesting the myelin-reactive T cells can migrate and infiltrate into different areas of central nervous system (CNS) during the initiation and progression of the EAE disease [42]. In their endeavors to track the CTLs, Kircher MF et al. prepared highly derivatized cross-linked iron oxide nanoparticle( CLIO-HD [43]) to label the adoptively transferred T cells[44]. In this study, the superparamagnetic iron oxide core was coated with a dextran layer and then conjugated with a cell penetrating peptide (CPP) [45]. This strategy achieved high labeling efficiency without jeopardizing the normal functions of the T cells. MRI images of three-dimensional distribution showed that the CLIO-HD-labeled T cells were recruited to melanoma tumors in a heterogeneous pattern - at near single-cell resolution in live mice (Fig. 4). Besides PLL and CPP, other SPIO functionalizing strategies have also been reported for enhanced cell loading [46-51]. A monoclonal CD3- antibody has been used to conjugate to SPIOs to target a specific surface antigen on B220+ cells in a murine model of B-cell lymphoma [52]. In another study, T cells were labeled by superparamagnetic nano-sized iron-oxide particles (IOPC-NH2) with high efficiency (>90%) and shown to present at sites where organ rejection had happened in a rat transplantation model, indicating T cells played a key role in the immune response to inflammation [53]. In general, SPIOs have been widely used to tracking different cell types in various cell therapies by MRI [54, 55]. But so far no SPIO-based MRI contrast agents have been approved for T cell tracking in human studies.
CLIO-HD-labeled tumor antigen-specific T cells are recruited to melanoma tumors in a heterogeneous pattern. On the right thigh is a melanoma tumor expressing the antigen; on the left thigh is a tumor that does not express the antigen. (A) - (D), transverse views of the thighs: (A) before adoptive transfer, (B) 12h, (C) 16h and (D) 36h after adoptive transfer of the labeled T cells. (E) - (L), three-dimensional MRI reconstructions of the distributions of the labeled T cells in the tumor: (E) 0h, (F) 12h, (G)16h, (H)&(I), 36h; (J) axial, (K) sagittal and (L) coronal views of (I). The color scale represents the number of cells/voxel in the images. Reprinted with the permission of Cancer Research, Kircher et al., 2003.
Direct labeling of T cells by 19F contrast agents. 19F MRI using PFC nano-emulsions has been reported for labeling and tracking multiple immune cells including T cells [56, 57]. At present, 19F MRI based T cell tracking is widely used for detection of inflammation in preclinical models. Different formulations of PFC nano-emulsion have been tested for ex vivo T cell labeling and in vivo cell tracking. In addition to high specific signals from the labeled cells, 19F MRI signals are directly correlated with the cell numbers. Therefore quantification of the in vivo cell numbers can be readily performed, and this is particularly informative for assessing inflammation severity if the labeled cells (such as the T cells, dentritic cells and macrophages) accumulate at inflammatory sites. In a mouse model of inflammation, 19F MRI was used to track the biodistribution and homing of PFC-labeled antigen-specific T cells [15]. Longitudinal 19F MRI study clearly demonstrated the dynamic stages of localized inflammation: the migration, homing and clearance of the labeled T cells could be quantified by the MRI signals at the inflammatory sites. Importantly, only antigen-specific, viable T cells could be detected, recapitulating the advantages of 19F MRI-based T cell tracking. In another study, the researchers combined perfluorocarbon and SPIO for labeling distinctive cell populations, thus enabling tracking two cell types simultaneously [58]. This proof-of-concept study may be extended to interrogate in vivo interactions of the cytotoxic T cells and the tumor cells in the future.
Direct labeling of T cells by paramagnetic chemical exchange saturation transfer (CEST) agent. Chemical exchange saturation transfer (CEST) has been developed to improve MRI detection sensitivity, in which a dynamic exchange process between an exchangeable proton of the agent and the surrounding water protons is used to amplify the desired contrast [59]. CEST-MRI was used to monitor drug-loaded nanocarriers in chemotherapy [60]. It is worth noting that CEST MRI has been reported to imaging tumor cells using different lanthanide(III) paramagnetic chelates (PARACEST agents) [61]. This proof-of-concept study demonstrated the possibility to measure distinct cell populations simultaneously with different PARACEST agents because each PARACEST agent enhances image contrast at specific radiofrequencies. At present, the application of CEST MRI for in vivo cell tracking is still limited partially because the CEST signal is not strong enough to detect a small number of cells.
Indirect labeling methods
Indirect MRI labeling involves genetic manipulations and enables the cell to use either endogenous or exogenous substrates. Methods of indirect MRI labeling include: (1) genes encoding cell surface receptors/ligands are expressed in the cell to bind MRI probes that have been functionalized with streptavidin or transferrin [62, 63]; (2) an HSV thymidine kinase is introduced in the cell to trap thymidine analogues that are detectable by CEST MRI [64]; (3) iron-binding proteins (e.g., ferritin) are expressed in the cell to capture endogenous irons, which can produce paramagnetic contrast signals [65, 66]; and (4) proteins rich in amide protons (e.g., lysine-rich protein, LRP) are produced in the cell and can be readily detected by CEST MRI [67]. To address the concern of intracellular stability of the LRP gene, a newer MRI reporter gene based on human protamine‑1 (hPRM1) has been developed [68]. Advantages of using hPRM1 include minimal immunogenicity and production of desirable CEST signals. As a side note, however, indirect MRI labeling methods have not yet been applied to in vivo immune cell tracking, and their sensitivity needs to be further demonstrated by detailed studies [27].
5. Tracking the T cells by PET/SPECT
Both PET and SPECT are radionuclide-based imaging techniques that have high sensitivity, a unique feature that qualifies them for disease diagnosis in clinical settings. Although ionizing radiation of the radioactive imaging probe is a concern, toxicity is usually minimal due to minute amount of the administered radiotracer. PET/SPECT has been the major and unique tool for tracking the T cells in animal models and human trials. Direct radiolabeling of T cells is relatively simple and straightforward. But longitudinal tracking of the directly labeled T cells by PET/SPECT is challenging due to the short half-lives of most PET radionuclides (e.g., 18F, t1/2=110mins; 64Cu, t1/2=12.7h). Moreover, probe leaking from the dead cells can cause false signals [69]. Researchers circumvented these limitations by genetically engineering the T cells that express a reporter gene, and supplying the subject with a radiolabeled reporter probe (i.e. the substrate of the reporter) to track the engineered T cells in a real time manner. To design a suitable T cell labeling protocol for clinical use, one can consider the general guidelines that have been suggested: high specificity and selectivity, appropriate pharmacokinetics, good in vivo stability, suitable safety profile, and economic time/cost effectiveness [70]. In the following text, we will review various strategies for tracking the T cells by nuclear imaging and their clinical implications.
Direct labeling methods
Direct ex vivo labeling of T cells. This strategy requires the isolation and ex vivo culturing of the T cells. 2-[18F]fluoro-2-deoxy-D-glucose (18F-FDG) is a widely used radiotracer for PET neuroimaging and cancer patient management in clinic. Upon uptake by high glucose-consuming cells such as the brain and cancer cells, 18F-FDG is phosphorylated by hexokinase II (HKII) and trapped in the cell to give the PET signals [71]. 18F-FDG was used in a porcine model to label and track transfusion of T-lymphoblasts [72]. The study showed the biodistribution and trafficking of the directly labeled T cells can be quantitatively evaluated, lending a protocol that can be translated into the clinic settings. In another study, 64Cu-pyruvaldehyde-bis(N4-methlthiosemicarbazone) (64Cu-PTSM) was used to label the C6 rat glioma (C6) cells and the primary lymphocytes [73]. Once in the cell, the reduction of Cu(II)-PTSM complex gives rise to a dissociated Cu(I) ion, which is trapped in the cell due to the Cu(I) ion charge [74]. The result showed 64Cu-PTSM had higher labeling efficiency than 18F-FDG, but had a similar efflux rate. Given a longer t1/2 compared with 18F-FDG, 64Cu-PTSM can be used for relatively extended cell-tracking periods. To maximize the retention of the radiolabel in T cells, our group electroporated primary T cells with 64Cu2+gold nanoparticles (GNP-64Cu/PEG2000) and followed the cells by PET in vivo [75]. The T cells were engineered to express a specific chimeric antigen receptor CD19, and had demonstrated promising treatment effects in animal models. We optimized the labeling conditions, including electric field intensity/pulse duration, concentrations of GNP-64Cu/PEG2000, and appropriate size of the nanoparticles, and achieved improved in vivo T cell tracking. The ability to mapping the biodistribution of the primary CAR+ T cells demonstrates an essential principle of evaluating their therapeutic potentials in clinical studies. Another interesting study compared the efficiency, stability and toxicity of three clinically used radiotracers using human activated T lymphocytes [76]. The results showed that the labeling efficiencies of 111In-oxine and 18F-FDG were better than 99m Tc-hexamethylpropylene amine oxime (99mTc-HMPAO), and the retention of 111In-oxine was the highest among the three tracers. However, the radiolabels caused reduced cell proliferation, and the cytotoxic function of the labeled T cells was impaired as well.
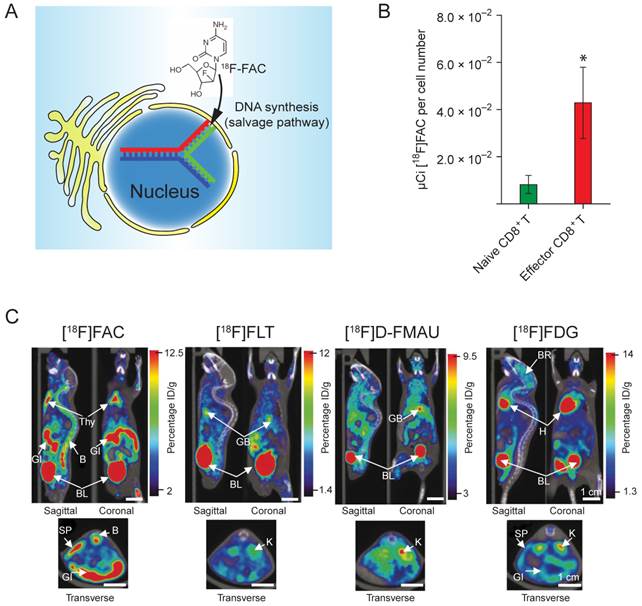
Direct in vivo labeling of T cells. This method targets at metabolic process that is specific to the T cells. The PET tracer is injected into the subject directly, and taken up by the T cells due to its unique metabolic reactivity in these cells. A significant progress was made toward developing novel probes specifically targeting the activated T cells [77]. The researchers screened and identified a nucleoside analog, 1-(2'-deoxy-2'-[18F]fluoroarabinofuranosyl) cytosine (18F-FAC), which had enhanced retention in proliferating T cells. 18F-FAC is mainly taken up by lymphoid organs and rapidly proliferating tissues in which the salvage pathway for DNA synthesis is predominant. In contrast, most other tissues use the de novo pathway for DNA synthesis [78, 79]. Therefore, the effector CD8+ T cells retained significantly high radioactivity (Fig. 5B). Furthermore, 18F-FAC showed better selectivity for lymphoid organs than other probes for nucleoside metabolism, such as 18F-FLT (3'-deoxy-3'-[18F]fluorothymidine [80]) and 18F-FMAU ([18F]-2'-fluoro-5-methyl-1-beta-D-arabinofuranosyluracil [81]) (Fig. 5C). The clinical trials have been completed for determining the biodistribution of 18F-FAC in patients with blood cancers, solid tumors and autoimmune diseases [82].
(A) 18F-FAC is predominantly incorporated into the salvage pathway for DNA synthesis in lymphoid organs and rapidly proliferating tissues. (B) The radioactivity is enriched in the CD8+ cytotoxic T cells. (C) MicroPET-CT scanning of mice with various probes. 18F-FAC is more selective for lymphoid organs (e.g. the thymus) than other PET probes for nucleoside metabolism (18F-FLT and 18F-D-FMAU) and glycolysis (18F-FDG). B: bone; BL: bladder; BR: brain; GB: gall bladder; GI: gastrointestinal tract; H: heart; K: kidney; L: liver; LU: lung; SP: spleen; Thy: thymus; BM: bone marrow; ST: stomach. The color scale shows percentage ID/g (percentage injected dose per gram of tissue). Reprinted with the permission of Nature Medicine, Radu et al., 2008.
Indirect labeling methods
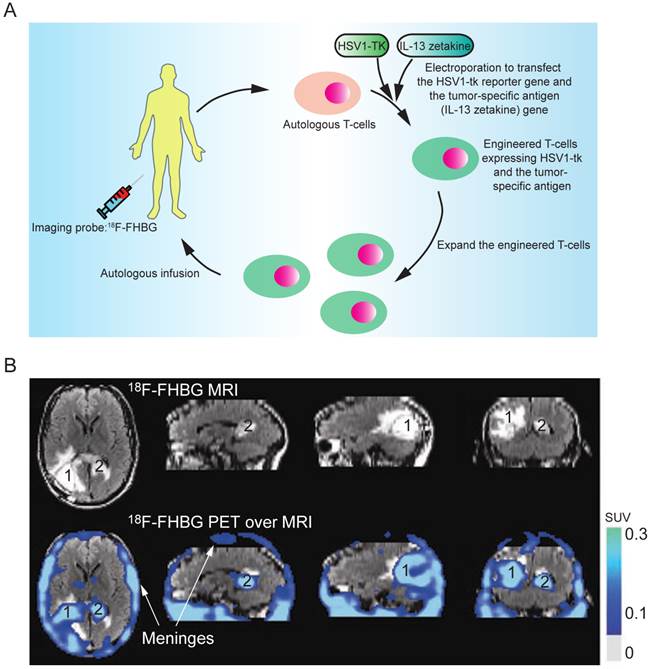
Indirect labeling of the T cells involves the following key steps. First, the T cells are genetically engineered by transfection with a reporter gene that can activate or mediate the accumulation of an imaging probe within the cell. After infusion of the engineered T cells, an imaging probe is injected to track the infused T cells in vivo. The imaging probe can be administered multiple times to determine the cell biodistribution over time. Herpes simplex virus thymidine kinase type 1 (HSV1-tk) and its mutant derivatives (e.g., HSV1-sr39tk and HSV1-A167Ytk) are the most commonly used reporter genes, which can catalyze the phosphorylation of the nucleoside analogs and trap them in the cell by adding an extra negative charge [83]. Many HSV1-tk substrates, including 18F-FIAC, 18F-FEAU, 18F-FHBG, and 124I-FIAU, have been used as the PET probes for tracking the T cells [84-91]. The choice of the substrates depends on their safety profile, pharmacokinetics and biodistribution. 18F-FHBG is safe for clinical use in PET tracer doses and the combination of 18F-FHBG and HSV1-sr39tk gives the best signal to background ratio for tracking the T cells outside the gut area [92]. Indirect labeling has been used for tracking the tumor-specific T cells in SCID mice bearing human tumor xenografts (using 124I-FIAU or 131I-FIAU) [93] and in nonhuman primates (using 18F-FEAU) [89]; detecting TCR-dependent T cell activation (using 124I-FIAU) [94]; and evaluating the tumor-killing activity of therapeutic cytotoxic T cells in a clinical trial (using 18F-FHBG, Fig. 6) [5]. In their study, the researchers engineered the autologous cytotoxic T cells and infused them back into a glioblastoma multiforme (GBM) patient. The PET imaging with 18F-FHBG showed the therapeutic T cells had migrated and accumulated in the glioma tumors. This was the first human study where the HSV1-tk-reporter system was recruited for assessing the activity of the therapeutic T cells in the clinical trial. However, its clinical application can be challenging because the procedure requires genetic manipulation on the autologous T cells ex vivo, which demands high-standard and skillful techniques in culturing the primary T cells, transfecting DNA, and purifying the successfully engineered T cells. On the other hand, genetic manipulation with reporter genes could alter the functionality, homing and survival capacity of T cells, and could also raise the concern of immunogenicity in clinical studies.
(A) The clinical protocol for assessing the therapeutic efficacy of the engineered cytotoxic T cells in treating glioblastoma multiforme (GBM). Autologous T cells were isolated from the patient and engineered to express a reporter gene (HSV1-TK) and a tumor-specific antigen (interleukin 13 zetakine). Following in vitro clonal expansion, the engineered T cells were infused back to the patient during the therapy. 18F-FHBG was administered as the imaging probe to track and evaluate the efficacy of the therapeutic T cells in vivo. (B) The infused T cells are enriched in tumor sites 1 and 2, as judged by MRI, and PET over MRI superimposed brain images. The color scale shows the SUV, standardized uptake value. Reprinted with the permission of Nature Clinical Practice Oncology, Yaghoubi et al., 2009.
6. Concluding remarks
Although T cell therapy has made impressive progress on cancer treatment from bench to bedside these years, the process to gain regulatory approval is still slow partly due to lack of knowledge of biodistribution and functionality of the injected engineered T cells. Applause to the advanced molecular imaging technologies, they enable noninvasive monitoring and tracing the in vivo behaviors of the therapeutic T cells, which will expedite the clinical trials and help to overcome the regulatory barriers. Clinically applicable strategies of noninvasive cell tracking can greatly impact the design and development of T cell-mediated cancer therapy, the assessment of patient response to antitumor treatment, and the optimization (personalization) of therapeutic plans. Given intensive needs for acquiring cell distribution, functions and therapy evaluation, molecular imaging-based T cell tracking field is experiencing a rapid expansion in developing new imaging probes, efficient and safe labeling methods and robust reporter-gene platforms. There is no doubt that emerging new imaging techniques will not only enable quantitative tracking of labeled T cells, but also provide more sophisticated information of important biological processes, such as real time cell activation status and cell-cell interactions in human study.
Competing Interests
The authors have declared that no competing interest exists.
References
1. Blattman JN, Greenberg PD. Cancer immunotherapy: a treatment for the masses. Science. 2004;305:200-5
2. June CH. Adoptive T cell therapy for cancer in the clinic. J Clin Invest. 2007;117:1466-76
3. Hughes DK. Nuclear medicine and infection detection: the relative effectiveness of imaging with 111In-oxine-, 99mTc-HMPAO-, and 99mTc-stannous fluoride colloid-labeled leukocytes and with 67Ga-citrate. J Nucl Med Technol. 2003;31:196-201 quiz 3-4
4. Nguyen QT, Tsien RY. Fluorescence-guided surgery with live molecular navigation--a new cutting edge. Nat Rev Cancer. 2013;13:653-62
5. Yaghoubi SS, Jensen MC, Satyamurthy N, Budhiraja S, Paik D, Czernin J. et al. Noninvasive detection of therapeutic cytolytic T cells with 18F-FHBG PET in a patient with glioma. Nat Clin Pract Oncol. 2009;6:53-8
6. Daldrup-Link HE, Meier R, Rudelius M, Piontek G, Piert M, Metz S. et al. In vivo tracking of genetically engineered, anti-HER2/neu directed natural killer cells to HER2/neu positive mammary tumors with magnetic resonance imaging. Eur Radiol. 2005;15:4-13
7. Anderson SA, Shukaliak-Quandt J, Jordan EK, Arbab AS, Martin R, McFarland H. et al. Magnetic resonance imaging of labeled T-cells in a mouse model of multiple sclerosis. Ann Neurol. 2004;55:654-9
8. Baumjohann D, Hess A, Budinsky L, Brune K, Schuler G, Lutz MB. In vivo magnetic resonance imaging of dendritic cell migration into the draining lymph nodes of mice. Eur J Immunol. 2006;36:2544-55
9. Long CM, van Laarhoven HW, Bulte JW, Levitsky HI. Magnetovaccination as a novel method to assess and quantify dendritic cell tumor antigen capture and delivery to lymph nodes. Cancer Res. 2009;69:3180-7
10. Alam SR, Shah AS, Richards J, Lang NN, Barnes G, Joshi N. et al. Ultrasmall superparamagnetic particles of iron oxide in patients with acute myocardial infarction: early clinical experience. Circ Cardiovasc Imaging. 2012;5:559-65
11. Gaglia JL, Guimaraes AR, Harisinghani M, Turvey SE, Jackson R, Benoist C. et al. Noninvasive imaging of pancreatic islet inflammation in type 1A diabetes patients. J Clin Invest. 2011;121:442-5
12. Harisinghani MG, Barentsz J, Hahn PF, Deserno WM, Tabatabaei S, van de Kaa CH. et al. Noninvasive detection of clinically occult lymph-node metastases in prostate cancer. N Engl J Med. 2003;348:2491-9
13. Sibov TT, Pavon LF, Miyaki LA, Mamani JB, Nucci LP, Alvarim LT. et al. Umbilical cord mesenchymal stem cells labeled with multimodal iron oxide nanoparticles with fluorescent and magnetic properties: application for in vivo cell tracking. Int J Nanomedicine. 2014;9:337-50
14. Markides H, Kehoe O, Morris RH, El Haj AJ. Whole body tracking of superparamagnetic iron oxide nanoparticle-labelled cells--a rheumatoid arthritis mouse model. Stem Cell Res Ther. 2013;4:126
15. Srinivas M, Turner MS, Janjic JM, Morel PA, Laidlaw DH, Ahrens ET. In vivo cytometry of antigen-specific t cells using 19F MRI. Magn Reson Med. 2009;62:747-53
16. Rosenberg SA, Restifo NP, Yang JC, Morgan RA, Dudley ME. Adoptive cell transfer: a clinical path to effective cancer immunotherapy. Nat Rev Cancer. 2008;8:299-308
17. Deguine J, Breart B, Lemaitre F, Di Santo JP, Bousso P. Intravital imaging reveals distinct dynamics for natural killer and CD8(+) T cells during tumor regression. Immunity. 2010;33:632-44
18. Restifo NP, Dudley ME, Rosenberg SA. Adoptive immunotherapy for cancer: harnessing the T cell response. Nat Rev Immunol. 2012;12:269-81
19. Dudley ME, Wunderlich JR, Robbins PF, Yang JC, Hwu P, Schwartzentruber DJ. et al. Cancer regression and autoimmunity in patients after clonal repopulation with antitumor lymphocytes. Science. 2002;298:850-4
20. Park TS, Rosenberg SA, Morgan RA. Treating cancer with genetically engineered T cells. Trends Biotechnol. 2011;29:550-7
21. Pule MA, Savoldo B, Myers GD, Rossig C, Russell HV, Dotti G. et al. Virus-specific T cells engineered to coexpress tumor-specific receptors: persistence and antitumor activity in individuals with neuroblastoma. Nat Med. 2008;14:1264-70
22. Till BG, Jensen MC, Wang J, Chen EY, Wood BL, Greisman HA. et al. Adoptive immunotherapy for indolent non-Hodgkin lymphoma and mantle cell lymphoma using genetically modified autologous CD20-specific T cells. Blood. 2008;112:2261-71
23. Kochenderfer JN, Wilson WH, Janik JE, Dudley ME, Stetler-Stevenson M, Feldman SA. et al. Eradication of B-lineage cells and regression of lymphoma in a patient treated with autologous T cells genetically engineered to recognize CD19. Blood. 2010;116:4099-102
24. Parkhurst MR, Yang JC, Langan RC, Dudley ME, Nathan DA, Feldman SA. et al. T cells targeting carcinoembryonic antigen can mediate regression of metastatic colorectal cancer but induce severe transient colitis. Mol Ther. 2011;19:620-6
25. Robbins PF, Morgan RA, Feldman SA, Yang JC, Sherry RM, Dudley ME. et al. Tumor regression in patients with metastatic synovial cell sarcoma and melanoma using genetically engineered lymphocytes reactive with NY-ESO-1. J Clin Oncol. 2011;29:917-24
26. Hong H, Yang Y, Zhang Y, Cai W. Non-invasive cell tracking in cancer and cancer therapy. Curr Top Med Chem. 2010;10:1237-48
27. Kircher MF, Gambhir SS, Grimm J. Noninvasive cell-tracking methods. Nat Rev Clin Oncol. 2011;8:677-88
28. Swirski FK, Berger CR, Figueiredo JL, Mempel TR, von Andrian UH, Pittet MJ. et al. A near-infrared cell tracker reagent for multiscopic in vivo imaging and quantification of leukocyte immune responses. PLoS One. 2007;2:e1075
29. Bentolila LA, Ebenstein Y, Weiss S. Quantum dots for in vivo small-animal imaging. J Nucl Med. 2009;50:493-6
30. Andersen RS, Kvistborg P, Frosig TM, Pedersen NW, Lyngaa R, Bakker AH. et al. Parallel detection of antigen-specific T cell responses by combinatorial encoding of MHC multimers. Nat Protoc. 2012;7:891-902
31. Akinfieva O, Nabiev I, Sukhanova A. New directions in quantum dot-based cytometry detection of cancer serum markers and tumor cells. Crit Rev Oncol Hematol. 2013;86:1-14
32. Contag PR, Olomu IN, Stevenson DK, Contag CH. Bioluminescent indicators in living mammals. Nat Med. 1998;4:245-7
33. Mandl S, Schimmelpfennig C, Edinger M, Negrin RS, Contag CH. Understanding immune cell trafficking patterns via in vivo bioluminescence imaging. J Cell Biochem Suppl. 2002;39:239-48
34. Lee MH, Lee WH, Van Y, Contag CH, Liu CP. Image-guided analyses reveal that non-CD4 splenocytes contribute to CD4+ T cell-mediated inflammation leading to islet destruction by altering their local function and not systemic trafficking patterns. Mol Imaging. 2007;6:369-83
35. Prins RM, Shu CJ, Radu CG, Vo DD, Khan-Farooqi H, Soto H. et al. Anti-tumor activity and trafficking of self, tumor-specific T cells against tumors located in the brain. Cancer Immunol Immunother. 2008;57:1279-89
36. Chewning JH, Dugger KJ, Chaudhuri TR, Zinn KR, Weaver CT. Bioluminescence-based visualization of CD4 T cell dynamics using a T lineage-specific luciferase transgenic model. BMC Immunol. 2009;10:44
37. Charo J, Perez C, Buschow C, Jukica A, Czeh M, Blankenstein T. Visualizing the dynamic of adoptively transferred T cells during the rejection of large established tumors. Eur J Immunol. 2011;41:3187-97
38. Ahrens ET, Bulte JW. Tracking immune cells in vivo using magnetic resonance imaging. Nat Rev Immunol. 2013;13:755-63
39. Heckl S, Debus J, Jenne J, Pipkorn R, Waldeck W, Spring H. et al. CNN-Gd(3+) enables cell nucleus molecular imaging of prostate cancer cells: the last 600 nm. Cancer Res. 2002;62:7018-24
40. Kim T, Momin E, Choi J, Yuan K, Zaidi H, Kim J. et al. Mesoporous silica-coated hollow manganese oxide nanoparticles as positive T1 contrast agents for labeling and MRI tracking of adipose-derived mesenchymal stem cells. J Am Chem Soc. 2011;133:2955-61
41. Thorek DL, Tsourkas A. Size, charge and concentration dependent uptake of iron oxide particles by non-phagocytic cells. Biomaterials. 2008;29:3583-90
42. Baeten K, Adriaensens P, Hendriks J, Theunissen E, Gelan J, Hellings N. et al. Tracking of myelin-reactive T cells in experimental autoimmune encephalomyelitis (EAE) animals using small particles of iron oxide and MRI. NMR Biomed. 2010;23:601-9
43. Josephson L, Tung CH, Moore A, Weissleder R. High-efficiency intracellular magnetic labeling with novel superparamagnetic-Tat peptide conjugates. Bioconjug Chem. 1999;10:186-91
44. Kircher MF, Allport JR, Graves EE, Love V, Josephson L, Lichtman AH. et al. In vivo high resolution three-dimensional imaging of antigen-specific cytotoxic T-lymphocyte trafficking to tumors. Cancer Res. 2003;63:6838-46
45. Lewin M, Carlesso N, Tung CH, Tang XW, Cory D, Scadden DT. et al. Tat peptide-derivatized magnetic nanoparticles allow in vivo tracking and recovery of progenitor cells. Nat Biotechnol. 2000;18:410-4
46. Yang B, Cai H, Qin W, Zhang B, Zhai C, Jiang B. et al. Bcl-2-functionalized ultrasmall superparamagnetic iron oxide nanoparticles coated with amphiphilic polymer enhance the labeling efficiency of islets for detection by magnetic resonance imaging. Int J Nanomedicine. 2013;8:3977-90
47. Guthi JS, Yang SG, Huang G, Li S, Khemtong C, Kessinger CW. et al. MRI-visible micellar nanomedicine for targeted drug delivery to lung cancer cells. Mol Pharm. 2010;7:32-40
48. Maurizi L, Bisht H, Bouyer F, Millot N. Easy route to functionalize iron oxide nanoparticles via long-term stable thiol groups. Langmuir. 2009;25:8857-9
49. Huang G, Zhang C, Li S, Khemtong C, Yang SG, Tian R. et al. A Novel Strategy for Surface Modification of Superparamagnetic Iron Oxide Nanoparticles for Lung Cancer Imaging. J Mater Chem. 2009;19:6367-72
50. Herranz F, Morales MP, Roca AG, Vilar R, Ruiz-Cabello J. A new method for the aqueous functionalization of superparamagnetic Fe2O3 nanoparticles. Contrast Media Mol Imaging. 2008;3:215-22
51. Martin AL, Bernas LM, Rutt BK, Foster PJ, Gillies ER. Enhanced cell uptake of superparamagnetic iron oxide nanoparticles functionalized with dendritic guanidines. Bioconjug Chem. 2008;19:2375-84
52. Luchetti A, Milani D, Ruffini F, Galli R, Falini A, Quattrini A. et al. Monoclonal antibodies conjugated with superparamagnetic iron oxide particles allow magnetic resonance imaging detection of lymphocytes in the mouse brain. Mol Imaging. 2012;11:114-25
53. Liu L, Ye Q, Wu Y, Hsieh WY, Chen CL, Shen HH. et al. Tracking T-cells in vivo with a new nano-sized MRI contrast agent. Nanomedicine. 2012;8:1345-54
54. de Vries IJ, Lesterhuis WJ, Barentsz JO, Verdijk P, van Krieken JH, Boerman OC. et al. Magnetic resonance tracking of dendritic cells in melanoma patients for monitoring of cellular therapy. Nat Biotechnol. 2005;23:1407-13
55. Zhu J, Zhou L, XingWu F. Tracking neural stem cells in patients with brain trauma. N Engl J Med. 2006;355:2376-8
56. Janjic JM, Srinivas M, Kadayakkara DK, Ahrens ET. Self-delivering nanoemulsions for dual fluorine-19 MRI and fluorescence detection. J Am Chem Soc. 2008;130:2832-41
57. Srinivas M, Boehm-Sturm P, Aswendt M, Pracht ED, Figdor CG, de Vries IJ. et al. In vivo 19F MRI for cell tracking. J Vis Exp. 2013:e50802
58. Hitchens TK, Liu L, Foley LM, Simplaceanu V, Ahrens ET, Ho C. Combining perfluorocarbon and superparamagnetic iron-oxide cell labeling for improved and expanded applications of cellular MRI. Magn Reson Med. 2014
59. Ward KM, Aletras AH, Balaban RS. A new class of contrast agents for MRI based on proton chemical exchange dependent saturation transfer (CEST). J Magn Reson. 2000;143:79-87
60. Chan KW, Yu T, Qiao Y, Liu Q, Yang M, Patel H. et al. A diaCEST MRI approach for monitoring liposomal accumulation in tumors. J Control Release. 2014;180C:51-9
61. Aime S, Carrera C, Delli Castelli D, Geninatti Crich S, Terreno E. Tunable imaging of cells labeled with MRI-PARACEST agents. Angew Chem Int Ed Engl. 2005;44:1813-5
62. Tannous BA, Grimm J, Perry KF, Chen JW, Weissleder R, Breakefield XO. Metabolic biotinylation of cell surface receptors for in vivo imaging. Nat Methods. 2006;3:391-6
63. Weissleder R, Moore A, Mahmood U, Bhorade R, Benveniste H, Chiocca EA. et al. In vivo magnetic resonance imaging of transgene expression. Nat Med. 2000;6:351-5
64. Bar-Shir A, Liu G, Liang Y, Yadav NN, McMahon MT, Walczak P. et al. Transforming thymidine into a magnetic resonance imaging probe for monitoring gene expression. J Am Chem Soc. 2013;135:1617-24
65. Genove G, DeMarco U, Xu H, Goins WF, Ahrens ET. A new transgene reporter for in vivo magnetic resonance imaging. Nat Med. 2005;11:450-4
66. Iordanova B, Ahrens ET. In vivo magnetic resonance imaging of ferritin-based reporter visualizes native neuroblast migration. Neuroimage. 2012;59:1004-12
67. Gilad AA, McMahon MT, Walczak P, Winnard PT Jr, Raman V, van Laarhoven HW. et al. Artificial reporter gene providing MRI contrast based on proton exchange. Nat Biotechnol. 2007;25:217-9
68. Bar-Shir A, Liu G, Chan KW, Oskolkov N, Song X, Yadav NN. et al. Human protamine-1 as an MRI reporter gene based on chemical exchange. ACS Chem Biol. 2014;9:134-8
69. Tumeh PC, Radu CG, Ribas A. PET imaging of cancer immunotherapy. J Nucl Med. 2008;49:865-8
70. James ML, Gambhir SS. A molecular imaging primer: modalities, imaging agents, and applications. Physiol Rev. 2012;92:897-965
71. Gallagher BM, Ansari A, Atkins H, Casella V, Christman DR, Fowler JS. et al. Radiopharmaceuticals XXVII. 18F-labeled 2-deoxy-2-fluoro-d-glucose as a radiopharmaceutical for measuring regional myocardial glucose metabolism in vivo: tissue distribution and imaging studies in animals. J Nucl Med. 1977;18:990-6
72. Eriksson O, Sadeghi A, Carlsson B, Eich T, Lundgren T, Nilsson B. et al. Distribution of adoptively transferred porcine T-lymphoblasts tracked by (18)F-2-fluoro-2-deoxy-D-glucose and position emission tomography. Nucl Med Biol. 2011;38:827-33
73. Adonai N, Nguyen KN, Walsh J, Iyer M, Toyokuni T, Phelps ME. et al. Ex vivo cell labeling with 64Cu-pyruvaldehyde-bis(N4-methylthiosemicarbazone) for imaging cell trafficking in mice with positron-emission tomography. Proc Natl Acad Sci U S A. 2002;99:3030-5
74. Blower PJ, Lewis JS, Zweit J. Copper radionuclides and radiopharmaceuticals in nuclear medicine. Nucl Med Biol. 1996;23:957-80
75. Bhatnagar P, Li Z, Choi Y, Guo J, Li F, Lee DY. et al. Imaging of genetically engineered T cells by PET using gold nanoparticles complexed to Copper-64. Integr Biol (Camb). 2013;5:231-8
76. Botti C, Negri DR, Seregni E, Ramakrishna V, Arienti F, Maffioli L. et al. Comparison of three different methods for radiolabelling human activated T lymphocytes. Eur J Nucl Med. 1997;24:497-504
77. Radu CG, Shu CJ, Nair-Gill E, Shelly SM, Barrio JR, Satyamurthy N. et al. Molecular imaging of lymphoid organs and immune activation by positron emission tomography with a new [18F]-labeled 2'-deoxycytidine analog. Nat Med. 2008;14:783-8
78. Van Rompay AR, Johansson M, Karlsson A. Substrate specificity and phosphorylation of antiviral and anticancer nucleoside analogues by human deoxyribonucleoside kinases and ribonucleoside kinases. Pharmacol Ther. 2003;100:119-39
79. Griffith DA, Jarvis SM. Nucleoside and nucleobase transport systems of mammalian cells. Biochim Biophys Acta. 1996;1286:153-81
80. Shields AF, Grierson JR, Dohmen BM, Machulla HJ, Stayanoff JC, Lawhorn-Crews JM. et al. Imaging proliferation in vivo with [F-18]FLT and positron emission tomography. Nat Med. 1998;4:1334-6
81. Sun H, Mangner TJ, Collins JM, Muzik O, Douglas K, Shields AF. Imaging DNA synthesis in vivo with 18F-FMAU and PET. J Nucl Med. 2005;46:292-6
82. www.clinicaltrials.gov/show/NCT01180868
83. Gambhir SS, Bauer E, Black ME, Liang Q, Kokoris MS, Barrio JR. et al. A mutant herpes simplex virus type 1 thymidine kinase reporter gene shows improved sensitivity for imaging reporter gene expression with positron emission tomography. Proc Natl Acad Sci U S A. 2000;97:2785-90
84. Yaghoubi SS, Couto MA, Chen CC, Polavaram L, Cui G, Sen L. et al. Preclinical safety evaluation of 18F-FHBG: a PET reporter probe for imaging herpes simplex virus type 1 thymidine kinase (HSV1-tk) or mutant HSV1-sr39tk's expression. J Nucl Med. 2006;47:706-15
85. Yaghoubi SS, Gambhir SS. Measuring herpes simplex virus thymidine kinase reporter gene expression in vitro. Nat Protoc. 2006;1:2137-42
86. Green LA, Nguyen K, Berenji B, Iyer M, Bauer E, Barrio JR. et al. A tracer kinetic model for 18F-FHBG for quantitating herpes simplex virus type 1 thymidine kinase reporter gene expression in living animals using PET. J Nucl Med. 2004;45:1560-70
87. Chan PC, Wu CY, Chang WY, Chang WT, Alauddin M, Liu RS. et al. Evaluation of F-18-labeled 5-iodocytidine (18F-FIAC) as a new potential positron emission tomography probe for herpes simplex virus type 1 thymidine kinase imaging. Nucl Med Biol. 2011;38:987-95
88. Miyagawa T, Gogiberidze G, Serganova I, Cai S, Balatoni JA, Thaler HT. et al. Imaging of HSV-tk Reporter gene expression: comparison between [18F]FEAU, [18F]FFEAU, and other imaging probes. J Nucl Med. 2008;49:637-48
89. Dotti G, Tian M, Savoldo B, Najjar A, Cooper LJ, Jackson J. et al. Repetitive noninvasive monitoring of HSV1-tk-expressing T cells intravenously infused into nonhuman primates using positron emission tomography and computed tomography with 18F-FEAU. Mol Imaging. 2009;8:230-7
90. Yaghoubi SS, Barrio JR, Namavari M, Satyamurthy N, Phelps ME, Herschman HR. et al. Imaging progress of herpes simplex virus type 1 thymidine kinase suicide gene therapy in living subjects with positron emission tomography. Cancer Gene Ther. 2005;12:329-39
91. Simoes MV, Miyagawa M, Reder S, Stadele C, Haubner R, Linke W. et al. Myocardial kinetics of reporter probe 124I-FIAU in isolated perfused rat hearts after in vivo adenoviral transfer of herpes simplex virus type 1 thymidine kinase reporter gene. J Nucl Med. 2005;46:98-105
92. Yaghoubi SS. PET and SPECT Reporter Gene Imaging. Molecular Imaging Probes for Cancer Research. p. 373-415.
93. Koehne G, Doubrovin M, Doubrovina E, Zanzonico P, Gallardo HF, Ivanova A. et al. Serial in vivo imaging of the targeted migration of human HSV-TK-transduced antigen-specific lymphocytes. Nat Biotechnol. 2003;21:405-13
94. Ponomarev V, Doubrovin M, Lyddane C, Beresten T, Balatoni J, Bornman W. et al. Imaging TCR-dependent NFAT-mediated T-cell activation with positron emission tomography in vivo. Neoplasia. 2001;3:480-8
Author contact
![]() Corresponding author: Zheng Li: zliorg.
Corresponding author: Zheng Li: zliorg.