Impact Factor
- Issue 14; 2026
- Issue 13; 2026
- Issue 12; 2026
- Issue 11; 2026
- Issue 10; 2026
- Volume 16; 2026
- Advance Articles
- Past Issues
- Cover Images
- Cover Suggestion
- Index & Coverage
- Special Issues
Introduction
Materials and Methods
Results
Discussion
Conclusion
Abbreviations
Acknowledgements
References
International Journal of Biological Sciences
International Journal of Medical Sciences
 Global reach, higher impact

Theranostics 2014; 4(10):972-989. doi:10.7150/thno.9436 This issue Cite
Research Paper
Longitudinal Monitoring of Stem Cell Grafts In Vivo Using Magnetic Resonance Imaging with Inducible Maga as a Genetic Reporter
In K. Cho1,2,3, Sean P. Moran3, Ramesh Paudyal4, Karolina Piotrowska-Nitsche3, Pei-Hsun Cheng3, Xiaodong Zhang4, Hui Mao5 ![]() , Anthony W.S. Chan1,2,3
, Anthony W.S. Chan1,2,3 ![]()
1. Genetics and Molecular Biology Program, Emory University, Atlanta, GA, USA;
2. Department of Human Genetics, Emory University School of Medicine, Atlanta, GA, USA;
3. Division of Neuropharmacology and Neurologic Diseases, Yerkes National Primate Research Center, Atlanta, GA, USA;
4. Yerkes Imaging Center, Yerkes National Primate Research Center, Atlanta, GA, USA;
5. Department of Radiology and Imaging Sciences, Emory University School of Medicine, Atlanta, GA, USA.
Received 2014-4-18; Accepted 2014-6-29; Published 2014-7-27
Abstract

Purpose: The ability to longitudinally monitor cell grafts and assess their condition is critical for the clinical translation of stem cell therapy in regenerative medicine. Developing an inducible genetic magnetic resonance imaging (MRI) reporter will enable non-invasive and longitudinal monitoring of stem cell grafts in vivo. Methods: MagA, a bacterial gene involved in the formation of iron oxide nanocrystals, was genetically modified for in vivo monitoring of cell grafts by MRI. Inducible expression of MagA was regulated by a Tet-On (Tet) switch. A mouse embryonic stem cell-line carrying Tet-MagA (mESC-MagA) was established by lentivirus transduction. The impact of expressing MagA in mESCs was evaluated via proliferation assay, cytotoxicity assay, teratoma formation, MRI, and inductively coupled plasma atomic emission spectroscopy (ICP-OES). Mice were grafted with mESCs with and without MagA (mESC-MagA and mESC-WT). The condition of cell grafts with induced “ON” and non-induced “OFF” expression of MagA was longitudinally monitored in vivo using a 7T MRI scanner. After imaging, whole brain samples were harvested for histological assessment. Results: Expression of MagA in mESCs resulted in significant changes in the transverse relaxation rate (R2 or 1/T2) and susceptibility weighted MRI contrast. The pluripotency of mESCs carrying MagA was not affected in vitro or in vivo. Intracranial mESC-MagA grafts generated sufficient T2 and susceptibility weighted contrast at 7T. The mESC-MagA grafts can be monitored by MRI longitudinally upon induced expression of MagA by administering doxycycline (Dox) via diet. Conclusion: Our results demonstrate MagA could be used to monitor cell grafts noninvasively, longitudinally, and repetitively, enabling the assessment of cell graft conditions in vivo.
Keywords: Magnetic resonance imaging, reporter gene, MagA, longitudinal monitoring, stem cell, cell tracking, regenerative medicine, inducible expression, intracranial graft.
Introduction
Stem cell therapy holds great promise for curing diseases, such as cardiovascular, bone degenerative, autoimmune, and neurodegenerative diseases [1-6]. With rapid advances in stem cell research and the ability to reprogram cell fate, the clinical translation of cell replacement therapy is within reach. Apart from issues of immunity and the functionality of cell grafts, one of the major obstacles to clinical translation is our limited capability to investigate and understand cell fates and their functions in vivo over time [7]. It is difficult or impossible to correlate the status of cell grafts and clinical outcomes in vivo, which hinders the development of cell therapeutic approaches. There is therefore an urgent need to develop noninvasive imaging tools that allow non-invasive longitudinal assessment of cell grafts for their viability, proliferation, lineage differentiation, and functional integration, so that an optimal strategy can be developed for clinical applications.
Several imaging techniques have been investigated for monitoring grafted cells in vivo. Optical imaging techniques, such as bioluminescence imaging (BLI) using luciferase (Luc) [8] and fluorescent imaging with fluorescent proteins [9], have been used to track cell grafts in small animals. However, due to inherent limitations in signal penetration depth and poor anatomical information, optical imaging is not feasible in large animals, such as porcine and nonhuman primates (NHPs). Hematopoietic stem cell grafts with genetically manipulated cell markers, such as human deoxycytidine kinase mutant (hdCK3mut), have been developed and tracked by positron emission tomography (PET) for up to 32 weeks using the exogenous [18F]-L-FMAU PET probe in rodents [10]; however, frequent injections of radioactive tracers were needed to gain timely information on the cell grafts. Compared to PET and optical imaging, MRI has unique advantages for cell tracking because of its high spatial resolution and soft tissue contrast [11]. Although MRI tracking of cell grafts pre-labeled with contrast agents made of lanthanide metal chelates or superparamagnetic iron oxide nanoparticles (SPIOs) have been reported [12-21], long-term tracking is not possible with the pre-labeling approach due to the continuous reduction of the contrast agent in the cells as they divide [7, 22, 23].
To achieve long-term monitoring of cell grafts in vivo, a genetic MRI reporter that generates imaging contrast in the progeny of implanted cells would be an ideal tool. To date, several genetic MRI reporting systems have been investigated, including creatine kinase [24], divalent metal transporter (DMT1) [25], ferritin [26-34], β-galactosidase [35], MagA [23, 32, 36], and tyrosinase [37]. Most of these genetic reporters were developed for monitoring metastatic cancer cells [23, 26, 27, 31, 32, 36], and only ferritin has been reported for monitoring stem cell grafts in mice [33]. Until now, there were no reports on the longitudinal monitoring of stem cell grafts using a genetic MRI reporter, particularly in an inducible manner, which is important to minimize the potential toxicity from the constitutive expression of the imaging reporter.
MagA is a bacterial gene involved in transporting iron and forming magnetite (Fe3O4) crystals [38, 39], an excellent MRI contrast agent similar to SPIOs. We have previously demonstrated the expression of MagA in mammalian cells and the formation of magnetosomes that resulted in increased transverse relaxivity in 293FT cells [23]. Here we report using MagA for in vivo longitudinal MRI monitoring of stem cell grafts by the inducible expression of MagA as needed.
Materials and Methods
Cells and vectors
A wild-type mouse embryonic stem cell line AB 2.2(mESC-WT), which was derived from the 129/SvEV strain, was maintained as a stable culture on Mitomycin-C inactivated mouse embryonic fibroblast (MEF) with Dulbecco's Modified Eagle's Medium (DMEM; Invitrogen) supplemented with 15% fetal bovine serum (FBS; Atlanta Biologicals), 2 mM L-glutamine (L-Glu; Invitrogen), 0.1 mM β-mercaptoethanol (β-Mer; Sigma), 100 U/ml penicillin, 100 µg/ml streptomycin (P/S; Lonza), 0.1 mM of MEM Eagle Non-essential Amino Acid (NEAA; Lonza), and 1000 IU/ml of human recombinant leukemia inhibiting factor (hLIF; Chemicon). Medium was changed daily and cells were passaged every 2 days at 1:10 to 1:15 ratio by treating with 0.05% trypsin-EDTA (Life Technologies), followed by dissociation into single cells.
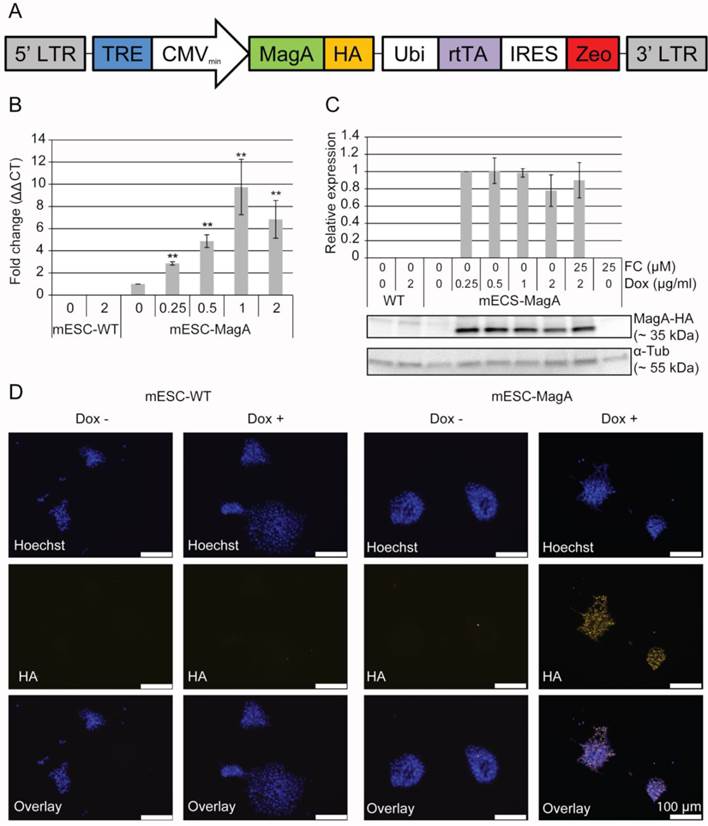
To generate mESCs expressing a fusion gene of magA with human influenza hemagglutinin (HA) tag under the control of a tetracycline response element (TRE) (Tet-MagA), mESC-WT cells were infected with lentiviruses expressing Tet-MagA (LV-Tet-MagA; Figure 1A). LV-Tet-MagA was generated by co-transfecting pLV-Tet-MagA with packaging vector pΔ8.9 and envelope vector pVSV-G into 293FT packaging cells (Invitrogen). The culture medium was collected at 48 h post-transfection and was used to infect mESC-WT supplemented with polybrene (8 µg/ml) overnight. Fresh medium was replaced on the following day. At 48 h post-transduction, 100 µg/ml of zeocin was supplemented in mESC medium for selection, and a single colony was picked manually and expanded to create a clonal cell line (mESC-MagA).
Generation of a transgenic mESC cell line expressing inducible magA. (A) Schematic illustration of LV-Tet-MagA: HA-tagged magA under the control of TRE was expressed in a modified FUGW vector. Zeocin was expressed through the IRES downstream of the ubiquitin promoter. (B) Quantitative real-time PCR (qPCR) analysis of magA expression in mESC-MagA demonstrates a positive correlation between the expression of magA and dosage of Dox. Maximum magA expression was observed when supplemented with 1 µg/ml of Dox (9.74 ± 2.49, **P < 0.001, n = 3). (C) Western blot analysis of MagA assessed via HA tag in mESC-MagA demonstrates no differences when supplemented with different dosages of Dox (0.25, 0.5, 1, and 2 µg/ml) as shown in densitometry analysis. (D) Expression of MagA was confirmed by immunofluorescence using HA-specific antibody (yellow). The nucleus was visualized by Hoechst 33342 (blue). All histogram data are means ± SEM. *P< 0.05, **P< 0.001 versus appropriate control by ANOVA.
Quantitative real-time PCR (qPCR)
Total RNA was extracted from cells or tissues using TRIzol® (Life Technologies). In brief, cells or tissues were suspended in 500 µl of TRIzol® and homogenized with a 21G sterile syringe. To ensure there was no genomic DNA contamination, samples were treated with TURBO™ DNase (Life Technologies). The cDNA was synthesized with 500 ng of RNA sample using a High-Capacity cDNA Reverse Transcription Kit (Applied Biosystems). Quantitative real-time PCR (qPCR) was performed using TaqMan® Gene Expression Master Mix (Applied Biosystems). For magA, a custom-made TaqMan® probe was used (F-5'-ATCCGTTTTCTCGAAGTGTGGAA-3', R-5'-GCCCGCGATCTGCAAAA-3', and P-5'-ACGGCGGTCTTCACC-3'). For normalization, eukaryotic 18S rRNA (Applied Biosystems) was used as an endogenous control. qPCR was performed using the Bio-Rad CFX96 real-time PCR detection system. Gene expression was calculated by comparative CT (2-ΔΔCT) normalized to 18S rRNA transcript levels.
Western blot
Cells were lysed in RIPA buffer. Total protein concentration was determined by DC™ Protein Assay kit (Bio-Rad). A total of 30 µg of protein was separated using 4-15% gradient SDS-PAGE (4-15% Ready Gel® Tris-HCL Gel; Bio-Rad) and transferred onto a PVDF membrane using the Trans-Blot Turbo Transfer System (Bio-Rad). The membrane was probed with primary antibodies that specifically recognized HA (mouse anti-HA.11 clone 16B12 monoclonal 1:1,000; Covance) and α-tubulin (mouse anti-α-tubulin clone DM1A monoclonal; Sigma). The membrane was then incubated with secondary antibody (HRP-conjugated goat anti-mouse 1:10,000; Abcam) after thorough washing and visualized with a Western Lighting™ Ultra Chemiluminescence Substrate kit (PerkinElmer) using the ChemiDoc™ XRS+ system (Bio-Rad). The quantification of MagA-HA was performed using ImageLab™ software (Bio-Rad) and was normalized to α-tubulin.
Immunocytochemistry
Cells were fixed with 4% paraformaldehyde (PFA) for 15 min. The fixative solution was removed and the cells were washed with PBS 3 times for 5 min each. Cells were then incubated with a blocking buffer consisting of 0.20% Triton X-100, 3 mM sodium azide, 0.1% saponin, 2% BSA, and 5% donkey serum in PBS for 30 min to 1 h at room temperature. Cells were then incubated with primary antibody (mouse anti-HA.11 clone 16B12 monoclonal 1:1,000; Covance, mouse anti-Sox2 1:250; Millipore, rabbit Oct3/4 1:500, Santa Cruz Biotechnology, mouse anti-Nanog 1:400, Santa Cruz Biotechnology) overnight at 4ºC. After 3 washes with PBS, cells were incubated with secondary antibody (anti-mouse Cy-5 conjugated 1:1,000; Jackson ImmunoResearch) for 30-45 min at room temperature. Hoechst staining was performed (0.12 µg/ml) to visualize the nucleus.
Cell proliferation rate/cytotoxicity assay
The cell proliferation rate was evaluated by total cell count before and after Dox treatment. Cytotoxicity was assessed using the Muse™ Annexin V & Dead Cell Assay (EMD Millipore). A total of 1X10⁴ cells were treated with 1 µg/ml Dox or 25 µM FC or both in 24-well cell culture plates for 3 days. Cells were harvested at the end of the treatment. Cytotoxicity was measured via externalization of phosphatidylserine (PS), which is readily conjugated with annexin V. We evaluated the late apoptotic stage with 7-aminoactinomcin D (7-AAD), which is a fluorescent intercalator that shows spectral shift upon association with DNA. Relative changes compared to the untreated group were calculated for both cell lines, and all data are presented as standard error of the mean (SEM).
Teratoma formation
All protocols involving animals were approved by Emory University's Institutional Animal Care and Use Committee. A total of 1x10⁶ cells were injected subcutaneously at the front shoulders of nude mice (Crl:NU(NCr)-Foxn1nu CD-1 nude mice; Charles River). Teratoma development was monitored daily following Emory University's Tumor Burden Scoring Guideline. To evaluate the iron content after Dox induction, mice were fed 5 mg/ml of Dox and 0.5 mg/ml of FC for 3 days before euthanasia. Teratomas were removed and fixed in 4% paraformaldehyde overnight. H&E staining and Prussian blue staining were done at Yerkes Histopathology Laboratory using the standard protocol.
MRI of cell pellets
Four treatments were prepared for each cell line: 1. no Dox and no FC (None); 2. Dox and no FC (Dox); 3. no Dox and FC (FC); and 4. Dox and FC (Dox/FC). The appropriate cell samples were treated with 1 µg/ml of doxycycline and 25 µM of FC for 3 days. At the end of treatment, cells were washed twice with PBS with calcium and magnesium and once with PBS without calcium and magnesium to remove any residual FC. Cells were collected and fixed with 4% PFA for 30 min. A total of 7-9 x 10⁷ cells were resuspended in 90 µl DMEM and carefully placed in 0.5-ml straws (TS Scientific) with one end sealed with Leica Critoseal®. After the samples were placed into the straws, with all the air bubbles removed, the other end was sealed with parafilm. The straws were carefully arranged and embedded in 1% agarose in a custom-made tube. The cell pellets were then imaged using a Bruker Biospec 7T MR scanner (Bruker Biospin, Billerica, MA). The multi-slice and multi-TE (MSME) spin-echo sequences were used. T2 relaxation times were measured with the acquisition parameters: echo time (TE) = 10 to 100 ms in increments of 10.25 ms, Time of repetition (TR) = 5,000 ms, field of view (FOV) = 71x 71 mm, image matrix = 256 x 256, and slice thickness = 0.5 mm, 4 averages.
R2 (=1/T2) values were derived from T2 measurements by curve fitting of nonlinear monoexponential algorithm, M(TE) = M0 exp(-TE/T2), where TE is the echo time, M0 is signal intensity at TE = 0, and M(TE) is signal intensity at corresponding TE. Image processing and analysis were performed using ImageJ 1.46r (NIH). R2 maps were generated using MRI analysis calculator plugin of the program ImageJ. Statistical analysis was done using KaleidaGraph (Synergy Software), SPSS 20 (IBM), and Excel (Microsoft).
Inductively coupled plasma atomic emission spectroscopy (ICP-OES)
ICP-OES was used for quantifying iron in the sample. Cell pellets were collected after the MRI scan and briefly washed in PBS. Briefly, samples were processed into dry powder and atomized in the nebulizer. The atomized samples were fed directly into plasma flame and light emission was recorded at different wavelengths specific for the element of interest. All the iron contents were normalized to cell pellet weight and apoptotic cell population. Also, iron contents were normalized to the copper content to compensate for inter-sample variations. The chemical analysis lab at University of Georgia performed all the ICP-OES experiments for the current study.
Preparation and implantation of cell grafts in mice
Severe combined immune-deficient (SCID) mice (CB17/lcr-, Charles River Laboratories) 6 to 8 weeks of age were used as cell graft recipients. Two sets of experiments were carried out to determine whether MRI contrast could be generated in vivo and then be longitudinally monitored repeatedly.
The first experiment was carried out with a single status of “OFF” (non-induced) and “ON” (Dox induced). For both “OFF” and “ON,” the initial grafting condition was the same. SCID mice were injected with 1x10⁴ cells suspended in 3 µl of PBS with 100 U/ml penicillin and 100 µg/ml streptomycin (P/S; Lonza). Cell suspensions were injected by stereotactic injection into the striatum of the right and left hemisphere (+0.74 mm anterior, ±1.7 mm medial/lateral relative to bregma, and -3.8 mm ventral from the dorsal surface of the skull). mESC-MagA cells were always injected into the right hemisphere striatum, while mESC-WT cells were always injected into the left hemisphere striatum. Mice in the “OFF” group were fed a normal diet for 14 days, and at the end of 14 days, MRI scans were conducted. For the “ON” group, mice were fed a normal diet for 7 days, and then fed Dox- and FC-supplemented water (5 mg/ml and 0.5 mg/ml respectively) and Dox chow (200 mg/kg, Bio-Serv) for 7 days.
The second set of experiments was conducted to evaluate the longitudinal monitoring of grafted cells with repetitive induction of MagA in vivo. Both mESC-MagA and mESC-WT were treated with Dox and FC (1 µg/ml and 25 µM respectively) for 3 d in culture. A total of 1x10⁵ cells were suspended in 3 µl of PBS with 100 U/ml penicillin and 100 µg/ml streptomycin (P/S; Lonza). mESC-MagA and mESC-WT cell suspensions were injected by stereotactic injection into the striatum of the right and left hemisphere, respectively. At 24 h post-transplantation, the first MRI was conducted, “ON”. After the first scan, the mice were fed a normal diet for 7 days, “OFF,” and a second MRI scan was conducted to determine whether the MR contrast returned to baseline. To induce expression of MagA in vivo, mice were then fed Dox- and FC-supplemented water (5 mg/ml and 0.5 mg/ml respectively) and Dox chow (200 mg/kg, Bio-Serv) for 7 days, “ON”. The second MRI scan was then performed afterward, followed by euthanasia as described in the following section.
In vivo MRI of cell grafts in mice
For live imaging, each animal was anesthetized by ketamine (90-120 mg/kg) and maintained by isoflurane (1.0 - 1.5%) using a mask during scan. Animals were placed in the MRI coil cradle, which was connected to an anesthesia apparatus. Warm water baths were used to keep the animals warm during the MRI scan. Animals were checked every 20 minutes to assure they remained unconscious during the scan. An MRI-safe Nonin pulse oximeter was used to monitor oxygenation saturation and heart rate with the fiber-optic probe wraped around the tail or toe of each animal, and the device was applied for continuous monitoring.
T2- weighted images were collected with fast spin echo (SE) imaging by a 7T scanner (Bruker Biospin MRI, Germany). A fast low angle shot (FLASH) gradient echo (GRE) sequence was used for obtaining susceptibility weighted contrast. The imaging parameters for spin-echo (SE) were as follow: TE = 12.5 ms, TR = 4000 ms, FOV = 25 x 25 mm, resolution = 196 x 196, and slice thickness = 0.75 mm. Parameters for FLASH imaging were: TE = 10 ms, TR = 300 ms, FOV = 25 x 25 mm, resolution = 196 x 196, and slice thickness = 0.75 mm.
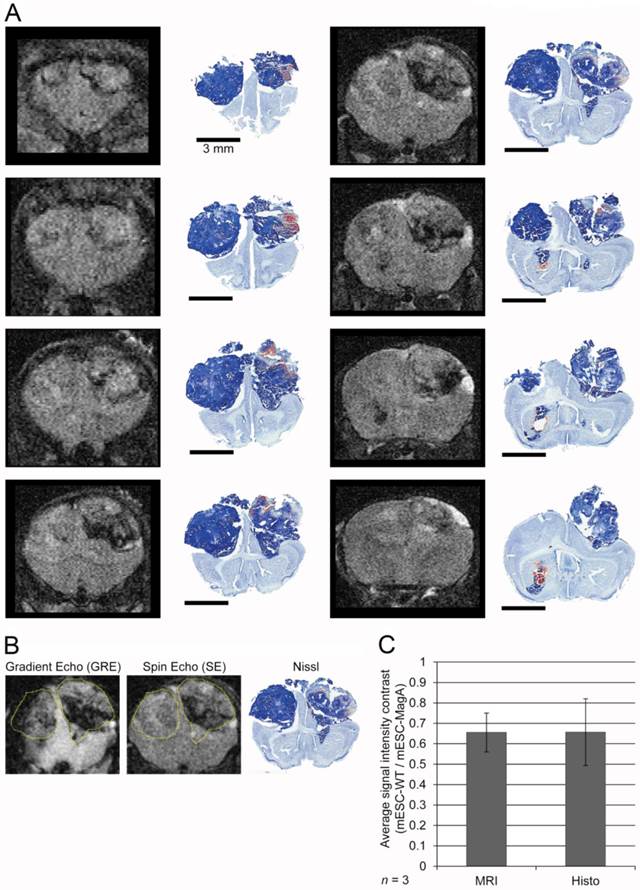
The region of interest (ROI) was defined in two different types of images, i.e., gradient echo and spin-echo. Using ImageJ, we considered bony landmarks, brain contour, and tumor size (i.e. area) when defining the ROI. For the last set, two different MRI images and Nissl staining of the brain sections were used to better define the ROI (Figure 8A,B). Scaling, rotation, and possible artifacts from fixation and the sampling process were taken into account. To evaluate the previous ROI analysis, we compared the ROI defined only by MRI and histo-adjusted ROI, and they showed similar signal intensity (Figure 8C).
Image processing and statistical analysis were performed using ImageJ 1.46r (NIH), SPSS (IBM), and Excel (Microsoft).
Histology
Mice were anesthetized and perfused transcardially with 37ºC PBS followed by ice-cold 4% paraformaldehyde. Whole brains were removed from the skull and post-fixed in 4% paraformaldehyde overnight followed by 30% sucrose. The whole brain was embedded in OCT and stored at -80ºC.Serial sections were cut at 30 µm using a Leica CM3050S Cryostat (Leica, Nussloch, Germany) and immediately captured on to gelatin-coated Superfrost® Plus (Fisher Scientific) slides. Nissl staining was performed to visualize the tumor.
For immunohistochemical staining of brain sections, a layer of PBS was placed onto a slide for 10 min at room temperature, then a solution of freshly prepared 1% sodium borohydribe in PBS was applied for 20 min inside the fume hood. Tissue sections were washed thoroughly with PBS. Freshly prepared 10% methanol and 0.3% H2O2 in PBS was applied for 30 min. After a rinse with PBS, preincubation was completed with blocking solution composed of 1% donkey serum, 1% BSA, and 0.3% Triton X-100 for 60 min at room temperature. The primary antibody solution was prepared in blocking solution (mouse anti-HA.11 clone 16B12 monoclonal 1:1,000; Covance) and incubated overnight in a humidified chamber at 4ºC.
For DAB staining, tissue sections were washed 3 times with PBS after incubation with primary antibody, followed by incubation with biotinylated antibody (Vector Laboratories) at a dilution of 1:200 in blocking solution for 90 min at room temperature. After 3 washes with PBS, DAB was revealed using a VECTASTAIN Elite ABC Kit (Vector Laboratories).
For immunofluorescent staining, tissue sections were washed 3 times with PBS after primary antibody incubation (mouse anti-HA.11 clone 16B12 monoclonal 1:1,000; Covance, rabbit anti-HNF4a 1:100; Santa Cruz Biotechnology, mouse anti-Nestin 1:500; Abcam, mouse anti-CD117 1:500; Southern Biotechnology, rabbit anti-Musashi 1:100; Chemicon, rabbit cleaved caspase-3 1:1,600; Cell Signaling), followed by incubation with a secondary antibody (anti-rabbit Alexa 594 1:1,000; Vector Laboratories, anti-mouse Alexa 594 1:1,000; Molecular Probes, anti-mouse Cy-5 conjugated 1:5,000; Jackson ImmunoResearch) for 90 min. Cell nuclei were visualized with Hoechst staining (0.12 µg/ml).
For cleaved caspase-3-positive cell counting, 3 sections from each mESC-MagA and mESC-WT tumor sections were selected and processed with ImageJ (NIH).
Prussian blue staining was performed at the Yerkes histopathology laboratory using the standard protocol to visualize the presence of iron in tumor samples.
Images were captured by using a BX51 microscope equipped with CellSens software.
Statistical analysis
All data and graphs are presented with standard error of the mean (SEM). For all the MRI data, MRI images were first processed, then signal intensities were extracted using ImageJ (NIH). Statistical analyses were completed using one-way analysis of variance (ANOVA) in SPSS 20 (IBM). P values less than 0.05 were employed for the threshold for statistical significance.
Results
Impact of MagA expression and MRI contrast generated in mESCs
In order to express MagA only at the time when MRI is performed, we used a Tet-On inducible expression system to regulate the expression of MagA. HA tag was placed downstream of the magA gene and inserted into a lentiviral vector under the control of the Tet-On switch. Zeocin, an antibiotic-resistant gene, was expressed through the internal ribosome entry site (IRES) downstream of rtTA regulated by human polyubiquitin (Ubi) promoter. The resulting Tet-On MagA lentiviral vector (LV-Tet-MagA) is illustrated in Figure 1A. High-titer LV-Tet-MagA was prepared as previously described [23] and used to transfect mESCs, followed by clonal selection using zeocin. A mESC line expressing the Tet-MagA (mESC-MagA) was established and used for subsequent studies.
Induced expression of MagA in mESC-MagA was first tested by using different concentrations of Dox. magA expression could be induced by supplementing Dox in mESC-MagA culture (Figure 1B), whereas there was no detectable magA transcript in the mESC-WT. A maximum expression of MagA was achieved at 1 µg/ml of Dox. Since there is no specific antibody for MagA, HA tag was used to determine the expression level of MagA by western blot analysis. There was no difference in the protein level when 0.25 µg/ml or more of the Dox was used to induce MagA expression (Figure 1C). Immunostaining using an HA-specific antibody demonstrated the expression of MagA in mESC-MagA upon induction by 1 µg/ml of Dox for three days (Figure 1D), and MagA expression was not detectable without the presence of Dox.
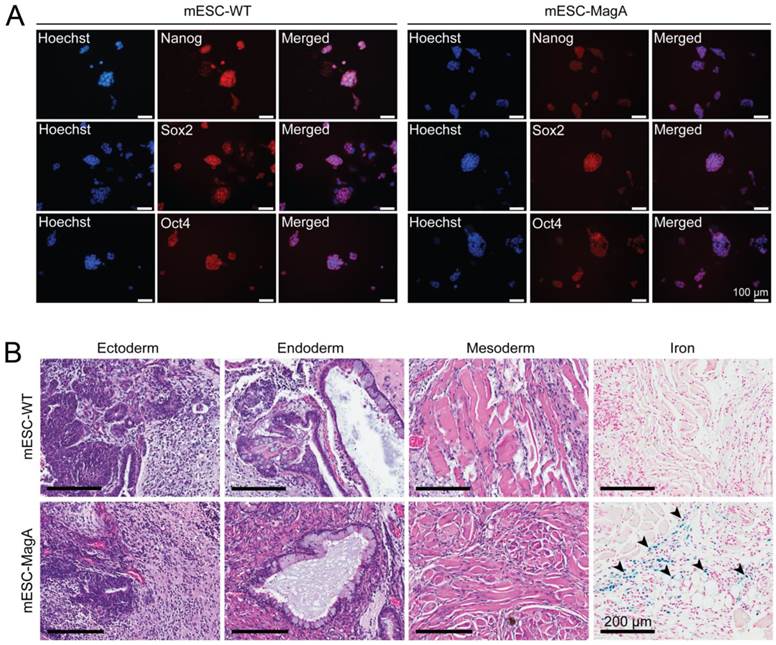
To evaluate whether the presence of the Tet-MagA affects the pluripotency of ESCs, immunostaining using stem cell-specific antibodies and teratoma formation assay in SCID mice were performed using mESC-MagA and mESC-WT (Figure 2). Both mESC-MagA and mESC-WT expressed stem cell markers (Figure 2A). All three germ layers were also observed in both mESC-MagA- and mESC-WT-derived teratoma (Figure 2B). Moreover, Prussian blue staining for iron revealed the accumulation of iron in mESC-MagA teratoma (Figure 2B, arrow heads), but not in mESC-WT.
Evaluation of pluripotency of mESC-MagA. (A) mESC-WT and mESC-MagA expressing pluripotency markers: Nanog, Sox2, and Oct4. Nucleus is visualized with Hoechst 33342. (B) Teratomas that developed from subcutaneous injection of 1x10⁶ mESC-WT and mESC-MagA cells into a nude mouse shoulder subsequently developed all three germ layers: ectoderm (neural epithelium), endoderm (ciliated epithelium and glands), and mesoderm (striated muscle). Also, Prussian blue-positive cells were observed (indicated by arrow heads) in mESC-MagA teratoma.
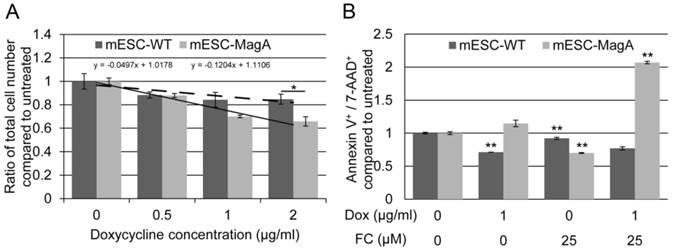
To determine the impact of expressing MagA on cells, we evaluated cell proliferation rate and cytotoxicity. The proliferation rates of mESC-MagA were not significantly different from mESC-WT at Dox concentrations of 0.5 µg/ml and 1 µg/ml, respectively (Figure 3A). However, with 2 µg/ml of Dox, mESC-MagA demonstrated a significant decrease in cell proliferation rate compared to mESC-WT (Figure 3A, P = 0.032, n = 3). The proliferation rates of both mESC-MagA and mESC-WT were negatively correlated with Dox concentration, while mESC-MagA was more sensitive to Dox than mESC-WT (Figure 3A, a = -0.04 versus -0.12). Cytotoxicity was evaluated based on changes in the annexin V and 7-aminoactinomycin D (AAD)-positive cell populations as measured by the Annexin V & Dead Cell Assay using Muse™ (EMD Millipore) (Figure 3B). Doxycycline alone did not increase the annexin V and 7-AAD-positive population in mESC-MagA. With 25 µM of ferric citrate (FC) added to the media, both mESC-MagA and mESC-WT showed a significant reduction in annexin V+ and 7-AAD+ cells (0.700 ± 0.006 and 0.921 ± 0.02, P< 0.001, n = 3). However, when both Dox and FC were added to the media, a two-fold increase was observed in mESC-MagA (2.07 ± 0.02, P < 0.001) in annexin V+ and 7-AAD+ cell populations, but annexin V+ and 7-AAD+ cell populations were significantly reduced in mESC-WT (0.769 ± 0.02, P< 0.001). Based on gene and protein expression as well as proliferation rate and cytotoxicity, 1 µg/ml of Dox was used in subsequent studies to achieve maximal MagA expression with minimal impact.
Evaluation of impact of expressing MagA in mESC. (A) The cell proliferation rate was determined by total cell count. The proliferation rate showed a negative correlation with the Dox concentration in both mESC-WT and mESC-MagA. We saw no significant suppression in proliferation up to 1 µg/ml of Dox (P = 0.091, n = 3); however, there was significant suppression at 2 µg/ml (*P = 0.032, n = 3). (B) The linear correlation demonstrates the sensitivity of both cell lines to Dox. Both mESC-WT and mESC-MagA showed a negative correlation between cell proliferation and doxycycline concentration. However, mESC-MagA showed a slightly higher negative linear correlation than mESC-WT (a = -0.17 versus -0.07). (C) When mESC-MagA was treated with 1 µg/ml Dox and 25 µM FC, a two-fold increase in annexin V+ and 7-AAD+ cell population (2.07 ± 0.0190, **P < 0.001) was observed, while there was no significant increase when mESC-MagA was treated only with Dox. All histogram data are means ± SEM. *P< 0.05, **P< 0.001 versus appropriate control by ANOVA.
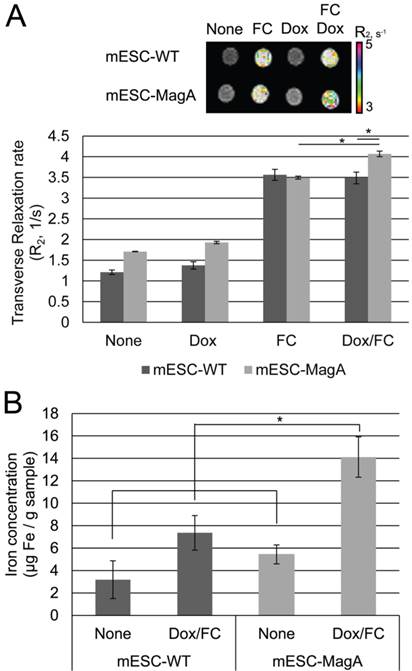
To examine whether MagA induces MRI contrast, we measured changes of transverse relaxation rate R2 in mESC-MagA and mESC-WT cell pellets under four conditions: None, Dox, FC, and Dox/FC (Figure 4A). When mESC-MagA was treated with Dox/FC, the R2 value was significantly increased when compared to mESC-WT treated with Dox/FC (P = 0.02, n = 3) (Figure 4A). Also, a statistically significant change in R2 was observed when mESC-MagA Dox/FC was compared to mESC-MagA FC (P = 0.002, n = 3). We then used ICP-OES to measure the iron content of the cell pellets after MRI scans. There was a significant increase in iron content in mESC-MagA treated with Dox/FC compared to all other groups (Figure 4B). mESC-MagA supplemented with Dox/FC had significantly higher iron content compared to mESC-WT supplemented with Dox/FC (P = 0.041, n = 3).
MRI of cell pellets and ICP-OES quantifications of iron in mESCs. (A) Color-coded R2 map from multi-echo measurements of R2 relaxation rate showed a significant increase in R2 rate when mESC-MagA was treated with Dox and FC. The cell pellet of mESC-MagA Dox/FC showed significantly induced relaxivity (R2) compared to mESC-WT with Dox/FC treatment (*P = 0.02, n = 3). Also, a significant increase in R2 rate was observed when mESC-MagA Dox/FC was compared to mESC-MagA FC (*P = 0.002, n =3). (B) mESC-MagA Dox/FC showed the highest iron content compared to all other groups. Compared to mESC-WT Dox/FC, mESC-MagA Dox/FC had significantly higher iron content (*P = 0.041, n = 3). There was no significant change when mESC-WT Dox/FC was compared to mESC-WT None (P = 0.11, n = 3). All histogram data are means ± SEM. *P< 0.05 versus appropriate control by ANOVA.
Non-invasive longitudinal monitoring of cell grafts with inducible MagA expression by MRI
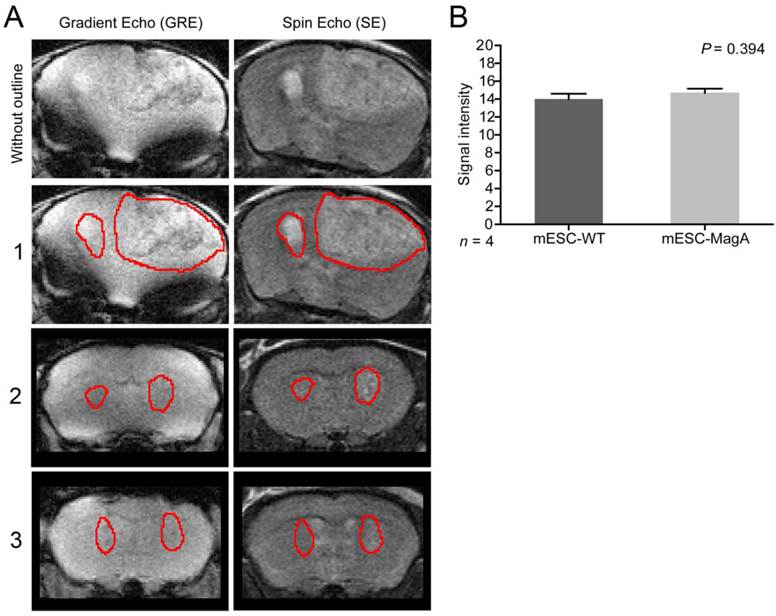
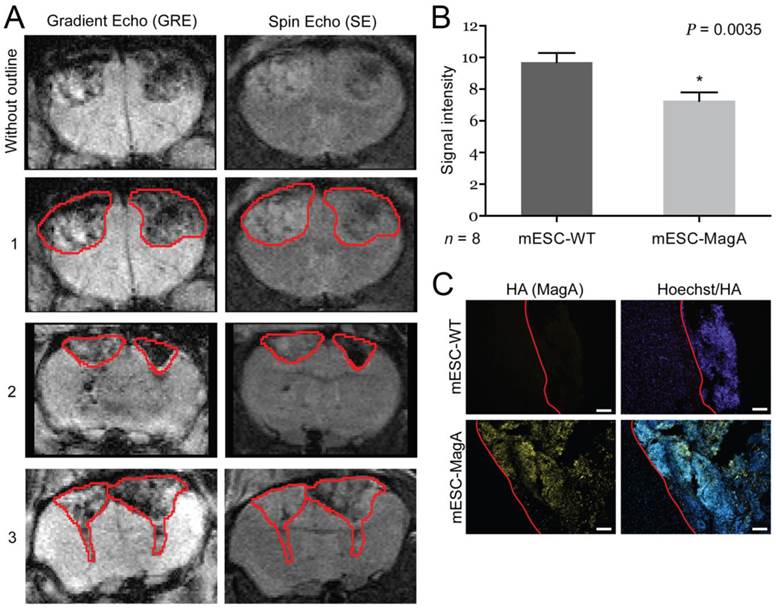
To determine whether grafted mESC-MagA could be monitored in vivo by MRI, we conducted two sets of experiments to determine whether the expression of MagA led to detectable contrast in vivo. The first study was to determine whether MRI contrast could only be detected when MagA was induced with no detectable contrast in non-induced mESC-MagA grafts. MRI scans were performed at 14 days after intracranial transplantation of mESC-MagA and mESC-WT without Dox induction, “OFF” (Figure 5A). We observed no difference in MRI signal between mESC-MagA- and mESC-WT-derived tumor in the brain (P = 0.3934, n = 4; Figure 5B). Next, we induced MagA in vivo, “ON,” by administration of Dox in the diet (water and chow). Expression of MagA was induced in vivo for 7 days by feeding recipient mice with sterile Dox chow (Bio-Serve) and Dox- and FC-supplemented water. Three representative MRI scans are presented in Figure 6A. Quantification of the MR contrast revealed a significant decrease in MR signal from mESC-MagA-derived tumor compared to mESC-WT-derived tumor (P = 0.0035, n = 8; Figure 6B). Immunostaining of the brain sections confirmed MagA expression in mESC-MagA-derived tumor, but not in mESC-WT (Figure 6C).
No induction, “OFF,” in vivo cell graft experiment. (A) Representative MRI images from three mice are presented with tumor boundaries highlighted with red lines. Left side was grafted with mESC-WT and right side was grafted with mESC-MagA. Both gradient echo and spin echo images are shown side-by-side. (B) No difference was observed in MR contrast in mESC-WT and mESC-MagA grafts (P = 0.394, n = 4). All histogram data are means ± SEM.
In vivo induction, “ON,” cell graft experiment. (A) Three representative MRI images are presented with tumor boundaries highlighted with red lines. Left side was grafted with mESC-WT, and right side was grafted with mESC-MagA. (B) A significant MR contrast was observed after MagA expression was induced with Dox in the diet for 7 days (P = 0.0035, n = 8). (C) Immunofluorescence analysis using HA antibody confirmed MagA expression in mESC-MagA-derived tumor in the brain. The boundary is highlighted with red lines. All histogram data are means ± SEM. *P< 0.05 versus appropriate control by ANOVA.
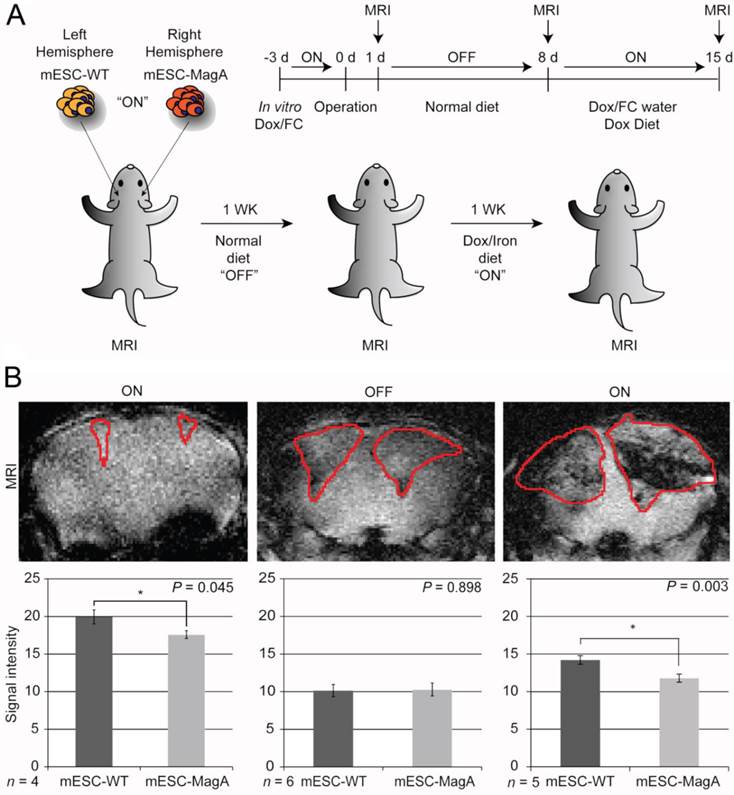
The next study was to determine the feasibility of MagA in non-invasive longitudinal MRI monitoring of cell grafts. We conducted a series of MRI scans on mESC-MagA grafts with “ON” and “OFF” expression of MagA controlled by administration of Dox and FC in rodent chow and water. A total of three scans were performed weekly for three weeks. Based on the experimental paradigm shown in Figure 7A, the mESC-MagA was induced by Dox/FC for three days before intracranial implantation, “ON (-3 days from operation or -3d p.o.).” The first MRI was performed 24 h after implantation. Seven days after the first scan, during which no Dox was provided to the mice, “OFF (+8d p.o.),” a second MRI scan was performed. After the second scan, mice were fed Dox Diet (Bio-Serv) and water supplemented with Dox and FC for 7 days, “ON (+15d p.o.)”. Mice were euthanized after the last MRI scan on day 15 after implantation (+15 d p.o.). Figure 7B shows the representative susceptibility-weighted gradient echo images from each of the repetitive scans of a mouse with MagA expression status indicated by “ON” and “OFF” above each image and the corresponding signal intensity shown below. A significant signal reduction was observed in the hemisphere where mESC-MagA cells were grafted, compared to mESC-WT (17.6 ± 0.5 versus 19.9 ± 0.9, P=0.045, n=4; Figure 7B bottom panel-left) from the first scan (“ON” -24 h p.o.). After a week of withdrawal from Dox/FC (“OFF” +8 d p.o.), signals from the region of mESC-MagA grafts returned to baseline levels, similar to mESC-WT grafts (10.1 ± 0.8 and 10.3 ± 0.9, respectively, P = 0.898, n=6; Figure 7B bottom panel-middle). After7 days of induced expression of MagA by Dox Diet (Bio-Serv) and water supplemented with Dox and FC (“ON” +15d p.o.), the mESC-MagA grafts showed a significant signal reduction compared to the mESC-WT grafts (11.8 ± 0.5 versus 14.2 ± 0.6, respectively, P=0.003, n=5; Figure 7B bottom panel-right). This longitudinal imaging study of “ON,” ”OFF,” and “ON” expression of MagA after intracranial transplantation confirmed that MRI contrast can be generated by in vivo induced expression of MagA in mESC-MagA grafts by dietary supplement of Dox/FC. Significant hypointense signal was only observed when MagA was induced in vivo, while there was no detectable contrast when MagA was not induced. In order to better define the ROI for analyzing contrast changes, Nissl staining was performed on serial sections of the whole brain (Figure 8A). GRE and SE images as well as Nissl-stained sections were aligned side by side to define and match the regions of interest (Figure 8B). When the average signal intensity was calculated using ROI defined by MRI images (MRI) and compared with those calculated using histology-adjusted ROI (Histo), similar signal contrast was observed (0.655 ±0.0951 versus 0.657 ± 0.164, n = 3; Figure 8C).
Longitudinal monitoring of intracranial implanted cell grafts in mice using inducible MagA reporter by repeated MRI. (A) Schematic representing the experimental procedure. The inset on upper right corner demonstrates the timeline of the in vivo MRI study. (B) A representative susceptibility weighted MRI image of a single mouse that went through the whole longitudinal repeated MRI scan. Regions of interest (ROIs) are highlighted with the correlated signal intensity analysis shown on the bottom. MRI images demonstrate the contrast between mESC-WT and mESC-MagA when MagA was induced (“ON” state, first and last images), but no contrast when MagA was not induced (“OFF” state, middle image). The graphs demonstrate statistically significant hypointense signals in “On” states. A significant MRI contrast was observed at 24 h p.o. (*P = 0.045, n = 4). When MagA expression was not induced, the signal intensity was similar for both teratomas (10.1 ± 0.807 and 10.3 ± 0.859, P = 0.898, n = 6). When MagA expression was induced again in vivo, there was a significant difference in signal intensity, as the hemisphere hosting mESC-MagA graft shows a region with hypointense signal compared to the contralateral hemisphere with mESC-WT graft (11.8 ± 0.542 versus 14.2 ± 0.578 respectively, *P = 0.003, n = 5). All histogram data are means ± SEM. *P< 0.05, **P< 0.001 versus appropriate control by ANOVA.
Correlation and evaluation of histological sections and refinement of region of interest in MRI images. (A) A complete series of MRI images from a single MRI scan was aligned with corresponding histological sections at the right column. (B) Two MRI images and Nissl staining histology of the whole brain demonstrated how a ROI was defined for signal analysis. (C) A comparison between signal intensity analysis using only MRI images to define ROI versus histology-adjusted ROI, which showed similar signal contrast (0.655 ± 0.0951 versus 0.657 ± 0.163, n = 3).
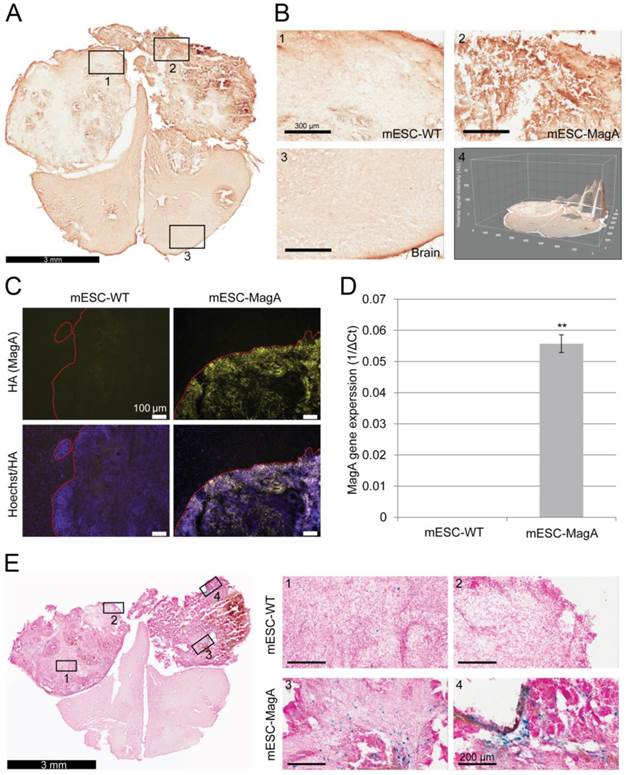
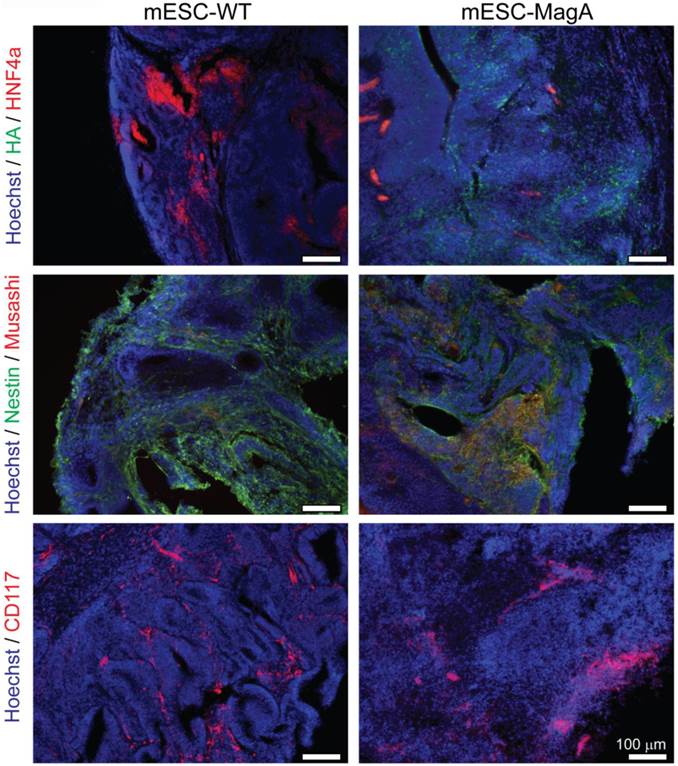
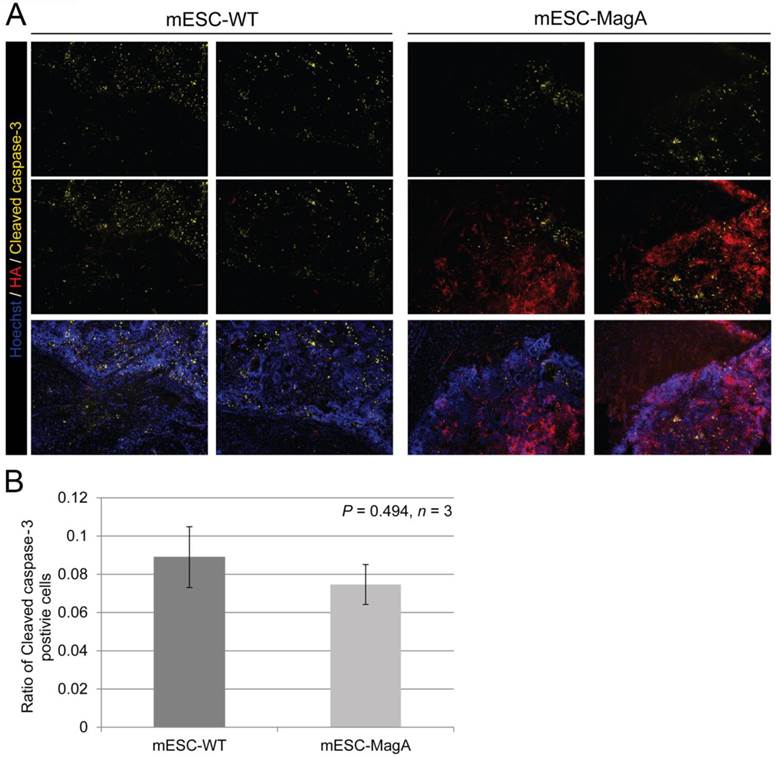
We then confirmed induced expression of MagA in vivo by qPCR and immunostaining of serial brain sections. MagA expression was observed in mESC-MagA-derived tumor, as shown by immunostaining using HA-specific antibody followed by DAB staining (Figure 9A). At a higher magnification, a distinct signal can be seen in mESC-MagA-derived tumor (Figure 9B-2) compared to the mESC-WT-derived tumor (Figure 9B-1) or at a randomly selected area of the same brain section (Figure 9B-3). A three-dimensional densitometry plot of the DAB staining demonstrates the expression pattern of MagA in mESC-MagA-derived tumor (Figure 9B-4). Immunofluorescent staining further demonstrated the specific expression of MagA in mESC-MagA-derived tumor (Figure 9C). Quantitative measurement and comparison of magA transcript in teratomas derived from both mESC-MagA and mESC-WT grafts further confirmed the induced expression of MagA in the mESC-MagA grafts (Figure 9D). Prussian blue staining revealed more positively stained cells in mESC-MagA-derived tumor compared to those found sparsely in mESC-WT-derived tumor (Figure 9E), thus suggesting an increase of iron content in mESC-MagA-derived tumor. The pattern of magA gene expression and Prussian blue staining revealed the heterogeneity of the tumor developed from mESC-WT and mESC-MagA grafts (Figure 10). Both mESC-WT and mESC-MagA-derived tumors showed positive for lineage-specific markers HNF4a (mesoderm), Nestin (ectoderm), Musashi (ectoderm), and CD117 (endoderm). In addition, in order to assess the apoptotic population in tumors, cleaved caspase-3 staining was performed on tumor sections. Cleaved caspase-3 staining revealed no difference in apoptotic cell number in tumors derived from mESC-WT and mESC-MagA cell grafts (Figure 11, P = 0.494, n = 3).
Confirmation and correlation of MagA expression and iron content in teratoma. (A) Immunohistochemical DAB staining using HA antibody demonstrated MagA expression throughout mESC-MagA tumor. (B) At higher magnification, images of different brain regions (1-mESC-WT, 2-mESC-MagA, and 3-Brain) demonstrated distinct intensity, which was also revealed by three-dimensional image of the brain section. (C) Immunofluorescence analysis using HA antibody demonstrated MagA expression in mESC-MagA-derived teratoma. A clear boundary was visible, and MagA expression was only detectable in teratoma developed from mESC-MagA transplantation. (D) Quantitative real-time PCR measurement demonstrates the expression of magA seen only in teratoma developed from mESC-MagA transplantation, while there was no expression in teratoma samples developed from mESC-WT (**P< 0.001, n = 4). (E) A representative Prussian blue staining of a brain section demonstrated higher frequency of Prussian blue-positive cells in mESC-MagA (3 and 4) derived teratoma compared to mESC-WT side (1 and 2). All histogram data are means ± SEM. *P< 0.05, **P< 0.001 versus appropriate control by ANOVA.
Heterogeneity of tumor. mESC-WT- and mESC-MagA-derived tumors exhibited heterogeneity. Both tumors were positive for lineage-specific markers. Immunohistochemistry of brain sections reveal positive staining of each lineage-specific marker: HNF4a (mesoderm), Nestin and Musashi (ectoderm), and CD117 (endoderm). Scale bars: 100 µm.
Apoptotic cell population in tumor. (A) Representative pictures of mESC-WT- and mESC-MagA-derived tumor sections are shown. (B) Quantification of cleaved caspase-3-positive cell population demonstrated similar cleaved caspase-3-positive cell population for both mESC-WT-derived and mESC-MagA-derived tumor (P = 0.494, n =3). All histogram data are means ± SEM.
Discussion
As we move towards cell replacement therapy in the clinic, a reliable genetic MRI reporter will be critical, especially in studies using large animal models. An ideal reporting system would help address issues relevant to clinical translation, such as safety and the long-term monitoring of cell grafts that will allow researchers to determine cell viability and functions, correlating these with clinical outcome. Here we report the feasibility of in vivo monitoring of stem cell grafts longitudinally by using an inducible genetic MRI reporter, MagA.
By employing a Tet-On inducible system, we were able to control MagA expression as needed to monitor cell grafts; therefore, risks from the continuous accumulation of MagA and iron can be reduced. We have shown that a high expression level of MagA affected cell proliferation and increased cytotoxicity (Figure 3A,C). Increases of cellular iron, if it's not converted to a stable form, such as stored in ferritin, can potentially be harmful to cells because ferrous (Fe2+) iron may also spur the production of reactive oxygen species (ROS) [40]. Constitutive overexpression of ferritin has resulted in neurodegeneration in dopaminergic midbrain neurons [41]. Several reports also suggest that SPIO used for cell labeling affects cell differentiation [42-44]. These studies underscore the importance of controlling the amount of iron accumulated in cell grafts. It is therefore necessary to control the expression of a genetic reporter to minimize risks from constitutive expression.
Our teratoma formation assay and the expression of pluripotency markers in cell culture (Figure 2A, B) suggested that the pluripotency of mESCs was not affected by the lentiviral transduction procedure or the presence of MagA. Although pluripotent stem cells, such as ESCs or iPSCs, are not likely to be used for cell therapy because of their pluripotent nature and tendency to form teratoma, the preservation of pluripotency in ESCs or iPSCs remains important for future applications of MagA because mESCs can be genetically modified to express inducible MagA followed by differentiation into specific cell types, such as neurons for cell therapy.
The heterogeneous nature of the teratoma derived from mESC grafts was not unexpected (Figure 9,11); however, we did see variations in MagA expression patterns, iron content, and contrast signal observed in the teratoma. Since teratoma consists of diverse tissue types, epigenetic gene silencing in different cell types may influence the expression pattern of MagA upon induction and affect iron uptake and retention in the tumor. In addition, like other tumors, blood supply may not be evenly distributed in the tumor, and the distribution of Dox and FC may vary. As a result, MR contrast generated by the induced expression of MagA is expected to be affected. According to the cell pellet phantom study, induced expression of MagA in mESC-MagA generated a significant but smaller transverse relaxivity compared to our previous report in 293FT cells [23]. This finding further suggests differences in cell types that may play a role in the formation of magnetosomes and the uptake or accumulation of iron that affect the generation of MR contrast. Besides the nature of cell types, in prokaryotic cells, many genes are involved in the formation of the magnetosome [45]. To date, the role of MagA as an iron transporter in magnetosome formation is not fully understood, as one report demonstrated MagA is not essential in the formation of magnetosome [46]. Therefore, to enhance magnetosome production efficiency, the co-expression of such genes with magA may improve the variations in iron uptake and the formation of magnetosome and enhance MR contrast signal. However, the effect of epigenetic gene silencing will remain for ESC- and iPSC-derived teratoma. One possible solution is to use a cell source with a more defined lineage in cell therapy, resulting in a homogenous cell population; thus a more uniform expression pattern of MagA could be achieved with enhanced and homogeneous MR contrast.
The increased cytotoxicity seen in MagA expression ESCs has raised concerns over whether MR contrast detected by MRI was the result of iron released from lysed cells, rather than the accumulation of iron in live MagA expression cell grafts. To address this question, we used cleaved caspase-3 antibody for immunostaining to evaluate apoptosis in sections of the brain tumors. Our results demonstrated that both mESC-WT and mESC-MagA-derived tumor had a similar ratio of apoptotic cells (Figure 11), and the MRI contrast observed in mESC-MagA cell grafts was likely not due to the increase of dead cells.
Our current study is consistent with prior studies that revealed increased iron content when MagA was expressed in mammalian cell lines [23]. Recent reports also showed similar T2 weighted MR contrast in ferritin and MagA-expressing melanoma cells [32, 47]. These studies further support the notion that the expression of MagA leads to the formation of magnetic crystals in mammalian cells, resulting in enhanced relaxation rates.
Compared to ex vivo cell labeling methods using exogenous contrast agents, such as SPIO, the major limitation of a genetic MRI reporter is its relatively lower sensitivity [29]. Our data also suggest a limitation in sensitivity because we saw a significant but small increase in transverse relaxivity. For short-term study, monitoring of differentiated cells, such as neurons or cells with a slow proliferation rate, an exogenous labeling method could work. However, in the case of pluripotent stem cells or progenitor cells with restricted lineage differentiation capability, a direct labeling approach may not be suitable because these cells can continue to proliferate and divide asymmetrically [48]. Moreover, recent studies suggested that SPIO may have an adverse impact on cell differentiation [44, 49-51]. These studies clearly revealed the inevitable side effects of long-term exposure to cell labeling reagents, such as SPIO or reporting proteins [41, 44, 52]. While the search for a perfect reporting system continues, an inducible genetic reporter such as “Tet-MagA” provides a unique tool for long-term longitudinal tracking of cell grafts and their progeny cells over generations. As an inducible reporter system, the expression of MagA can be controlled by the administration of Dox when cell grafts need to be assessed, making the unnecessary accumulation of MagA in the cells avoidable and reducing cytotoxicity. An alternative approach is the combination of exogenous labeling reagents and genetic reporters to allow precise identification of where cell grafts reside because of the high signal contrast of SPIO, followed by long-term monitoring using genetic reporters such as MagA. This approach could provide a unique platform for long-term longitudinal studies in large animal models, such as porcine and nonhuman primates.
Due to the fast-growing rate of mESC-MagA in the development of teratoma and in consideration of animal welfare, we could only perform three MRI scans under “ON” and “OFF” expression of MagA as a proof of principle. Future study using less tumorigenic lineage-specific cell types, such as NPCs, will allow long-term longitudinal study of cell grafts with repetitive induced expression of MagA followed by MRI as needed to assess cell graft conditions. Non-tumorigenic cell types like NPCs will also allow us to investigate the sensitivity or detection threshold of MagA, which we were unable to address in the current study.
To move stem cell-based therapy into the clinic, its efficacy must be demonstrated in animal models with symptomatology and pathology resembling the human disease [53]. Although mouse or rat models were instrumental in studying genetics and the general pathology of degenerative diseases, due to anatomical, developmental, and symptomatology differences, preclinical evaluations will have to be conducted in larger animal models such as rhesus and pig. A preclinical study has been conducted in rhesus to demonstrate the efficacy of stem cell-based therapy in a Parkinson's disease model [54]; however, no functional improvement was reported due to insufficient graft size [54]. Although some studies have yielded promising results, others have reported variability or an absence of effects on behavior or neurological function [55]. The inconsistency was due to poor cell survival, immunological rejection, tumor developments, poor functional integration, biological variation, and measurement errors [55]. A non-invasive in vivo reporter could have been used in these preclinical studies to assess graft status, which might have helped the researchers make better clinical decisions and improve the study outcome. Problems such as insufficient graft size, poor cell survival, immunological rejection, tumor development, and poor functional integration are the issues that could have been addressed with a genetic MRI reporter such as MagA. Our future study will focus on using Tet-MagA in more differentiated cells, such as NPCs. By non-invasively and longitudinally assessing the cell grafts, MagA will help us make timely assessments of cell graft status and correlate with clinical outcomes.
Conclusion
We have demonstrated the use of MagA as a genetic MRI reporter for monitoring stem cell grafts in mice by using a Tet-On expression system to control the expression of MagA, thereby controlling the level of MRI contrast. With the high spatial resolution and soft tissue contrast provided by MRI, MagA has great potential for noninvasive, longitudinal, and continuous tracking of stem cell grafts in large animals, such as NHP or porcine models. MagA can be used as an MRI reporter that allows timely assessment of cell grafts and correlates with clinical outcomes, which has been one of the roadblocks to advancing regenerative medicine for clinical translation.
Abbreviations
MRI: magnetic resonance imaging; mESC: mouse embryonic stem cell; Dox: doxycycline; BLI: bioluminescence imaging; Luc: luciferase; NHP: nonhuman primates; hdCK3mut: human deoxycytidine kinase mutant; PET: positron emission tomography; SPIO: superparamagnetic iron oxide nanoparticles; DMT1: divalent metal transporter; HA: human hemagglutinin A; IRES: internal ribosome entry site; LV: lentiviral vector; Tet: tetracycline; WT: wild-type; AAD: 7-aminoactinomycin D; FC: ferric citrate; ICP-OES: inductively coupled plasma atomic emission spectroscopy; p.o.: post-operation; d: day; hr: hour; qPCR: quantitative real-time polymerase chain reaction; DAB: 3,3'-diaminobenzidine; ROS: reactive oxygen species; TEM: transmission electron microscopy; MEF: mouse embryonic fibroblast; DMEM: Dulbecco's Modified Eagle's medium; FBS: fetal bovine serum; L-Glu: L-glutamine; β-Mer: β-mercaptoethanol; P/S: penicillin/streptomycin; NEAA: Non-essential amino acid; hLIF: human recombinant leukemia inhibiting factor; TRE: tetracycline response element; RIPA: radioimmunoprecipitation assay; SDS-PAGE: sodium dodecyl sulfate polyacrylamide gel electrophoresis; PVDF: polyvinylidene fluoride; PFA: paraformaldehyde; PBS: phosphate buffered saline; PS: phosphatidylserine; SEM: standard error of the mean; H&E: hematoxylin and eosin; MSME: multi-slice and multi-TE; TE: echo time; TR: time of repetition; FOV: field of view; GRE: gradient echo; SE: spin-echo; ROI: region of interest; OCT: optimal cutting temperature compound.
Acknowledgements
We thank the Yerkes National Primate Research Center (YNPRC) veterinarians, animal care staff, and YNPRC imaging center staff for providing outstanding services. We thank Susan Jenkins for helping with Nissl staining and Cheryl Strauss for editorial assistance. YNPRC is supported by the National Center for Research Resources P51RR165 and is currently supported by the Office of Research and Infrastructure Program (ORIP)/OD P51OD11132. This study is supported by a grant awarded by the NINDS/NIH (NS064991) to AWSC.
Competing Interests
The authors have declared that no competing interest exists.
References
1. Bachoud-Levi AC, Remy P, Nguyen JP, Brugieres P, Lefaucheur JP, Bourdet C. et al. Motor and cognitive improvements in patients with Huntington's disease after neural transplantation. Lancet. 2000;356:1975-9 doi:S0140673600033109 [pii]
2. Arenas E. Stem cells in the treatment of Parkinson's disease. Brain Res Bull. 2002;57:795-808 doi:S0361923001007729 [pii]
3. Park S, Kim EY, Ghil GS, Joo WS, Wang KC, Kim YS. et al. Genetically modified human embryonic stem cells relieve symptomatic motor behavior in a rat model of Parkinson's disease. Neurosci Lett. 2003;353:91-4 doi:S0304394003010826 [pii]
4. Lee RH, Seo MJ, Reger RL, Spees JL, Pulin AA, Olson SD. et al. Multipotent stromal cells from human marrow home to and promote repair of pancreatic islets and renal glomeruli in diabetic NOD/scid mice. Proc Natl Acad Sci U S A. 2006;103:17438-43 doi:0608249103 [pii] 10.1073/pnas.0608249103
5. Wernig M, Zhao JP, Pruszak J, Hedlund E, Fu D, Soldner F. et al. Neurons derived from reprogrammed fibroblasts functionally integrate into the fetal brain and improve symptoms of rats with Parkinson's disease. Proc Natl Acad Sci U S A. 2008;105:5856-61 doi:10.1073/pnas.0801677105
6. Schwarz SC, Schwarz J. Translation of stem cell therapy for neurological diseases. Translational research: the journal of laboratory and clinical medicine. 2010;156:155-60 doi:10.1016/j.trsl.2010.07.002
7. Kircher MF, Gambhir SS, Grimm J. Noninvasive cell-tracking methods. Nature reviews Clinical oncology. 2011;8:677-88 doi:10.1038/nrclinonc.2011.141
8. Sweeney TJ, Mailander V, Tucker AA, Olomu AB, Zhang W, Cao Y. et al. Visualizing the kinetics of tumor-cell clearance in living animals. Proc Natl Acad Sci U S A. 1999;96:12044-9
9. Weissleder R, Tung CH, Mahmood U, Bogdanov A Jr. In vivo imaging of tumors with protease-activated near-infrared fluorescent probes. Nat Biotechnol. 1999;17:375-8 doi:10.1038/7933
10. McCracken MN, Gschweng EH, Nair-Gill E, McLaughlin J, Cooper AR, Riedinger M. et al. Long-term in vivo monitoring of mouse and human hematopoietic stem cell engraftment with a human positron emission tomography reporter gene. Proc Natl Acad Sci U S A. 2013;110:1857-62 doi:10.1073/pnas.1221840110
11. Vandsburger MH, Radoul M, Cohen B, Neeman M. MRI reporter genes: applications for imaging of cell survival, proliferation, migration and differentiation. NMR in biomedicine. 2013;26:872-84 doi:10.1002/nbm.2869
12. Persigehl T, Heindel W, Bremer C. MR and optical approaches to molecular imaging. Abdom Imaging. 2005;30:342-54 doi:10.1007/s00261-004-0230-3
13. Hyslop WB, Semelka RC. Future directions in body magnetic resonance imaging. Top Magn Reson Imaging. 2005;16:3-14
14. Kircher MF, Allport JR, Graves EE, Love V, Josephson L, Lichtman AH. et al. In vivo high resolution three-dimensional imaging of antigen-specific cytotoxic T-lymphocyte trafficking to tumors. Cancer Res. 2003;63:6838-46
15. Lewin M, Carlesso N, Tung CH, Tang XW, Cory D, Scadden DT. et al. Tat peptide-derivatized magnetic nanoparticles allow in vivo tracking and recovery of progenitor cells. Nat Biotechnol. 2000;18:410-4 doi:10.1038/74464
16. Weissleder R. Target-specific superparamagnetic MR contrast agents. Magn Reson Med. 1991;22:209-12 discussion 13-5
17. Remsen LG, McCormick CI, Roman-Goldstein S, Nilaver G, Weissleder R, Bogdanov A. et al. MR of carcinoma-specific monoclonal antibody conjugated to monocrystalline iron oxide nanoparticles: the potential for noninvasive diagnosis. AJNR Am J Neuroradiol. 1996;17:411-8
18. Moore A, Basilion JP, Chiocca EA, Weissleder R. Measuring transferrin receptor gene expression by NMR imaging. Biochim Biophys Acta. 1998;1402:239-49 doi:S0167-4889(98)00002-0 [pii]
19. Bulte JW, Zhang S, van Gelderen P, Herynek V, Jordan EK, Duncan ID. et al. Neurotransplantation of magnetically labeled oligodendrocyte progenitors: magnetic resonance tracking of cell migration and myelination. Proc Natl Acad Sci U S A. 1999;96:15256-61
20. Artemov D, Mori N, Okollie B, Bhujwalla ZM. MR molecular imaging of the Her-2/neu receptor in breast cancer cells using targeted iron oxide nanoparticles. Magn Reson Med. 2003;49:403-8 doi:10.1002/mrm.10406
21. Bulte JW, Douglas T, Witwer B, Zhang SC, Strable E, Lewis BK. et al. Magnetodendrimers allow endosomal magnetic labeling and in vivo tracking of stem cells. Nat Biotechnol. 2001;19:1141-7 doi:10.1038/nbt1201-1141 nbt1201-1141 [pii]
22. Ahrens ET, Bulte JW. Tracking immune cells in vivo using magnetic resonance imaging. Nature reviews Immunology. 2013;13:755-63 doi:10.1038/nri3531
23. Zurkiya O, Chan AW, Hu X. MagA is sufficient for producing magnetic nanoparticles in mammalian cells, making it an MRI reporter. Magn Reson Med. 2008;59:1225-31 doi:10.1002/mrm.21606
24. Koretsky AP, Brosnan MJ, Chen LH, Chen JD, Van Dyke T. NMR detection of creatine kinase expressed in liver of transgenic mice: determination of free ADP levels. Proc Natl Acad Sci U S A. 1990;87:3112-6
25. Bartelle BB, Szulc KU, Suero-Abreu GA, Rodriguez JJ, Turnbull DH. Divalent metal transporter, DMT1: A novel MRI reporter protein. Magn Reson Med. 2012 doi:10.1002/mrm.24509
26. Vandsburger MH, Radoul M, Addadi Y, Mpofu S, Cohen B, Eilam R. et al. Ovarian carcinoma: quantitative biexponential MR imaging relaxometry reveals the dynamic recruitment of ferritin-expressing fibroblasts to the angiogenic rim of tumors. Radiology. 2013;268:790-801 doi:10.1148/radiol.13122053
27. Cohen B, Dafni H, Meir G, Harmelin A, Neeman M. Ferritin as an endogenous MRI reporter for noninvasive imaging of gene expression in C6 glioma tumors. Neoplasia. 2005;7:109-17 doi:10.1593/neo.04436
28. Genove G, DeMarco U, Xu H, Goins WF, Ahrens ET. A new transgene reporter for in vivo magnetic resonance imaging. Nat Med. 2005;11:450-4 doi:10.1038/nm1208
29. Vande Velde G, Rangarajan JR, Toelen J, Dresselaers T, Ibrahimi A, Krylychkina O. et al. Evaluation of the specificity and sensitivity of ferritin as an MRI reporter gene in the mouse brain using lentiviral and adeno-associated viral vectors. Gene therapy. 2011;18:594-605 doi:10.1038/gt.2011.2
30. Vande Velde G, Raman Rangarajan J, Vreys R, Guglielmetti C, Dresselaers T, Verhoye M. et al. Quantitative evaluation of MRI-based tracking of ferritin-labeled endogenous neural stem cell progeny in rodent brain. NeuroImage. 2012;62:367-80 doi:10.1016/j.neuroimage.2012.04.040
31. Kim HS, Cho HR, Choi SH, Woo JS, Moon WK. In vivo imaging of tumor transduced with bimodal lentiviral vector encoding human ferritin and green fluorescent protein on a 1.5T clinical magnetic resonance scanner. Cancer Res. 2010;70:7315-24 doi:10.1158/0008-5472.CAN-10-0241
32. Rohani R, Figueredo R, Bureau Y, Koropatnick J, Foster P, Thompson RT. et al. Imaging Tumor Growth Non-invasively Using Expression of MagA or Modified Ferritin Subunits to Augment Intracellular Contrast for Repetitive MRI. Molecular imaging and biology: MIB: the official publication of the Academy of Molecular Imaging. 2013 doi:10.1007/s11307-013-0661-8
33. Liu J, Cheng EC, Long RC, Yang SH, Wang L, Cheng PH. et al. Noninvasive monitoring of embryonic stem cells in vivo with MRI transgene reporter. Tissue engineering Part C, Methods. 2009;15:739-47 doi:10.1089/ten.TEC.2008.0678
34. Iordanova B, Hitchens TK, Robison CS, Ahrens ET. Engineered mitochondrial ferritin as a magnetic resonance imaging reporter in mouse olfactory epithelium. PloS one. 2013;8:e72720. doi:10.1371/journal.pone.0072720
35. Louie AY, Huber MM, Ahrens ET, Rothbacher U, Moats R, Jacobs RE. et al. In vivo visualization of gene expression using magnetic resonance imaging. Nat Biotechnol. 2000;18:321-5 doi:10.1038/73780
36. Goldhawk DE, Lemaire C, McCreary CR, McGirr R, Dhanvantari S, Thompson RT. et al. Magnetic resonance imaging of cells overexpressing MagA, an endogenous contrast agent for live cell imaging. Molecular imaging. 2009;8:129-39
37. Alfke H, Stoppler H, Nocken F, Heverhagen JT, Kleb B, Czubayko F. et al. In vitro MR imaging of regulated gene expression. Radiology. 2003;228:488-92 doi:10.1148/radiol.2282012006
38. Nakamura C, Burgess JG, Sode K, Matsunaga T. An iron-regulated gene, magA, encoding an iron transport protein of Magnetospirillum sp. strain AMB-1. J Biol Chem. 1995;270:28392-6
39. Nakamura C, Kikuchi T, Burgess JG, Matsunaga T. Iron-regulated expression and membrane localization of the magA protein in Magnetospirillum sp. strain AMB-1. J Biochem. 1995;118:23-7
40. Kehrer JP. The Haber-Weiss reaction and mechanisms of toxicity. Toxicology. 2000;149:43-50
41. Kaur D, Rajagopalan S, Chinta S, Kumar J, Di Monte D, Cherny RA. et al. Chronic ferritin expression within murine dopaminergic midbrain neurons results in a progressive age-related neurodegeneration. Brain research. 2007;1140:188-94 doi:10.1016/j.brainres.2006.03.006
42. Kostura L, Kraitchman DL, Mackay AM, Pittenger MF, Bulte JW. Feridex labeling of mesenchymal stem cells inhibits chondrogenesis but not adipogenesis or osteogenesis. NMR in biomedicine. 2004;17:513-7 doi:10.1002/nbm.925
43. Bulte JW, Kraitchman DL, Mackay AM, Pittenger MF. Chondrogenic differentiation of mesenchymal stem cells is inhibited after magnetic labeling with ferumoxides. Blood. 2004;104:3410-2 author reply 2-3. doi:10.1182/blood-2004-06-2117
44. Chen YC, Hsiao JK, Liu HM, Lai IY, Yao M, Hsu SC. et al. The inhibitory effect of superparamagnetic iron oxide nanoparticle (Ferucarbotran) on osteogenic differentiation and its signaling mechanism in human mesenchymal stem cells. Toxicology and applied pharmacology. 2010;245:272-9 doi:10.1016/j.taap.2010.03.011
45. Bazylinski DA, Frankel RB. Magnetosome formation in prokaryotes. Nat Rev Microbiol. 2004;2:217-30 doi:10.1038/nrmicro842 nrmicro842 [pii]
46. Uebe R, Henn V, Schuler D. The MagA protein of Magnetospirilla is not involved in bacterial magnetite biomineralization. Journal of bacteriology. 2012;194:1018-23 doi:10.1128/JB.06356-11
47. Sengupta A, Quiaoit K, Thompson RT, Prato FS, Gelman N, Goldhawk DE. Biophysical features of MagA expression in mammalian cells: implications for MRI contrast. Frontiers in microbiology. 2014;5:29. doi:10.3389/fmicb.2014.00029
48. Walczak P, Kedziorek DA, Gilad AA, Barnett BP, Bulte JWM. Applicability and limitations of MR tracking of neural stem cells with asymmetric cell division and rapid turnover: The case of the Shiverer dysmyelinated mouse brain. Magnetic Resonance in Medicine. 2007;58:261-9 doi:10.1002/mrm.21280
49. Julke H, Veit C, Ribitsch I, Brehm W, Ludewig E, Delling U. Comparative labelling of equine and ovine multipotent stromal cells with superparamagnetic iron oxide particles for magnetic resonance imaging in vitro. Cell transplantation. 2013 doi:10.3727/096368913X675737
50. Chung TH, Hsiao JK, Hsu SC, Yao M, Chen YC, Wang SW. et al. Iron oxide nanoparticle-induced epidermal growth factor receptor expression in human stem cells for tumor therapy. ACS nano. 2011;5:9807-16 doi:10.1021/nn2033902
51. Choi JI, Cho HT, Jee MK, Kang SK. Core-shell nanoparticle controlled hATSCs neurogenesis for neuropathic pain therapy. Biomaterials. 2013;34:4956-70 doi:10.1016/j.biomaterials.2013.02.037
52. Walczak P, Kedziorek DA, Gilad AA, Barnett BP, Bulte JW. Applicability and limitations of MR tracking of neural stem cells with asymmetric cell division and rapid turnover: the case of the shiverer dysmyelinated mouse brain. Magn Reson Med. 2007;58:261-9 doi:10.1002/mrm.21280
53. Lindvall O, Kokaia Z. Stem cells for the treatment of neurological disorders. Nature. 2006;441:1094-6 doi:10.1038/nature04960
54. Emborg ME, Liu Y, Xi J, Zhang X, Yin Y, Lu J. et al. Induced pluripotent stem cell-derived neural cells survive and mature in the nonhuman primate brain. Cell reports. 2013;3:646-50 doi:10.1016/j.celrep.2013.02.016
55. Harding J, Mirochnitchenko O. Preclinical studies for induced pluripotent stem cell-based therapeutics. J Biol Chem. 2014;289:4585-93 doi:10.1074/jbc.R113.463737
Author contact
![]() Corresponding author: Anthony W. S. Chan, Yerkes National Primate Research Center, Room 2212, Neuroscience Research Building, 954 Gatewood Rd. N.E. Atlanta, GA 30329, USA. E-mail: awchanedu or Hui Mao, Department of Radiology and Imaging Sciences, Emory University School of Medicine, 1364 Clifton Road, N.E., Atlanta, GA 30322, USA. Email: hmaoedu.
Corresponding author: Anthony W. S. Chan, Yerkes National Primate Research Center, Room 2212, Neuroscience Research Building, 954 Gatewood Rd. N.E. Atlanta, GA 30329, USA. E-mail: awchanedu or Hui Mao, Department of Radiology and Imaging Sciences, Emory University School of Medicine, 1364 Clifton Road, N.E., Atlanta, GA 30322, USA. Email: hmaoedu.