Impact Factor
- Issue 14; 2026
- Issue 13; 2026
- Issue 12; 2026
- Issue 11; 2026
- Issue 10; 2026
- Volume 16; 2026
- Advance Articles
- Past Issues
- Cover Images
- Cover Suggestion
- Index & Coverage
- Special Issues
Introduction
Results and Discussion
Materials and Methods
Supplementary Material
Abbreviations
Acknowledgements
References
International Journal of Biological Sciences
International Journal of Medical Sciences
 Global reach, higher impact

Theranostics 2014; 4(4):420-431. doi:10.7150/thno.7265 This issue Cite
Research Paper
Cell Labeling and Tracking Method without Distorted Signals by Phagocytosis of Macrophages
Sun-Woong Kang1,#, Sangmin Lee2,#, Jin Hee Na2, Hwa In Yoon3, Dong-Eun Lee4, Heebeom Koo5, Yong Woo Cho3, Sun Hwa Kim2, Seo Young Jeong6, Ick Chan Kwon2,7, Kuiwon Choi2,*, Kwangmeyung Kim2,* ![]()
1. Next-generation Pharmaceutical Research Center, Korea Institute of Toxicology, Daejeon, Republic of Korea
2. Center for Theragnosis, Biomedical Research Institute, Korea Institute of Science and Technology, Seoul, Republic of Korea
3. Department of Chemical Engineering, Hanyang University, Ansan, Republic of Korea
4. Advanced Radiation Technology Institute, Korea Atomic Energy Research Institute, Jeonbuk, Republic of Korea
5. Wellman Center for Photomedicine, Massachusetts General Hospital, Harvard Medical School, Boston, MA, USA
6. Department of Life and Nanopharmaceutical Science, Kyung Hee University, Seoul, Republic of Korea
7. KU-KIST School, Korea University, Seoul, Republic of Korea
# These authors contributed equally to this work as first authors.
* These authors contributed equally to this work as corresponding authors.
Received 2013-7-26; Accepted 2013-11-7; Published 2014-2-12
Abstract
Cell labeling and tracking are important processes in understanding biologic mechanisms and the therapeutic effect of inoculated cells in vivo. Numerous attempts have been made to label and track inoculated cells in vivo; however, these methods have limitations as a result of their biological effects, including secondary phagocytosis of macrophages and genetic modification. Here, we investigated a new cell labeling and tracking strategy based on metabolic glycoengineering and bioorthogonal click chemistry. We first treated cells with tetra-acetylated N-azidoacetyl-D-mannosamine to generate unnatural sialic acids with azide groups on the surface of the target cells. The azide-labeled cells were then transplanted to mouse liver, and dibenzyl cyclooctyne-conjugated Cy5 (DBCO-Cy5) was intravenously injected into mice to chemically bind with the azide groups on the surface of the target cells in vivo for target cell visualization. Unnatural sialic acids with azide groups could be artificially induced on the surface of target cells by glycoengineering. We then tracked the azide groups on the surface of the cells by DBCO-Cy5 in vivo using bioorthogonal click chemistry. Importantly, labeling efficacy was enhanced and false signals by phagocytosis of macrophages were reduced. This strategy will be highly useful for cell labeling and tracking.
Keywords: cell labeling, cell tracking, metabolic glycoengineering, click chemistry, chemical reporter.
Introduction
Cell labeling and tracking are important processes in understanding biologic mechanisms and the therapeutic effect of inoculated cells in vivo. Cell labeling and tracking can be used to distinguish transplanted cells from host cells, monitor distribution and migration after transplantation, and evaluate functional effects of the transplanted cells. Indeed, numerous approaches have been developed for the visualization of cells of interest in vivo [1-10]. Typical labeling and tracking methods are used to label target cells directly or indirectly [2, 5]. For direct labeling and tracking, various agents, including fluorescent probes, super-paramagnetic iron oxide, and radiotracers, have been utilized [1-10]. Basically, the target cells are labeled with these probes prior to transplantation, and are visualized with suitable imaging equipment. Although these probes enable easy visualization of transplanted cells in vivo, cell tracking has significant limitations by biological effects [10, 11]. Dead cells and released imaging probes may be secondarily phagocytized by host macrophages [11]. Thus, it is not clear whether the imaging signal comes from targeted cells or from macrophages. In order to overcome the disadvantage of direct labeling, genetic modifications have been used as an indirect labeling and tracking method for the expression of extrinsic genes [12-15]. However, genetic modifications using nonviral and viral systems have disadvantages, such as difficulties in controlling gene expression and the possibility of tumor formation [16, 17]. Therefore, devising an appropriate labeling and tracking method that can overcome these limitations is critical for understanding biologic mechanisms and therapeutic effects in vivo.
Mounting evidence has shown that glycan metabolic labeling can be visualized by chemical ligation with a fluorescent probe, as the glycan metabolic labeling can outfit living cells with a bioorthogonal chemical reporter for cellular imaging [18-22]. In particular, unnatural analogs of N-acetyl mannosamine is metabolized by cultured cells and converted to azido sialic acid on the surface of various cells without any apparent physiological harm [23]. Azide groups on the cell surface have been treated with dibenzyl cyclooctyne (DBCO)-labeled fluorescent probes for cellular imaging [20, 22, 24]; however, these studies were not focused on the tracking of specific cells in vivo. In fact, no studies have demonstrated this reaction for tracking of specific cells in vivo. When applied in cell labeling and tracking, this method can overcome the limitations by biological effects because a reaction is not normally found in biological systems. In addition, this reaction is rapid, selective, and produces high yields. Thus, this may result in low background and high sensitivity without signal transfer and difficulties in controlling extrinsic gene expression when used for the detection of specific cells in vivo.
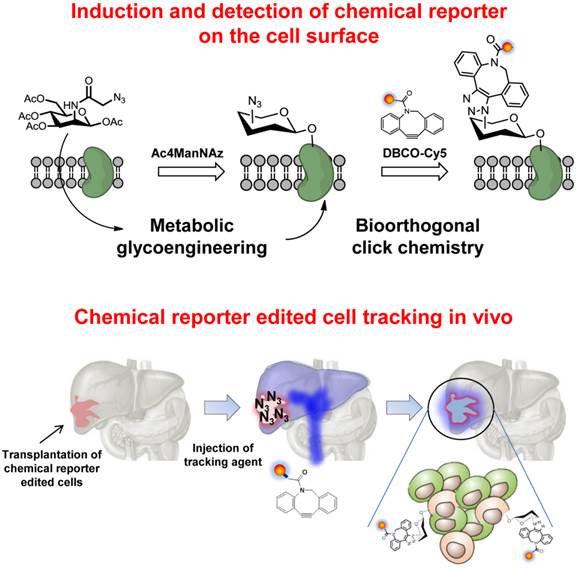
To that end, we introduce a new in vivo tracking strategy of target cells via bioorthogonal chemical reporters (Scheme 1/Figure A). We first treated cells with tetra-acetylated N-azidoacetyl-D-mannosamine (Ac4ManNAz) to generate unnatural sialic acids with azide groups on the surface of the target cells. The azide-labeled cells were then transplanted to the liver of mouse, and DBCO-conjugated Cy5 (DBCO-Cy5) was intravenously injected into mice to chemically bind with the azide groups on the surface of the target cells in vivo for visualization of the target cells.
(Scheme 1) Schematic illustration of cell labeling and tracking via bioorthogonal chemical reporters.
Results and Discussion
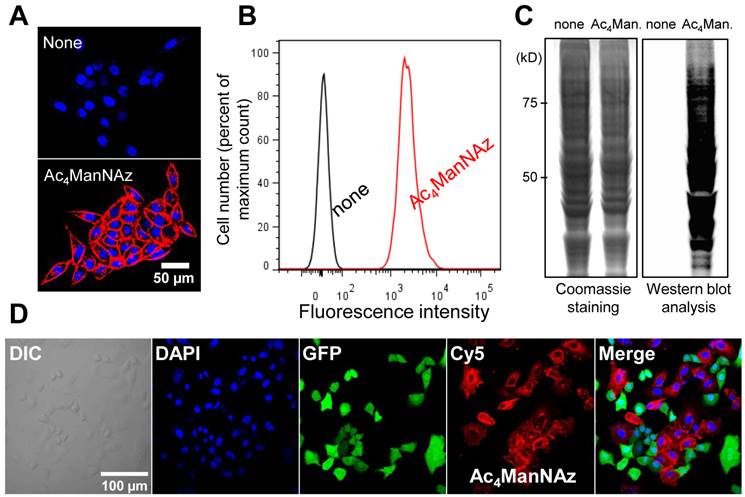
To generate azide groups on the surface of the target cells (A549 cells), cells were treated with Ac4ManNAz, which readily results in unnatural sialic acids on the cell surface [25-28]. Generation of the azide groups on the targeted cell surface was determined by successful binding with DBCO-Cy5. After treatment with DBCO-Cy5, cells treated with Ac4ManNAz were stained with Cy5 and showed higher fluorescence intensity than that of untreated cells (Figure 1A and B). Coomassie blue staining and western blot analysis also revealed the generation of azide groups on target cells after treatment with Ac4ManNAz (Figure 1C). We also performed azide group labeling by treatment with Ac4ManNAz on various cell types (KB, A549, U87MG, MCF-7, MDA-MB-468, and MDA-MB-436). As expected, the azide groups were generated on all cell types by glycan metabolic engineering, which could bind with DBCO-Cy5. All cell types treated with Ac4ManNAz were positive for Cy5 after treatment with DBCO-Cy5 (Supplementary Material: Figure S1). Azide groups formed on the cell surface can be shed from cell surfaces and endocytosed or recycled by neighboring cells. Thus, to verify that a majority of the glycan signal remains localized to the A549 cells, independent labeling using GFP-labeled A549 cells was performed. In co-culture with GFP-labeled A549 and N3-labeled A549 cells, N3-labeled A549 cells were stained with Cy5 and GFP-labeled A549 cells were not stained with Cy5 after treatment of DBCO-Cy5 (Figure 1D). These results indicate that azide groups were successfully formed on the surface of the target cells. The azide-labeled cells by glycan metabolic engineering would provide a new targeting characteristic using bioorthogonal click chemistry.
Introduction of unnatural sialic acids with azide groups on the cell surface. (A) Visualization of azide groups on the surface of tetra-acetylated N-azidoacetyl-D-mannosamine (Ac4ManNAz)-treated cells (n = 5). (B) Flow cytometry analysis of (A) (n = 3). (C) Coomassie staining and western blot analysis of Ac4ManNAz-treated cells showing the amount of total proteins and generated azide groups (n = 5). (D) Visualization of azide groups on the cell surface in co-culture of azide labeled cells and azide-unlabeled cells (GFP-positive A549 cells). The scale bars indicate 50 µm in A and 100 µm in D.
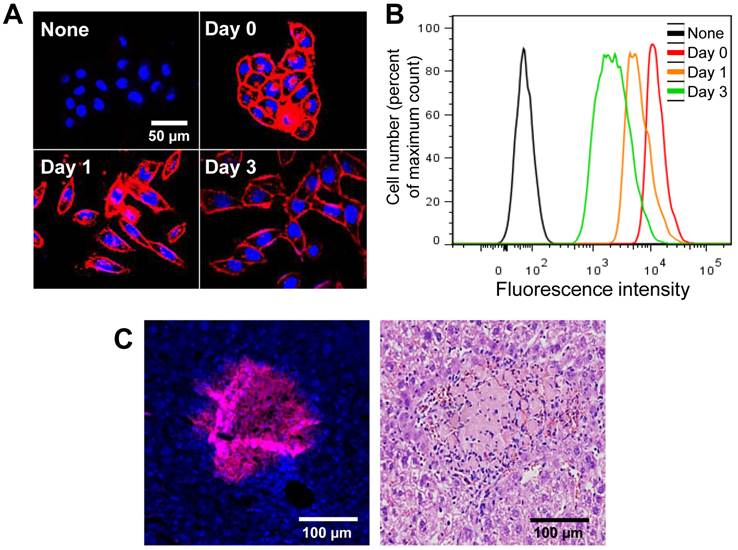
The azide groups on the cell surface were retained for 3 days in vitro. N3-labeled cells were reacted immediately with DBCO-Cy5 at each time point. After treatment with DBCO-Cy5, N3-labeled cells were stained with Cy5 and showed higher fluorescence intensity than that of untreated cells (Figure 2A and B). In addition, the azide groups on the cell surface were also retained in vivo for 3 days after transplantation (Figure 2C). These results indicate that artificially introduced azide groups on the cell surface can be targeted by DBCO-Cy5 for more than 3 days after treatment with Ac4ManNAz.
Visualization of retained azide groups on the cell surface in vitro and in vivo. (A) Visualization of retained azide groups on the cell surface in vitro (n = 5). (B) Flow cytometry analysis of (A) (n = 3). (C) Visualization of retained azide groups on the cell surface in vivo. The scale bars indicate 50 µm in A and 100 µm in C.
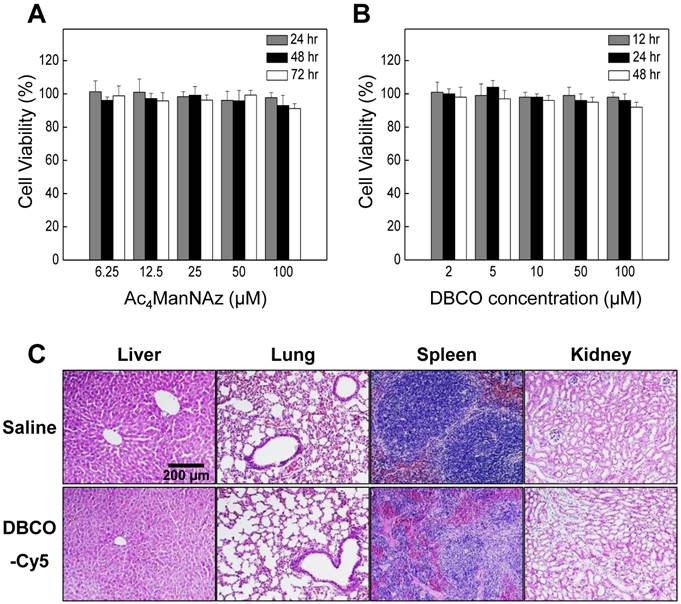
In this study, we used Ac4ManNAz to induce azide groups on the cell surface and DBCO to target unnatural azide groups on the surface of cells because of its high reactivity and low toxicity [22, 29-32]. Recent reports have revealed that these reactions rapidly proceed in aqueous media at biocompatible pH and temperature and can be applied to live cells and organs in vivo [33]. Ideal labeling and tracking method should be non-cytotoxic and not have harmful effects on other cellular function. In this study, Ac4ManNAz showed low cytotoxicity at various concentrations for A549 cells (Figure 3A). In addition, the cytotoxicity of DBCO, as measured with MTT assay, was not increased at high concentration (100 µM) over culture time (Figure 3B). For systemic toxicity of DBCO, the DBCO (25 µM, 200 µL) was injected into tail vein of the normal mice. To evaluate systemic toxicity of DBCO injection, survival rate and behavioral changes were carefully monitored in the mice. All mice (n = 5) were survived after one day and any particular behavioral abnormalities were not noticed in any mouse treated with DBCO and control group. In the histologic examination, discernible hemorrhage, infarction, or wide range of apoptosis was not observed in any of the visceral organs including kidney, liver, spleen, and lung of DBCO treated mice (Figure 3C). Taken together, no apparent symptoms and histological lesions for severe systemic toxicity of DBCO were appeared in the mice.
Cytotoxicity of Ac4ManNAz and dibenzyl cyclooctyne (DBCO). (A) Cytotoxicity of Ac4ManNAz at various concentrations for 72 hours in vitro. (B) Cytotoxicity of DBCO at various concentrations for 48 hours in vitro. (C) Hematoxylin and eosin (H&E) staining of liver, lung, spleen, and kidney for systemic toxicity of DBCO in vivo. The experiment is expressed as mean ± SD. Data shown are representative three independent experiments.
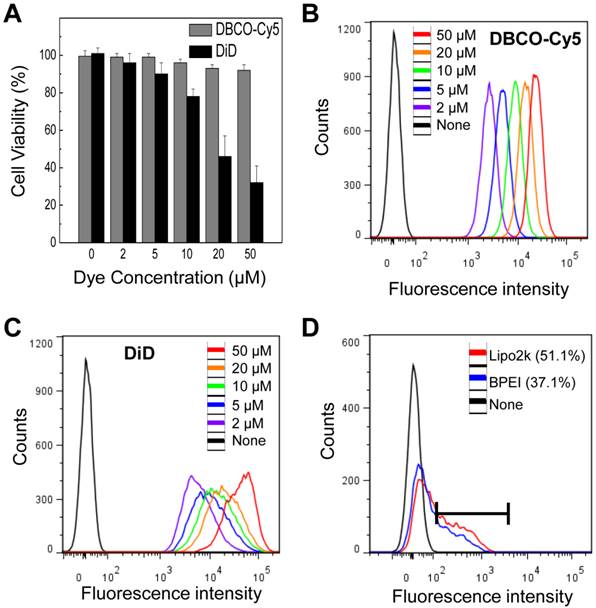
Compared to traditional direct and indirect tracking methods, our strategy has several advantages. First, our system is more consistent and effective than that of the traditional direct and indirect labeling method. We selected DiD labeling as a control for traditional direct labeling method because DiD labeling have proven effective for in vitro cell labeling with optical imaging and they bind to the cell membrane, like an our system. Both types labeling showed higher florescence intensity than that of untreated cells (Figure 4B and C). However, DiD showed higher cytotoxicity than DBCO at various concentrations (Figure 4A). Labeling efficacy of our system was also compared with genetic modification using enhanced green fluorescence protein (EGFP) gene transfection by lipofectamineTM2000 (Lipo2k) and branched polyethylenimine (BPEI) to avoid the potential risks associated with a viral vector as an indirect labeling method. EGFP gene transfection resulted in 51.1 and 37.1% EGFP expression (Figure 4D). In contrast, our system showed 100% label efficacy. The efficiency of indirect label methods using genetic modification is highly variable depending on the availability of specialized equipment and the skills of the technicians. In addition, the amount of bound DBCO-Cy5 on the cell surface increased with DBCO-Cy5 concentration (Figure 4B), indicating that the degree of labeling can be controlled by changing the concentration of DBCO-Cy5 in a dose-dependent manner.
(A) Cytotoxicity of DBCO and DiD at various concentrations in vitro. (B) Flow cytometry data of DBCO-Cy5 concentration-dependent binding to N3-labeled cells. (C) Flow cytometry data of DiD labeled cells at various concentration of DiD. (D) Flow cytometry data of transfected cells using lipofectamine and BPEI. For all experiments, data shown are representative of three independent experiments.
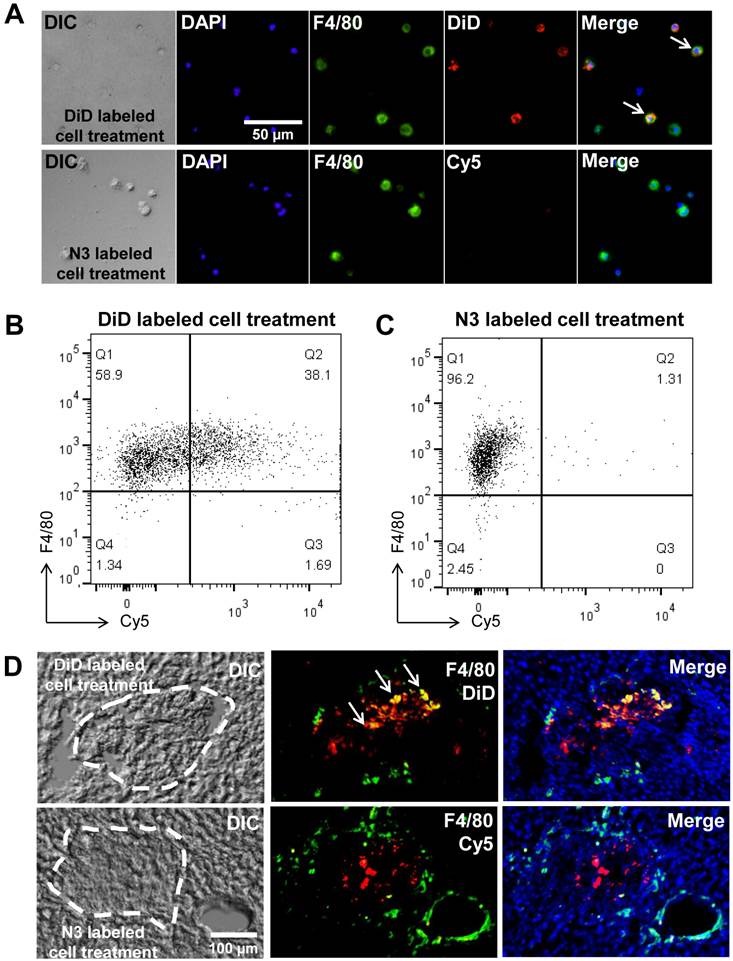
Second, our system may reduce distorted signals by phagocytosis of host macrophages in vivo. To examine distorted signals, we used a co-culture system. Prior to co-culture, apoptosis of target cells was induced with staurosporine [34-36] this was followed by culturing apoptotic cells with macrophages. After co-culture, macrophages were treated with DBCO-Cy5 to determine the generation of azide groups by phagocytosis of apoptotic cells. As the control group, target cells were fluorescently labeled with a direct label agent (DiD) prior to the induction of apoptosis. For detection of macrophages, macrophages were stained for F4/80, a macrophage-specific marker. As expected, macrophages were negative for DBCO-Cy5. In contrast, 38% of macrophages were positive for the DiD label in the control group (Figure 5A, B and C). In addition, we showed staining of macrophages directly in the liver section to determine false positive signals by macrophages (Figure 5D). For detection of macrophages in the liver section, macrophages were stained for F4/80 after treatment of DBCO-Cy5. As expected, macrophages were negative for DBCO-Cy5 in N3-labeled A549 treatment group. In contrast, positive macrophages for DiD were found in DiD-labeled A549 treatment group. These results indicate that macrophages do not generate azide groups after phagocytosis of target cells with acquired azide groups. Thus, macrophages may not produce false signals in vivo after phagocytosis of target cells.
False positive signals by macrophages in vitro and in vivo. (A) Visualization of co-cultured macrophages with DiD-labeled or N3-labeled cells (n = 5). (B) Flow cytometry data of co-cultured macrophages with DiD-labeled cells (n = 3). (C) Flow cytometry data of co-cultured macrophages with N3-labeled cells (n = 3). (D) F4/80 staining of liver sections for macrophages after transplantation of DiD-labeled or N3-labeled cells in the liver (n = 3). The scale bars indicate 50 µm in A and 100 µm in D.
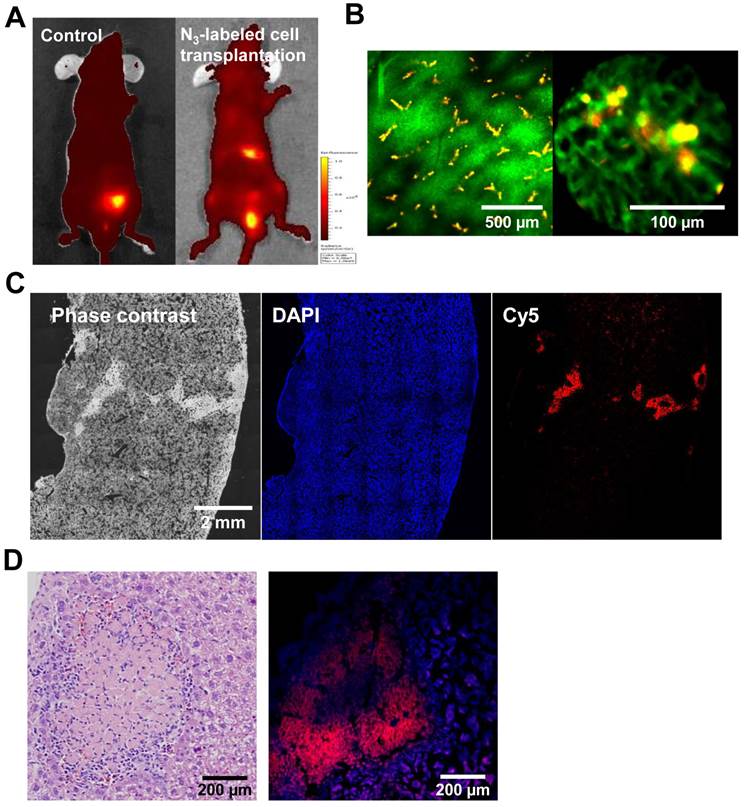
To provide an assessment of the functional competence of cell tracking in vivo, we tracked transplanted cells in live mice, using an in vivo imaging system (IVIS) and the IV100 fluorescence imaging system, which has a wide range of applications, such as cell tracking. For in vivo tracking, the target cells were transplanted in the liver immediately after treatment with Ac4ManNAz for 3 days. For comparison, transplanted untreated cells served as the control. Three days after transplantation, DBCO-Cy5 was intravenously injected via the tail vein prior to tracking in vivo. Four hours after injection with DBCO-Cy5, a considerable fluorescence signal was detected in the liver from the azide-labeled cells and in the bladder. In contrast, whole body fluorescence imaging using IVIS indicated that DBCO-Cy5 did not affect the liver with azide-unlabeled cells (Figure 6A). The intravenously injected DBCO may chemically bind with the azide groups on the surface of the target cells in vivo. In addition, unreacted DBCO was predominantly excreted through the renal route within 4 h post injection and so the cell-expressing azide groups showed higher fluorescence intensity in the liver compared to liver with untreated cells or normal surrounding tissue. The distribution of transplanted cells in the liver was further evaluated by fluorescent image using IV100. The blood vessels were visualized with dextran-fluorescein isothiocyanate (FITC) through intravenous injection. The target cell-acquired azide groups were observed to surround a blood vessel, and the shape of target cells was similar to attached cells in culture (Figure 6B). Histology confirmed the presence of the target cells in the liver and showed that these areas contained both target cells and host liver cells. The target cell colonies were macroscopically distinguishable from the host liver cells as red-colored regions (Figure 6C and D).
Tracking of azide-labeled cells in the liver of mice. (A) Whole body images of mice after intravenous injection of DBCO-Cy5 (n = 8 per group). (B) IV100 images of liver after intravenous injection of DBCO-Cy5. The scale bars indicate 500 and 100 µm. (C) Histological staining of liver after intravenous injection of DBCO-Cy5. The scale bar indicates 2 mm. (D) hematoxylin and eosin staining and fluorescence image of liver after intravenous injection of DBCO-Cy5. The scale bar indicates 200 µm.
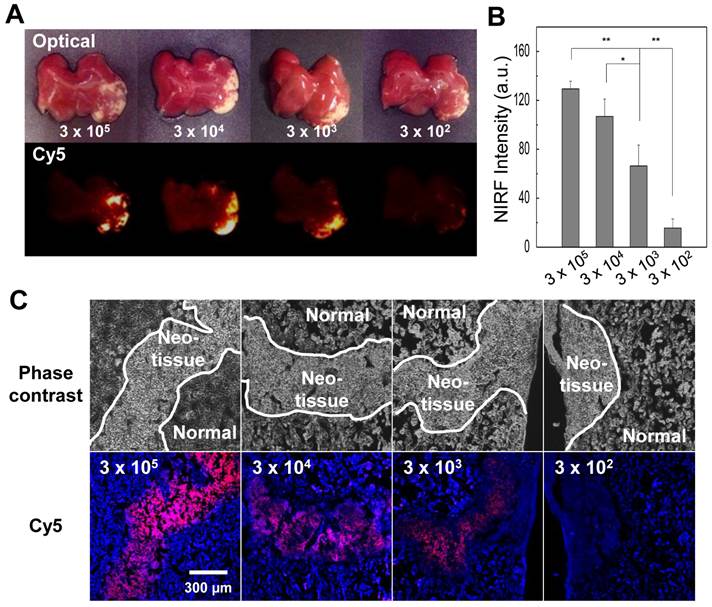
We also evaluated the sensitivity of optical imaging of azide-labeled cells in the liver. The azide-labeled cells (3×10⁵, 3×10⁴, 3×10³, and 3×10² cells) were mixed with unlabeled cells (total cell number 3×10⁵ cells) and injected in the liver. Four hours post injection of DBCO-Cy5, livers were dissected, and each sample was analyzed in a Kodak imaging box. Histology confirmed the presence of target cells in the liver and demonstrated that at least 3×10³ cells would be required for clear visualization of target cells in tissue (Figure 7). Single-cell sensitivity is important in stem cell and cancer biology field because the migration pattern of target cells is not clear after local injection and migration of cells to distant organs could affect therapeutics. Therefore, these results highlight the need for further optimization of imaging parameters to detect single cell in vivo.
Ex vivo liver tissue analysis for the sensitivity of optical imaging to cells with acquired azide groups (n = 5 per group). (A) Gross view and fluorescence images of liver injected with various cell concentrations. (B) The quantification data of (A). (C) Histological staining of liver injected with various cell concentrations. The scale bar indicates 300 µm. Symbol ** and * indicate differences at the p < 0.01 and < 0.05 significance levels, respectively (analyzed using one-way ANOVA).
In this study, cell labeling and tracking method relies on the introduction of an unnatural azide groups on the cell surface. The azide labeling on the cell surface can readily be overexpressed by addition of the sugar analogs to the culture medium. Thus, we were concerned that this strategy could result in change of biological responses of azide-labeled cells, including metabolism, proliferation, and migration. In this study, treatment of Ac4ManNAz did not affect viability of cells. However, several studies reported that sialic acid can influence the adhesive properties of the cell surface [37]. In addition, sialic acid can alter cell/cell interaction and migration [38-40]. To investigate this, experiments for change of biological responses in azide-labeled cells by metabolic glycoengineering need to be performed in additional studies. Long-term in vivo investigation on change of biological responses would be necessary to determine the clinical potential of this method.
In conclusion, the overall results successfully demonstrated the potential of a new cell labeling and tracking strategy based on metabolic glycoengineering and bioorthogonal click chemistry. Unnatural sialic acids with azide groups could be artificially induced on the surface of target cells by glycoengineering and then effectively tracked by DBCO-Cy5 in vivo using bioorthogonal click chemistry. Importantly, labeling efficacy was enhanced and false signals were reduced. This strategy will be highly useful for cell labeling and tracking.
Materials and Methods
Cell culture
Human lung adenocarcinoma cells (A549), human nasopharyngeal carcinoma cells (KB), human glioblastoma cells (U87MG), human mammary carcinoma cells (MCF-7), and human breast adenocarcinoma cells (MDA-MB-436, MDA-MB-468) were purchased from the American Type Culture Collection (ATCC, Manassas, VA, USA), maintained in RPMI 1640 (Welgene, Daegu, Korea) containing 10% fetal bovine serum (FBS; Welgene, Daegu, Korea) and 100 µg/mL streptomycin and 100 U/mL penicillin (Welgene, Daegu, Korea) in a humidified 5% CO2 atmosphere at 37 °C.
Western blot analysis
A549 cells were seeded onto 100×20 mm cell culture plates at a density of 2×10⁶ cells per plate in 10 mL of media with no sugar or Ac4ManNAz (50 µM) (Invitrogen, Carlsbad, CA, USA). After incubation for 3 days, the cells were washed twice with DPBS (pH 7.4) and harvested from the plates with a cell scraper. They were pelleted by centrifugation at 3,000×g for 5 min, and the cell pellets were resuspended in 500 µL of lysis buffer (1% SDS, 100 mM Tris-HCl, pH 7.4) containing protease inhibitor cocktail (Complete, EDTA-free, Roche, NSW, Australia) and lysed with a probe-type sonifier at 4 °C. Sonicated lysates were incubated at 4 °C for 30 min to further solubilize proteins. The insoluble debris was removed by centrifugation for 10 min at 3,000×g. Final soluble protein concentrations were determined by bicinchoninic acid protein assay (Pierce, Rockford, IL, USA) to be 5 mg/mL. Then, 20 µL of the lysate (5 mg/mL protein) was incubated with phosphine-PEG3-biotin (2 µL, 5 mM in DPBS) (Pierce) for 6 h at 37 oC. Loading buffer was added to each sample, and samples were loaded onto 10% SPS-PAGE gel after heating at 95 oC. Proteins were transferred to Hybond P membrane (Amercham, St. Albans, UK), and the membrane was blocked with 5% bovine serum albumin in TBST (50 mM Tris-HCl, 150 mM NaCl, 0.1% Tween 20, pH 7.4) for 2 h. The membrane was then incubated with streptavidin-horseradish peroxidase (diluted 1:2,000 in TBST) (Pierce) overnight at 4 oC. The membrane was rinsed three times with TBST and developed by using ECL Western Blotting Substrate (Pierce).
Cellular imaging to determine the generated azide groups
A549 cells were seeded onto 35-mm glass-bottom dishes at a density of 3×10⁴ cells in 2 mL of growth media with Ac4ManNAz (50 µM, final concentration). After incubation for 3 days, the cells were washed twice with DPBS (pH 7.4) and incubated with DBCO-Cy5 (20 µM, final concentration) (Click Chemistry Tools, Scottsdale, AZ, USA) for 1 h at 37 oC. Cells were then rinsed with DPBS (pH 7.4) and fixed with formaldehyde-glutaraldehyde combined fixative for 15 min at room temperature. After fixation, the cells were washed twice with DPBS (pH 7.4) and stained with DAPI (Invitrogen, Carlsbad, CA, USA) to label nuclei. All cellular images were obtained using a FluoView FV1000 confocal laser scanning microscope (Olympus, Tokyo, Japan) equipped with a 405 diode (405 nm) and HeNe-Red (633 nm) lasers. The same method was used in the case of KB, U87MG, MCF-7, MDA-MB-468, and MDA-MB-436 cells.
To verify that a majority of the glycan signal remains localized to the A549 cells, N3-labeled cells were co-cultured with GFP-expressing A549 cells (non N3 labeled cells). Prior to co-culture, non GFP-expressing A549 cells were treated with Ac4ManNAz (50 µM, final concentration) to induce azide groups on the cell surface for 3 days. Then, GFP-expressing A549 cells were co-cultured with N3-labeled A549 cells for 1 day. After that, co-cultured cells were reacted with DBCO-Cy5 for cellular imaging.
The azide retention evaluation was performed for 3 days in vitro and in vivo. For retention evaluation of the azide on the cell surface in vitro, N3-labelled cells were reacted immediately with DBCO-Cy5 before flow cytometry analysis and imaging at each time point (0, 1, and 3 day). To examine retention of azide groups for 3 days in vivo, N3-labeled cells were directly injected into the left lobe of the liver. Three days after injection, the liver was retrieved and embedded in OCT tissue compound for frozen section of liver tissue. Tissue sections were directly reacted with DBCO-Cy5 for 1 h at 37 oC. The section reacted with DBCO-Cy5 was washed three times with DPBS (pH 7.4). Fluorescence images were observed using IX81-ZDC focus drift compensating microscope (Olympus, Tokyo, Japan).
Flow cytometry analysis to determine the generated azide groups
A549 cells were seeded onto six-well plates at a density of 2×10⁴ cells per well in 2 mL of media with Ac4ManNAz (50 µM final concentration) and treated with DBCO-Cy5, as described above. Cells were then lifted with DPBS (pH 7.4) containing 2% FBS and 1 mM EDTA (FACS buffer) and washed twice in FACS buffer. Ten thousand cells per sample were analyzed by flow cytometry (BD FACSVerse; BD Biosciences, San Jose, CA, USA), and subsequent data analysis was done using FlowJo software (TreeStar, San Carlos, CA, USA). To prove a DBCO-Cy5 concentration-dependent labeling effect, various concentrations of DBCO-Cy5 (0 to 50 µM) were tested under similar conditions. A549 cells, fluorescently labeled according to the manufacturer's protocol using DiD dye (Invitrogen) were used as controls.
Cell viability assay
To measure cell viability, A549 cells were seeded on 96-well plates (5×10³ cells/well) and incubated for 1 day. Cells were incubated with various concentrations of Ac4MAnNAz or DBCO-Cy5 (0 to 100 µM) for 3 days at 37 °C. Cell Counting Kit-8 solution (10 µL) (Dojindo Molecular Technologies Inc., Kumamoto, Japan) was then added to each well. After further incubation for 2 h at 37 °C, the absorbance of each well was measured at 450 nm using a microplate reader (VERSAmaxTM, Molecular Devices Corp., Sunnyvale, CA, USA).
To measure cell viability, A549 cells were seeded on 96-well plates (5×10³ cells/well) and incubated with DBCO-Cy5 or DiD dye (0 to 50 µM) for 1 day. Afterwards, 25 µL of MTT in serum-free RPMI1640 media (0.5 mg/mL) was added to each well. After incubation for 4 h at 37 °C, the media was removed and cells were dissolved in 200 µL of DMSO. Then, the absorbance of each well was measured at 560 nm using a microplate reader (VERSAmaxTM, Molecular Devices Corp., Sunnyvale, CA, USA).
Flow cytometry analysis to examine labeling efficacy of genetic modification
The GFP-encoding plasmid DNA (pCMV-EGFP) (Clontech Laboratories Inc., Palo Alto, CA, USA) complex with Lipo2k (Invitrogen) was prepared according to the manufacturer's protocol. BPEI (25 kDa) were prepared at the N/P ratio of 20/1. A549 cells were seeded onto six-well plates at a density of 5×10⁵ cells per well in 2 mL of serum-free media and grown to reach 60-80% confluence. The culture medium was replaced with 2 mL of the transfection medium containing the Lipo2k or BPEI complex, followed by 6 h incubation at 37 °C. Then, the transfection medium was replaced with fresh complete RPMI 1640 (10% FBS), and the cells were allowed to grow for 48 h. After incubation, the cells were washed twice with DPBS (pH 7.4), and flow cytometry analysis was performed by the same method as described above.
Peritoneal macrophage isolation
Peritoneal macrophages were isolated by peritoneal lavage with DPBS from 6-weak-old male athymic nude mice (20 g, Orient, Seoul, Korea). Contaminating erythrocytes, granulocytes, and dead cells were removed from the lavage media by density gradient centrifugation for 20 min at 800×g. Purified peritoneal macrophages were washed three times and cultured in RPMI 1640 containing 10% FBS.
Co-culture system to examine distorted signals
Prior to co-culture, apoptosis of A549 cell-acquired azide groups was induced by incubation with staurosporine at 5 µM for 24 h [34-36]. Peritoneal macrophages were seeded onto 35-mm glass-bottom dishes or six-well plates at a density of 1×10⁶ cells in 2 mL of media and incubated for 24 h. Macrophages were then incubated with apoptotic cells for up to 2 h at 37 °C. After incubation, macrophages were washed twice with DPBS (pH 7.4) and stained with FITC-F4/80 monoclonal antibody (Abcam, Cambridge, UK). A549 cells, fluorescently labeled according to the manufacturer's protocol using DiD dye (Invitrogen) prior to the induction of apoptosis, were used as controls. Cellular imaging and flow cytometry analysis were performed by the same methods as described above.
In vivo/ex vivo imaging
All experiments with live animals were performed in compliance with the relevant laws and institutional guidelines of the Korea Institute of Science and Technology, and institutional committees approved the experiments. Six-week-old male, athymic, nude mice were anesthetized with ketamine (80 mg/kg body weight) and xylazine (10 mg/kg body weight) by intraperitoneal injection, and laparotomy was performed with direct injection of A549 cells, after treatment with Ac4ManNAz for 3 days, into the left lobe of the liver. Three days post injection of cells into the liver, DBCO-Cy5 (25 µM, 200 µL) was injected by tail vein (n=3 per each group), and in vivo and ex vivo near-infrared fluorescence (NIRF) images were obtained with the IVIS-spectrum system (Perkin Elmer, Waltham, MA, USA) and KODAK Image Station 4000 MM (KODAK , New Haven, CT, USA), respectively.
Intravital imaging of the liver tissue
Intravital real-time images of liver tissues were obtained using an Olympus IV100 Intravital Laser Scanning Microscope (Olympus) equipped with an Argon laser (488 nm) and a red helium-neon (HeNe-Red) laser (633 nm). Immediately before the intravital liver imaging, the animal was anesthetized (2% isoflurane in 2 L/min O2). The liver tissue was exposed by making an incision in the skin at the liver site. This was followed by intravenous injection of FITC-labeled dextran (10 mg/kg) to visualize the liver vasculature and then DBCO-Cy5 (25 µM, 200 µL) to observe their traces in the target cell-acquired azide groups.
Histological analysis
The retrieved liver tissues were fixed in 4% (volume/volume) buffered paraformaldehyde solution and embedded in OCT tissue compound (Sakura, Tokyo, Japan). They were then frozen in a dry ice bath, cut on a cryostat (6 μm in thickness), picked up on slides with poly-D-lysine, and dried at 45 °C under light protection. Fluorescence images were obtained using a FluoView FV10i confocal scanning microscope (Olympus) equipped with a water-immersion objective lens (UplanSApo 60×/NA=1.2) and a diode laser. The excitation wavelength was 405 nm (17.1 mW) for the DAPI stain and 635 nm (9.5 mW) for the DBCO-Cy5. One day after injection of DBCO-Cy5, the organs of DBCO-Cy5-injected mice, including the liver, lung, spleen, and kidneys were also harvested and examined histologically to determine cytotoxicity of DBCO-Cy5 to the distant organs. The sliced tissues (6 μm) were stained with hematoxylin and eosin and observed with a light microscope (BX51; Olympus). Images were photographed on a digital camera photomicroscope (DP71; Olympus). To examine distorted signals, the sliced liver tissues (6 μm) were stained with FITC-F4/80 monoclonal antibody (Abcam, Cambridge, UK). Fluorescence images were observed using IX81-ZDC focus drift compensating microscope (Olympus, Tokyo, Japan).
Supplementary Material
Figure S1.
Abbreviations
Ac4ManNAz: tetra-acetylated N-azidoacetyl-D-mannosamine; DBCO: dibenzyl cyclooctyne; EGFP: enhanced green fluorescence protein; FITC: fluorescein isocyanate; HeNe-Red: red helium-neon; Lipo2k: LipofectamineTM 2000; BPEI: branched polyethylenimine.
Acknowledgements
This work was supported by the Fusion Technology Project (2010-50201), M.D.-Ph.D. Program (2010-0019864), and Global Research Laboratory through the National Research Foundation of Korea (NRF) funded by the Ministry of Science, ICT (Information and Communication Technologies) and Future Planning and Intramural Research Program (KIST Young Fellow) of KIST.
Competing Interests
The authors have declared that no competing interest exists.
References
1. Schormann W, Hammersen FJ, Brulport M, Hermes M, Bauer A, Rudolph C. et al. Tracking of human cells in mice. Histochemistry and cell biology. 2008;130:329-38
2. Hong H, Yang Y, Zhang Y, Cai W. Non-invasive cell tracking in cancer and cancer therapy. Current topics in medicinal chemistry. 2010;10:1237-48
3. Tennstaedt A, Aswendt M, Adamczak J, Hoehn M. Noninvasive multimodal imaging of stem cell transplants in the brain using bioluminescence imaging and magnetic resonance imaging. Methods in molecular biology. 2013;1052:1-14
4. Srinivas M, Boehm-Sturm P, Figdor CG, de Vries IJ, Hoehn M. Labeling cells for in vivo tracking using (19)F MRI. Biomaterials. 2012;33:8830-40
5. Kircher MF, Gambhir SS, Grimm J. Noninvasive cell-tracking methods. Nature reviews Clinical oncology. 2011;8:677-88
6. Li Y, Yao Y, Sheng Z, Yang Y, Ma G. Dual-modal tracking of transplanted mesenchymal stem cells after myocardial infarction. International journal of nanomedicine. 2011;6:815-23
7. Arthurs OJ, Gallagher FA. Functional and molecular imaging with MRI: potential applications in paediatric radiology. Pediatric radiology. 2011;41:185-98
8. Huang H, Xie Q, Kang M, Zhang B, Zhang H, Chen J. et al. Labeling transplanted mice islet with polyvinylpyrrolidone coated superparamagnetic iron oxide nanoparticles for in vivo detection by magnetic resonance imaging. Nanotechnology. 2009;20:365101
9. Kim BY, Jiang W, Oreopoulos J, Yip CM, Rutka JT, Chan WC. Biodegradable quantum dot nanocomposites enable live cell labeling and imaging of cytoplasmic targets. Nano letters. 2008;8:3887-92
10. Sutton EJ, Henning TD, Pichler BJ, Bremer C, Daldrup-Link HE. Cell tracking with optical imaging. European radiology. 2008;18:2021-32
11. Silva AK, Wilhelm C, Kolosnjaj-Tabi J, Luciani N, Gazeau F. Cellular transfer of magnetic nanoparticles via cell microvesicles: impact on cell tracking by magnetic resonance imaging. Pharmaceutical research. 2012;29:1392-403
12. Blasberg RG, Gelovani J. Molecular-genetic imaging: a nuclear medicine-based perspective. Molecular imaging. 2002;1:280-300
13. Ponomarev V, Doubrovin M, Serganova I, Vider J, Shavrin A, Beresten T. et al. A novel triple-modality reporter gene for whole-body fluorescent, bioluminescent, and nuclear noninvasive imaging. European journal of nuclear medicine and molecular imaging. 2004;31:740-51
14. Tannous BA, Grimm J, Perry KF, Chen JW, Weissleder R, Breakefield XO. Metabolic biotinylation of cell surface receptors for in vivo imaging. Nature methods. 2006;3:391-6
15. Weissleder R, Moore A, Mahmood U, Bhorade R, Benveniste H, Chiocca EA. et al. In vivo magnetic resonance imaging of transgene expression. Nature medicine. 2000;6:351-5
16. Ensenat-Waser R, Santana A, Vicente-Salar N, Cigudosa JC, Roche E, Soria B. et al. Isolation and characterization of residual undifferentiated mouse embryonic stem cells from embryoid body cultures by fluorescence tracking. In vitro cellular & developmental biology Animal. 2006;42:115-23
17. Behfar A, Perez-Terzic C, Faustino RS, Arrell DK, Hodgson DM, Yamada S. et al. Cardiopoietic programming of embryonic stem cells for tumor-free heart repair. The Journal of experimental medicine. 2007;204:405-20
18. Dumont A, Malleron A, Awwad M, Dukan S, Vauzeilles B. Click-mediated labeling of bacterial membranes through metabolic modification of the lipopolysaccharide inner core. Angewandte Chemie. 2012;51:3143-6
19. Dehnert KW, Beahm BJ, Huynh TT, Baskin JM, Laughlin ST, Wang W. et al. Metabolic labeling of fucosylated glycans in developing zebrafish. ACS chemical biology. 2011;6:547-52
20. Hong V, Steinmetz NF, Manchester M, Finn MG. Labeling live cells by copper-catalyzed alkyne--azide click chemistry. Bioconjugate chemistry. 2010;21:1912-6
21. Hsu TL, Hanson SR, Kishikawa K, Wang SK, Sawa M, Wong CH. Alkynyl sugar analogs for the labeling and visualization of glycoconjugates in cells. Proceedings of the National Academy of Sciences of the United States of America. 2007;104:2614-9
22. Ning X, Guo J, Wolfert MA, Boons GJ. Visualizing metabolically labeled glycoconjugates of living cells by copper-free and fast huisgen cycloadditions. Angewandte Chemie. 2008;47:2253-5
23. Hart C, Chase LG, Hajivandi M, Agnew B. Metabolic labeling and click chemistry detection of glycoprotein markers of mesenchymal stem cell differentiation. Methods in molecular biology. 2011;698:459-84
24. Koo H, Lee S, Na JH, Kim SH, Hahn SK, Choi K. et al. Bioorthogonal copper-free click chemistry in vivo for tumor-targeted delivery of nanoparticles. Angewandte Chemie. 2012;51:11836-40
25. Prescher JA, Bertozzi CR. Chemistry in living systems. Nature chemical biology. 2005;1:13-21
26. Saxon E, Bertozzi CR. Cell surface engineering by a modified Staudinger reaction. Science. 2000;287:2007-10
27. Prescher JA, Dube DH, Bertozzi CR. Chemical remodelling of cell surfaces in living animals. Nature. 2004;430:873-7
28. Prescher JA, Bertozzi CR. Chemical technologies for probing glycans. Cell. 2006;126:851-4
29. Baskin JM, Prescher JA, Laughlin ST, Agard NJ, Chang PV, Miller IA. et al. Copper-free click chemistry for dynamic in vivo imaging. Proceedings of the National Academy of Sciences of the United States of America. 2007;104:16793-7
30. Yao JZ, Uttamapinant C, Poloukhtine A, Baskin JM, Codelli JA, Sletten EM. et al. Fluorophore targeting to cellular proteins via enzyme-mediated azide ligation and strain-promoted cycloaddition. Journal of the American Chemical Society. 2012;134:3720-8
31. Best MD. Click chemistry and bioorthogonal reactions: unprecedented selectivity in the labeling of biological molecules. Biochemistry. 2009;48:6571-84
32. Ngo JT, Babin BM, Champion JA, Schuman EM, Tirrell DA. State-selective metabolic labeling of cellular proteins. ACS chemical biology. 2012;7:1326-30
33. Neves AA, Stockmann H, Wainman YA, Kuo JC, Fawcett S, Leeper FJ. et al. Imaging cell surface glycosylation in vivo using "double click" chemistry. Bioconjugate chemistry. 2013;24:934-41
34. Lauber K, Bohn E, Krober SM, Xiao YJ, Blumenthal SG, Lindemann RK. et al. Apoptotic cells induce migration of phagocytes via caspase-3-mediated release of a lipid attraction signal. Cell. 2003;113:717-30
35. Ariel A, Fredman G, Sun YP, Kantarci A, Van Dyke TE, Luster AD. et al. Apoptotic neutrophils and T cells sequester chemokines during immune response resolution through modulation of CCR5 expression. Nature immunology. 2006;7:1209-16
36. Scott RS, McMahon EJ, Pop SM, Reap EA, Caricchio R, Cohen PL. et al. Phagocytosis and clearance of apoptotic cells is mediated by MER. Nature. 2001;411:207-11
37. Wang Q, Zhang J, Guo Z. Efficient glycoengineering of GM3 on melanoma cell and monoclonal antibody-mediated selective killing of the glycoengineered cancer cell. Bioorganic & medicinal chemistry. 2007;15:7561-7
38. Du J, Meledeo MA, Wang Z, Khanna HS, Paruchuri VD, Yarema KJ. Metabolic glycoengineering: sialic acid and beyond. Glycobiology. 2009;19:1382-401
39. Sampathkumar SG, Li AV, Jones MB, Sun Z, Yarema KJ. Metabolic installation of thiols into sialic acid modulates adhesion and stem cell biology. Nature chemical biology. 2006;2:149-52
40. Dafik L, d'Alarcao M, Kumar K. Fluorination of mammalian cell surfaces via the sialic acid biosynthetic pathway. Bioorganic & medicinal chemistry letters. 2008;18:5945-7
Author contact
![]() Corresponding author: Dr. Kwangmeyung Kim, Center for Theragnosis, Biomedical Research Institute, Korea Institute of Science and Technology, 39-1 Hawolgok-dong, Seongbuk-gu, Seoul 136-791, Korea; Tel: +82-2-958-5909; Fax: +82-2-958-5909; E-mail: kimre.kr
Corresponding author: Dr. Kwangmeyung Kim, Center for Theragnosis, Biomedical Research Institute, Korea Institute of Science and Technology, 39-1 Hawolgok-dong, Seongbuk-gu, Seoul 136-791, Korea; Tel: +82-2-958-5909; Fax: +82-2-958-5909; E-mail: kimre.kr