Impact Factor
- Issue 14; 2026
- Issue 13; 2026
- Issue 12; 2026
- Issue 11; 2026
- Issue 10; 2026
- Volume 16; 2026
- Advance Articles
- Past Issues
- Cover Images
- Cover Suggestion
- Index & Coverage
- Special Issues
Introduction
Materials and Methods
Results
Discussion
Abbreviations
Supplementary Material
Acknowledgements
References
International Journal of Biological Sciences
International Journal of Medical Sciences
 Global reach, higher impact

Theranostics 2014; 4(2):215-228. doi:10.7150/thno.7868 This issue Cite
Research Paper
Quantitative Liver-Specific Protein Fingerprint in Blood: A Signature for Hepatotoxicity
Zhiyuan Hu1,2,3 ![]() *, Christopher Lausted2
*, Christopher Lausted2 ![]() *, Hyuntae Yoo2,4, Xiaowei Yan2, Amy Brightman2, Jiankui Chen5, Weizhi Wang1, Xiangli Bu1, Leroy Hood2
*, Hyuntae Yoo2,4, Xiaowei Yan2, Amy Brightman2, Jiankui Chen5, Weizhi Wang1, Xiangli Bu1, Leroy Hood2
1. National Center for NanoScience and Technology, 11 BeiYiTiao, ZhongGuanCun, Beijing, 100190, China.
2. Institute for Systems Biology, 401 Terry Avenue N, Seattle, Washington 98109, USA.
3. State Key Laboratory of Proteomics, Beijing Proteomics Research Center, Beijing 100850, China.
4. University of Texas at Dallas, Department of Molecular and Cell Biology, FO 31, 800 West Campbell Road, Richardson, Texas 75080, USA.
5. Beijing 307 Hospital, Department of Laboratory Medicine, Beijing 100071, China.
* The first two authors contributed equally to this work.
Received 2013-10-11; Accepted 2013-12-4; Published 2014-1-14
Abstract

We discuss here a new approach to detecting hepatotoxicity by employing concentration changes of liver-specific blood proteins during disease progression. These proteins are capable of assessing the behaviors of their cognate liver biological networks for toxicity or disease perturbations. Blood biomarkers are highly desirable diagnostics as blood is easily accessible and baths virtually all organs. Fifteen liver-specific blood proteins were identified as markers of acetaminophen (APAP)-induced hepatotoxicity using three proteomic technologies: label-free antibody microarrays, quantitative immunoblotting, and targeted iTRAQ mass spectrometry. Liver-specific blood proteins produced a toxicity signature of eleven elevated and four attenuated blood protein levels. These blood protein perturbations begin to provide a systems view of key mechanistic features of APAP-induced liver injury relating to glutathione and S-adenosyl-L-methionine (SAMe) depletion, mitochondrial dysfunction, and liver responses to the stress. Two markers, elevated membrane-bound catechol-O-methyltransferase (MB-COMT) and attenuated retinol binding protein 4 (RBP4), report hepatic injury significantly earlier than the current gold standard liver biomarker, alanine transaminase (ALT). These biomarkers were perturbed prior to onset of irreversible liver injury. Ideal markers should be applicable for both rodent model studies and human clinical trials. Five of these mouse liver-specific blood markers had human orthologs that were also found to be responsive to human hepatotoxicity. This panel of liver-specific proteins has the potential to effectively identify the early toxicity onset, the nature and extent of liver injury and report on some of the APAP-perturbed liver networks.
Keywords: liver injury, toxicity, biomarker, RBP4, COMT, CPS1, BHMT.
Introduction
A systems view of medicine suggests that disease arises from disease-perturbed biological networks. Different diseases perturb distinct sets of biological networks and hence an assessment of perturbations of multiple networks can distinguish different types of diseases. As key components of these networks, proteins secreted or released into blood may serve as markers reflecting the status of their source organ and perturbations to their cognate intracellular networks. Blood is an important window into health and disease as it bathes virtually every organ and these, in turn, release proteins into circulation. New blood biomarkers are needed to monitor health status and to improve the speed and accuracy of disease diagnosis. In recent years, "omics" technologies have facilitated the discovery of a long list of blood marker candidates. Yet often the proposed blood markers lack disease specificity upon validation studies. For example, if the marker is produced in multiple organs, although the marker may be related to the disease of interest for one organ, it might also be related to other diseases in other organs where the marker is also produced. Hence, there is intrinsic ambiguity to the disease-specificity of most blood biomarkers. To counter this, we propose that organ-specific blood biomarkers have the advantage of identifying the specific organ in which the disease occurs. A classic example is prostate-specific antigen (PSA), a blood biomarker used for screening and monitoring prostate cancer (1). While not an ideal marker because PSA levels can be affected by infection or benign prostatic hyperplasia (2), it does report exclusively on the state of one specific organ. Another key strategy to achieve high diagnostic specificity is to employ biomarker panels (3). Multiple organ-specific markers can report the activities of multiple biological networks―and hence be capable of reporting diseases specifically. Here, we set out to discover multiple liver-specific markers correlating with the key pathologies of APAP-induced toxicity towards the goal of improving disease-specificity.
The most commonly-used markers of liver injury are alanine transaminase (ALT), aspartate transaminase (AST), alkaline phosphatase (ALP), gamma-glutamyl transferase (GGT) and bilirubin. These are easily measured photometrically and perform across various species. However, these markers alone do not provide early detection or the desired specificity. Although ALT has long served as the gold standard for liver damage, it is not highly liver-specific and does reflect diseases in other organs. ALT is produced in muscle, intestine, colon, fat tissues, heart and brain (4). Elevated ALT activity has been reported in patients with muscle disease, celiac disease, and in apparently-healthy people (5-8). In some cases, ALT is not sufficiently sensitive. ALT is not increased in some patients with histopathologically-confirmed liver diseases such as cirrhosis, non-alcoholic steatohepatitis (9), or hepatitis-C infection (10). Other commonly employed enzyme biomarkers―AST, ALP, and GGT―exhibit even less disease-specificity as they are produced in significant amounts in multiple organs.
We applied a systems strategy for biomarker discovery. Deep transcriptome analyses identified organ-specific/organ-enriched transcripts for virtually every human and mouse organ. We then employed proteomics techniques (mass spectrometry, surface plasmon resonance (SPR) protein microarray and immunoblotting) to identify proteins encoded by organ-specific/organ-enriched transcripts that could be detected in blood. These may enter circulation via secretion, proteolysis of membrane-bound proteins and leakage of cytoplasmic and nuclear proteins from damaged or dead cells. We will henceforth include organ-enriched targets in our "organ-specific" category. The mouse model of acetaminophen (APAP)-induced centrilobular hepatocyte necrosis was investigated as it is a well-defined toxicity model related to the most common cause of drug-induced liver failure in the U.S. (11-12). In vitro human hepatic cell studies verified that key mechanistic features are similar in human and in rodents for APAP-induced toxicity (13). RNA signatures in liver, blood cells, and serum have been reported for the rodent model (14-15). Moreover, we recently found that in the mouse-APAP model that circulating microRNA biomarkers provide early and sensitive detection of drug-induced liver injury (16). Here, we identified fifteen liver-specific protein markers by utilizing three separate quantitative proteomic platforms with the mouse-APAP model. Furthermore, five of the liver-specific blood proteins in mouse had human orthologs that were also found to be elevated in human blood samples.
Materials and Methods
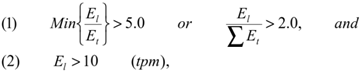
Selection of organ-specific transcripts. We used deep (millions of transcripts per organ) transcriptome databases of the major human and mouse organs created by Massively Parallel Signature Sequencing (MPSS) or next-generation sequencing technology (17-18) to identify organ-specific transcripts by comparative analyses. Human MPSS database was generated by ISB from 34 human MPSS datasets (28 organs including seven different human brain regions and one human ovarian cell line) (Supplementary Material: Table S1A). Mouse MPSS database was based on the 84 samples from 31 different mouse organs from the Mouse Transcriptome Project (trans-NIH with Lynx/Solexa MPSS™ technology, http://www.ncbi.nlm.nih.gov/projects/geo/info/mouse-trans.html, Supplementary Material: Table S1B). The UniGene EST profiles database was obtained from NCBI. Operational criteria for organ-specificity were target expression levels in liver (El) five times higher than any non-liver organ (Et) or two-fold higher than all non-liver organs combined. Also, targets were excluded if expression levels were not higher than ten transcripts-per-million (tpm).
Antibodies. An antibody library for liver-specific proteins was established, including 183 commercial antibodies (monoclonal or polyclonal from various vendors), 53 customer rabbit polyclonal antibodies (Aviva Systems Biology, San Diego, CA) and 56 customer mouse monoclonal antibodies (ISB). Antibodies for conventional biomarkers, ALT, AST, and glutamate dehydrogenase 1 (GLUD 1) were used as positive controls.
Animal studies. After 24 hours of fasting, male C57/BL/6 mice, nine weeks of age, were administered high-dosage APAP (300 mg/kg), low-dosage APAP (150 mg/kg) or saline (negative control) by intraperitoneal (IP) injection. At various time points, animals were euthanized, kidney and liver tissues were harvested, and plasma samples were collected. Tissue samples were frozen at -80°C for transcriptomic and proteomic analysis. Plasma samples were collected in tubes with EDTA (Becton Dickinson, NJ) and frozen at -80°C for proteomic analysis. APAP-treated animals were euthanized pre-treatment and at 1, 3, 12, 24, 48, 72, and 192 hours, post-injection. Plasma from three surviving high-dosage mice were pooled and labeled A0, A1, A3, A12, A24, A48, A72, and A192, based on the time point. Negative control animals were euthanized at 1, 3, 12, 24, 48, 72, and 192 hours, post-injection. Plasma samples from three control mice were then pooled and labeled C1, C3, C12, C24, C48, C72, or C192, based on the time point. ALT levels were determined by kinetic enzymatic assay (TECO, Anaheim, CA). Excised livers and kidneys were also fixed by 10% neutral buffered formalin, stained by hematoxylin-eosin, and examined by pathologists. All animal experiments were performed under IACUC approval and following NIH/USDA guidelines.
Surface Plasmon Resonance. Two sets of antibody arrays were printed on gold-coated slides for protein profiling using methods as previously described (19). These methods have been been demonstrated to accurately detect classical blood proteins down in to the low-to-mid ng/mL range. First, high-density arrays (Set A) were printed with 792 features (384 antibodies and 12 buffer blanks, in duplicate) including 90 antibodies to liver-specific proteins while the additional antibodies consisted of donated antibodies to inflammation-related or uncategorized targets. Second, low-density arrays (Set B) were printed with 50 features including 40 antibodies to liver-specific targets. Antibodies were selected based on binding observed on Set A and combined with additional liver-specific antibodies not available at the time of the earlier printing. Set B were used to observe the plasma profile changes over the course of liver injury and recovery. Antibodies were diluted to 0.2 to 0.5 mg/mL in PBS buffer and printed with SMP7 pins (Telechem International, Sunnyvale, CA) to produce 300 µm features. The arrays are described in Supplementary Material: Table S3.
Plasma samples were applied to the arrays using the ProteomicProcessor SPRI (Plexera, Woodinville, WA) running SPRit v1.2 software. Samples were diluted 1:63 in running buffer without any additional processing (i.e. fractionation or depletion). The running buffer was 0.5 mg/mL dried milk and 0.005% Tween20 in PBS. Bound proteins were stripped using regeneration solution of 0.5% phosphoric acid and 0.005% Tween20. Each cycle of sample analysis consisted of 300 s binding, 300 s washing, and 60 s regeneration, all at 2 µL/s. Before use, arrays were conditioned and calibrated. Arrays were exposed to three cycles of binding and regeneration using normal mouse plasma. The sensorgrams from these injections were checked for anomalies, such as an unstable baseline, but the data was not saved. Immediately prior to use, a calibration solution of 1.3% glycerol in running buffer was injected to enable the conversion of arbitrary reflectance units to Refractive Index Units (RIU). Samples C24 and A24 were each injected twice times onto two arrays from Set A. Samples A0, A1, A3, A12, A24, A48, and A72 were each injected twice times onto two arrays from Set B.
Relative quantification of plasma protein binding to each antibody feature was determined by curve-fitting using OSPRAI software (http://www.bioinformatics.org/osprai/index.html) and a one-to-one interaction model. The software implements a constrained Levenberg-Marquardt algorithm to performs least-squares curve-fitting on any number of parameters to any number of models in parallel. Protein standards were unavailable for most antibodies, so concentrations were determined relative to control plasma by assuming a fixed arbitrary value for the control plasma sample. Specifically, the reference samples were fixed at 10-6 M, the association rate constant (kon) was allow to float between 101 and 105 M-1s-1, the dissociation rate constant (koff) was allowed to float between 10-1 and 10-5 s-1, the maximal response (Rm) was allowed to float between 20 and 4000 µRIU, and the sample concentrations were allowed to float between 10-3 and 10-12 M. Interaction parameters kon, koff, and Rm were assumed to be unchanging over the course of the experiment; only the analyte concentrations were assumed to vary in each of the samples injected into the SPR microarray flow cell.
Targeted iTRAQ LC-MS/MS. Protein targeting and relative quantification was performed using a directed iTRAQ approach and tandem mass spectrometry (20) Proteotypic selection peptides (tryptic peptides unique to each targeted protein) were synthesized and labeled with one iTRAQ reagent. These peptides provide a clear signal for the first mass analyzer (MS1) to select sample peptides for subsequent fragmentation and quantification by the second mass analyzer (MS2). We chose representative protein sequences to 29 liver-specific targets from the Mouse Genome Informatics database (http://www.informatics.jax.org/mgihome/nomen). The sequences were computationally trypsinized to produce the list of all possible tryptic peptides for each protein. Then, two mouse protein databases containing LC-MS/MS tryptic peptide data were used to select verified MS-detectable peptides from among the possible tryptic peptides of the mouse blood proteome (20,21). For those proteins whose tryptic peptides were not detected previously, prediction software developed by Aebersold et al. (22) was used to select those peptides that are most likely to be detected by mass spectrometry.
Mouse plasma samples were depleted of the seven most abundant plasma proteins (albumin, IgG, fibrinogen, α-1-antitrypsin, transferrin, haptoglobin, and IgM) using an IgY-M7 column (GenWay Biotech, San Diego, CA). Protein mixtures were dried, reduced, and alkylated with the reagents in iTRAQ reagent kit according to the manufacturer's recommendations. Protein mixtures were then trypsinized and dried completely. Proteotypic selection peptides (tryptic peptides unique to each targeted protein) were synthesized and labeled with iTRAQ 117 reagent. (See Supplementary Material: Table S4 for complete list of spike-in peptides and their detection status.) Control sample C24 was labeled with iTRAQ 114 reagent and treatment sample A24 was labeled with iTRAQ 115 reagent for relative quantification via analysis of the resulting MS2 spectra. Reagent 116 was not used. Combined iTRAQ mixtures were separated into six fractions with a strong-cation exchange cartridge column (Applied Biosystems) and desalted with C18 spin columns and analyzed by a Q-TOF Premier equipped with a Nano Acquity column (Waters). An example spectrum for FAH quantification appears in Supplementary Material: Figure S8.
Raw datasets were converted to mzXML with massWolf and processed through Trans-Proteome Pipeline with SEQUEST search against mouse IPI database (v3.24). Typical trypsin cleavage sites were used (C-terminus of Lys and Arg except when followed by Pro) for the search, and maximum one missed cleavage was allowed, but no non-specific cleavages were permitted. Fixed modifications were iTRAQ modification at N-terminus and Lys side chain (+144.1), modification of Cys with MMTS (+46.01). No variable modifications were allowed in the search. Peptide mass tolerance was set to 3 Da and fragment ion tolerance was set to 0.5 Da. (A fragment ion tolerance of 0.0 Da was specified in the "sequest.params" file to produce an actual tolerance of 0.5 Da.) With the full list of MS/MS spectra, high-confidence proteins were selected at the peptide level with PeptideProphet probability of 0.9 or higher. False Discovery Rates for these selected proteins were below 1%. Relative quantification was performed by first normalizing the two sets of raw iTRAQ signals of all detected MS/MS spectra with quantile normalization and then calculating log2 ratio of each peptide with normalized iTRAQ signals. Significance was assessed using the ASAPRatio algorithm (23).
Quantitative immunoblotting. Mouse and human plasma samples were used at 1 µL per well and mixed with sample buffer under reducing conditions for a total loading volume of 10 µL per well. Mouse tissues were snap-frozen, minced, and Dounce homogenized in lysis buffer containing 0.5% nonyl phenoxylpolyethoxylethanol, 150 mM NaCl, 50 mM Tris-HCl (pH 7.5), and proteinase inhibitor cocktails. Lysate supernatants were collected following centrifugation at 3000 g for 10 minutes. Human tissue was taken from frozen tissue arrays (Cat. #T6234701, Biochain, Newark, CA) and processed in the same manner. Samples were loaded onto 4-12% gradient gels and run in MOPS running buffer (Invitrogen, CA). After transfer to nitrocellulose membranes (BioRad, CA), nonspecific binding was blocked with 5% nonfat dried milk in PBS. Blots were probed with various primary antibodies in the 1-2 µg/ml range overnight at 4°C followed by incubation with an appropriate IR-dye conjugated secondary antibody (LI-COR Biosciences, Lincoln, NE). Protein signals were visualized using the LI-COR Odyssey imaging system. For some targets, recombinant protein titrations were run and probed simultaneously to quantify the amount of target protein present in the plasma samples. Recombinant protein standards were obtained from OriGene (Rockville, MD). Quantification was based on constructing a standard curve with the integrated intensity values generated by the Odyssey software.
Clinical Study. Anonymous, previously-collected plasma samples from four subjects with and four subjects without APAP-induced liver injury were provided by 307 Hospital. Approval for the conduct of this study was obtained from the Institutional Review Boards of 307 Hospital. Gender, height, weight, and initial ALT level, but no other subject information, was provided. Immediately upon admission to the hospital, venous blood had been collected into 10 ml K2EDTA tubes, centrifuged, and transferred to cryovials. An aliquot had been withdrawn for the ALT enzymatic activity assay and the remainder frozen in liquid nitrogen until used here for quanititative immunoblot analysis.
Results
Selection of liver-specific transcripts. Using our expression criteria (see Materials and Methods), 1513 human liver-specific transcripts and 648 mouse liver-specific transcripts were defined as liver-specific. Fewer mouse candidates were identified because more organs samples were included for the comparative mRNA abundance analysis. Obviously this is a limitation―namely that as transcripts from new organs are added to our database, fewer transcripts will be organ-specific or organ-enriched. Moreover, there is the possibility that organ-specific transcripts will be expressed in different organs during different stages of development―a possibility that we have not explored. From the human and mouse liver-specific transcripts, 133 ortholog pairs were selected as candidates. The conventional liver function markers (ALT, AST, ALP, GGT) all fell short of these organ-specific criteria. To narrow the search scope, we checked expression profiles of the 133 candidates in NCBI EST expression database. We eliminated 26 transcripts because their ESTs were abundant in two or more organs in addition to liver (Supplementary Material: Figure S1). The remaining 107 transcripts were defined as liver-specific (Supplementary Material: Table S2). Within the 107 targets, 35 transcripts were eliminated from further investigation because they belonged to protein families with many similar members―a challenge for screening by antibody-based methods and hence future diagnostic applications. The remaining list of 72 targets was divided into two groups: 34 secretory proteins and 38 intracellular and membrane proteins (Supplementary Material: Figure S1). Based on antibody availability, we selected 48 targets for quantification, including all the 38 intracellular and membrane protein targets and 10 secretory protein targets.
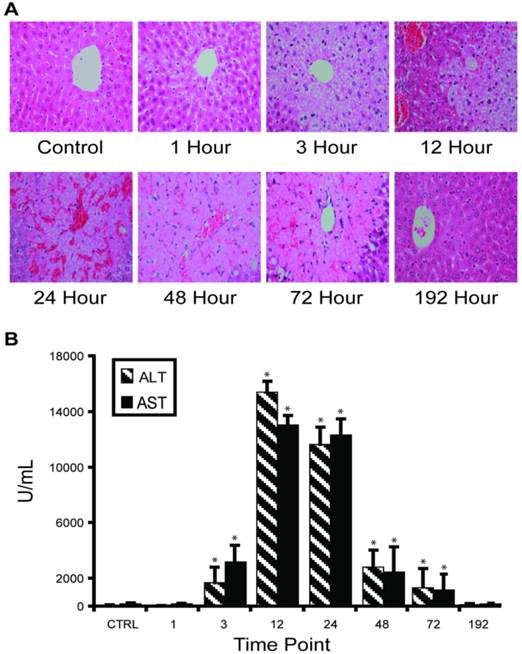
APAP overdose-induced liver injury in mouse model. Our in vivo experimental approach entailed injecting C57BL/6 mice with half-lethal dose of APAP and then studying the dynamic change of liver-specific protein concentrations in liver and blood. About 30% mice died between 24 and 48 hours. Histological staining of the sliced liver tissue showed progressive necrosis increasing to a maximum at 24 hours post-injection and returning to normal in the surviving mice between 72-192 hours (Figure 1A). Histopathology from the kidney, the most susceptible organ after the liver, was normal at all time points. Blood ALT and AST levels indicated clear injury starting at 3 hours post-injection, with maximal values (>10,000 IU/L) occurring between 12-24 hours, then gradually decreasing to normal levels (Figure 1B).
Time course of APAP toxicity of the mouse liver injured by intraperitoneal injection of 300 mg/kg APAP. (A) Histological confirmation of liver injury and recovery. Excised liver sections were and stained by hematoxylin-eosin and examined by expert pathology. Liver architecture was normal at 1 hour with microvesicular steatosis in hepatocytes surrounding central veins. The steatosis expanded at 3 hours and at 12 hours, centrilobular necrosis was apparent. At 24 hours, hemorrhage appeared. Hepatocytes started to recover at 48 hours and fully recovered at 192 hours. (B) Temporal profiles of ALT activity in plasma were observed to correlate with level of liver injury. Results are plotted as mean ± standard error (n=3). Comparisons between multiple groups were performed with one-way analysis of variance.
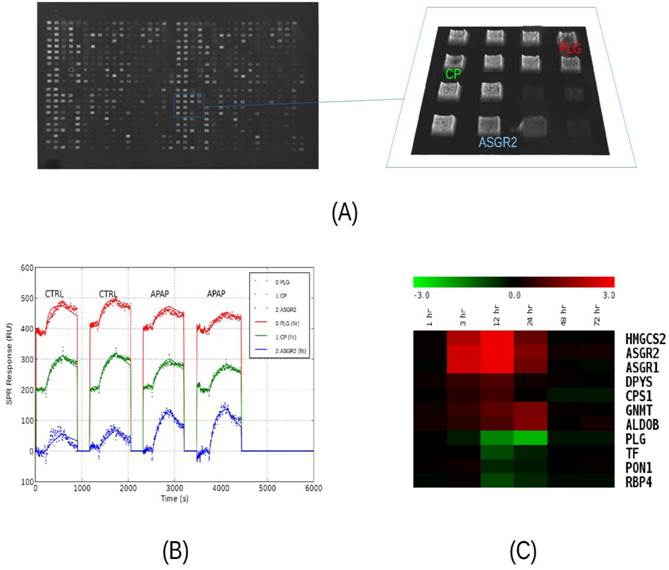
Screening of liver-specific proteins in mouse model. We analyzed as many protein targets as possible in liver injury and control mouse plasma using surface plasmon resonance imaging, iTRAQ liquid chromatography tandem mass spectrometry, and immunoblotting. All three methods were used first to compare toxicity sample A24 to control C24 and the results appear in Supplementary Material: Table S5. Qualitative results from the 51 sets of immunoblots indicated that 19 target levels were increased and four levels were decreased with injury. The remaining blots were indeterminate due to weak or unchanged levels, or due to a lack of a major band at the predicted molecular weight. Albumin levels appeared unchanged while other classical plasma proteins were decreased. Binding signals to the SPR microarrays of Set A were very similar for the vast majority of the antibody features, but among the liver-specific antibodies, several significant (P<0.05) differences were seen. In liver injury, asialoglycoprotein receptor 2 (ASGR2) binding levels exhibited the greatest elevation while plasminogen (PLG) exhibited the greatest attenuation (Figure 2, A-C). Other changes included elevated 3-hydroxy-3-methylglutaryl-Coenzyme A synthase 2 (HMGCS2) and asialoglycoprotein receptor 1 (ASGR1) levels and attenuated transferrin (TF). These trends were all in agreement with the immunoblotting. The iTRAQ analysis observed more than two-fold changes in 21 targets, with low P-values, but not necessarily with enough independent peptide measurements to meet the statistical significance threshold. Thirteen of these were elevated and eight attenuated in injury. Twelve of these trends were in agreement with immunoblotting, with one, carbamoyl-phosphate synthase 1 (CPS1), in disagreement, and seven cases where blotting was indeterminate. Again, ASGR2 showed a strong increase while PLG and TF decreased.
Analysis of serum protein levels by SPRI. (A) Raw SPR image of a 792-feature microarray under PBS buffer. The features consist of 384 antibodies and 12 buffer blanks printed in duplicate over a 2 cm2 area. Antibodies were diluted to 0.2 - 0.5 mg/mL for printing. A 1.6 mm2 area containing antibodies to liver-specific proteins is highlighted in blue. (B) Sensorgrams from three features subject to four sample injections. Two injections of control plasma (C24) are followed by two injections of high-dosage APAP-treatment plasma (A24). The samples were pooled plasma, collected from three mice, 24 hours after treatment and diluted 1:63 in running buffer. The injections consist of five minutes of binding, five minute of washing, and two minutes of regeneration. Recorded data is plotted with dotted lines and model-fitted data is plotted with solid lines. Plasminogen (PLG, red) levels decrease while ASGR2 (blue) levels increase, relative to ceruloplasmin (CP, green). (C) Relative serum protein profiles from 1 to 72 hours after APAP-treatment as determined by SPRI. Pooled samples were analyzed using a 50-feature SPRI microarray. Sensorgrams were recorded and model parameters (on-rate, off-rate, and concentration) were determined by curve-fitting. A number of protein levels are observed to rise between 3 and 24 hours, while normally-abundant serum proteins such as plasminogen (PLG), transferrin (TF), paraoxonase 1 (PON1), and retinol-binding protein 4 (RBP4) decrease between 12 and 24 hours, post-treatment. Heat map colors indicated log2 ratios relative to the zero-hour control sample..
Immunoblot analysis of fourteen targets at additional time points of 3, 12 and 72 hours post-treatment (A3, C3, A12, C12, A72, and C72) indicate that these changes were generally very noticeable at 12 hours and maximal at 24 hours (Supplementary Material: Figure S2). Next, with additional antibodies available, we profiled mouse plasma protein levels over the full course of injury and recovery by SPR (samples A0 through A192). Binding profiles from SPR array Set B showed the greatest change in plasma composition occurring between 12 and 24 hours, and returning to normal by 72 hours. This array allowed seven proteins to be observed increasing and three decreasing within that time period (Figure 2C). Protein profiles from quantitative immunoblotting also show most changes to be maximal between 12 and 24 hours. Levels were calculated from the integrated intensity of the specific band relative to the average over the time course (Figure 3, A-C). The additional immunoblotting and SPRI data all show elevated CPS1 levels.
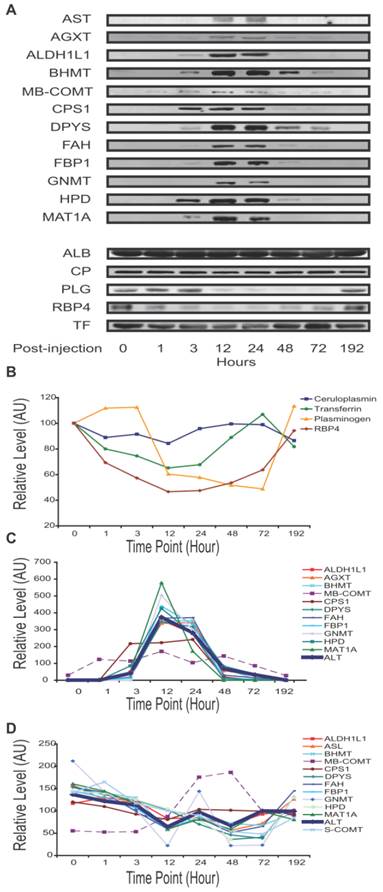
APAP-induced mouse liver injury signature. Temporal profiles of proteins in plasma observed to correlate with level of liver injury. Albumin concentration was not visibly changed. Transferrin, ceruloplasmin, plasminogen and RBP4 levels were seen to decrease with injury. The traditional liver function markers, ALT and AST, exhibited levels elevating with liver injury, as did a number of potentially novel biomarkers. Unless specified otherwise, all relative levels were determined by quantitative immunoblotting and normalized to the mean over the time course. (A) Qualitative plasma profiles for 17 proteins by Western blot. (B) Quantitative plasma profiles for four secretory proteins. (C) Quantitative plasma profiles of ALT and novel biomarkers. ALT indicates injury at 3 hours, peak at 12 hours, and return to baseline at 96 hours. ALT levels here were assayed by enzymatic activity and reported in IU/mL. MB-COMT and CPS1 have apparently different patterns from ALT. (D) Quantitative liver lysate protein profiles of the novel blood biomarkers. Lysate profiles differed greatly from the plasma profiles. The increase in MB-COMT levels was shifted later in time, while the other protein levels are attenuated between 24 and 48 hours.
Through the various assays, we measured 48 proteins of predicted liver-specificity as well as the three traditional hepatotoxicity biomarkers of ALT, AST, and GLUD1. Immunoblotting provided the most comprehensive survey, with 23 targets seen to be toxin-perturbed, and with SPRI and iTRAQ providing supporting evidence for 15 of these proteins (Table 1). The remainder either held steady, like albumin, or were not detectable. In one case, CPS1, the iTRAQ result differed from the other two plaforms. In addition to the three traditional biomarkers, sixteen protein levels increased (all intracellular or membrane proteins) while four proteins decreased (all secretory) in the plasma of injury mice. That many liver-specific proteins were not perturbed is unsurprising, as many liver networks are not perturbed by APAP toxicity. Fourteen of sixteen elevated proteins were metabolic enzymes, released from the liver cells by leakage or apoptosis, and two were membrane proteins, ASGR1 and ASGR2, presumably released by proteolysis.
Plasma protein-level changes following liver injury. Using label-free antibody array (SPRI), Western blot (WB), and iTRAQ (MS) methods, 23 protein level changes were observed in mouse plasma. Three proteins are conventional liver function biomarkers and 20 are potentially novel biomarkers. SPRI and MS results are given as log2 ratios and WB results are given qualitatively. Increased (↑), decreased (↓) and unchanged (↔) measurements are indicated by arrow directions. A dash (-) indicates a protein that was not targeted by that technology.
| SPRI | MS | WB | |||||
|---|---|---|---|---|---|---|---|
| Symbol | Protein name | Cellular localization | log ratio | P | log ratio | P | Change |
| AGXT | Alanine-glyoxylate aminotransferase | Peroxisome | - | - | - | - | ↑ |
| ALDH1L1 | Aldehyde dehydrogenase 1 family, member L1 | Cytoplasm | - | - | - | - | ↑ |
| ALDOB | Fructose-bisphosphate aldolase B | Cytoplasm | 0.96 | 0.010* | 1.93 | 0.076 | ↑ |
| ASGR1 | Asialoglycoprotein receptor 1 | Membrane | 2.22 | 0.004* | -0.23 | 0.354 | ↑ |
| ASGR2 | Asialoglycoprotein receptor 2 | Membrane | 2.29 | 0.002* | 1.88 | 0.084 | ↑ |
| ASL | Argininosuccinate lyase | Cytoplasm | nd | nd | 1.92 | 0.077 | ↑ |
| BHMT | Betaine--homocysteine S-methyltransferase 1 | Cytoplasm | - | - | 3.07 | 0.004* | ↑ |
| CPS1 | Carbamoyl-phosphate synthetase 1 | Mitochondrion | 0.19 | 0.044* | -1.77 | 0.040* | ↑ |
| DPYS | Dihydropyrimidinase | Cytoplasm | 1.14 | 0.002* | 0.97 | 0.292 | ↑ |
| FAH | Fumarylacetoacetate hydrolase | Cytoplasm | nd | nd | 1.96 | 0.072 | ↑ |
| FBP1 | Fructose-1,6-bisphosphatase 1 | Cytoplasm | - | - | 1.82 | 0.093 | ↑ |
| GNMT | Glycine N-methyltransferase | Cytoplasm | 1.10 | 0.026* | 1.12 | 0.253 | ↑ |
| HMGCS2 | 3-hydroxy-3-methylglutaryl-Coenzyme A synthase 2 | Mitochondrion | 2.67 | 0.004* | - | - | ↑ |
| HPD | 4-hydroxyphenylpyruvate dioxygenase | Cytoplasm | - | - | 2.37 | 0.028* | ↑ |
| MAT1A | Methionine adenosyltransferase 1 | Cytoplasm | - | - | - | - | ↑ |
| MB-COMT | Catechol-O-methyltransferase | Membrane | - | - | - | - | ↑ |
| CP | Ceruloplasmin | Secretory | -2.74 | 0.130 | -1.28 | 0.175 | ↓ |
| PLG | Plasminogen | Secretory | -0.93 | 0.015* | -1.04 | 0.157 | ↓ |
| RBP4 | Retinol-binding protein 4 | Secretory | -0.54 | 0.045* | - | - | ↓ |
| TF | Transferrin | Secretory | -0.28 | 0.042* | -1.20 | 0.123 | ↓ |
| ALB | Albumin | Secretory | 0.31 | 0.780 | - | - | ↔ |
| ALT (GPT1)† | Alanine transaminase | Cytoplasm | nd | nd | 1.56 | 0.145 | ↑ |
| AST (GOT1)† | Aspartate transaminase | Mitochondrion | nd | nd | - | - | ↑ |
| GLUD1† | Glutamate dehydrogenase 1 | Mitochondrion | - | - | - | - | ↑ |
*Significant at P<0.05. †Conventional liver function biomarkers. nd: not detected.
The dynamic profile of sixteen liver-specific protein concentrations reflects the onset and reversal of the histopathology. The four proteins that declined in blood during liver injury ――PLG, retinol binding protein 4, plasma (RBP4), TF and ceruloplasmin (CP) ―― are secretory proteins. These exhibited different temporal concentration profiles (Figure 3A,3B). RBP4 responded first and recovered last, while ceruloplasmin had only marginal response at the time of peak liver damage. Plasminogen and transferrin had intermediate responses. The other 11 proteins exhibited elevated levels during liver injury. Nine were from the cytosol: alanine-glyoxylate aminotransferase (AGXT), aldehyde dehydrogenase 1 family member L1 (ALDH1L1), betaine-homocysteine methyltransferase (BHMT), dihydropyrimidinase (DPYS), fumarylacetoacetate hydrolase (FAH), fructose bisphosphatase 1 (FBP1), Glycine N-methyltransferase (GNMT), 4-hydroxyphenylpyruvic acid dioxygenase (HPD), and methionine adenosyltransferase I alpha (MAT1A). Their temporal profiles were similar to ALT, reflecting a pathological response peaking between 12 and 24 hours then gradually returning to normal in surviving mice (Figure 3A, 3C). This reflects directly the destruction of liver cells and their recovery. Distinct temporal profiles were observed for the mitochondrial protein, CPS1, and for membrane-bound catechol-O-methyltransferase (MB-COMT). These elevated earlier than other leakage markers and ALT/AST. The protein profiles at the cellular level differed greatly from the plasma level. Levels of these 11 proteins in the liver lysates declined slightly over the time course, with the exception of MB-COMT, MB-COMT was highly elevated between 24 and 48 hours (Figure 3D), consistent with liver cell loss or damage.
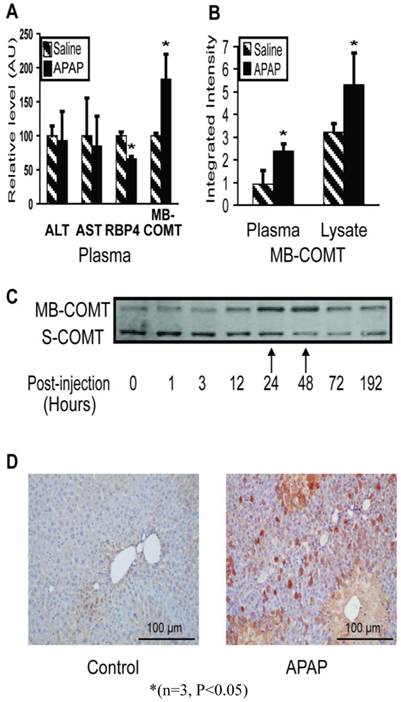
COMT is an APAP response marker. In the early stages, even before ALT/AST and histopathology indicate injury, RBP4 and COMT levels changed significantly (Figure 4A). Immunoblotting showed the MB-COMT level elevated in both liver tissue and plasma during liver injury (24 hours) (Figure 4B). The S-COMT protein in mouse liver decreased (in the same manner as the other liver enzymes), whereas MB-COMT increased significantly, especially 24 - 48 hours post-injection (Figure 4C). In blood, S-COMT could not be detected by immunoblotting under any conditions, but MB-COMT increased significantly in liver injury mouse instances (Figure 4A). We also checked MB-COMT expression in mouse liver by immunohistochemistry with a specific anti-MB-COMT antibody and found that MB-COMT level increased significantly at 48 hours post-injection. (Figure 4D)
Membrane-bound COMT (MB-COMT) is a sensitive marker of early injury in the mouse model. (A) MB-COMT, along with RBP4, changed significantly one hour post-APAP treatment. ALT and AST levels were assayed enzymatically while RBP4, and MB-COMT were assayed by quantitative western blotting. Treatment values were relative to mock-treatment control values which were normalized to 100. (B) MB-COMT levels were elevated in both plasma and liver 24 hours after treatment with 300 mg/kg APAP, as determined by quantitative western blotting. (C) Liver lysate levels of MB-COMT but not soluble COMT (S-COMT) were maximal 24 and 48 hours after treatment, when injury was maximal. (D) Immunohistochemistry staining of MB-COMT 48 hours after treatment.
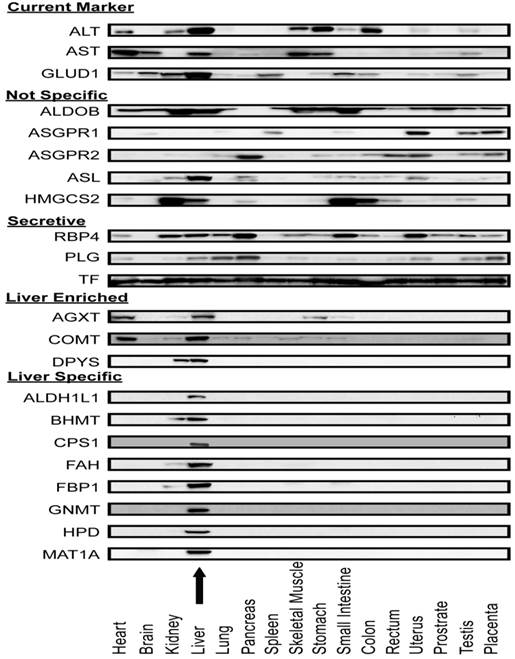
Liver-specificity of biomarker candidates in human tissue arrays. After screening APAP-model mouse plasma, Western blot assays were used to measure the distribution of these candidate proteins across 16 major human organs (Figure 5). As expected, current liver biomarkers, ALT, AST, and GLUD1, were distributed in multiple organs. Out of the sixteen intracellular or membrane proteins, eleven had distribution profiles consistent with their transcriptome profiles (that is they were organ-specific by our criteria). Eight proteins (ALDH1L1, BHMT, CPS1, FAH, FBP1, GNMT, HPD, and MAT1A) were highly liver-specific, three proteins (AGXT, COMT, DPYS) were liver-enriched. The remaining five proteins (ALDOB, ASGR1, ASGR2, ASL, HMGCS2) were distributed in multiple organs and hence differed from their liver-specific transcriptome profiles. For the secretory proteins, multi-organ distributions were observed. It is possible that these abundant plasma proteins are taken up by the organs from the blood.
Protein expression profile across sixteen human organ types. Antibodies against ALT, AST, Glud1, and nineteen proteins which appeared to be liver-specific at the mRNA level were used in immunoblotting lysates of a human organ array. ALT, AST and GLUD1 were expressed in multiple organs. Five proteins (ALDOB, ASGR1, ASGR2, ASL and HMGCS2) were expressed in multiple organs which were not consistent with their mRNA expression profile. AGXT and COMT were expressed mainly in liver and heart. DPYS was expressed mainly in liver and kidney. Eight proteins (ALDH1L1, BHMT, CPS1, FAH, FBP1, GNMT, HPD, and MAT1A) were highly liver-specific. The arrow indicates the liver lysate lane.
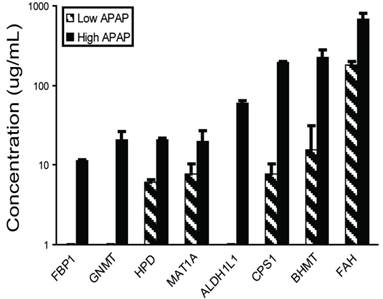
Liver-specific biomarker candidates show a dose-response relationship. The eight highly-specific proteins were chosen for further study. Mouse plasma samples from three individuals each from control, low-dosage (150 mg/kg APAP) and high-dosage (300 mg/kg APAP) groups were analyzed by quantitative immunoblotting (Figure 6, Supplementary Material: Table S6). The low dosage led to elevated levels of BHMT, CPS1, FAH, HPD, and MAT1A (6.0-182.6 µg/mL) versus the controls, while the high dosage led to elevated levels of all eight proteins with concentrations reaching the microgram-per-milliliter range (11.3-677.7 µg/mL). All eight responses were dose-dependent with high statistical significance (one-way ANOVA, all P<0.001).
Plasma concentrations for biomarker candidates increase with dosage. Eight biomarkers were observed more elevated in mice receiving high (300 mg/kg) than low (150 mg/kg) APAP dosages. Plasma was collected 24 hours after APAP treatment and assayed by quantitative immunoblotting using recombinant human protein standards.
Human APAP-toxicity plasma samples. Ideal hepatic safety markers should be detectable in both preclinical and clinical tests. Eleven leakage markers in our blood signature are liver-specific at both RNA and protein levels in both mouse and human. We checked these markers in human blood samples with APAP toxicity by immunoblotting. Five proteins (BHMT, DPYS, FAH, FBP1, HPD) were detected in liver injury plasma samples, but not in matched normal samples. The other six proteins (ALDH1L1, AGXT, COMT, CPS1, GNMT and MAT1A) could not be detected in any human samples by Western blot (data not shown). We used purified recombinant human proteins as standards and the Li-COR software for estimating concentration. BHMT, DPYS, FAH, FBP1 were found to be in the microgram-per-milliliter range (5.1-64.9 µg/mL), notably higher than ALT (0.22-0.55 µg/mL). HPD was found at a level similar to ALT (Table 2). While protein quantitation by immunoblotting is somewhat approximate, it seems likely that these proteins are significantly more abundant in the toxicity samples than ALT. For comparison, we calibrated our enzymatic assays using purified human ALT1 (0.46 IU/µg) and ALT2 (0.08 IU/µg) proteins (OriGene, Rockville, MD). (See Supplementary Material: Figure S6.) These assays measured ALT levels in the low microgram-per-milliliter range (0.4-1.2 µg/ml), consistent with the immunoblotting estimates.
Presence of elevated biomarkers in high-ALT human serum. ALT and five candidate biomarkers were assayed in human serum by quantitative immunoblotting using recombinant human protein standards. None were detectable in the serum from subjects with normal ALT levels. The five biomarkers were all elevated in subjects experiencing hepatotoxicity, with the levels correlating to ALT measurements. ALT was also measured by the more sensitivity enzymatic activity assay which was converted to absolute concentration using calibration standards. Four of the five are much more abundant in blood than ALT.
| APAP hepatotoxicity | Control | |||||||
|---|---|---|---|---|---|---|---|---|
| Sample | H1 | H2 | H3 | H4 | C1 | C2 | C3 | C4 |
| Gender | Female | Female | Male | Male | Female | Female | Male | Male |
| Age (year) | 32 | 68 | 44 | 57 | 32 | 54 | 45 | 75 |
| Weight (kg) | 55 | 50 | 60 | 74 | 52 | 49 | 70 | 63 |
| Height (cm) | 160 | 159 | 175 | 176 | 163 | 158 | 177 | 165 |
| ALT(IU/L) | 632 | 424 | 345 | 182 | 18 | 35 | 32 | 27 |
| ALT(µg/ml)* | 1.26 | 0.84 | 0.69 | 0.36 | 0.04 | 0.07 | 0.06 | 0.05 |
| ALT(µg/ml) | 0.55 | 0.22 | ND | ND | ND | ND | ND | ND |
| BHMT (µg/ml) | 64.9 | 60.7 | 31.3 | 17.8 | ND | ND | ND | ND |
| FAH (µg/ml) | 53.8 | 49.8 | 38.7 | ND | ND | ND | ND | ND |
| FBP1 (µg/ml) | 38.3 | 33.1 | 10.3 | 12.2 | ND | ND | ND | ND |
| DPYS (µg/ml) | 20.7 | 18.3 | 5.1 | 6.4 | ND | ND | ND | ND |
| HPD (µg/ml) | 0.32 | 0.27 | 0.02 | 0.09 | ND | ND | ND | ND |
*Estimated based on enzymatic activity. ND: Not detectable.
Discussion
Organ-specific blood biomarkers. We propose here a new strategy for identifying biomarkers that will potentially permit early detection, disease stratification, and follow progression―all from blood analyses. The basic concept is that all organs/tissues uniquely synthesize some transcripts and proteins, and that those entering the bloodstream reflect effects on their cognate biological networks during disease progression. These proteins may be secreted, leaked by cell damage/death, or released from cell membranes by proteolysis. This approach has several key features. 1) Selected markers report the affected organ(s). 2) Panels survey a spectrum of networks to report the type of perturbation. 3) When one can identify the cognate biological networks of organ-specific proteins, one can begin to investigate the nature of the disease mechanism. This approach could be very useful in assessing the effects of new drugs on particular organs.
In this study, we wished to maximize our chances of finding organ- specific proteins by focusing on the most organ-specific transcripts. We believe that most of the proteins targeted here are, in fact, quite liver-specific based on the immunoblotting results shown in Figure 5. Yet one must keep in mind that mRNA and protein levels often do not correlate for a number of reasons including the variability of protein degradation rates and the transport of proteins from one tissue to another by the circulatory system. Additionally, there is the possibility that a gene that is normally unique to one tissue type might be expressed in another tissue in the disease case.
APAP toxicity, networks and organ-specific biomarkers. In APAP-induced toxicity, the normal conversion of APAP to non-toxic derivates by glucuronidation and sulfation is overwhelmed. APAP is first oxidized by cytochrome P450 enzymes to a toxic metabolite, N-acetyl-p-benzoquinone-imine (NAPQI) (24). Normally, low levels of this highly-reactive electrophile are quickly detoxified by conjugation with hepatic glutathione (GSH). Following APAP overdose, however, the hepatic GSH levels are insufficient to conjugate all of the NAPQI. The surplus forms cysteine adducts to various macromolecules, disrupts numerous critical cellular functions, and elevates innate immune responses which collectively results in centrilobular hepatocyte death (25-26). Depletion of GSH by NAPQI and its ability to detoxify NAPQI is the major cause of APAP hepatotoxicity (27). N-acetylcysteine (NAC), a GSH precursor, is a clinical antidote for excess NAPQI used to treat APAP overdose (28). S-adenosyl-L-methionine (SAMe) is a key physiological precursor of GSH production, as well as the methyl donor in most transmethylation reactions. Endogenous hepatic SAMe concentrations drop dramatically after APAP hepatotoxicity (29). Administration of SAMe provides comparable protective and therapeutic effects to NAC (28,30). Interestingly, we observed that three SAMe metabolic enzymes―MAT1A, GNMT, and BHMT decreased in the liver during injury while appearing elevated in the blood. MAT1A catalyzes the synthesis of SAMe(31). GNMT and BHMT are two methyltransferases regulating metabolism of S-adenosylhomocysteine (SAH) and homocysteine which are precursors of GSH (31-32). Loss of these enzymes would cause a significant decrease of SAMe and GSH and could consequently aggravate the liver injury. There was inverse correlation between the protein concentrations in the liver and in the blood for these three proteins, suggesting that the blood proteins were released from stressed hepatocytes or leaked from dead hepatocytes. Therefore, liver-specific blood proteins MAT1A, GNMT, and BHMT might be useful indicators of hepatic SAMe and GSH states and thus have prognostic value for GSH depletion-related hepatotoxicity.
A mitochondrial blood biomarker. Mitochondrial injury is a major cause of liver toxicity. Because it does not produce GSH, the mitochondrion is the main target of many toxins like APAP(30). Specific mitochondrial injury markers could provide useful diagnostic information regarding the identification of mitochondrial-mediated toxin mechanisms. Prior to this study, there were no good liver-specific mitochondria injury markers identified. In this panel, CPS1 exhibits both high liver specificity and high mitochondrial specificity. CPS1 increased more rapidly than ALT or AST in the early stages of APAP toxicity (1-3 hours post-injection), suggesting that mitochondria might be damaged prior to other cellular components. As a mitochondria- and liver-specific toxicity indicator, CPS1 could provide crucial information for toxicity location identification and for treatment determination.
A membrane-bound, liver-specific blood biomarker. In our blood signature, MB-COMT exhibits different behavior than other markers. COMT catalyzes the transfer of a methyl group from S-adenosylmethionine to catecholamines, including the neurotransmitters dopamine, epinephrine, and norepinephrine. COMT has two isoforms, a 24 kDa soluble form (S-COMT) and a 28 kDa membrane-bound form (MB-COMT). Both are coded by the same transcript, but with different start codons (33). It has been proposed S-COMT and MB-COMT have slightly different properties. MB-COMT has higher affinity for catechol substrates and for coenzyme S-adenosyl-L-methionine (SAMe) (34). By the analyses of the S-COMT deficient mice, Myöhänen et al. revealed that MB-COMT is not associated with the plasma membrane (35). This finding is consistent the previous report that COMT resided in the endoplasmic reticulum (36). With our APAP-overdose, S-COMT protein in mouse liver decreased, whereas MB-COMT increased, especially at 24-48 hours post-injection. COMT mRNA remained constant during liver injury. Therefore, we suggest the possibility that the liver has a mechanism to switch the translation of S-COMT to MB-COMT during APAP toxicity. It is unknown whether the response is related to elevation of catecholamine transmitters, or to depletion of its coenzyme, SAMe. As a major detoxifying enzyme of catecholamine transmitters, MB-COMT might be more efficient than S-COMT in detoxifying the excess. Although low-level COMT expression is widespread in a number of organs, (e.g. brain), it is highly expressed in liver at both the mRNA and protein levels. The mechanism for COMT translational regulation by APAP merits further investigation.
Turnover of blood biomarkers. Diagnostic potential of albumin is limited by its slow turnover and its abundant expression. Blood albumin levels typically drop only in late stage of severe liver injury. In contrast, RBP4 is a protein with rapid turnover. The half-life of RBP4 is approximately twelve hours in circulation (37), whereas the half-life of plasminogen, ceruloplasmin, transferrin, and albumin is 2 days, 5.5 days, 7-10 days, and 18-20 days, respectively (38-39). The short half-life may explain why RBP4 levels dropped quickly at very early stages of liver injury. Notably, RBP4 levels were even more sensitive to APAP liver injury than ALT. RBP4 is the specific carrier for retinol in the blood, moving the key vitamin from liver stores to peripheral tissues. Although mainly produced in liver, RBP4 is also produced in adipocytes and it has been suggested as an insulin-resistance marker. It has been reported that elevated serum RBP4 impairs insulin signaling in muscle and leads to insulin-resistance (40). It has also been suggested that decreasing serum RBP4 levels could be used as antidiabetic therapy (41). However, there are also reports indicating serum RBP4 levels correlate with liver functions indicators such as cholinesterase, albumin, or coagulation factors II or VII in patients with chronic liver diseases (42-43) which is consistent with our findings in the acute liver injury model.
Biomarker signatures and classes. While a few classic blood biomarkers function alone as disease indicators, most future disease diagnostics will require multiple markers functioning together as a "molecular signature." Future clinical toxicity tests need to be sufficiently sensitive and specific to report mechanism-related injury type prior to the onset of irreversible injury. Such assays are unlikely to come from single proteins but rather from panels that includes several classes of biomarkers for reasons discussed. For example, a desirable hepatotoxicity panel could consist of three classes. The first contains proteins leaking into the bloodstream as the cell membrane integrity changes, sometimes as a result of hepatocyte death. A decent example exists in ALT. ALT provides good sensitivity, but does not provide information about the cause of injury (44). More liver-specific markers from different subcellular locations, such as membrane, cytoplasm, mitochondria, peroxisome, etc., should be included to localize the perturbed networks. Eleven markers in our panel belong to this class, CPS1 resides in the mitochondria, AGXT resides in the peroxisome, and MB-COMT resides in the ER. With a range of localizations, they might provide information regarding localization and mechanism. The second class consists of the classical plasma proteins normally secreted by the liver. Toxicity attenuates production first as the liver responds to the stress and later as hepatocytes are lost. This class includes albumin and bilirubin which reflect function in a different manner. Four markers in our panel belong to this class. RBP4 apppears more sensitive than albumin because of shorter half-life. Secreted liver-specific blood proteins are potentially effective biomarkers. After production in liver, secretory proteins are secreted into the peripheral bloodstream and circulate through many organs under normal and disease conditions, thus their concentrations are not determined only liver production, but also by degradation and metabolism by other organs. For example, kidney diseases which change renal perfusion rates can affect plasma protein concentrations (45). Accordingly, plasma proteins with quick turnover-rates are especially promising. The third class consists of proteins whose expression by liver change in a regulated manner in response to specific stimuli. For example, Kidney Injury Molecule-1 (Kim-1) is a response marker for kidney injury (46). There is no comparable marker for liver injury yet. MB-COMT may possibly belong in this class as its level elevated in the liver during hepatotoxicity. A multi-parameter assay containing all three classes of biomarkers should provide the highest performance. The fact that four of these biomarkers (BHMT, FAH, FBP1, DPYS) were found in human liver-injury plasma at significantly higher levels than ALT may relate to their abundance in liver. BHMT is very abundant in the liver, representing 0.6-1.6% of its total proteins (47). With attributes that enhance specificity and sensitivity, it is believed a liver-specific blood panel similar to this example may in time supplement existing liver injury tests.
Abbreviations
APAP: acetaminophen; SAMe: S-adenosyl-L-methionine; COMT: catechol-O-methyltransferase; RBP4: retinol binding protein 4; PSA: prostate-specific antigen; ALT: alanine transaminase; AST: aspartate transaminase; ALP: alkaline phosphatase; GGT: gamma-glutamyl transferase; MPSS: massively parallel signature sequencing; ISB: Institute for Systems Biology; SPRI: surface plasmon resonance imaging; NAPQI: N-acetyl-p-benzoquinone-imine; GSH: glutathione; NAC: N-acetylcysteine; MAT: methionine adenosyltransferase; GNMT: glycine N-methyltransferase; BHMT: betaine--homocysteine S-methyltransferase; SAH: S-adenosylhomocysteine; S-COMT: soluble catechol-O-methyltransferase; MB-COMT: membrane-bound catechol-O-methyltransferase; ER: endoplasmic reticulum; KIM-1: kidney injury molecule-1.
Supplementary Material
Figure S1-Figure S8, and Table S1-Table S7.
Acknowledgements
This work was supported by the United States Army Research Development and Engineering Command (RDECOM) under contract W911SR-07-C-0101, by the Grand Duchy of Luxembourg under the ISB-Luxembourg Project, by the State Key Development Program for Basic Research of China grant 2011CB915502, the State Key Laboratory of Proteomics grant SKLP-K200903, the Chinese Academy of Science (YZ201217), the National Natural Science Foundation of China (31270875), the International S&T Cooperation Program of China (2010DFB33880), and by the Beijing Municipal Natural Science Foundation (5122039).
We thank Dr. Gustavo Glusman for the transcriptomic determination of tissue-specific proteins, Dr. Kai Wang for mouse mRNA microarray analysis, Dr. Lee Rowen for excellent comments. We thank Plexera Bioscience LLC for the ProteomicProcessor, NanoCapture Gold substrates, and technical assistance. We thank Dr. Huajie Wen for providing polyclonal antibodies.
Competing Interests
Zhiyuan Hu, Christopher Lausted, and Leroy Hood report having financial interest in Applied Systems Medicine, which has licensed intellectual property rights relating to proteins appearing in this manuscript.
References
1. Schroder FH, Hugosson J, Roobol MJ. et al. Screening and prostate-cancer mortality in a randomized European study. N Engl J Med. 2009;360:1320-1328
2. Nadler RB, Humphrey PA, Smith DS, Catalona WJ, Ratliff TL. Effect of inflammation and benign prostatic hyperplasia on elevated serum prostate specific antigen levels. J Urol. 1995;154:407-413
3. Amacher DE. The discovery and development of proteomic safety biomarkers for the detection of drug-induced liver toxicity. Toxicol Appl Pharmacol. 2010;245:134-42
4. Yang RZ, Park S, Reagan WJ. et al. Alanine aminotransferase isoenzymes: molecular cloning and quantitative analysis of tissue expression in rats and serum elevation in liver toxicity. Hepatology. 2009;49:598-607
5. Giboney PT. Mildly elevated liver transaminase levels in the asymptomatic patient. Am Fam Physician. 2005;71:1105-1110
6. Ruhl CE, Everhart JE. Relation of elevated serum alanine aminotransferase activity with iron and antioxidant levels in the United States. Gastroenterology. 2003;124:1821-1829
7. Johnston DE. Special considerations in interpreting liver function tests. Am Fam Physician. 1999;59:2223-2230
8. Nathwani RA, Pais S, Reynolds TB, Kaplowitz N. Serum alanine aminotransferase in skeletal muscle diseases. Hepatology. 2005;41:380-382
9. Mofrad P, Contos MJ, Haque M. et al. Clinical and histologic spectrum of nonalcoholic fatty liver disease associated with normal ALT values. Hepatology. 2003;37:1286-1292
10. Marcellin P, Levy S, Erlinger S. Therapy of hepatitis C: patients with normal aminotransferase levels. Hepatology. 1997;26:133S-136S
11. Russo MW, Galanko JA, Shrestha R, Fried MW, Watkins P. Liver transplantation for acute liver failure from drug induced liver injury in the United States. Liver Transpl. 2004;10:1018-1023
12. Larson AM, Polson J, Fontana RJ. et al. Acetaminophen-induced acute liver failure: results of a United States multicenter, prospective study. Hepatology. 2005;42:1364-1372
13. McGill MR, Yan H-M, Ramachandran A, Murray GJ, Rollins DE, Jaeschke H. HepaRG cells: A human model to study mechanisms of acetaminophen hepatotoxicity. Hepatology. 2010;53:974-982
14. Bushel PR, Heinloth AN, Li J. et al. Blood gene expression signatures predict exposure levels. PNAS. 2007;104:18211-18216
15. Ozer J, Ratner M, Shaw M, Bailey W, Schomaker S. The current state of serum biomarkers of hepatotoxicity. Toxicology. 2008;245:194-205
16. Wang K, Zhang S, Marzolf B. et al. Circulating microRNAs, potential biomarkers for drug-induced liver injury. PNAS. 2009;106:4402-7
17. Hood L, Heath JR, Phelps ME, Lin B. Systems biology and new technologies enable predictive and preventative medicine. Science. 2004;306:640-3
18. Brenner S, Johnson M, Bridgham J. et al. Gene expression analysis by massively parallel signature sequencing on microbead arrays. Nat Biotechnol. 2010;18:630-634
19. Lausted C, Hu Z, Hood L. Quantitative serum proteomics from surface plasmon resonance imaging. Mol Cell Prot. 2008;7:2464-74
20. Ross PL, Huang YN, Marchese JN. et al. Multiplexed protein quantitation in Saccharomyces cerevisiae using amine-reactive isobaric tagging reagents. Mol Cell Prot. 2004;3:1154-69
21. Hood BL, Zhou M, Chan KC, Lucas D A, Kim GJ, Issaq HJ. et al. Investigation of the mouse serum proteome. Journal of proteome research. 2005;4(5):1561-8
22. Mallick P, Schirle M, Chen SS, Flory MR, Lee H, Martin D. et al. Computational prediction of proteotypic peptides for quantitative proteomics. Nat Biotechnol. 2007;25(1):125-31
23. Li XJ, Zhang H, Ranish JA, Aebersold R. Automated statistical analysis of protein abundance ratios from data generated by stable-isotope dilution and tandem mass spectrometry. Anal Chem. 2003;75(23):6648-57
24. Manyike PT, Kharasch ED, Kalhorn TF, Slattery JT. Contribution of CYP2E1 and CYP3A to acetaminophen reactive metabolite formation. Clin Pharmacol Ther. 2000;67:275-282
25. Liu ZX, Govindarajan S, Kaplowitz N. Innate immune system plays a critical role in determining the progression and severity of acetaminophen hepatotoxicity. Gastroenterology. 2004;127:1760-1774
26. Larson AM. Acetaminophen hepatotoxicity. Clin Liver Dis. 2007;11:525-48
27. Ruepp SU, Tonge RP, Shaw J, Wallis N, Pognan F. Genomics and Proteomics Analysis of Acetaminophen Toxicity in Mouse Liver. Tox Sci. 2008;65:135-150
28. Terneus MV, Brown JM, Carpenter AB, Valentovic MA. Comparison of S-adenosyl-L-methionine and N-acetylcysteine protective effects on hepatic damage when administered after acetaminophen overdose. Toxicology. 2008;244:25-34
29. Oz HS, McClain CJ, Nagasawa HT, Ray MB, Villiers WJS de, Chen TS. Diverse antioxidants protect against acetaminophen hepatotoxicity. J Biochem Mol Tox. 2004;18:361-8
30. Song Z, McClain CJ, Chen T. S-Adenosylmethionine protects against acetaminophen-induced hepatotoxicity in mice. Pharmacology. 2004;71:199-208
31. Mato JM, Lu SC. Role of S-adenosyl-L-methionine in liver health and injury. Hepatology. 2007;45:1306-1312
32. Martinez-Chantar ML, Vazquez-Chantada M, Ariz U. et al. Loss of the glycine N-methyltransferase gene leads to steatosis and hepatocellular carcinoma in mice. Hepatology. 2008;47:1191-1199
33. Tenhunen J, Ulmanen I. Production of rat soluble and membrane-bound catechol O-methyltransferase forms from bifunctional mRNAs. Biochemical Journal. 1993;296:595-600
34. Lotta T, Vidgren J, Tilgmann C. et al. Kinetics of human soluble and membrane-bound catechol O-methyltransferase: a revised mechanism and description of the thermolabile variant of the enzyme. Biochemistry. 1995;34:4202-10
35. Myöhänen TT, Schendzielorz N, Männistö PT. Distribution of catechol-O-methyltransferase proteins and enzymatic activities in wild-type and soluble COMT deficient mice. J Neurochemistry. 2010;113:1632-43
36. Ulmanen I, Peränen J, Tenhunen J. et al. Expression and intracellular localization of catechol O-methyltransferase in transfected mammalian cells. Euro J Biochem. 1997;243:452-9
37. Takagi Y. [Nutrition assessment protein]. Rinsho byori. Japanese J Clin Path. 2004;52:301-6
38. Miyashita C, Wenzel E, Heiden M. Plasminogen: a brief introduction into its biochemistry and function. Haemostasis. 1998;18(Suppl 1):7-13
39. Hellman NE, Gitlin JD. Ceruloplasmin metabolism and function. Annual Rev Nut. 2002;22:439-58
40. Yang Q, Graham TE, Mody N. et al. Serum retinol binding protein 4 contributes to insulin resistance in obesity and type 2 diabetes. Nature. 2005;436:356-362
41. Graham TE, Yang Q, Blüher M, Hammarstedt A, Ciaraldi TP, Henry RR, Wason CJ, Oberbach A, Jansson PA, Smith U, Kahn BB. Retinol-binding protein 4 and insulin resistance in lean, obese, and diabetic subjects. N Engl J Med. 2006;354:2552-2563
42. Yagmur E, Weiskirchen R, Gressner AM, Trautwein C, Tacke F. Insulin resistance in liver cirrhosis is not associated with circulating retinol-binding protein 4. Diabetes Care. 2007;30:1168-1172
43. Tacke F, Weiskirchen R, Trautwein C. Liver function critically determines serum retinol-binding protein 4 (RBP4) levels in patients with chronic liver disease and cirrhosis. Hepatology. 2008;48:1724-1725
44. Amacher DE. A toxicologist's guide to biomarkers of hepatic response. Hum Exp Toxicol. 2002;21:253-262
45. Wang E-J, Snyder RD, Fielden MR, Smith RJ, Gu Y-Z. Validation of putative genomic biomarkers of nephrotoxicity in rats. Toxicology. 2008;246:91-100
46. Ichimura T, Bonventre JV, Bailly V. et al. Kidney injury molecule-1, a putative epithelial cell adhesion molecule containing a novel immunoglobulin domain, is up-regulated in renal cells after injury. J Biol Chem. 1998;273:4135-42
47. McKeever MP, Weir DG, Molloy A, Scott JM. Betaine-homocysteine methyltransferase: organ distribution in man, pig and rat and subcellular distribution in the rat. Clinical Science. 1991;81:551-6
Author contact
![]() Corresponding author: Zhiyuan Hu, National Center for NanoScience and Technology, 11 BeiYiTiao, ZhongGuanCun, Beijing, 100190 China. Tel: 8610-82545643 Fax: 8610-62656765 or Christopher Lausted, Institute for Systems Biology, 401 Terry Avenue N, Seattle, Washington Tel: 98109 USA. 206-732-1276 Fax: 206-732-1299.
Corresponding author: Zhiyuan Hu, National Center for NanoScience and Technology, 11 BeiYiTiao, ZhongGuanCun, Beijing, 100190 China. Tel: 8610-82545643 Fax: 8610-62656765 or Christopher Lausted, Institute for Systems Biology, 401 Terry Avenue N, Seattle, Washington Tel: 98109 USA. 206-732-1276 Fax: 206-732-1299.