Impact Factor
 Global reach, higher impact
Theranostics 2013; 3(3):190-200. doi:10.7150/thno.5825 This issue Cite
Research Paper
Longitudinal Bioluminescence Imaging of the Dynamics of Doxorubicin Induced Apoptosis
Gang Niu1, Lei Zhu1, 2, Don N. Ho1, Fan Zhang1, 2, Haokao Gao1, Qimeng Quan1, Naoki Hida1, Takeaki Ozawa3, Gang Liu2 ![]() , Xiaoyuan Chen1
, Xiaoyuan Chen1
1. Laboratory of Molecular Imaging and Nanomedicine (LOMIN), National Institute of Biomedical Imaging and Bioengineering (NIBIB), National Institutes of Health (NIH), Bethesda, MD 20892, USA.
2. Center for Molecular Imaging and Translational Medicine, School of Public Health, Xiamen University, Xiamen, Fujian, 361002, China.
3. Department of Chemistry, School of Science, The University of Tokyo, 7-3-1 Hongo, Bunkyo-ku, Tokyo 113-0033, Japan.
Received 2013-1-7; Accepted 2013-2-5; Published 2013-2-21
Abstract
Objectives: Most chemotherapy agents cause tumor cell death primarily by the induction of apoptosis. The ability to noninvasively image apoptosis in vivo could dramatically benefit pre-clinical and clinical evaluation of chemotherapeutics targeting the apoptotic pathway. This study aims to visualize the dynamics of apoptotic process with temporal bioluminescence imaging (BLI) using an apoptosis specific bioluminescence reporter gene. Methods: Both UM-SCC-22B human head and neck squamous carcinoma cells and 4T1 murine breast cancer cells were genetically modified with a caspase-3 specific cyclic firefly luciferase reporter gene (pcFluc-DEVD). Apoptosis induced by different concentrations of doxorubicin in the transfected cells was evaluated by both annexin V staining and BLI. Longitudinal BLI was performed in xenografted tumor models at different time points after doxorubicin or Doxil treatment, to evaluate apoptosis. After imaging, DNA fragmentation in apoptotic cells was assessed in frozen tumor sections using TUNEL staining. Results: Dose- and time-dependent apoptosis induced by doxorubicin in pcFluc-DEVD transfected UM-SCC-22B and 4T1 cells was visualized and quantified by BLI. Caspase-3 activation was confirmed by both caspase activity assay and GloTM luciferase assay. One dose of doxorubicin treatment induced a dramatic increase in BLI intensity as early as 24 h after treatment in 22B-pcFluc-DEVD xenografted tumors. Sustained signal increase was observed for the first 3 days and the fluorescent signal from ex vivo TUNEL staining was consistent with BLI imaging results. Long-term imaging revealed that BLI signal consistently increased and reached a maximum at around day 12 after the treatment with one dose of Doxil. Conclusions: BLI of apoptosis with pcFluc-DEVD as a reporter gene facilitates the determination of kinetics of the apoptotic process in a real-time manner, which provides a unique tool for drug development and therapy response monitoring.
Keywords: apoptosis, cyclic firefly luciferase, bioluminescence imaging, doxorubicin, caspase-3.
Introduction
Apoptosis, known as a natural, orderly, and energy-dependent form of programmed cell death, is central to homeostasis and normal development and physiology in all multi-cellular organisms [1, 2]. The dysregulation of apoptosis plays a fundamental role in a number of disorders, including the growth of tumors. Thus, inducing apoptosis in tumor cells is an extremely promising approach as anti-cancer therapy [3, 4]. In fact, many chemotherapeutics exert their effects by inducing a final pathway that leads to apoptosis [5, 6]. Detection and quantification of apoptosis in cancer patients undergoing treatments are of significant clinical value for the assessment of therapeutic efficacy [7]. Accordingly, noninvasive imaging of apoptosis would be a significant advance for rapid and dynamic screening as well as validation of experimental therapeutics for new drug development [8-11]. Consequently, considerable efforts have been made in developing noninvasive imaging methods to evaluate apoptosis.
Molecular imaging enables noninvasive imaging of cellular function and the follow-up of the molecular process in living organisms [12-16]. To date, several potential steps in the apoptosis process can be imaged using various imaging modalities, including optical imaging [7, 8, 17, 18], magnetic resonance imaging (MRI) [19-21], and radionuclide imaging [22, 23]. However, one of the key challenges is to identify and validate apoptosis biomarkers and develop corresponding imaging sensors [24, 25].
A family of cysteine aspartate specific proteases known as the “caspases” play a central role in mediating the initiation and propagation of apoptosis [1, 26], and represent target molecules for apoptosis imaging [11, 27, 28]. The peptide sequence DEVD (aspartic acid-glutamic acid-valine-aspartic acid), can be recognized and cleaved by the effector caspase-3/7. So far, several apoptosis reporter genes have been constructed based on the DEVD peptide sequence, which enabled visualization and quantification of apoptosis in a non-invasive manner [29-32]. However, most of these reporters are not well suited for kinetic analysis of caspase-3 activation in real-time and high-throughput functional screening due to the low sensitivity [33]. Ozawa et al. [34, 35] have developed an apoptosis biosensor - cyclic firefly luciferase (pcFluc-DEVD) by fusing two fragments of DnaE intein to neighboring ends of luciferase separated by DEVD. In cells undergoing apoptosis, a caspase-3-specific cleavage of genetically encoded cyclic luciferase occurs, resulting in the restoration of luciferase activity that can be detected in cells or living animals by bioluminescence imaging. However, these pilot studies involved only transient transfection that is good for proof-of-principle but not practical longitudinal evaluations of biological processes.
In this study, we genetically modified human head and neck squamous carcinoma UM-SCC-22B cells and murine breast cancer 4T1 cells with pcFluc-DEVD. After treatment with doxorubicin, bioluminescence signal changes in cells and tumor models were non-invasively acquired at different time points and correlated with caspase-3 activity (Fig. 1). Through these systematic studies, we expected that the non-invasive temporal imaging based on the apoptosis reporter gene will be used to map the kinetics of drug-induced caspase activation and apoptosis.
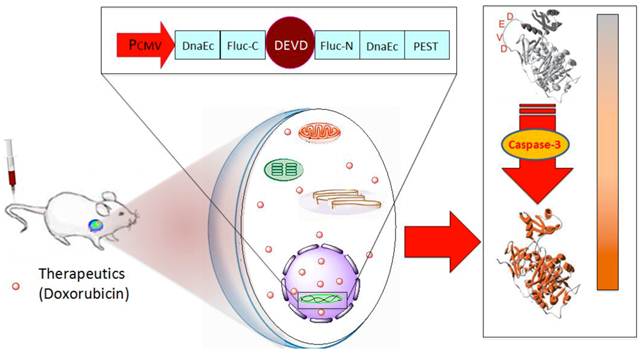
Schematic overview of the pcFluc-DEVD system. The reporter gene is composed of an engineered firefly luciferase, of which the N- and C-terminals are linked with DEVD, a substrate sequence of caspase-3. Upon caspase-3 activation during apoptosis, the DEVD sequence is cleaved and the cyclized luciferase recovers its activity. This biosensor can be used for imaging apoptosis induced by various therapeutic interventions to monitor effects of cytotoxic compounds or novel pharmacological chemicals, as most cells activate caspase-3 during apoptosis. The cleavage site of this system can also be modified to “report” on the kinetics of a variety of proteolytic processes in vitro and in vivo by using bioluminescence imaging.
Materials and Methods
Cell lines and transfection
The human head and neck squamous carcinoma UM-SCC-22B cells were obtained from the University of Michigan. The murine breast cancer 4T1 cells were purchased from the American Type Culture Collection (ATCC). They were maintained in DMEM medium supplemented with 10% fetal bovine serum (FBS), 1% glutamine, 100 U/ml penicillin and 100 mg/ml streptomycin (Invitrogen, Carlsbad, CA). To establish the cell lines that stably expresses cyclic firefly luciferase, transfection was performed with pcFluc-DEVD DNA[34] and Lipofectamine 2000 (Invitrogen). Selection was made by adding selective medium containing 1 mg/mL G418 antibiotic (Sigma) every 2-3 days. Two weeks later, the cells were subcloned in 24-well plates. When reaching 80% confluence, the cells were treated with doxorubicin and imaged using a Xenogen IVIS-100 system (Caliper Life Sciences). Positive clones were identified and named as 22B-pcFluc-DEVD and 4T1-pcFluc-DEVD, respectively. No significant difference between the transfected and the parental cells was observed in terms of proliferation or tumorigenicity. The cells were also transfected with plasmids containing firefly luciferase expressing cassette with the similar procedure. The selected cells were named as 22B-Fluc and 4T1-Fluc, respectively.
Cytotoxicity assay
The cytotoxic effect of doxorubicin was determined by MTT assay [36]. Cells seeded in a 96-well plate (5 × 10³ cells/well) were treated with different concentrations of doxorubicin up to 50 mg/L for 24 h. Then, tetrazolium dye, 3-(4, 5-dimethylthiazol-2)-2, 5-diphenyl-2H-tetrazolium bromide (MTT, Sigma) was added to the medium for 4 h. The absorbance at 570 nm (reference wavelength: 630 nm) was measured with a microplate reader (Synergy 2, Bioteck). Optical density (OD) which reflects the viable cell population in each well was determined. Percentage of growth inhibition was determined using the equation (1-ODt/ODc) ×100, wherein ODt and ODc are the absorbance of cells in treated and control cell cultures, respectively.
Assessment of apoptosis
Apoptosis was induced by incubating cells in fresh medium containing different concentrations of doxorubicin ranging from 0 to 1 mg/L. Cells were observed under microscope throughout the course of the experiment for the evaluation of the morphological features associated with apoptosis. Annexin V staining was performed using FITC-Annexin Apoptosis Detection Kit (Sigma). The control and drug treated cells were incubated with FITC-Annexin V for 20 min. Then the cells were washed by 1x phosphate buffered saline (PBS) and fluorescence was observed under an epifluorescence microscope (X81; Olympus).
The activity of caspase-3 was determined by a caspase colorimetric assay kit (Sigma) according to the manufacturer's protocol. Cells treated with different concentrations of doxorubicin were collected, washed with PBS and lysed in a lysis buffer. The chromophore p-nitroaniline (p-NA) was quantified with a spectrophotometer at a wavelength of 405 nm and p-NA standard was used for calibration of the specific caspase-3 activity in the samples.
In vitro bioluminescence imaging
Bioluminescence imaging (BLI) of doxorubicin-induced apoptosis was initiated before drug administration for baseline values and performed throughout the course of the experiment. Subconfluent growing 22B-pcFluc-DEVD cells were seeded at a density of 2 x 10⁵/mL in a 24-well plate and treated with doxorubicin at incremental concentrations for 24 h. Then D-luciferin was added to each well and luciferase activity was measured using a Xenogen Lumina II system. Luminescent signal for each well was measured and plotted as average values. In another set of experiments, the cells were treated with 1 mg/mL doxorubicin for 3 h. Then all cells were washed, and cultured in fresh medium. At different time points till 48 h, the cell-containing plates were imaged and measured as described above.
For the Z-DEVD-Aminoluciferin assay, a parallel set of 22B-Fluc cells were treated using the same experimental protocol, and then the Z-DEVD-Aminoluciferin soluble substrate (VivoGloTM Caspase-3/7 Substrate, Promega Corp.) was added to the medium and bioluminescence signal was measured by a Xenogen Lumina II system.
In vivo studies
All animal experiments were conducted in accordance with an NIH Clinical Center ACUC approved protocol. Xenografted tumor models were prepared by subcutaneous injection of 5x10⁶ 22B-pcFluc-DEVD cells suspended in PBS into female athymic nude mice (6-7 weeks). When tumors reached a diameter of about 6 mm, mice were randomized into two groups (n = 5/group). One group of mice received 1 dose of 5 mg/kg of doxorubicin through intravenous administration, while the control group of mice received one dose of PBS only. Before imaging, mice were anesthetized with a 2% isofluorane/air mixture and given a single i.p. dose of 150 mg/kg D-luciferin in normal saline. Bioluminescence imaging was accomplished between 5 and 10 min post-luciferin administration. Signal intensity was quantified as the sum of all detected photon counts within a region of interest prescribed over the tumor site. Tumor size was monitored with a digital caliper and tumor volume was calculated as ab2/2, where a is the longest diameter and b is the shortest diameter.
In another set of in vivo imaging studies, at day 20 after tumor inoculation, one group of mice received 1 dose of 5 mg/kg of Doxil (doxorubicin HCl liposome injection, Ben Venue Laboratories, Inc.) through intravenous administration, while the control group of mice received PBS only. BLI and tumor measurement were performed as described above. The second dose of Doxil (5 mg/kg) was given at day 40 after tumor inoculation.
TUNEL Staining
At different time points, tumors were harvested and sectioned. DNA fragmentation was analyzed by terminal deoxynucleotidyl transferase mediated dUTP nick end labeling (TUNEL) assay using a commercial kit (Maxin-Bio) according to the manufacturer's protocol.
Statistical analysis
Quantitative data were expressed as mean ± SD. Means were compared using Student's unpaired test. P value of < 0.05 was considered statistically significant.
Results
Cell engineering with cyclic firefly luciferase
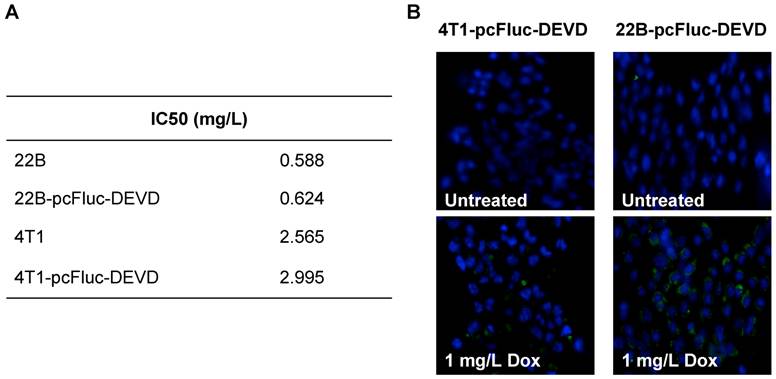
We genetically engineered the apoptosis reporter gene pcFluc-DEVD into two tumor cell lines, UM-SCC-22B and 4T1. The stably transfected UM-SCC-22B and 4T1 cells retained the similar morphology and growth kinetics to their parental cells. After treatment with various concentrations of doxorubicin for 24 h, the cytotoxicity was estimated by a MTT viability test. Doxorubicin inhibited the growth of all cells tested in a dose-dependent manner and the IC50s of doxorubicin for those cells were listed in Fig. 2A. Compared with 4T1 cells, UM-SCC-22B cells were more sensitive to doxorubicin treatment. As expected, the transfected cells showed a similar doxorubicin response pattern to their parental cells. For example, the IC50 for UM-SCC-22B is 0.588±0.099 mg/L while that for 22B-pcFluc-DEVD is 0.624±0.126 mg/L (p > 0.05).
(A) IC50s of doxorubicin for 4T1-pcFluc-DEVD, 22B-pcFluc-DEVD, and their parental cells. (B) Representative images of Annexin V staining assay on cells treated with doxorubicin (1 mg/L) for 24 h (Magnification 100×). Green color represents positive Annexin V staining and blue color is from DAPI, a dye for staining nuclei.
Bioluminescence imaging of doxorubicin-induced apoptosis
After exposure to doxorubicin for 24 h, the treated cells began to show morphologic features of apoptosis and some cells rounded up off the plate with smaller and circular shape. The number of cells exhibiting apoptosis morphology was increased with increasing doxorubicin concentrations, reflecting increasing apoptosis levels. The apoptosis induced by doxorubicin was further demonstrated by using Annexin V staining assay, one of the most intensively used methods to characterize cell apoptosis. As shown in Fig. 2B, compared to the untreated group, the doxorubicin treated groups showed significantly more cell apoptosis. Compared with 4T1-pcFluc-DEVD cells, much higher apoptosis induction happened in 22B-pcFluc-DEVD cells, indicated by stronger fluorescent signal on cell membrane.
Cytosolic extracts of 4T1/22B-pcFluc-DEVD cells treated with doxorubicin were measured by a colorimetric reaction using the caspase-3 substrate, Ac-DEVD-pNA [37]. A dose-dependent increase in absorbance at 450 nm was observed in doxorubicin treated cells, indicating increased caspase-3 activity. In addition, consistent with the lower drug sensitivity, the caspase-3 activities in 4T1-pcFluc-DEVD cells were lower than that in 22B-pcFluc-DEVD cells (Figure 3A).
Characterization of pcFluc-DEVD genetically modified UM-SCC-22B and 4T1 cells. (A) BLI quantification of doxorubicin induced caspase-3 activation. Cells were seeded in a 24-well plate and treated with doxorubicin of different concentrations for 24 h. (B) The activity of caspase-3 determined by a caspase colorimetric assay kit (Sigma) according to the manufacturer's protocol. (C) Comparison of cyclic luciferase/D-luciferin and wild type firefly luciferase/Z-DEVD-aminoluciferin. Both assays showed a dose-dependent BLI signal intensity increase and there is a significant correlation between the two assays (R2=0.9995). The cyclic luciferase showed much higher sensitivity than the Z-DEVD-Aminoluciferin assay.
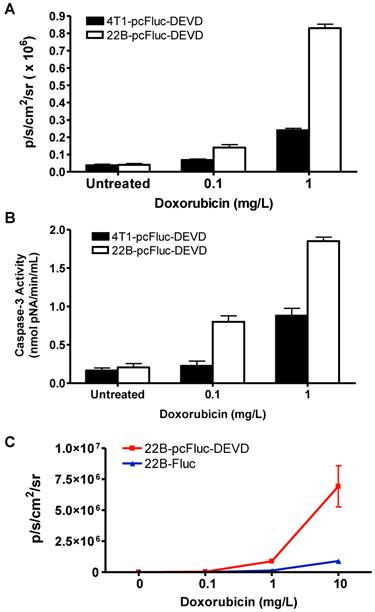
As caspase-3 activation restored the cyclic luciferase into a functional linear configuration, a dose-dependent increase of photon intensity was observed in the doxorubicin treated cells. As expected, photon intensity in treated 22B-pcFluc-DEVD cells was much higher than that in 4T1-pcFluc-DEVD cells treated with same concentration of doxorubicin. Treatment with 0.1 and 1 mg/L of doxorubicin for 24 h induced 1.8-fold and 6.3-fold increase of BLI signal in 4T1-pcFluc-DEVD cells, while 3.5-fold and 21-fold increase was observed in 22B-pcFluc-DEVD cells (Figure 3B). In view of the positive correlation between caspase-3 activity measured by Ac-DEVD-pNA and BLI signal, it is feasible to visualize and quantify doxorubicin induced apoptosis in a noninvasive way using BLI.
BLI using Z-DEVD-aminoluciferin as the substrate has been demonstrated as a sensitive and rapid reporter for apoptosis in wild-type firefly luciferase expressing cells. Upon caspase-3/7 activation during apoptosis, the DEVD is cleaved and then free aminoluciferin was consumed by the luciferase, generating a luminescent signal that is proportional to caspase activity [17, 38]. The BLI signal from Z-DEVD-Aminoluciferin assay showed a dose-dependent increase in doxorubicin treated 22B-Fluc cells. With 10 mg/L of doxorubicin, a 35-fold increase of photon intensity was observed in 22B-Fluc cells. Correlated well with the Z-DEVD-Aminoluciferin assay (R2 = 0.9995), the cyclic firefly luciferase in 22B-pcFluc-DEVD cells was more sensitive with much higher photon intensity and fold increase (270-fold increase of photon intensity after treatment with 10 mg/L of doxorubicin) (Figure 3C).
In vitro real-time imaging of apoptosis
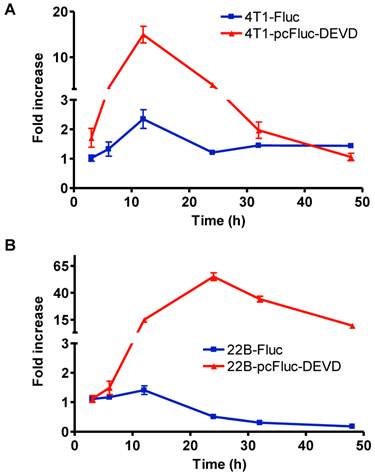
To check the efficacy of cyclic firefly luciferase in monitoring apoptosis in real-time, we further investigated the time course of doxorubicin-induced caspase-3 activation. Cells stably transfected with wild-type firefly luciferase, 4T1-Fluc and 22B-Fluc, were included to reflect cell viability. After exposure to 1 mg/L of doxorubicin for 3 h, all cells were washed, and cultured in fresh medium. At different time points, the cell-containing plates were imaged using a cooled CCD camera. As shown in Figure 4A, within the first 12 h, 4T1 cells consistently grew with an increase of BLI signal from wild-type firefly luciferase. Cell viability then decreased at 24 h after initial treatment and showed recovery at late time point. The signal from the cyclic luciferase also reached a peak at 12 h and then began to consistently decrease with time. Since UM-SCC-22B cells are more sensitive to doxorubicin, the signal from the wild-type firefly luciferase decreased with time and reached a lowest point at 48 h after treatment. Meanwhile, an increase in bioluminescence signal from cyclic luciferase increased dramatically with time and reached the maximum at 24 h then decreased. The maximum fold increase was as high as 55.0 ± 6.2, indicating intensive doxorubicin- induced caspase activation in UM-SCC-22B cells.
Real-time monitoring of apoptosis induced by doxorubicin in vitro. 4T1 (A) and UM-SCC-22B (B) cells stably expressing cyclic firefly luciferase (denoted as 4T1-pcFluc-DEVD and 22B-pcFluc-DEVD respectively) were seeded in a 24-well plate and treated with doxorubicin (1 mg/L) for 3 h before washing the cells and changing the medium. At different time points after, BLI was performed to monitor the signal from the DEVD containing cyclic luciferase for apoptosis and the signal from wild-type luciferase for cell viability in parallel plates. The average fold increase of BLI signal was plotted against with the time after treatment started.
In vivo real-time imaging of doxorubicin-induced apoptosis
In order to evaluate the feasibility of non-invasively measuring apoptosis in vivo, we extended this approach to 22B-pcFluc-DEVD mouse xenograft models. Doses of doxorubicin were selected to mimic high dose strategies used in clinical chemotherapy regimens. As expected, control tumors showed minimal change in BLI signal throughout the course of the experiment while tumor size consistently increased (Figure 5). Doxorubicin treatment induced a dramatic increase in BLI intensity as early as 24 h after initial treatment. A sustained signal increase was observed during the first 3 days, until the experiment was terminated in order to collect tumor samples for TUNEL staining.
In vivo bioluminescence imaging of caspase activation in 22B-pcFluc-DEVD tumors after doxorubicin treatment. (A) Representative bioluminescent images of mice treated with one dose of doxorubicin (5 mg/kg). (B) Quantification of BLI signal over tumor region. (C) TUNEL staining of tumor sections (Magnification 20×). Red color represents doxorubicin and green color represents positive TUNEL staining. Blue color is from DAPI, a dye for staining nuclei.
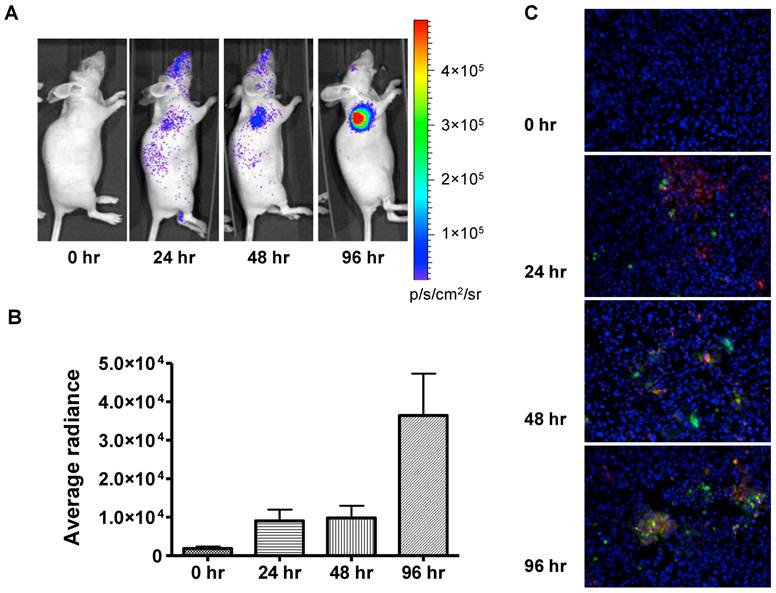
The fluorescent signal from TUNEL staining is consistent with BLI results. At 24 h after treatment, patchy distribution of doxorubicin indicated by the red fluorescent signal was observed along with sporadic apoptotic cells. The signal from the apoptotic cells increased along with time and colocalized with doxorubicin signal (Figure 5C).
In vivo imaging of time course of doxorubicin-induced apoptosis
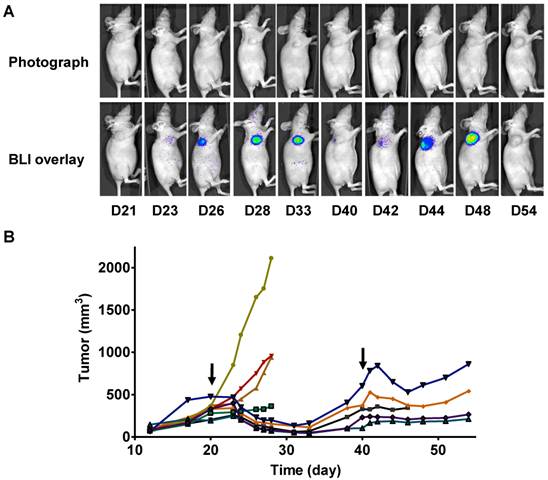
In a parallel study, we performed longitudinal BLI in a set of mice bearing 22B-pcFluc-DEVD tumors. Figure 6A shows a series of photograph and BLI overlaid pictures of one representative mouse received two doses of Doxil at 5 mg/kg each. The tumor growth curve was shown in figure 6B. At day 20 after tumor inoculation, the treated group received the first dose of Doxil (5 mg/kg). Tumor sizes in the control group quickly reached the size of 2000 mm3, which was the subject endpoint for the animal study protocol. The treated tumors showed response to doxorubicin after 2 days and the tumor size decreased with time. Once reaching the nadir at around 12 days after treatment, the tumors started to re-grow. After treatment with the second dose of Doxil at day 40, the tumors showed shrinkage again but with less magnitude and the tumor growth rebounded quicker than the first time.
Longitudinal bioluminescence imaging of caspase activation in 22B-pcFluc-DEVD tumors after Doxil treatment. (A) Representative photographic images overlaid with bioluminescence images of 22B-pcFluc-DEVD tumor-bearing mice treated with two doses of Doxil (5 mg/kg each). (B) Tumor size decreases and then rebounds after Doxil treatment. The arrows designate administration of Doxil. (C). BLI signal changes along with time in response to Doxil treatment. The curves in the circle are representative of the control mice treated with PBS. (D) Average tumor growth curve and BLI changes along with time and have reverse correlation in response to Doxil treatments.
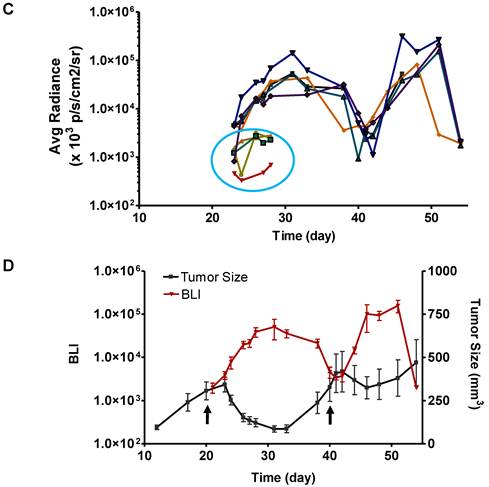
With BLI, the caspase activity was monitored along with time and BLI signal intensity of each tumor individually recorded was presented in Figure 6 C&D. Consistent with the previous data, BLI signal consistently increased and reached a maximum at around day 12 after the treatment. Then the BLI signal intensity decreased as tumor growth rebounded. The second dose of Doxil also induced BLI signal increase with the similar pattern.
Discussion
It is well known that most chemotherapeutic agents cause tumor cell death primarily by induction of apoptosis, and resistance to anticancer treatment is widely believed to involve mutations that lead to deregulated cellular proliferation and suppression of mechanisms that enable apoptosis [39]. The anthracycline antibiotic doxorubicin is a chemotherapeutic agent with strong activity against a wide range of human malignant neoplasms [40]. Doxorubicin induces cell apoptosis probably through DNA intercalation [41] and formation of free radicals [42]. We found that doxorubicin activated caspase3/7 in both UM-SCC-22B and 4T1 cells in a dose and time-dependent pattern. Luciferase activity was restored by transforming from cyclic form to linear form after DEVD cleavage (Figure 3). Consequently, there is positive correlation between BLI signal intensity and caspase activity. Moreover, the cyclic firefly luciferase correlated very well with the Z-DEVD-aminoluciferin assay and had much higher signal intensity as observed in 22B-pcFluc-DEVD cells. After systemic administration, doxorubicin also induced increased BLI signal intensity over the tumor region (Figure 5). Consistent with the previous reports [34], these data suggest that this DEVD sequence containing reporter gene could be used as a reliable marker for non-invasive imaging of caspase 3/7 activation during apoptosis.
In vitro cell experiments revealed that the patterns of apoptosis induced by the same dose of doxorubicin were different in sensitive 22B-pcFluc-DEVD as compared to insensitive 4T1-pcFluc-DEVD cells. The signal reached a maximum at 12 h after doxorubicin treatment then dropped sharply in 4T1-pcFluc-DEVD cells. In 22B-pcFluc-DEVD cells, the signal intensity was much higher than that in 4T1-pcFluc-DEVD cells and reached a peak at 24 h after drug treatment. In fact, with normalization of the BLI signal intensity from 22B-pcFluc-DEVD to the viable cell numbers in each well, we found that the ratios consistently increased with time till 48 h. In vivo experiments with UM-SCC-22B tumor bearing mice showed that with one dose of doxorubicin, a detectable increase of BLI signal was observed at 24 h after treatment. However, at 96 h after treatment, the signal is much higher than that at 24 and 48 h (p < 0.001).
It has been generally agreed that apoptosis is a very complicated and dynamic processes which still need further investigation to be fully understood [24]. Varying treatment in different tumor types may induce different patterns of apoptosis. For example, Meyn et al. [43] evaluated the magnitude and kinetics of apoptosis induction in tumors from mice treated with cisplatin. By morphometric analysis of histological sections of the tumors, they found the maximum apoptotic response was around 18 h after treatment for MCa-4 tumors while around 40 h for Oca-1 tumors. It also has been found that accelerated light boron ions induced maximal apoptosis at 72 h after irradiation [44]. In a recent study, increased uptake of 99mTc-annexin V was observed at 1 and 3 h after paclitaxel administration and then declined to levels even lower than baseline. A peak in TUNEL-positive tumor cells was reached 3 h after paclitaxel administration [45].
To our surprise, we found that BLI signal induced by one dose of Doxil reached the maximum after around day 12 after the treatment, when the average tumor size almost reached the minimum (Figure 6). We speculated that this phenomenon may be caused by several reasons. First of all, with BLI imaging on the live animals, we recorded the overall signal from the whole tumor instead of one single cell. The imaging results demonstrated that the total caspase activation kept increasing in the whole tumor, which can be further substantiated by the patchy distribution of the drug administered. Secondly, the inconsistence of the measured time frame of treatment induced apoptosis may be due to the different markers used by different groups. For example, once the apoptotic cells are engulfed by macrophages, cell surface exposed phosphatidylserine (PS) would be inaccessible by annexin V-based staining or imaging while the luciferase enzymatic activity may still sustain for a period of time. Protein engineering may be needed in this case to develop so-called “short half-life” luciferase.
With genetically modified human and murine cancer cells, we successfully applied the apoptosis responsive cyclic luciferase reporter, pcFluc-DEVD, for noninvasive and real time assessment of drug-induced apoptosis. Although the BLI methods established in this study cannot be directly translated into the clinic, it does have the potential to serve as an important tool for both therapeutic drug and imaging probe discovery. First, this strategy can be used as a powerful platform for high-throughput evaluation of drug candidates, due to the low-cost, simplicity, short acquisition times, and simultaneous measurement of multiple animals. Among the designs of DEVD containing luciferase based reporter genes which have been reported [7, 8, 33], pcFluc-DEVD showed very high signal increase magnitude both in vitro and in vivo although no direct comparison has been done. This reporter gene is also much more sensitive than the wild type firefly luciferase with Z-DEVD-aminoluciferin [46] (Figure 3C), which facilitates in vivo applications.
Radionuclide tracers are more promising for clinical translation. For example, Annexin V has been labeled with various radionuclides for both SPECT and PET imaging [47, 48]. However, the fast kinetic of apoptotic process is problematic for optimization of imaging time and intervals. Longitudinal BLI with the same group of animals will be of great help to evaluate the optimal time frame for imaging apoptosis with other imaging modalities including PET/SPECT. Consequently, this reporter gene based imaging platform will facilitate the development of novel imaging probes to visualize and quantify tumor apoptosis in a clinical setting. Moreover, the different kinetic pattern of the drug-induced apoptosis revealed by BLI imaging has the potential to provide help in nano-formulated drug development which is aiming to improve drug delivery and release.
Conclusion
After confirming the sensitivity and specificity of the caspase-3 specific cyclic firefly luciferase reporter gene (pcFluc-DEVD) in vitro, we successfully visualized and quantified doxorubicin-induced apoptosis in tumor cells and xenografted tumors longitudinally. Altogether, BLI of apoptosis with pcFluc-DEVD as a reporter gene facilitates the determination of kinetics of apoptotic process in a real-time manner. This molecular probe provides a unique tool for drug development, therapy response monitoring, drug delivery and release and radionuclide imaging probe development.
Acknowledgements
This work was supported by the Major State Basic Research Development Program of China (973 Program) (No. 2013CB733800 and 2013CB733802), National Science Foundation of China (NSFC) (81101101, 81201086, 81201129, 51273165), Chinese Academy of Sciences professorship for Senior International Scientists (2011T2J06), Key Project of Chinese Ministry of Education (212149), and the Intramural Research Program (IRP) of the National Institute of Biomedical Imaging and Bioengineering (NIBIB), National Institutes of Health (NIH).
Competing Interests
The authors have declared that no competing interest exists.
References
1. Hengartner MO. The biochemistry of apoptosis. Nature. 2000;407:770-6 doi:10.1038/35037710
2. Elmore S. Apoptosis: a review of programmed cell death. Toxicol Pathol. 2007;35:495-516 doi:779478428 [pii]10.1080/01926230701320337
3. Igney FH, Krammer PH. Death and anti-death: tumour resistance to apoptosis. Nat Rev Cancer. 2002;2:277-88 doi:10.1038/nrc776
4. Fesik SW. Promoting apoptosis as a strategy for cancer drug discovery. Nat Rev Cancer. 2005;5:876-85 doi:nrc1736 [pii]10.1038/nrc1736
5. Johnstone RW, Ruefli AA, Lowe SW. Apoptosis: a link between cancer genetics and chemotherapy. Cell. 2002;108:153-64 doi:S0092867402006256 [pii]
6. Kaufmann SH, Earnshaw WC. Induction of apoptosis by cancer chemotherapy. Exp Cell Res. 2000;256:42-9 doi:10.1006/excr.2000.4838S0014-4827(00)94838-9 [pii]
7. Laxman B, Hall DE, Bhojani MS, Hamstra DA, Chenevert TL, Ross BD. et al. Noninvasive real-time imaging of apoptosis. Proc Natl Acad Sci U S A. 2002;99:16551-5 doi:10.1073/pnas.252644499252644499 [pii]
8. Coppola JM, Ross BD, Rehemtulla A. Noninvasive imaging of apoptosis and its application in cancer therapeutics. Clin Cancer Res. 2008;14:2492-501 doi:14/8/2492 [pii]10.1158/1078-0432.CCR-07-0782
9. Niu G, Chen X. Has molecular and cellular imaging enhanced drug discovery and drug development? Drugs R D. 2008;9:351-68 doi:962 [pii]
10. Antczak C, Takagi T, Ramirez CN, Radu C, Djaballah H. Live-cell imaging of caspase activation for high-content screening. J Biomol Screen. 2009;14:956-69 doi:1087057109343207 [pii]10.1177/1087057109343207
11. Ozaki M, Haga S, Ozawa T. In vivo monitoring of liver damage using caspase-3 probe. Theranostics. 2012;2:207-14 doi:10.7150/thno.3806
12. Liu G, Swierczewska M, Lee S, Chen X. Functional nanoparticles for molecular imaging guided gene delivery. Nano Today. 2010;5:524-39
13. Liu G, Swierczewska M, Niu G, Zhang X, Chen X. Molecular imaging of cell-based cancer immunotherapy. Mol Biosyst. 2011;7:993-1003 doi:10.1039/c0mb00198h
14. Liu G, Yang H, Zhang XM, Shao Y, Jiang H. MR imaging for the longevity of mesenchymal stem cells labeled with poly-L-lysine-Resovist complexes. Contrast Media Mol Imaging. 2010;5:53-8 doi:10.1002/cmmi.362
15. Niu G, Gaut AW, Ponto LL, Hichwa RD, Madsen MT, Graham MM. et al. Multimodality noninvasive imaging of gene transfer using the human sodium iodide symporter. J Nucl Med. 2004;45:445-9
16. Zhang L, Lee KC, Bhojani MS, Khan AP, Shilman A, Holland EC. et al. Molecular imaging of Akt kinase activity. Nat Med. 2007;13:1114-9 doi:nm1608 [pii]10.1038/nm1608
17. Hickson J, Ackler S, Klaubert D, Bouska J, Ellis P, Foster K. et al. Noninvasive molecular imaging of apoptosis in vivo using a modified firefly luciferase substrate, Z-DEVD-aminoluciferin. Cell Death Differ. 2010;17:1003-10 doi:cdd2009205 [pii]10.1038/cdd.2009.205
18. Zhang F, Zhu L, Liu G, Hida N, Lu G, Eden HS. et al. Multimodality imaging of tumor response to doxil. Theranostics. 2011;1:302-9
19. Schellenberger E, Schnorr J, Reutelingsperger C, Ungethum L, Meyer W, Taupitz M. et al. Linking proteins with anionic nanoparticles via protamine: ultrasmall protein-coupled probes for magnetic resonance imaging of apoptosis. Small. 2008;4:225-30 doi:10.1002/smll.200700847
20. Lee KC, Hamstra DA, Bhojani MS, Khan AP, Ross BD, Rehemtulla A. Noninvasive molecular imaging sheds light on the synergy between 5-fluorouracil and TRAIL/Apo2L for cancer therapy. Clin Cancer Res. 2007;13:1839-46 doi:13/6/1839 [pii]10.1158/1078-0432.CCR-06-1657
21. Medarova Z, Rashkovetsky L, Pantazopoulos P, Moore A. Multiparametric monitoring of tumor response to chemotherapy by noninvasive imaging. Cancer Res. 2009;69:1182-9 doi:0008-5472.CAN-08-2001 [pii]10.1158/0008-5472.CAN-08-2001
22. Blankenberg FG. Imaging the molecular signatures of apoptosis and injury with radiolabeled annexin V. Proc Am Thorac Soc. 2009;6:469-76 doi:6/5/469 [pii]10.1513/pats.200901-001AW
23. Michalski MH, Chen X. Molecular imaging in cancer treatment. Eur J Nucl Med Mol Imaging. 2009;38:358-77 doi:10.1007/s00259-010-1569-z
24. Niu G, Chen X. Apoptosis imaging: beyond annexin V. J Nucl Med. 2010;51:1659-62 doi:jnumed.110.078584 [pii]10.2967/jnumed.110.078584
25. Ungethum L, Kenis H, Nicolaes GA, Autin L, Stoilova-McPhie S, Reutelingsperger CP. Engineered annexin a5 variants have impaired cell entry for molecular imaging of apoptosis using pretargeting strategies. J Biol Chem. 2011;286:1903-10 doi:M110.163527 [pii]10.1074/jbc.M110.163527
26. Nicholson DW. Caspase structure, proteolytic substrates, and function during apoptotic cell death. Cell Death Differ. 1999;6:1028-42 doi:10.1038/sj.cdd.4400598
27. Chen HH, Yuan H, Josephson L, Sosnovik DE. Theranostic Imaging of the Kinases and Proteases that Modulate Cell Death and Survival. Theranostics. 2012;2:148-55 doi:10.7150/thno.4077
28. Savitsky AP, Rusanov AL, Zherdeva VV, Gorodnicheva TV, Khrenova MG, Nemukhin AV. FLIM-FRET Imaging of Caspase-3 Activity in Live Cells Using Pair of Red Fluorescent Proteins. Theranostics. 2012;2:215-26 doi:10.7150/thno.3885
29. Kim K, Lee M, Park H, Kim JH, Kim S, Chung H. et al. Cell-permeable and biocompatible polymeric nanoparticles for apoptosis imaging. J Am Chem Soc. 2006;128:3490-1
30. Quinti L, Weissleder R, Tung CH. A fluorescent nanosensor for apoptotic cells. Nano Lett. 2006;6:488-90
31. Barnett EM, Zhang X, Maxwell D, Chang Q, Piwnica-Worms D. Single-cell imaging of retinal ganglion cell apoptosis with a cell-penetrating, activatable peptide probe in an in vivo glaucoma model. Proc Natl Acad Sci U S A. 2009;106:9391-6
32. Edgington LE, Berger AB, Blum G, Albrow VE, Paulick MG, Lineberry N. et al. Noninvasive optical imaging of apoptosis by caspase-targeted activity-based probes. Nat Med. 2009;15:967-73
33. Ray P, De A, Patel M, Gambhir SS. Monitoring caspase-3 activation with a multimodality imaging sensor in living subjects. Clin Cancer Res. 2008;14:5801-9 doi:14/18/5801 [pii]10.1158/1078-0432.CCR-07-5244
34. Kanno A, Yamanaka Y, Hirano H, Umezawa Y, Ozawa T. Cyclic luciferase for real-time sensing of caspase-3 activities in living mammals. Angew Chem Int Ed Engl. 2007;46:7595-9 doi:10.1002/anie.200700538
35. Kanno A, Umezawa Y, Ozawa T. Detection of apoptosis using cyclic luciferase in living mammals. Methods Mol Biol. 2009;574:105-14 doi:10.1007/978-1-60327-321-3_9
36. Liu G, Wang Z, Lu J, Xia C, Gao F, Gong Q. et al. Low molecular weight alkyl-polycation wrapped magnetite nanoparticle clusters as MRI probes for stem cell labeling and in vivo imaging. Biomaterials. 2011;32:528-37 doi:S0142-9612(10)01137-3 [pii]10.1016/j.biomaterials.2010.08.099
37. Peterson QP, Goode DR, West DC, Botham RC, Hergenrother PJ. Preparation of the caspase-3/7 substrate Ac-DEVD-pNA by solution-phase peptide synthesis. Nat Protoc. 2010;5:294-302
38. O'Brien MA, Daily WJ, Hesselberth PE, Moravec RA, Scurria MA, Klaubert DH. et al. Homogeneous, bioluminescent protease assays: caspase-3 as a model. J Biomol Screen. 2005;10:137-48 doi:10/2/137 [pii]10.1177/1087057104271865
39. Evan GI, Vousden KH. Proliferation, cell cycle and apoptosis in cancer. Nature. 2001;411:342-8
40. Young RC, Ozols RF, Myers CE. The anthracycline antineoplastic drugs. N Engl J Med. 1981;305:139-53 doi:10.1056/NEJM198107163050305
41. Tewey KM, Rowe TC, Yang L, Halligan BD, Liu LF. Adriamycin-induced DNA damage mediated by mammalian DNA topoisomerase II. Science. 1984;226:466-8
42. Keizer HG, Pinedo HM, Schuurhuis GJ, Joenje H. Doxorubicin (adriamycin): a critical review of free radical-dependent mechanisms of cytotoxicity. Pharmacol Ther. 1990;47:219-31 doi:0163-7258(90)90088-J [pii]
43. Meyn RE, Stephens LC, Hunter NR, Milas L. Kinetics of cisplatin-induced apoptosis in murine mammary and ovarian adenocarcinomas. Int J Cancer. 1995;60:725-9
44. Meijer AE, Jernberg AR, Heiden T, Stenerlow B, Persson LM, Tilly N. et al. Dose and time dependent apoptotic response in a human melanoma cell line exposed to accelerated boron ions at four different LET. Int J Radiat Biol. 2005;81:261-72 doi:V434316V52P16420 [pii]10.1080/09553000500141215
45. Erba PA, Manfredi C, Lazzeri E, Minichilli F, Pauwels EK, Sbrana A. et al. Time course of Paclitaxel-induced apoptosis in an experimental model of virus-induced breast cancer. J Nucl Med. 2010;51:775-81 doi:jnumed.109.071621 [pii]10.2967/jnumed.109.071621
46. Scabini M, Stellari F, Cappella P, Rizzitano S, Texido G, Pesenti E. In vivo imaging of early stage apoptosis by measuring real-time caspase-3/7 activation. Apoptosis. 2011;16:198-207 doi: 10.1007/s10495-010-0553-1
47. Ke S, Wen X, Wu QP, Wallace S, Charnsangavej C, Stachowiak AM. et al. Imaging taxane-induced tumor apoptosis using PEGylated, 111In-labeled annexin V. J Nucl Med. 2004;45:108-15
48. Hu S, Kiesewetter DO, Zhu L, Guo N, Gao H, Liu G. et al. Longitudinal PET imaging of doxorubicin-induced cell death with 18F-Annexin V. Mol Imaging Biol. 2012;14:762-70 doi:10.1007/s11307-012-0551-5
Author contact
![]() Corresponding author: Gang Liu; Center for Molecular Imaging and Translational Medicine, School of Public Health, Xiamen University, Xiamen, Fujian, 361002, China. Email: gangliu.cmitmedu.cn.
Corresponding author: Gang Liu; Center for Molecular Imaging and Translational Medicine, School of Public Health, Xiamen University, Xiamen, Fujian, 361002, China. Email: gangliu.cmitmedu.cn.