Impact Factor
- Issue 13; 2026
- Issue 12; 2026
- Issue 11; 2026
- Issue 10; 2026
- Issue 9; 2026
- Volume 16; 2026
- Advance Articles
- Past Issues
- Cover Images
- Cover Suggestion
- Index & Coverage
- Special Issues
1. Introduction
2. Materials and methods
3. Results and discussion
4. Conclusions
Supplementary Material
Acknowledgements
References
International Journal of Biological Sciences
International Journal of Medical Sciences
 Global reach, higher impact

Theranostics 2013; 3(2):99-108. doi:10.7150/thno.5361 This issue Cite
Research Paper
Synthesis of Zn-Cu-In-S/ZnS Core/Shell Quantum Dots with Inhibited Blue-Shift Photoluminescence and Applications for Tumor Targeted Bioimaging
Weisheng Guo1, Na chen2, Yu Tu2, Chunhong Dong1, Bingbo Zhang3, ![]() , Chunhong Hu4, Jin Chang1,
, Chunhong Hu4, Jin Chang1, ![]()
1. Institute of Nanobiotechnology, School of Materials Science and Engineering, Tianjin University and Tianjin Key Laboratory of Composites and Functional Materials, Tianjin, 300072, China.
2. Department of Medical Radioprotection, School of Radiation Medicine and Health, Soochow University, Suzhou, 200072, China.
3. The Institute for Biomedical Engineering & Nano Science, Tongji University School of Medicine, Shanghai, 200092, China.
4. Imaging Center, the First Affiliated Hospital of Soochow University, Suzhou, Jiangsu Province, 215006, China.
Received 2012-10-10; Accepted 2012-11-26; Published 2013-1-18
Abstract

A facile strategy is reported here for synthesis of Zn-Cu-In-S/ZnS (ZCIS/ZnS) core/shell QDs to address the synthetic issues that the unexpected blue-shift of CuInS2-based nanocrystals. In this strategy, Zn2+ ions are intentionally employed for the synthesis of alloyed ZCIS core QDs before ZnS shell coating, which contributes to the reduced blue-shift in photoluminescence (PL) emission. The experimental results demonstrate this elaborate facile strategy is effective for the reduction of blue-shift during shell growth. Particularly, a hypothesis is proposed and proved for explanation of this effective strategy. Namely, both cation exchange inhibition and ions accumulation are involved during the synthesis of ZCIS/ZnS QDs. Furthermore, the obtained near infrared (NIR) ZCIS/ZnS QDs are transferred into aqueous phase by a polymer coating technique and coupled with cyclic Arg-Gly-Asp peptide (cRGD) peptides. After confirmation of biocompability by cytotoxicity test on normal 3T3 cells, these QDs are injected via tail vein into nude mice bearing U87 MG tumor. The result indicates that the signals detected in the tumor region are much more distinguishing injected with ZCIS/ZnS-cRGD QDs than that injected with ZCIS/ZnS QDs.
Keywords: CuInS2, Near-infrared, In vivo imaging, Blue shift, Tumor Targeting.
1. Introduction
Semiconductor nanocrystals (NCs), or quantum dots (QDs), have attracted immense interests in recent years as a novel class of material due to their special properties and a wide range of potential applications,[1-2] such as transistors,[3] waveguides,[4] lasers,[5] and biolabels.[6-9] Among them, cadmium-contained QDs, including CdSe and CdTe,[10-11] have been major research topics due to their excellent electrical and optical properties, but the intrinsic toxicity of cadmium limits their applications especially in the biomedical areas. As alternatives, I-III-VI NCs such as CuInS2 (CIS) with a band gap of 1.45 eV have been gaining increased attentions as a promising contrast agent for the in vivo near infrared (NIR) fluorescence imaging, due to advantages of non-toxicity and photoluminescence (PL) emission in NIR region, particularly.[12-16] Peng et al. have successfully synthesized CIS/ZnS core/shell NCs with a maximum fluorescence quantum yield (QY) of 30% by a developed hot-injection method, where Cu/In stoichiometric ratio in the obtained NCs was controlled by balancing the reactivity of two cationic precursors.[16] Reiss and co-workers described the synthesis of highly fluorescent CIS/ZnS NCs, which were successfully transferred into aqueous phase as fluorescent labels for in vivo biological imaging.[15]
Although there has been significant progress in the preparation of CIS NCs, there still exist some issues to be addressed. For example, in terms of thermolysis route, there always exist multiple peaks in the PL spectra of the CIS NCs even when the wavelength is shorter than 700 nm,[15, 17] which might be originating from plenty of the structural defects and poor crystallinity in NCs.[15, 18-20] Significant unexpected blue-shift happens during the process of ZnS shell growth around the CIS QDs, which has been mentioned in some previous papers.[14-15, 21-22] To the best of our knowledge, even though a few suppositions have been put forward, such as the surface reconstruction by Reiss et al.,[15] etching of the plain core material by Klimov et al.,[21] the inter-diffusion of Zn atoms by Pons et al.[14] and the latest cation exchange suggested by Kim et al.,[22] there are rare reports aimed at avoiding the abnormal blue-shift during the shell growth process.
Recently, some reports have demonstrated the applicability of obtained CIS NCs for tumor targeted bio-imaging.[14-15, 23-24] Yong et al. reported the formulation of CIS/ZnS NCs encapsulated within functionalized PEGylated phospholipid micelles and the bioconjugation to folic acid for tumor targeted in vivo imaging.[23] Achilefu and Gu et al. explored the loading of oil-soluble CIS/ZnS NCs with folate-modified N-succinyl-N′-octyl chitosan (FA-SOC) micelles for tumor targeted bio-imaging.[24] Besides, cRGD peptide has been proved to be an effective tumor targeting agent, specifically binding integrin αvβ3, a key player in tumor angiogenesis, progression and spread.[25-28] However, almost the previous reported cRGD-QDs conjugation as contrast agents were based on the cadmium-containing QDs as the fluorescence probe.
Herein our study is focused on fabricating ZCIS/ZnS core/shell NCs with inhibited blue-shift photoluminescence, and then rendering them water-soluble by a polymer coating technique. The obtained ZCIS/ZnS QDs are subsequently chosen to be conjugated with cRGD peptide, as the low toxic and efficient fluorescence probe for in vivo tumor targeted imaging.
2. Materials and methods
2.1 Materials
Copper(I) iodide (CuI, 99.999 %), indium(III) acetate (In(OAc)3, 99.99 %), zinc stearate (ZnO, 12.5-14 %), 1-dodecanethiol (DDT, 98 %), oleylamine (97 %), oleic acid (OA, 90 %),1-octadecene (ODE, 90 %), ethanolamine (EA, 97 %) and poly(maleic anhydride-alt-1-octadecene) (PMAO, 30000~50000 g/mol), 1-ethyl-3-(3-dimethyllaminopropyl) carbodiimide hydrochloride (EDC•HCl) were purchased from Sigma-Aldrich. Cyclic Arg-Gly-Asp (cRGD) peptide was purchased from Apeptide (Shanghai, China). Deionized water (18.2 MΩ•cm resistivity at 25°C) was used for all tests. All the chemicals were used without further purification.
2.2 Synthesis of ZCIS alloyed QDs
ZCIS NCs were prepared by the synthetic strategy adapted from that reported by Reiss et al..[15] For a typical synthesis of ZCIS NCs, CuI (0.2 mmol), In(Ac)3 (0.2 mmol), zinc stearate (Zn(SA)2) (0.1 mmol) and OA (1.0 mmol) were mixed with 1.0 mL of DDT and 8.0 mL of ODE in a 50 mL four-neck flask under argon atmosphere and magnetic stirring. The mixture was heated to 80~100 °C, degassed for 30 min at the temperature, backfilled with Ar and subsequently further heated to the targeted temperature of 240 °C (210~290 °C). As the reaction proceeded, aliquots were derived from the hot mixture solution with a time interval of 5 min and immediately quenched in hexane for the subsequent measurements. After keeping the mixture at 240 °C for 70 min, the heating source was removed and the NCs were collected by adding ethanol until the solution turned into turbid and precipitating by centrifugation (8000 rpm, 20 min). In order to eliminate byproducts, unreacted precursors, and solvents, the collected NCs were purified two times again with hexane/ethanol co-solvents by centrifugation and redispersed into organic solvents such as hexanes or chloroform. Additionally, alloyed NCs with different stoichiometries were also synthesized at the identical reaction conditions with various Cu/Zn ratios (2/1, 1/1, 1/3 and 1/5).
2.3 Overcoating of ZCIS alloyed NCs with ZnS shell
For the deposition of ZnS shell around the ZCIS core NCs, the reaction solution was cooled down to 150 ºC. Typically, 2 mL of sulfur (0.1 M in ODE/oleylamine, the ratio is 10/1) precursor and 3 mL of zinc stearate (0.1 M in ODE) was injected consequently into the reaction mixture in three batches with a time interval of 15 min at 150 ºC. After that, the temperature was increased to 220 ºC for 60 min to allow the growth of ZnS shell. After completion of the ZnS shell growth, aliquot was sampled and quenched in hexane for the following optical and structural analysis. Collection and purification of ZCIS/ZnS NCs were carried out in the same way as described in the ZCIS NCs above.
2.4 Phase transfer of ZCIS/ZnS NCs to the aqueous phase
The phase transfer was achieved via a modified polymer encapsulation technique with PMAO. Typically, ZCIS/ZnS core/shell QDs (10 nmol) in chloroform were added to 100 nmol of PMAO predissolved in chloroform to give a 10-fold molar excess of PMAO. The reaction mixture (~2 mL) was tumbled for 3 h at room temperature. Subsequently, 20 μL of EA was added into the QDs/PMAO chloroform solution and tumbled for another 30 min at room temperature. Finally, chloroform was completely removed by rotary evaporation to obtain an optically clear QD wate-soluble solution. The sample was centrifuged at 100,000g for 30 min in order to remove unreacted excess polymer. The resulting precipitate was then redispersed in sterilized buffer (PBS 1X, pH7.4).
2.5 Preparation of ZCIS/ZnS-cRGD QD bioconjugates
EDC•HCl coupling method is used to conjugate QDs with cRGD peptides. Typically, ZCIS/ZnS QDs (5 nmol) and EDC•HCl stock (5 μmol) stock were mixed in borate buffer (50 mM, pH 8.2) and incubated at room temperature for about 15 min with gentle shaking. cRGD peptides were then added into the activated ZCIS/ZnS QDs sample and kept shaking for another 2 h at room temperature. The final bioconjugate products were purified by centrifugation at 100,000g for 30 min and washing with PBS for two times. The ZCIS/ZnS-cRGD QD bioconjugates were stored in PBS (1X, pH7.4) with a concentration of 1 μM ready for use.
2.6 Cytotoxicity assay
The in vitro cytotoxicity was measured using 3-(4, 5-dimethylthiazol-2-yl)-2, 5-diphenyltetrazolium bromide (MTT) assay. 3T3 cells growing in log phase were seeded into a 96-well cell-culture plate at 5 ×10³/well and then incubated for 24 h at 37 °C under 5% CO2. DMEM supplemented with 10 % FBS (Fetal Bovine Serum) solutions of ZCIS/ZnS NCs (100 µL/well, containing 1% HEPES) at various concentrations were added to the wells of the treatment group, and DMEM containing 1% HEPES (100 µL/well) to the negative control group, respectively. The cells were incubated for 48 h at 37 °C under 5% CO2. Subsequently, 10 µL MTT (5 mg/mL) was added to each well and incubated for an additional 4 h at 37 °C under 5% CO2. After the addition of dimethylsulfoxide (DMSO, 150 µL/well), the assay plate was allowed to stand at room temperature for 10 minutes. A Tecan Infinite M200 monochromator-based multi-function microplate reader was used to measure the OD570 (A value) of each well with background subtraction at 690 nm. The following formula was used to calculate the viability of cell growth: cell viability (%) = (mean of A value of treatment group/mean of A value of control) × 100.
2.7 Animal model and in vivo fluorescence imaging
7-week-old female athymic nude mice (Harlan) weighing 25 g were used in this study. The tumor model was established by subcutaneous injection of U87 MG cells (~5×10⁶ in 50 μL of PBS) into the front flank of the mice. The mice were subjected to imaging studies when the tumor volume reached about 500 mm3 (4 weeks after inoculation). Before tail vein injection, the mice were kept without any food but water for 12 h to minimize food fluorescence. Whole body images of water-soluble ZCIS/ZnS intravenously injected tumor-bearing mice were acquired and analyzed at various time points after post-injection on Carestream MSFX PRO in vivo imaging system. For in vivo and ex vivo imaging, excitation and emission were set at 510nm and 700 nm respectively. CCD exposure time was 20 s. The ROI (regions of interest) analysis was measured under the assistance of Carestream MSFX PRO Image software.
2.8 Materials Characterization
UV-vis spectra were recorded on a Shimadzu UV-2450 spectrophotometer at room temperature. PL spectra were acquired by using a Gangdong F-280 spectrofluorometer. Fluorescence QYs were estimated by comparison of the integrated fluorescence intensity with standard dye solutions with the same optical density (0.05~0.1) at the excitation wavelength (470 nm). The PL QYs of the ZCIS/ZnS QDs with emitting wavelength shorter and longer than 700 nm were measured using Rhodamin 6G (95% in ethanol) and Cy5.5 (28% in ethanol), respectively.[29-31] Transmission electron microscopy (TEM) images were taken on a Tecnai G2 F20 instrument operated at 200 kV. Carbon-coated nickel grids were dipped in the hexanes or toluene solutions to deposit NCs onto the film. X-Ray diffraction (XRD) patterns were obtained using a Rigaku Ultima III diffractometer equipped with a rotating anode and a Cu-Ka radiation source. The X-ray photoelectron spectroscopy (XPS) was collected on an ESCA Lab220I-XL X-ray photoelectron spectrometer using an Al KR X-rays as the excitation source. All the peaks were calibrated by using C1s (284.60 eV) as the reference. The composition of the alloyed NCs was measured by means of inductively coupled plasma mass spectrometry (ICP-MS). The dispersion property of the QDs in solution was measured using a particle size analyzer (Nano ZS, Malvern).
3. Results and discussion
3.1 Photoluminescence and absorption properties of the ZCIS NCs
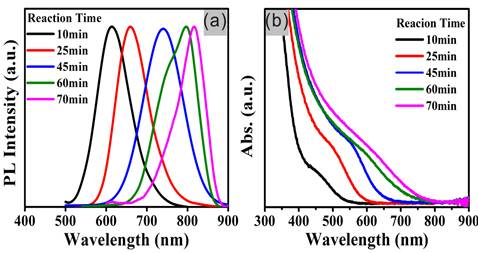
The evolution of the emission and absorption properties of ZCIS NCs during the synthesis are investigated. Fig. 1 indicates that both the emission and absorption gradually shift from the visible region (600~650 nm) to the NIR region (700~815 nm) with the reaction going on. Interestingly, the PL emission peaks of the resulted ZCIS NCs always maintained good single peak shapes at the region of shorter than 730 nm, which is an improvement compared to that of the previous reports. In this particular note is that a certain amount of Zn2+ ions were intentionally introduced into the core NCs synthesis. And the added Zn2+ ions could substitute for Cu+ and In3+ ions in the reaction, and thus inhibit the generation of vacancies, minimizing the structural defects and resulting more stable crystal structure.[15, 18-19] Consequently, the introduced Zn2+ ions could account for the single-peak PL emission spectrum. It's also noticed that the emission peaks (>730nm) will turn into multi-peaks (Fig. 1a), which will be discussed below. On the contrary, a control experiment was performed at the identical reaction conditions just without the addition of Zn(SA)2 (Supplementary Material: Fig. S1). Besides, the bandgaps, particle sizes and composition of ZCIS NCs obtained at different reaction time are listed in the Table 1. It is identified that the chemical compositions of these NCs are slightly different from the ratios of the precursors used, which might be on account of the difference among the intrinsic reactivity of precursors.
Temporal evolution of PL emission spectra (a, λex = 470 nm) and UV-vis absorption (b) of ZCIS NCs samples in chloroform solution prepared by thermolysis of 0.2 mmol of CuI, 0.2 mmol of In(Ac)3, 0.1 mmol of Zn(SA)2 and 1 mL of dodecanethiol in 8 mL of ODE at 240 °C for 10, 25, 45, 60, and 70 min.
Elements composition (from ICP-AES), Average Diameters (from TEM) and Optical Band Gaps (Eg)(from UV-Vis Spectra) of the ZCIS alloyed NCs.
| Samples | Cu:In:Zn Ratio | Diameter (nm) | Absorption Edge (eV) |
|---|---|---|---|
| 10 min | 1.10:1:0.62 | 3.26 | 2.30 |
| 25 min | 1.11:1:0.56 | 3.69 | 2.10 |
| 45 min | 1.20:1:0.50 | 4.71 | 1.91 |
| 60 min | 1.22:1:0.42 | 5.11 | 1.70 |
| 70 min | 1.26:1:0.43 | 6.21 | 1.60 |
3.2 Structural characterization
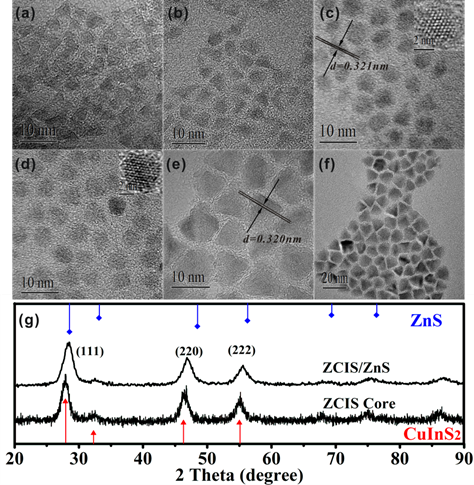
Transmission electron microscope (TEM) observations are also employed to study the ZCIS NCs. Fig. 2 shows that the obtained NCs are nearly spherical in shape for the samples acquired before 45 min. However, a long period of heating (up to 60 min) results plenty of nanocubes exhibiting trigon or tetrahedral in diverse sizes including some tiny faceted NCs, which should be original from Ostwald Ripening. It is considered that the broad size distribution consisting of many bigger nanocubes and some tiny faceted NCs, might account for the multi-peak of the sample derived at 60 min. A significant increase in particle size can be easily noticed with the reaction time prolonging from the TEM observation (listed in Table 1). The high resolution transmission electron microscope (HRTEM) images of the corresponding nanoparticles are also shown in the inset of Fig. 2c and d. It indicates the alloyed ZCIS NCs synthesized by this facile strategy have less lattice defects and thus hold capability of high quality spectrum properties. Furthermore, X-ray diffraction (XRD) measurement is employed to clarify the crystal structures of the as-prepared ZCIS NCs. As presented in Fig. 2g, the XRD pattern of the ZCIS NCs synthesized at 240 °C for 70 min consists of three major peaks at 2θ of 27.8°, 47.7° and 55.3°, corresponding to but slightly left shifted compared to the (111), (220) and (222) indices of the zinc blend crystal structure, respectively.[32-33] Simultaneously, it is noted that the exact positions of these three peaks were right-shifted compared to the XRD pattern peaks of pure CIS, which suggests that the success of introduction of Zn2+ ions and alloyed crystal structure of ZCIS. It could be supposed that a certain amount of Zn2+ ions has been introduced and diffused into the nanocrystal structure of ZCIS, which should be responsible for the slightly difference in XRD pattern compared to that of pure CIS. Besides, the TEM image and XRD pattern of the corresponding ZCIS/ZnS core/shell NCs are also presented in Fig. 2f and g. The average size of the ZCIS/ZnS NCs is 6.90 nm, slightly larger than that of plain ZCIS core NCs. Compared with plain ZCIS NCs, the XRD pattern of ZCIS/ZnS core/shell NCs slightly shifts toward the higher angles and is closer to the standardized diffraction peaks of the zinc blend crystal structure.
TEM images of the ZCIS alloyed NCs prepared by thermolysis of 0.2 mmol of CuI, 0.2 mmol of In(Ac)3, 0.1 mmol of Zn(SA)2 and 1 mL of dodecanethiol in 8 mL of ODE at 240 °C for 10 min (a); for 25 min (b); for 45 min (c); for 60 min (d); for 70 min (e), corresponding ZCIS/ ZnS core/shell NCs (f), and X-ray diffraction patterns of ZCIS alloyed NCs and ZCIS/ZnS NCs (g).
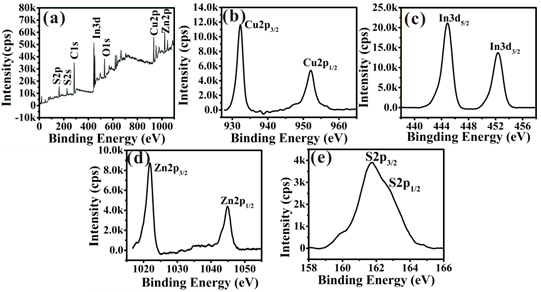
The compositions and valence states of the obtained ZCIS NCs are also further investigated by the X-ray photoelectron spectroscopy (XPS) showed in Fig. 3. The Cu 2p, In 3d, and S 2p core levels are examined, respectively. The Cu 2p core splits into 2p3/2 (932.1 eV) and 2p1/2 (952.1 eV) peaks as shown in Fig. 3b and is in good accordance with those reported in literature,[34] suggesting that the copper valence state in the ZCIS NCs is +1. Similarly, In 3d shown in Fig. 3c splits two peaks at 444.9 and 452.3 eV, consistent with a valence of +3. The spectrum of the Zn 2p in Fig. 3d is divided into 2p3/2 (1021.1 eV) and 2p1/2 (1044.8 eV) peaks, confirming the presence of Zn atoms in NCs. And the S 2p in Fig. 3e has doublet peaks of S 2p1/2 (161.5eV) and 2p3/2 (162.7eV), assigned to a valence of -2. Furthermore, the subsequent ZCIS/ZnS NCs were also investigated by XPS and both the XPS quantification reports were presented in Supplementary Material: Fig. S4.
(a) XPS survey spectrum, (b) the XPS spectrum of Cu 2p, (c) the XPS spectrum of In 3d, (d) the XPS spectrum of Zn 2p and (e) the XPS spectrum of S 2p of the ZCIS alloyed NCs prepared by thermolysis of 0.2 mmol of CuI, 0.2 mmol of In(Ac)3, 0.1 mmol of Zn(SA)2 and 1 mL of dodecanethiol in 8 mL of ODE at 240 °C for 70 min.
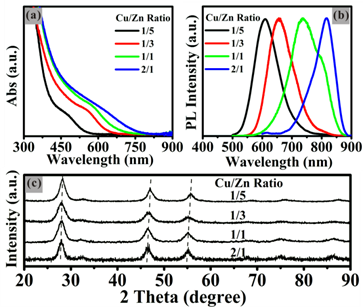
The effects of molar ratios of precursors on optical and structural properties of NCs are also investigated by varying molar ratios of the precursors while keeping the other reaction parameters unchanged. As shown in the Fig. 4, the absorption band edges of the obtained ZCIS NCs shift from UV-vis to NIR with the increasing ratio of Cu/Zn from 1:5 to 2:1. The PL emission peaks are tunable in the region from 600 nm to 815 nm by only adjusting the Cu/Zn ratios from 1:5 to 2:1. It's necessary to note that it takes a longer reaction time for the intermediate complex “ZnCuInSR” to decompose into ZCIS NCs with detectable luminescence signals at a higher Zn/Cu ratio, which should be attributed to the plentiful Zn2+ in the complex slowing down the decomposition because of the lower intrinsic reactivity of zinc precursor. When the Zn/Cu ratio in the raw material solution is higher than 5:1, ZCIS NCs with decent PL properties can't be easily obtained, even if the reaction time was prolonged to 3 h. Furthermore, crystal structures of the as-prepared NCs are determined by the XRD patterns showed in Fig. 4c, which reveals all NCs show a similar zinc blend structure and their diffraction pattern peaks sequentially shift toward higher angles with increasing the Zn/Cu ratio from 1:2 to 5:1. The similar diffraction pattern peaks and sequential peak-shift indicate the success of introduction of Zn2+ ions in this synthetic approach.
(a) Absorption and (b) PL emission spectra of the ZCIS alloyed NCs prepared by thermolysis under 240°C for 30 min with different Cu/Zn ratios. (c) XRD patterns of the corresponding ZCIS alloyed NCs with different compositions.
3.3 Overcoating of the alloyed ZCIS NCs with ZnS shell
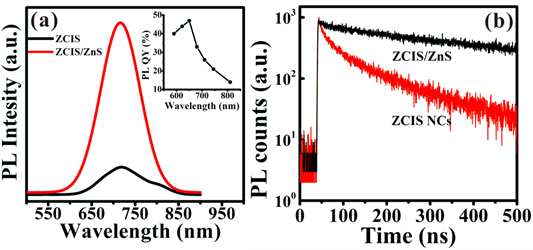
Although the as-prepared ZCIS NCs show well defined single peaks (shorter than 730 nm) in the PL spectra, the fluorescent QYs of the plain core NCs are less than 5 %, which can't satisfy the desired value for biomedical in vivo imaging applications. In order to improve QY and stability, a subsequent attempt for the inorganic surface passivation is made by means of in situ growth of ZnS shell on the ZCIS core NCs. As shown in Fig. 5a and Supplementary Material: Fig. S3, the ZnS overcoating offers a dramatic improvement on PL QY, that is, the fluorescence QYs of the samples increased from 5% to 50 % (for the 613 nm sample), 3.7% to 28 % (for the 720 nm sample) and 1.8% to 16 % (for the 815 nm sample), respectively. Additionally, the time-resolved PL spectroscopy of ZCIS NCs and ZCIS/ZnS are also investigated. As shown in Fig. 5B, the luminescence lifetime is prolonged from 140 ns to 248 ns. Meanwhile, overcoating with ZnS also greatly reduces the contribution from the fast decay channel, resulting in almost spectrally uniform single exponential decay.
(a) PL emission spectra of the ZCIS NCs and corresponding ZCIS/ZnS core/shell NCs. (Inset) PL QY of the as-prepared ZCIS/ZnS NCs vs the emission peak position. (b) Luminescence decay cures (λex = 500 nm, measured at the maximum of the PL emission peak of ZCIS alloyed NCs (720nm) and the corresponding ZCIS/ZnS NCs (715nm).
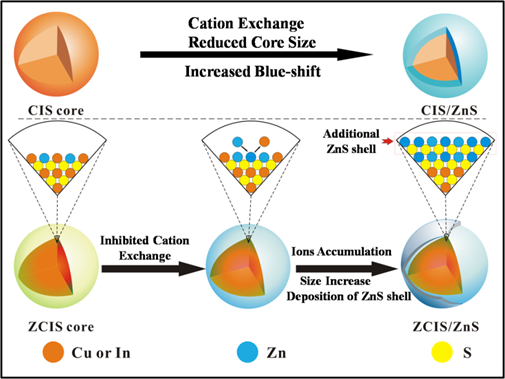
Interestingly, it is also found that remarkable blue-shifts in the PL emission disappear throughout ZnS shell growth, which is an improvement to the previous literatures.[14-15, 21-22] Although some hypotheses have been proposed to explain the phenomenon of blue-shift, for example, surface reconstruction by Reiss et al,[15] the inter-diffusion of Zn atoms by Pons et al.[14] and cation exchange suggested by Kim et al.,[22] to the best of our knowledge, rarely well-established approach has been reported to avoid or minimize the abnormal blue-shift. Herein, a facile fabrication strategy of ZCIS/ZnS core/shell NCs without pronounced blue-shifts by intentionally introduction of Zn2+ ions in the alloyed ZCIS core NCs is presented for the first time. By this strategy, the blue-shifts for 613 nm, 720 nm and 815 nm samples in this study are reduced to 17 nm, 7 nm and 4 nm respectively. These blue-shifts are much less pronounced compared to that reported.[22] For type-I core/shell structure, like the discussed CIS/ZnS and ZCIS/ZnS, core size and the thickness of the shell both control the effective band gap through quantum confinement effects.[29] And it has also been proved that cation exchange occurred during ZnS shell growth between Cu+ or In3+ and Zn2+ reduce the core size and increase the blue-shift in PL spectra for CIS NCs (Scheme 1/Figure A).[22] In this strategy, Zn2+ ions occupation in the alloyed ZCIS NCs is designed and expected to reduce cation exchange between the Zn2+ ions and Cu+ or In3+ ions during the shell growth, which can inhibit the pronounced blue-shift caused by cation exchange. Considering the reactivity difference among Cu+, In3+ and Zn2+ in the reaction,[16-17] a gradient distribution of components consisting of more Zn2+ ions occupations close to surface than the inner is proposed and proved for the obtained ZCIS alloyed NCs as revealed by Scheme 1 (Figure A). The mol fraction of Zn in the surface of ZCIS NCs (15.93 at% derived from XPS) is higher than the average fractions (10.64 at% derived from EDX) in the overall NCs (see Supplementary Material: Fig. S4, Table S1 and Fig. S5). It's creditable to hypothesize that the preceding Zn2+ ions occupations near the surface of ZCIS reduce the probabilities of cation exchange between Cu+ or In3+ ions and Zn2+ ions. As illustrated in Scheme 1 (Figure A), ions accumulation following cation exchange results further deposition of ZnS shell on the surface of ZCIS NCs. Consequently, the additional ZnS shell might result in a size increase, which can be confirmed by TEM (Fig. 2f). In contrast to cation exchange reaction, the size increase should lead to an underlying red-shifted emission based on the quantum size effect.[29] Consequently, the reduced blue-shift is considered to be profited from this inhibited cation exchange and the following size increase arising from ions accumulation in this synthetic strategy. To confirm the contribution of Zn+ to the reduced blue shift, the blue shift PL properties of the CIS core QDs, synthesized without Zn+, are also investigated (see Supplementary Material: Fig. S3).
(Scheme 1): Schematic illustrations of cation exchange for CIS NCs and inhibited cation exchange and ions accumulation for ZCIS NCs occuring during the ZnS shell growth.
3.4 Phase Transfer of ZCIS/ZnS NCs for in vivo tumor targeted imaging
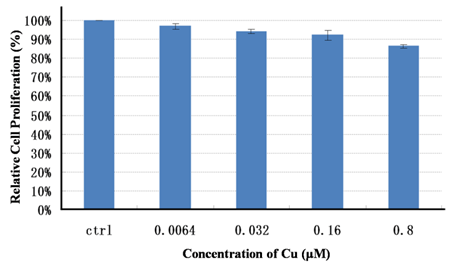
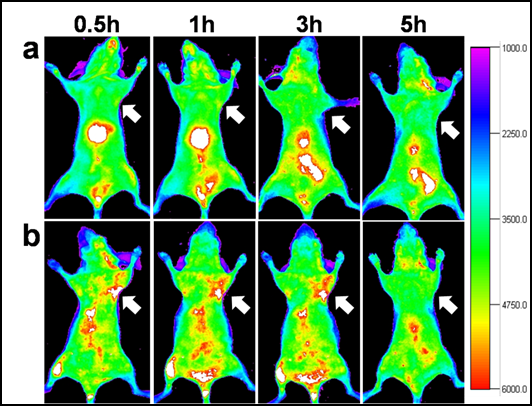
ZCIS/ZnS NCs emitting at 710 nm with a PL QY of 28 % is transferred into the aqueous phase (PBS 1X buffer) via polymer encapsulation,[35-36] resulting a slight decrease in PL QY to 21%. Upon phase transfer, the ZCIS/ZnS are colloidally stable in PBS 1X buffer for 4 months without significant aggregations (see Supplementary Material: Fig. S6). Respected to the TEM diameter, a slight increase in hydrodynamic diameter (HD) of the obtained QDs indicates the presence of individual nanoparticles in the solution. (see Supplementary Material: Fig. S7). The concentration of the ZCIS/ZnS QDs solution is described with Cu+ ions quantified by ICP-MS. Before in vivo imaging, the cytotoxicity test conducted on normal 3T3 cells indicates that the ZCIS/ZnS NCs are biocompatible. The viabilities of 3T3 cells incubated with ZCIS/ZnS NCs at various Cu+ ions concentrations, even at 800 nM of Cu+ for 48 hours are over 85% (Fig. 6). Subsequently, 200 μL of ZCIS/ZnS and ZCIS/ZnS-cRGD QD bioconjugates containing 200 nmol Cu+ ions are injected via tail vein into the tumor-bearing nude mice, respectively.[15] As shown in Fig. 7, as early as 0.5 h postinjection (p.i.), the fluorescent signals derived from ZCIS/ZnS-cRGD QD bioconjugates appear in the tumor region (arrows). Up to 3 h p.i., the tumor is very distinguishable from other tissues with good fluorescent contrast in the mice administrated with ZCIS/ZnS-cRGD QD bioconjugates (Fig. 7b), indicating highly specific tumor targeting of ZCIS/ZnS-RGD QD bioconjugates. On the contrary, the tumor contrast is not observed in the mice injected with ZCIS/ZnS QDs over the experimental time (Fig. 7a). Subsequently, at 5 h p.i., the mice injected with ZCIS/ZnS-cRGD QDs is sacrificed to investigate the ex vivo biodistribution. The tumor and major organs are collected for fluorescence imaging and ROI analysis with the assistance of imaging software, showed in Supplementary Material: Fig. S8. In accordance with the ex vivo imaging, the ROI analysis result confirms the accumulation of QDs in liver and tumor, indicating the effective tumor targeting capability of the ZCIS/ZnS-cRGD conjunction. The relatively short half-life of the both two QDs might due to the rapid uptake of QDs by the reticuloendothelial system (RES), which can be reflected by the particularly bright fluorescence from the liver.
The viability of 3T3 cells incubated with ZCIS/ZnS QDs. ZCIS/ZnS QDs are incubated with 3T3 cells at various Cu2+ concentrations for 48 hours and viability is measured using 3-(4, 5-Dimethylthiazol-2-yl)-2, 5-diphenyltetrazolium bromide (MTT) assay. Viability measurements are normalized to cells grown in absence of any nanoparticles.
In vivo NIR fluorescence imaging of U87MG tumor-bearing mice (arrows) injected with (a) ZCIS/ZnS QDs and (b) ZCIS/ZnS-RGD QDs.
4. Conclusions
In summary, a facile approach for synthesis of ZCIS/ZnS core/shell NCs is reported here that (i) the as-prepared primary ZCIS alloyed NCs display single PL peaks in the range of 590-815 nm and (ii) pronounced blue-shift does not happen throughout ZnS shell growth. These improvements are really expected and helpful for synthesis of ZCIS/ZnS NCs used for in vivo NIR fluorescence imaging. Particularly, a corresponding hypothesis is also put forward to explain this inhibitory blue-shift. It's proposed that the reduced blue-shift should be profited from the inhibited cation exchange derived from aforehand added Zn2+ ions and the following size increase arising from ions accumulation. Furthermore, the as-prepared ZCIS/ZnS QDs is successfully transferred into aqueous phase. After the approval of biocompatibility by cytotoxicity test, the obtained QDs are conjugated with cRGD peptides for tumor targeted imaging.
Supplementary Material
Fig.S1 - Fig. S8, and Table S1.
Acknowledgements
The authors gratefully acknowledge the National High Technology Program of China (2012AA022603), the National Natural Science Foundation of China (51003078, 81171393, 81271629, 81171372), Program for Outstanding Young Teachers in Tongji University, and the Fundamental Research Funds for the Central Universities.
Competing Interests
The authors have declared that no competing interest exists.
References
1. Yong KT. Quantum dots for biophotonics. Theranostics. 2012;2:629-30
2. Yong KT, Wang Y, Roy I, Rui H, Swihart MT, Law WC. et al. Preparation of quantum dot/drug nanoparticle formulations for traceable targeted delivery and therapy. Theranostics. 2012;2:681-94
3. Klein DL, Roth R, Lim AKL, Alivisatos AP, McEuen PL. A single-electron transistor made from a cadmium selenide nanocrystal. Nature. 1997;389:699-701
4. Huang L, Wang CJ, Lin LY. Comparison of cross-talk effects between colloidal quantum dot and conventional waveguides. Opt Lett. 2007;32:235-7
5. Rafailov E, Cataluna M, Sibbett W. Mode-locked quantum-dot lasers. Nat Photonics. 2007;1:395-401
6. Erogbogbo F, Yong KT, Roy I, Xu GX, Prasad PN, Swihart MT. Biocompatible luminescent silicon quantum dots for imaging of cancer cells. ACS Nano. 2008;2:873-8
7. Pradhan N, Battaglia DM, Liu Y, Peng X. Efficient, stable, small, and water-soluble doped ZnSe nanocrystal emitters as non-cadmium biomedical labels. Nano Lett. 2007;7:312-7
8. Kim S, Lim YT, Soltesz EG, De Grand AM, Lee J, Nakayama A. et al. Near-infrared fluorescent type II quantum dots for sentinel lymph node mapping. Nat Biotechnol. 2004;22:93-7
9. Bruchez M, Moronne M, Gin P, Weiss S, Alivisatos AP. Semiconductor nanocrystals as fluorescent biological labels. Science. 1998;281:2013-6
10. Liu L, Yong KT, Roy I, Law WC, Ye L, Liu J. et al. Bioconjugated pluronic triblock-copolymer micelle-encapsulated quantum dots for targeted imaging of cancer: in vitro and in vivo studies. Theranostics. 2012;2:705-13
11. Li Y, Li Z, Wang X, Liu F, Cheng Y, Zhang B. et al. In vivo cancer targeting and imaging-guided surgery with near infrared-emitting quantum dot bioconjugates. Theranostics. 2012;2:769-76
12. Cassette E, Pons T, Bouet C, Helle M, Bezdetnaya L, Marchal F. et al. Synthesis and characterization of near-infrared Cu- In- Se/ZnS core/shell quantum dots for in vivo imaging. Chem Mater. 2010;22:6117-24
13. Norako ME, Franzman MA, Brutchey RL. Growth kinetics of monodisperse Cu-In-S nanocrystals using a dialkyl disulfide sulfur source. Chem Mater. 2009;21:4299-304
14. Pons T, Pic E, Lequeux N, Cassette E, Bezdetnaya L, Guillemin F. et al. Cadmium-free CuInS2/ZnS quantum dots for sentinel lymph node imaging with reduced toxicity. ACS Nano. 2010;4:2531-8
15. Li L, Daou TJ, Texier I, Kim Chi TT, Liem NQ, Reiss P. Highly luminescent CuInS2/ZnS core/shell nanocrystals: cadmium-free quantum dots for in vivo imaging. Chem Mater. 2009;21:2422-9
16. Xie R, Rutherford M, Peng X. Formation of high-quality I- III- VI semiconductor nanocrystals by tuning relative reactivity of cationic precursors. J Am Chem Soc. 2009;131:5691-7
17. Zhang W, Zhong X. Facile synthesis of ZnS-CuInS2 alloyed nanocrystals for a color-tunable fluorchrome and photocatalyst. Inorg Chem. 2011;50:4065-72
18. Castro SL, Bailey SG, Raffaelle RP, Banger KK, Hepp AF. Synthesis and characterization of colloidal CuInS2 nanoparticles from a molecular single-source precursor. J Phys Chem. 2004;108:12429-35
19. Nose K, Soma Y, Omata T, Otsuka-Yao-Matsuo S. Synthesis of ternary CuInS2 nanocrystals; phase determination by complex ligand species. Chem Mater. 2009;21:2607-13
20. Tang X, Cheng W, Choo ESG, Xue J. Synthesis of CuInS2-ZnS alloyed nanocubes with high luminescence. Chem Commun. 2011;47:5217-9
21. Li L, Pandey A, Werder DJ, Khanal BP, Pietryga JM, Klimov VI. Efficient synthesis of highly luminescent copper indium sulfide-based core/shell nanocrystals with surprisingly long-lived emission. J Am Chem Soc. 2011;133:1176-9
22. Park J, Kim SW. CuInS2/ZnS core/shell quantum dots by cation exchange and their blue-shifted photoluminescence. J Mater Chem. 2011;21:3745-50
23. Yong KT, Roy I, Hu R, Ding H, Cai H, Zhu J. et al. Synthesis of ternary CuInS2/ZnS quantum dot bioconjugates and their applications for targeted cancer bioimaging. Integr Biol. 2010;2:121-9
24. Deng D, Chen Y, Cao J, Tian J, Qian Z, Achilefu S. et al. High-quality CuInS2/ZnS quantum qots for in vitro and in vivo bioimaging. Chem Mater. 2012;24:3029-37
25. Smith BR, Cheng Z, De A, Koh AL, Sinclair R, Gambhir SS. Real-time intravital imaging of RGD-quantum dot binding to luminal endothelium in mouse tumor neovasculature. Nano Lett. 2008;8:2599-606
26. Cai W, Shin DW, Chen K, Gheysens O, Cao Q, Wang SX. et al. Peptide-labeled near-infrared quantum dots for imaging tumor vasculature in living subjects. Nano Lett. 2006;6:669-76
27. Chen X, Conti PS, Moats RA. In vivo near-infrared fluorescence imaging of integrin αvβ3 in brain tumor xenografts. Cancer Res. 2004;64:8009-14
28. Gao J, Chen K, Xie R, Xie J, Yan Y, Cheng Z. et al. In vivo tumor-targeted fluorescence imaging using near-infrared non-cadmium quantum dots. Bioconjugate Chem. 2010;21:604-9
29. Xie R, Zhong X, Basché T. Synthesis, characterization, and spectroscopy of type-II core/shell semiconductor nanocrystals with ZnTe cores. Adv Mater. 2005;17:2741-5
30. Xing B, Li W, Wang X, Dou H, Wang L, Sun K. et al. Highly-fluorescent alloyed quantum dots of CdSe1- xTex synthesized in paraffin liquid: gradient structure and promising bio-application. J Mater Chem. 2010;20:5664-74
31. Grabolle M, Spieles M, Lesnyak V, Gaponik N, Eychmüller A, Resch-Genger U. Determination of the fluorescence quantum yield of quantum dots: suitable procedures and achievable uncertainties. Anal Chem. 2009;81:6285-94
32. Fang X, Wu L, Hu L. ZnS nanostructure arrays: a developing material star. Adv Mater. 2011;23:585-98
33. Fang X, Zhai T, Gautam UK, Li L, Wu L, Bando Y. et al. ZnS nanostructures: from synthesis to applications. Prog Mater Sci. 2011;56:175-287
34. Pan D, An L, Sun Z, Hou W, Yang Y, Yang Z. et al. Synthesis of Cu-In-S ternary nanocrystals with tunable structure and composition. J Am Chem Soc. 2008;130:5620-1
35. Pellegrino T, Manna L, Kudera S, Liedl T, Koktysh D, Rogach AL. et al. Hydrophobic nanocrystals coated with an amphiphilic polymer shell: a general route to water soluble nanocrystals. Nano Lett. 2004;4:703-7
36. Lees EE, Nguyen TL, Clayton AHA, Mulvaney P. The preparation of colloidally stable, water-soluble, biocompatible, semiconductor nanocrystals with a small hydrodynamic diameter. ACS Nano. 2009;3:1121-8
Author contact
![]() Corresponding author: Tel/Fax: +086-022-27401821, jinchangedu.cn (Jin Chang) Tel: +086-021-65988029, Fax: +086-021-65983706-0, bingbozhangedu.cn (Bingbo Zhang).
Corresponding author: Tel/Fax: +086-022-27401821, jinchangedu.cn (Jin Chang) Tel: +086-021-65988029, Fax: +086-021-65983706-0, bingbozhangedu.cn (Bingbo Zhang).