13.3
Impact Factor
Theranostics 2012; 2(12):1127-1139. doi:10.7150/thno.4307 This issue Cite
Research Paper
Understanding the Structure and Mechanism of Formation of a New Magnetic Microbubble Formulation
1. Institute of Biomedical Engineering, Department of Engineering Science, University of Oxford, UK.
2. Department of Bioengineering, Imperial College London, UK.
3. Davy-Faraday Research Laboratory, The Royal Institution of Great Britain, London, UK.
4. Imaging Sciences Department, Imperial College London, UK.
Received 2012-3-1; Accepted 2012-7-6; Published 2012-12-10
Abstract
Magnetic nanoparticles and ultrasound contrast agents have both been used as vehicles for therapeutic delivery. More recently, magnetic microbubbles have been developed as a new theranostic agent which combines the advantages of the individual carriers and overcomes many of their limitations. In a previous study of gene delivery using magnetic microbubbles, it was found that a combination of magnetic liquid droplets and non-magnetic phospholipid microbubbles produced higher transfection rates than magnetic microbubbles. The reasons for this were not fully understood, however. The aim of this study was to investigate the hypothesis that conjugation between the droplets and the microbubbles occurred. A combination of optical and fluorescence microscopy and ultrasound imaging studies in a flow phantom were performed. No interaction between magnetic droplets and microbubbles was observed under optical microscopy but the results from the fluorescence and acoustic imaging indicated that magnetic droplets and microbubbles do indeed combine to form a new magnetically and acoustically responsive particle. Theoretical calculations indicate that the driving force of the interaction is the relative surface energy and thus thermodynamic stability of the microbubbles and the droplets. The new particles were resistant to centrifugation, of comparable echogenicity to conventional ultrasound contrast agents and could be retained by a magnetic field (0.2T) in a flow phantom at centre line velocities of ~6 cm s-1 and shear rates of ~60 s -1.
Keywords: Microbubbles, magnetic nanoparticles, therapeutic ultrasound
1. Introduction
1.1. Background
A large body of research in recent years has shown the considerable potential of both microbubbles and magnetic nanoparticles individually as effective theranostic agents (1-3). In addition to providing contrast enhancement in ultrasound imaging, coated microbubbles have been widely shown to improve cellular uptake of therapeutic material (4). This effect, termed sonoporation, reversibly enhances the permeability of the surfaces of nearby cells and is thought to be produced by the oscillations of microbubbles under ultrasound excitation (5). Close proximity between the microbubbles and target cells is required for therapeutic effects to be realised without unwanted damage and at moderate ultrasound intensities (6). Similarly, adequate numbers of microbubbles are required at the target site, but increasing microbubble concentration can pose an increased risk of embolism and shield target tissue from ultrasound exposure (7). Efficient bio-chemical targeting of microbubbles still represents a considerable challenge in vivo and surface architectures that maximise ligand exposure also boost presentation of immunogenic compounds that leads to early particle clearance or a hypersensitivity response (2, 7).
Magnetic particles, on the micro and nano scale, have been investigated for the delivery of therapeutic agents for decades (8-10). Magnetic nanoparticles have also been used more recently for gene delivery. The association of genes with magnetic nanoparticles for magnetically guided nucleic acid delivery has been termed “magnetofection” (11). Magnetic nanoparticles can be used for targeting as they can be externally controlled by a magnetic field and can also be visualised by Magnetic Resonance Imaging (MRI). However, the small size of the magnetic nanoparticles means they cannot be retained as individual particles under physiologically relevant flow conditions (12). A combination of these delivery methods in the form of magnetic microbubbles has the potential to overcome many of these limitations. Magnetic microbubbles can be visualised using ultrasound imaging, localised using an externally applied magnetic field and thus exploit the combined effects of magnetofection and sonoporation for therapeutic delivery.
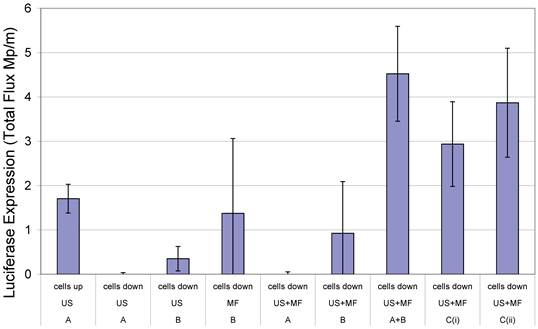
In 2000, Soetanto et al. electrostatically attached magnetic microparticles, coated with charged stearates, via a calcium ion to microbubbles also formed with charged stearates (13, 14). According to the literature however, the large size of the microparticles and the effect conditions in vivo would have upon the electrostatic interactions were causes for concern. Magnetic microbubble formulations have since been developed for dual purpose ultrasound and MRI contrast agents and as drug delivery vehicles (15-18). In the case of the latter, Stride et al. (19) published a study in which magnetic microbubbles were used for gene delivery to Chinese hamster ovary cells. Different formulations of magnetic microbubbles, non-magnetic microbubbles and magnetic liquid droplets were co-injected with naked plasmid DNA encoding for luciferase and the cells exposed to a magnetic field, ultrasound or both. In addition, the experiments were performed with the cells on either the upper or lower surface of the culture plate so that in the case of the former, buoyant bubbles would be in contact with the cells. In the case of the latter, however, they would be separated by a distance of 2 mm unless they were magnetically-responsive in which case they would be translated downwards in the presence of a magnet. It was found that the highest rates of transfection were achieved with simultaneous exposure to ultrasound and a magnetic field, with the cells on the lower surface and with 2 formulations (Figure 1): magnetic microbubbles (consisting of a gas core coated in an oil suspension of magnetic nanoparticles and stabilised by a phospholipid coating) and secondly non-magnetic microbubbles mixed with magnetic droplets (droplets of ferrofluid, stabilised by a phospholipid coating). This combination of magnetic droplets and non-magnetic microbubbles produced a higher degree of transfection than magnetic microbubbles (19).
Transfection enhancement as determined from Luciferase expression by Chinese hamster ovary cells 24 h after exposure to naked plasmid DNA with: an applied magnetic field (MF) and/or ultrasound (US) (10 s of pulsed insonation at 1 MHz, 1 MPa peak-to-peak, 10 kHz PRF) in the presence of non-magnetic bubbles (A) and/or magnetic liquid droplets (B) or magnetic microbubbles (Ci or Cii) with cells located on either the upper or lower surface of the cell culture chamber. Full experimental details may be found in [19]. Reproduced with permission from Elsevier.
1.2. Motivation and Objectives
The reason why magnetic droplets mixed with microbubbles produced transfection was not fully understood, since it was expected that the droplet/microbubble mixture would produce similar results to droplets alone. Two hypotheses were proposed: first that magnetic droplets were somehow coupled to microbubbles, although this was not evident under microscopic examination; or second that magnetic droplets had a sensitising effect upon the cells which amplified the effect of the microbubbles, overcoming the fact that they were not in close proximity to the cells (19). The aim of this study was to investigate these observations further and in particular to test the first hypothesis through examination of microbubble/droplet mixtures under optical and fluorescence microscopy and to examine their response to a combination of magnetic and ultrasound fields in a flow phantom to determine their ability to be imaged and retained under physiologically relevant conditions.
2. Materials and Methods
L-α-phosphatidylcholine and petroleum ether, pure (boiling range 180-280 °C) were purchased from Sigma Aldrich, Poole, UK. The ferrofluid suspension of 10 nm spherical magnetite nanoparticles in isoparaffin (10% volume fraction) was purchased from Liquids Research, Bangor, UK. The fluorophore BODIPY C10 was synthesised and kindly provided by the Chemistry Department, Imperial College London (20).
2.1. Bubble preparation
Non-magnetic microbubbles were prepared with L-α-phosphatidylcholine based upon the technique of Stride et al. [19]. 15 mg of the lipid powder was weighed into a vial rinsed with surgical spirit (BP Unichem, Surrey, UK). Deionised water (15 ml) was then added to the vial and the mixture sonicated for 30 s with an ultrasonic cell disruptor (XL 2000, probe diameter 3 mm, Misonix Inc. Farmingdale, NY, USA). This solution was then vigorously shaken for an additional 30 s. Magnetic microbubbles were prepared via the same method but 15 µl of the magnetic nanoparticle suspension was added to the lipid mixture after sonication. This was followed by an additional 30 s of sonication and 30 s of manual shaking. Magnetic droplets were also prepared by a similar method but omitting manual shaking and during sonication care was taken to keep the probe tip well below the liquid surface to avoid entraining gas.
Fluorescent formulations, magnetic and non-magnetic, were prepared via the following method. L-α-phosphatidylcholine dissolved in chloroform (80 µl) and BODIPY C10 dissolved in chloroform (2 µl) were added to a glass vial and agitated using a vortex mixer for 30s (VWR digital vortex mixer running at 1500 rpm). This mixture was then dried with a constant nitrogen flow for 30 min. Deionised water (2 ml) was added followed by bath sonication (Crest Ultrasonics, Model No 950HTAG, Trenton, NJ, USA) at room temperature for 1 min. The solution was transferred to a plastic vial followed by isoparaffin (2 µl), with or without magnetic nanoparticles, and the solution was probe sonicated and then shaken manually, each for 30s.
The phospholipid microbubbles were mixed with the droplets (magnetic and non-magnetic) as follows: magnetic droplets (0.5 ml) were extracted with a 1 ml syringe followed by microbubbles (0.5 ml) and the mixture was inverted 3 times to allow the bubbles to pass through the magnetic droplet mixture. Three batches of each type of particle suspension were prepared for the experiments.
2.2. Optical Microscopy
The microbubbles, droplets and microbubble-droplet mixture were examined using optical microscopy to determine the particle size distribution and concentration. 10 µl was removed from the sample solution and examined on a haemocytometer (Bright-Line, Hausser Scientific, Horsham, PA, USA). Images were obtained at 400x magnification with a standard light microscope (Bresser Optical Microscope No 0510119). Samples were taken from each of the 3 batches and 30 images were taken from each sample. The bubble size distribution and concentration were then obtained using purpose written image analysis software in MatLab (2010B, The MathWorks, Natick, MA, USA) (21). All experiments were performed at the ambient temperature in accordance with the conditions under which bubbles were prepared in [19].
2.3. Fluorescence experiments
Fluorescence microscopy was used to investigate the interaction between magnetic droplets and microbubbles. Images were obtained with an excitation wavelength of 490 nm and an absorption wavelength of 525 nm (Leica DMI6000B, FITC filter set). The manufacturer supplied software (Leica AF7000) was used to analyse the images. To analyse the non-magnetic droplets, images were acquired with a Nikon Eclipse Ti microscope (Nikon Instruments Europe B.V.) using a FITC filter set at the same wavelengths as above. In each case observations were made from two separate samples of microbubbles and fluorescent droplets prepared independently.
2.4. Capillary flow model
A 200 μm diameter cellulose capillary tube (Cuprophan RC55 8/200, Membrana GMBH) was suspended in a water bath (23 °C) and perfused with magnetic droplets and microbubbles, via a syringe into the needle of which the capillary had been inserted. Since the tube was both acoustically and optically transparent, the flowing particles were observed using an optical microscope with a water immersion objective (LUMPLFLN 40XW Olympus Key Med Southend, Essex UK; giving 400x magnification when mounted on a World Precision Instruments microscope, H602-240, Sarasota, Fl, USA with a 10x eye piece). An N52 grade NdFeB permanent magnet (NeoTexx, Berlin, Germany 10 mm x 10 mm x 25 mm) with a transverse magnetisation of 0.75 T was held approximately 1 mm away from the capillary tube wall. Flow rates up to 1 mm/s could be applied. A video was recorded of the mixtures flowing in the tube using a camera (ThorLabs USB 2.0 digital camera). Multiple perfusions were performed with samples from different batches of microbubbles and magnetic droplets.
2.5. Ultrasound Flow Phantom
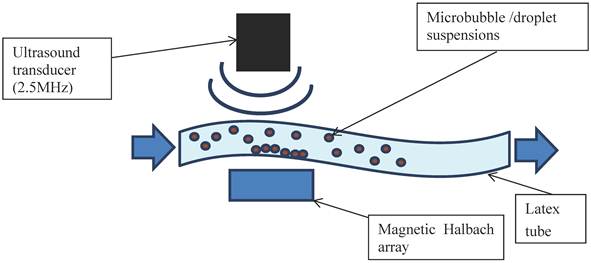
In addition to further demonstrating the interaction between bubbles and droplets, it was important to investigate their echogenicity and also their ability to be magnetically retained under flow. The apparatus was set up as shown in Figure 2. A latex tube (8 mm inner diameter with a wall thickness of 2 mm) was suspended in a water bath and connected to a programmable syringe pump (Al-1000, World Precision Instruments, Herts. UK) at one end and an open collection vessel at the other. A section of the tube was positioned so that it was parallel to the base of the bath with a gap of approximately 3 cm to allow for the insertion of a magnet. This took the form of a Halbach array consisting of 5 N52 grade NdFeB permanent magnets (10 mm x 10 mm x 25 mm, supplied by NeoTexx, Berlin, Germany) with transversal magnetisations (0.75 T) at angles of 90° from one to the next in an aluminium frame. The bubble formulations were imaged using an Ultrasonix RP500 ultrasound system using an array transducer with a centre frequency of 2.5 MHz (PA4-2/20). This was positioned above the section of tube under which the Halbach array was located. The flow rate through the tube was varied using the syringe pump and the local velocity profile in the imaging plane was determined via particle image velocimetry. As soon as an acoustic signal was observed from the flowing microbubbles, the Halbach array was inserted. Experiments were performed for non-magnetic microbubbles, magnetic microbubbles, magnetic droplets and finally magnetic droplets mixed with microbubbles. Two solutions were prepared independently for each flow experiment and 5 perfusions performed with each.
2.6. Flow estimation
In the experiments, measurements of the axial velocity profile in the imaged region of the flow phantom were obtained via an ultrasonic particle image velocimetry (Echo PIV) method. Echo PIV is a non-invasive technique for flow characterisation, which overcomes the need for optical access. A series of consecutive ultrasound images are recorded. The images are then subdivided in smaller domains or interrogation areas and the correlation between two interrogation areas of consecutive frames is calculated. An advantage of this technique is its ability to measure the whole flow field simultaneously. Image pairing is performed through a spatial cross-correlation R(s) of the interrogation windows W1(x)I1(x) and W2(x)I2(x) as given in equation 1 (22).
(1)
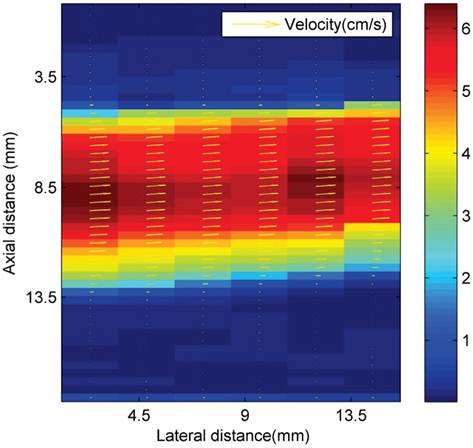
Where W1 and W2 are functions that determine the interrogation windows, and I1 and I2 are the images. Velocity magnitude is denoted by colour, as shown in Figure 3. The volume flow rate is estimated from the measured asymmetric axial velocity profiles by means of the cos θ method (23). For the cos θ method, the flow profile is split into two equal parts at the centreline, V1(r) and V2(r). Each part of the profile was integrated over half of the surface of the tube. The volume flow rate is then approximated from the sum of both contributions:
(2)
Where R is the inner radius of the tube.
In order to estimate the shear rate at the wall in the region above the magnetic array a Poiseuille flow profile was assumed and thus:
(3)
Where γ is the shear rate measured in s-1, V is the centreline flow velocity obtained from PIV and r is the radius of the tube.
Schematic of the ultrasound flow phantom: a latex tube immersed in a water bath with a variable internal flow rate controlled by a syringe pump. Microbubble/droplet mixtures were injected into the tube upstream and images obtained using an ultrasound imaging probe. A magnetic Halbach array was inserted 2 cm below the latex tube to investigate retention of the microbubbles against the flow.
Ultrasonic particle image velocimetry (Echo PIV) velocity profiles (cm s-1) in the area above the magnetic array in the latex tube flow phantom.
3. Results
3.1. Optical Microscopy
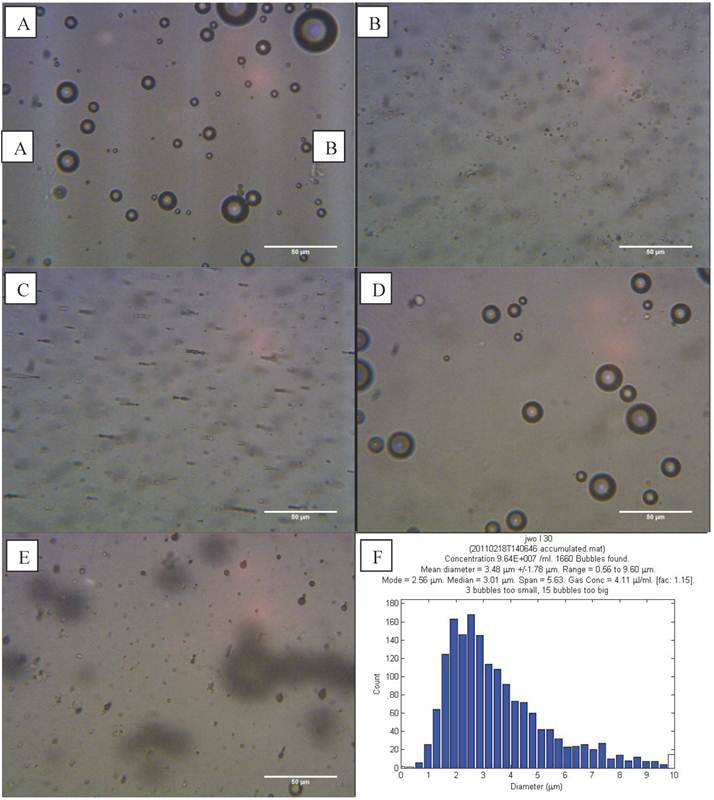
L-α-phosphatidylcholine (non-magnetic) microbubbles were prepared as described above and examined on a haemocytometer. Microbubbles could be discerned at the top of the slide (Figure 4 A). The bubbles had a range of sizes (0.6 - 9.6 µm) and an average concentration of 9.64 x 10⁷ microbubbles/ml (Figure 4 F).
Optical microscope images showed the magnetic droplet solution as a mixture of particles of differing size (Figure 4 B), which responded by forming chains and moving upon application of a magnetic field, as shown in Figure 4 C. The magnetic droplets were observed at the bottom of the slide and floating within the solution but none were observed at the top of the slide. Non-magnetic droplets showed similar structures but many of these rose to the top of the slide or floated in solution (Figure 5 A). This indicated that the magnetic nanoparticles caused a decrease in the buoyancy of the droplets as might be expected given the relative densities of isoparaffin and magnetite. There was also a difference in colour due to the presence of magnetic nanoparticles.
Optical images at 400x magnification of A) phospholipid microbubbles and B) magnetic droplets before and C) after the application of a magnetic field showing magnetic droplets in the micrometre scale responding to a magnetic field. D) and E) Phospholipid microbubbles combined with magnetic droplets showing D) the top of the slide with large buoyant microbubbles that did not respond to a magnetic field and E) particles below the large microbubbles (shown out of focus) lining up upon the application of a magnetic field. Scale bar in all images is 50 µm. F) Example of size distribution plot (in this case for non-magnetic microbubbles) obtained from the image processing software.
Optical microscope images (400x magnification) of: A) Non-magnetic droplets imaged at the top of the haemocytometer and B) non-magnetic droplets mixed with microbubbles in the same focal plane. Two separate populations of microbubbles and droplets on the micrometre scale can be observed. Scale bar in all images is 50 µm.
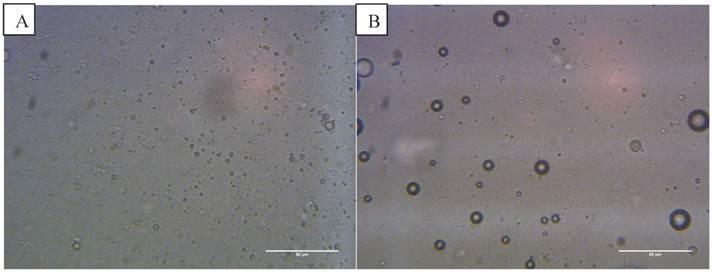
The magnetic droplet/microbubble mixture was placed directly onto the haemocytometer. Some relatively large microbubbles could be seen at the top of the slide which did not respond to a magnetic field (Figure 4 D). Throughout the solution however there were spherical particles which were magnetically responsive. The structure seemed to be similar to the solution of magnetic droplets and no interaction between the magnetic droplets and the microbubbles could be discerned. Figure 4 E shows the magnetic droplets responding to a magnetic field with microbubbles out of focus above the droplets. Similarly, no interaction could be discerned between non-magnetic droplets and microbubbles as shown in Figure 5 B.
3.2. Fluorescence Microscopy
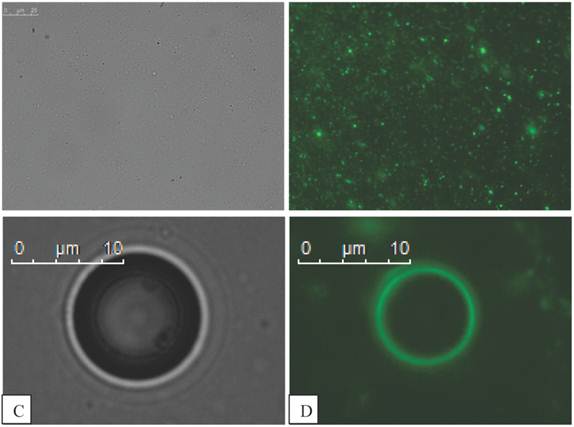
Fluorescent magnetic droplets were examined in water by fluorescence microscopy. A mixture of vesicles of differing size were observed by phase contrast (Figure 6 A) and seen to fluoresce upon use of the FITC filter set (Figure 6 B). Non-magnetic phospholipid microbubbles were examined to confirm that no fluorescence was observed. Upon mixing the microbubbles with the fluorescent magnetic droplets, however the microbubbles were now observed to fluoresce as shown in the phase contrast (Figure 6 C) and fluorescence (Figure 6 D) images below. The microbubbles continued to fluoresce after centrifugation (10,000 RPM for 15 min) indicating a strong interaction between the microbubbles and the droplets. This finding was confirmed with 3 separate samples.
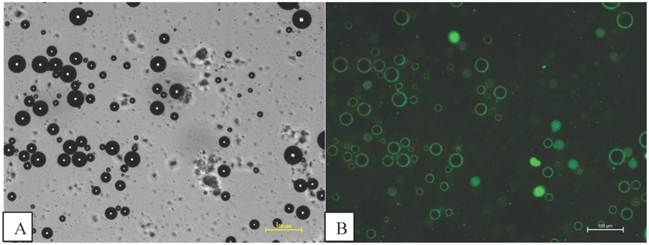
Fluorescent isoparaffin droplets, without magnetic nanoparticles, were also mixed with phospholipid microbubbles. The microbubbles were observed by phase contrast, as shown in Figure 7 A, and the microbubbles are also seen to fluoresce as shown in Figure 7 B. The results are similar to those shown in Figure 6 with fluorescent magnetic droplets indicating that the magnetic nanoparticles were not essential to the interaction. Again this finding was confirmed with 3 independently prepared samples.
3.3. Capillary flow
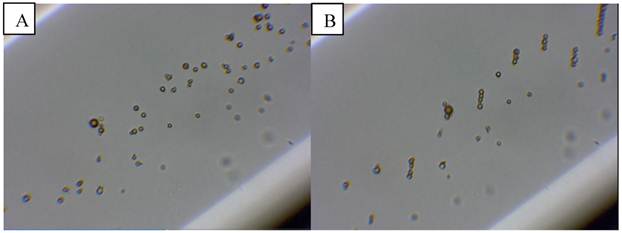
The magnetic droplet/microbubble mixture was then injected into the optical flow phantom in order to observe whether the particles could be retained by a magnetic field (Figure 8 A). Upon insertion of the magnet into the water bath the majority of objects were observed forming chains and translating towards the magnet (Figure 8 B). Retention of microbubbles was observed at centre line velocities up to 1 mm/s, which was the maximum velocity of the system corresponding to a shear rate of 20 s-1. This observation was consistent in all samples tested (minimum of at least 3).
3.4. Ultrasound flow phantom
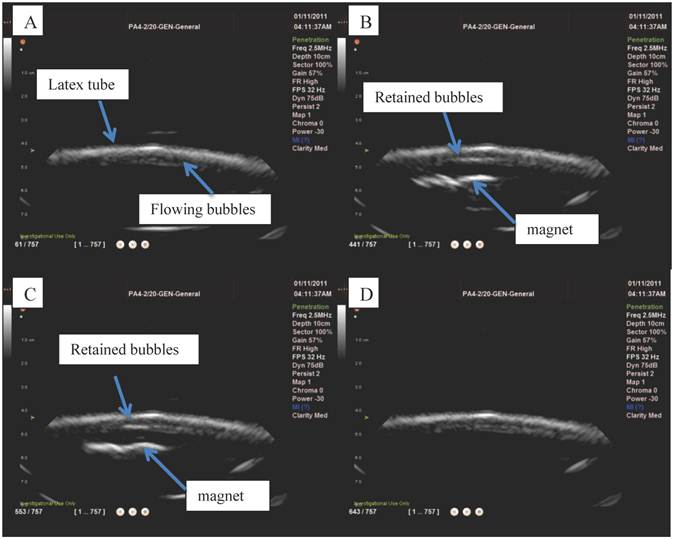
Ultrasound imaging in a larger scale flow phantom was carried out in order to examine the echogenicity of the particles and whether or not retention was possible in a larger vessel at higher flow rates. First, L-α-phosphatidylcholine magnetic microbubbles were injected. As soon as the magnetic microbubbles were observed on the ultrasound scanner (Figure 9 A), the Halbach array was inserted and retention of magnetic microbubbles was observed as shown in Figure 9 B and C. Upon removal of the Halbach array, the magnetic microbubbles were removed by flow in the tube (Figure 9 D). Retention of magnetic microbubbles was observed for flow rates of up to ~6 cm/s (Figure 3). This corresponds to shear rates of between 20 and 60 s-1. For each flow rate, retention was confirmed with a minimum of 3 injections of magnetic bubbles.
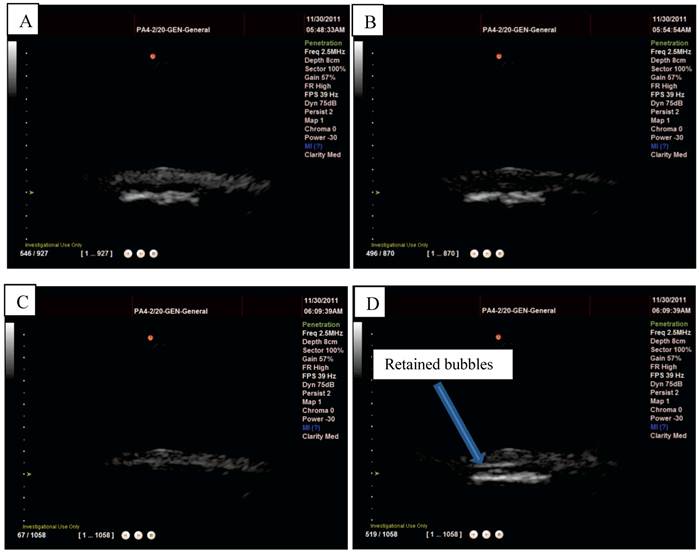
L-α-phosphatidylcholine microbubbles alone were injected into the flow phantom and could be easily observed on the scanner (Figure 10 A) but, as would be expected, no retention was observed upon insertion of the Halbach array. Magnetic droplets were injected into the flow phantom and, also as expected, no acoustic signal was detected (Figure 10 B) and consequently again upon insertion of the Halbach array no effect was observed. Finally, the magnetic droplet/microbubble mixture was injected into the flow phantom. A clear signal from particles in the tube could be seen on the scanner as shown in Figure 10 and upon insertion of the Halbach array retention was observed at flow rates up ~6 cm/s as shown in Figure 10 D. This was observed consistently for three injections from two different mixtures. No fluorescent formulations were used in the flow phantom experiments.
Fluorescent magnetic droplet mixture under optical microscopy shown in phase contrast in A) and fluorescence image in B) at 100x magnification (scale bar in A is 25 µm for images A and B). C) Phase contrast image of a microbubble (400x magnification) in a mixture of fluorescent magnetic droplets and D) a fluorescence image of the same microbubble now fluorescing indicating the microbubble is interacting with fluorescent magnetic droplets.
Microbubbles mixed with fluorescent isoparaffin droplets fluorescing indicating that the microbubbles are interacting with the oil based as well as the magnetic droplets. Scale bars are shown in the diagram (100 µm).
Microbubbles mixed with magnetic droplets in a 200 µm capillary tube before A) and B) after the application of a magnetic field.
Ultrasound images from the flow phantom study: A) magnetic microbubbles flowing through an 8mm inner diameter latex tube, B) a magnetic array is brought underneath and magnetic microbubbles are retained at the lower surface of the tube and C) the number of bubbles retained increases over time. When the magnetic array is removed (D) the microbubbles are removed by the flow.
Magnetic droplets and microbubbles being retained under flow in vitro: A) non-magnetic microbubbles showing no retention upon application of a magnetic field (distributed throughout the tube), B) magnetic droplets showing no ultrasound signal when flowing through a latex tube (centre of the tube appears dark), C) a mixture of magnetic droplets and microbubbles flowing through the tube (again tube is filled with echogenic material) and D) being retained by a magnetic field.
4. Discussion
The optical microscopy images (Figure 4) appear to indicate that there was no interaction between the magnetic droplets and the microbubbles upon mixing. On this basis it might be concluded that the increased levels of transfection observed in the previous gene delivery experiments (19) were due to an interaction between the droplets and the cells, which potentiated the subsequent effect of the microbubble oscillations. The fluorescence images, however, suggest otherwise (Figure 6). Upon mixing with the droplets, the initially non-fluorescent bubbles were seen to fluoresce, indicating that the magnetic droplets were coating or coalescing with the microbubble surface. The fact that the bubbles remained fluorescent after centrifuging suggests that the interaction produced strong binding. To investigate whether the magnetic nanoparticles were integral to the interaction, isoparaffin-only fluorescent droplets were synthesised and the process was repeated. The microbubbles were still observed to fluoresce as shown in Figure 7.
It was evident from its colour, even under optical microscopy, that the magnetic droplet suspension contained objects on the nano- as well as the micro- scale which cannot be resolved optically. This is supported by results in a recent publication regarding magnetoliposomes which showed that oleic acid coated iron oxide nanoparticles aggregated when mixed with phospholipid in aqueous solution (24). These magnetic droplets most likely interact with the phospholipid microbubbles. Evidence for this is that when the microbubbles fluoresce, microscale vesicles are still fluorescing nearby and optical microscope images appear to show no interaction between the microscale droplets and the microbubbles. As the microbubbles now fluoresce it is reasonable to assume that interaction must come from nanoscale droplets.
The interaction appeared to be strong enough to withstand centrifugation and resist hydrodynamic forces within an aqueous suspension. The influence of different species in the suspending medium on the interaction was not investigated but the microbubble and the magnetic droplets are both coated in phospholipids with polar head groups oriented towards the water and as such should be stable. To the authors' knowledge, no studies or models have been reported which examine the interaction between bubbles and droplets. Studies have been performed however on lecithin vesicles where large vesicles grow at the expense of smaller ones due to size disproportionation or Ostwald ripening (25) and one possibility is that it is a similar mechanism by which droplets and microbubbles form magnetic microbubbles. Such a process is determined by energetic stability, small droplets are kinetically stable whereas large droplets are thermodynamically stable; due to the surface to volume ratio (26).
In order to obtain an approximate comparison of the relative surface energies of the microbubble and the magnetic droplet, the Laplace pressure must be calculated using:
(4)
Where σ is the interfacial tension and R is the radius of the bubble or droplet. The surface energy can then be found as:
(5)
Where A is the surface area and V is the volume. The interfacial tension for an air and water interface is 72.75 mN/m at room temperature, and for water and isoparaffin is 48 mN/m (27). The microbubbles had a modal diameter, from Figure 4, of 2.5 µm. The droplets coating the microbubbles must be on the nanoscale and a variable size between 20 and 200 nm was assumed. With these figures a surface energy of - 2.38 x 10⁻¹² Nm is obtained for a 2.5 µm air microbubble in water which is lower than -1.01 x 10⁻¹⁶ Nm for a 20 nm oil droplet. A 200 nm droplet has a surface energy of -1.01 x 10⁻¹⁴ Nm which is still lower than for a microbubble. A 2 µm droplet has a surface energy of -1.01 x 10⁻¹² Nm which is of the same order of magnitude as the microbubble. This indicates that a nanoscale droplet would be likely to interact with the microbubble whereas a micrometre scale droplet would not.
These calculations do not take into account the lipid coating of the droplet or the microbubble. The presence of a lipid monolayer would lower the interfacial tension in both cases. However, the system would still be expected to adopt a more energetically favourable state and lipids are known to mediate fusion between vesicles and membranes (28). The influence of additional membrane components such as polyethylene glycol (PEG), which are present in commercially available microbubbles to aid biocompatibility, might inhibit interaction between microbubbles and droplets but the aim of this study was to investigate the microbubble compositions used in [19] which did not contain PEG.
4.1. Flow phantom results
The interaction between the magnetic droplets and the microbubbles to form magnetic microbubbles was further reinforced by the flow phantom studies. Upon optical observation of the magnetic droplet/microbubble mixture in a 200 µm capillary tube, objects similar to magnetic microbubbles were observed and responded upon application of a magnetic field as shown in Figure 8. The whole population responded in the absence of flow and a subpopulation was retained against shear rates of approximately 20 s-1. It was, however, difficult to distinguish optically between magnetic microbubbles and large magnetic droplets; but under ultrasound imaging it was shown that particles that were both magnetically and acoustically responsive could be successfully retained by a magnetic field against shear rates of up to ~60s-1 (10).
These results also indicate that magnetic microbubbles can be retained under physiologically relevant flow conditions. Blood flow rates and wall shear stresses vary considerably throughout the body. For example, the mean shear rate can vary from 40 s-1 in the Venae cavae to 580 s-1 in the capillaries (29) (30). Evidence of successful retention in vivo has already been shown in a mouse model (31) but further work is required to assess the feasibility of retention over a wider range of shear rates and of generating the required magnetic field strengths and gradients at larger tissue depths.
5. Summary and Conclusions
The aim of this study was to investigate the mechanisms underlying the results of a previous investigation in which it was shown that a mixture of magnetic liquid droplets and non-magnetic microbubbles was more effective for gene delivery than a suspension of magnetic microbubbles. Two possible mechanisms were proposed: that the magnetic droplets sensitised the cells to sonoporation or that some form of association between the droplets and the microbubbles occurred producing particles that were both magnetically and acoustically responsive.
The observations under optical microscopy in this study were in agreement with those from the previous work and seemed to indicate that no interaction took place between the droplets and particles. Optical images of the mixed suspension in a capillary tube in the presence of a magnetic field however indicated particles that were buoyant (and therefore not magnetic liquid droplets) and did respond upon application of a magnetic field. Fluorescence microscopy confirmed that initially non-fluorescent bubbles became coated with fluorescent droplets and that the interaction was sufficiently strong to resist centrifugation. Further examination indicated that the coating was effected by nanoscale liquid droplets and this was why the interaction was not visible under optical microscopy. Surface energy calculations also showed that the magnetic droplets had a lower surface energy than the lipid-coated microbubbles; consequently, adsorption of the droplets to the microbubbles was energetically favourable. Thus it may be reasonably concluded that the results obtained in the previous gene delivery study may be attributed to this interaction. The reason for the higher transfection rates is possibly due to a higher concentration of magnetically and acoustically responsive particles being formed than that present in the magnetic microbubble suspension. Alternatively the response to the ultrasound and/or magnetic field may have been different and this will require further investigation.
Both the magnetic microbubbles and the particles formed from the mixed suspension were echogenic and readily detected under ultrasound imaging. They could also be retained by a magnetic field at centre line velocities of 6 cm s-1 and shear rates of ~60 s -1. These results are promising with respect to the use of magnetic microbubbles as therapeutic delivery vehicles in vivo. These successful preliminary tests need to be fully explored, however. In particular, experiments are required to examine the factors that affect retention: a wider range of flow rates and vessel sizes; the magnitude as well as the gradient of the magnetic field; the distance between the magnet and the vessel (i.e. tissue depth); the liquid density, viscosity and pulsatility. Further investigation of the particle internal structure and their performance in therapeutic delivery will also be required.
Acknowledgements
The authors would like to thank The Leverhulme Trust, The Engineering and Physical Sciences Research Council, University College London and The Royal Institution of Great Britain for contributing funding towards this research. They would also like to thank Ms. Graciela Mohamedi, Dr. Neveen Hosny, Dr. Julian George and Prof. Constantin Coussios for their assistance and advice.
Competing Interests
The authors have declared that no competing interest exists.
References
1. Pankhurst QA, Connolly J, Jones SK, Dobson J. Applications of magnetic nanoparticles in biomedicine. Journal of Physics D: Applied Physics. 2003;36(13):R167-R81
2. Ferrara K, Pollard R, Borden M. Ultrasound microbubble contrast agents: Fundamentals and application to gene and drug delivery. Annual Review of Biomedical Engineering. 2007;9:415-47
3. Unger EC, Hersh E, Vannan M, Matsunaga TO, McCreery T. Local drug and gene delivery through microbubbles. Progress in Cardiovascular Diseases. 2001;44(1):45-54
4. Harvey CJ, Pilcher JM, Eckersley RJ, Blomley MJK, Cosgrove DO. Advances in ultrasound. Clinical Radiology. 2002;57(3):157-77
5. Schlicher RK, Radhakrishna H, Tolentino TP, Apkarian RP, Zarnitsyn V, Prausnitz MR. Mechanism of intracellular delivery by acoustic cavitation. Ultrasound Med Biol. 2006;32(6):915-24
6. Rahim A, Taylor SL, Bush NL, ter Haar GR, Bamber JC, Porter CD. Physical parameters affecting ultrasound/microbubble-mediated gene delivery efficiency in vitro. Ultrasound Med Biol. 2006;32(8):1269-79
7. Thanh NTK. Magnetic Nanoparticles: From Fabrication to Clinical Applications. Taylor and Francis. 2011
8. Zimmerman U, Scheurich P, Pilwat G, Benz R. Cells with manipulated functions: New perspectives for cell biology, medicine, and technology. Angewandte Chemie - International Edition in English. 1981;20(4):325-44
9. Senyei AE, Reich SD, Gonczy C, Widder KJ. In vivo kinetics of magnetically targeted low-dose doxorubicin. Journal of Pharmaceutical Sciences. 1981;70(4):389-91
10. Widder KJ, Senyei AE, Ranney DF. In vitro release of biologically active adriamycin by magnetically responsive albumin microspheres. Cancer Research. 1980;40(10):3512-7
11. Scherer F, Anton M, Schillinger U, Henke J, Bergemann C, Krüger A, Gänsbacher B, Plank C. Magnetofection: Enhancing and targeting gene delivery by magnetic force in vitro and in vivo. Gene Therapy. 2002;9(2):102-9
12. Plank C, Zelphati O, Mykhaylyk O. Magnetically enhanced nucleic acid delivery. Ten years of magnetofection-Progress and prospects. Advanced Drug Delivery Reviews. 2011;63(14-15):1300-31
13. Soetanto K, Watarai H. Development of magnetic microbubbles for drug delivery system (DDS). Japanese Journal of Applied Physics, Part 1: Regular Papers and Short Notes and Review Papers. 2000;39(5 B):3230-2
14. Soetanto K, Watarai H. Ferromagnetic Ultrasound Microbubbles Contrast Agent. Cancun. 2003
15. Yang F, Li L, Li Y, Chen Z, Wu J, Gu N. Superparamagnetic nanoparticle-inclusion microbubbles for ultrasound contrast agents. Physics in Medicine and Biology. 2008;53(21):6129-41
16. Yang F, Li Y, Chen Z, Zhang Y, Wu J, Gu N. Superparamagnetic iron oxide nanoparticle-embedded encapsulated microbubbles as dual contrast agents of magnetic resonance and ultrasound imaging. Biomaterials. 2009;30(23-24):3882-90
17. Vlaskou D, Mykhaylyk O, Krötz F, Hellwig N, Renner R, Schillinger U, Gleich B, Heidsieck A, Schmitz G, Hensel K, Plank C. Magnetic and Acoustically Active Lipospheres for Magnetically Targeted Nucleic Acid Delivery. Advanced Functional Materials. 2010;20(22):3881-94
18. Vlaskou D, Pradhan P, Bergemann C, Klibanov AL, Hensel K, Schmitz G, Plank C, Mykhaylyk O. Magnetic microbubbles: Magnetically targeted and ultrasound-triggered vectors for gene delivery in vitro. Rostock. 2010
19. Stride E, Porter C, Prieto AG, Pankhurst Q. Enhancement of Microbubble Mediated Gene Delivery by Simultaneous Exposure to Ultrasonic and Magnetic Fields. Ultrasound in Medicine & Biology. 2009;35(5):861-8
20. Kuimova MK, Yahioglu G, Levitt JA, Suhling K. Molecular rotor measures viscosity of live cells via fluorescence lifetime imaging. Journal of the American Chemical Society. 2008;130(21):6672-3
21. Sennoga CA, Mahue V, Loughran J, Casey J, Seddon JM, Tang M, Eckersley RJ. On sizing and counting of microbubbles using optical microscopy. Ultrasound Med Biol. 2010;36(12):2093-6
22. Willert CE, Gharib M. Digital particle image velocimetry. Experiments in Fluids. 1991;10(4):181-93
23. Verkaik AC, Beulen BWAMM, Bogaerds ACB, Rutten MCM, van de Vosse FN. Estimation of volume flow in curved tubes based on analytical and computational analysis of axial velocity profiles. Physics of Fluids. 2009 21(2)
24. Amstad E, Kohlbrecher J, Müller E, Schweizer T, Textor M, Reimhult E. Triggered release from liposomes through magnetic actuation of iron oxide nanoparticle containing membranes. Nano Letters. 2011;11(4):1664-70
25. Johnson NW, Kaler EW. Size disproportionation in vesicular dispersions. Journal of Colloid and Interface Science. 1987;116(2):444-57
26. Taylor P. Ostwald ripening in emulsions. Advances in Colloid and Interface Science. 1998;75(2):107-63
27. NPL. http://www.kayelaby.npl.co.uk/general_physics/2_2/2_2_5.html
28. Mouritsen O. Life - As a Matter of Fat. Springer. 2001
29. Whitmore RL. The flow behaviour of blood in the circulation. Nature. 1967;215(5097):123-6
30. Eckmann DM, Bowers S, Stecker M, Cheung AT. Hematocrit, volume expander, temperature, and shear rate effects on blood viscosity. Anesthesia and Analgesia. 2000;91(3):539-45
31. Mulvana H, Eckersley RJ, Browning R, Hajnal JV, Stride E, Barrack T, Tang M, Pankhurst Q, Wells D. Enhanced gene transfection in vivo using magnetic localisation ofultrasound contrast agents: Preliminary results. San Diego, CA. 2010
Author contact
![]() Corresponding author: Email: eleanor.strideox.ac.uk.
Corresponding author: Email: eleanor.strideox.ac.uk.
 Global reach, higher impact