Theranostics
13.3
Impact Factor
 Global reach, higher impact
Theranostics 2019; 9(13):3674-3686. doi:10.7150/thno.32943 This issue Cite
Research Paper
Theranostic application of lipiodol for transarterial chemoembolization in a VX2 rabbit liver tumor model
Johanna Maria Mijntje van Breugel1,2,3, Jean-François Geschwind4 ![]() , Sahar Mirpour5, Lynn Jeanette Savic1, Xuchen Zhang6, Rafael Duran7, MingDe Lin1, Milena Miszczuk1, Eleni Liapi5, Julius Chapiro1
, Sahar Mirpour5, Lynn Jeanette Savic1, Xuchen Zhang6, Rafael Duran7, MingDe Lin1, Milena Miszczuk1, Eleni Liapi5, Julius Chapiro1
1. Department of Radiology and Biomedical Imaging, Yale School of Medicine, New Haven, Connecticut, USA
2. Department of Radiology, University Medical Center Utrecht, Utrecht, The Netherlands
3. Medical faculty, Utrecht University, Utrecht, The Netherlands
4. Founder, Prescience labs now Cage Pharma, USA
5. Russell H. Morgan Department of Radiology and Radiological Science, Division of Vascular and Interventional Radiology, The Johns Hopkins Hospital, Baltimore, Maryland.
6. Department of Pathology, Yale School of Medicine, New Haven, Connecticut, USA
7. Department of Diagnostic and Interventional Radiology, Lausanne University Hospital, Lausanne, Switzerland
Received 2019-1-8; Accepted 2019-3-25; Published 2019-5-27
Citation:
van Breugel JMM, Geschwind JF, Mirpour S, Savic LJ, Zhang X, Duran R, Lin M, Miszczuk M, Liapi E, Chapiro J. Theranostic application of lipiodol for transarterial chemoembolization in a VX2 rabbit liver tumor model. Theranostics 2019; 9(13):3674-3686. doi:10.7150/thno.32943. https://www.thno.org/v09p3674.htm
Other stylesAbstract

The goal of this study was to investigate the role of Lipiodol as a tumor-specific imaging biomarker to determine therapeutic efficacy of cTACE and investigate its inter-dependency with tumor perfusion using radiological-pathological correlation in an animal model of liver cancer.
Methods: A total of N=36 rabbits were implanted in the left lobe of the liver with VX2 tumors, treated with cTACE using doxorubicin suspended in Lipiodol, and randomly sacrificed at 24 h, 7 days, or 20 days post-TACE. Unenhanced and contrast-enhanced CT scans including a perfusion protocol were obtained before cTACE and immediately before sacrifice. Tumor vascularity and Lipiodol deposition within tumors and hepatic tissue (non-target deposits) were quantified using 3D quantitative assessment tools and measurements of arterial flow, portal flow, and perfusion index (PI). After sacrifice histologic staining, including hematoxylin and eosin (H&E), CD31, and Oil Red O (ORO) were performed on tumor and liver samples to evaluate necrosis, microvascular density (MVD), and Lipiodol retention over time. Transmission electron microscopy (TEM) was performed to assess Lipiodol deposition and clearance over time.
Results: All cTACE procedures were carried out successfully except for one, which was excluded from further analysis. Twenty-four hours post-TACE, tumor PI (p=0.04) was significantly decreased, which was maintained at 7 days (p=0.003), but not at 20 days (p=0.4). A strong correlation (R2 = 0.894) was found between the volume of enhancing tumor tissue at baseline and Lipiodol-positive tumor volume post-TACE. Both ORO and TEM showed deposition of Lipiodol across all imaging time points within the VX2 tumors. However, gradual and ultimately near-complete Lipiodol washout was observed over time in the non-tumoral liver. MVD decreased between 24 h and 7 days post-TACE, and then increased 20 days post-TACE (both p<0.01).
Conclusions: Our data provide radiology-pathology evidence for the function of Lipiodol as a theranostic, tumor-specific drug delivery agent because it is both imageable and tumor-seeking, whereby it is preferentially taken up and retained by tumor cells. Those tumor-specific functions also enable Lipiodol to act as an imaging biomarker for the therapeutic efficacy of cTACE. Together with volumetric quantification of tumor vascularization on CT, Lipiodol could be used as a predictor of a patient's response to cTACE and contribute to the therapeutic management of patients with liver cancer.
Keywords: TACE, Lipiodol, VX2 liver tumor model, HCC, biomarker
Introduction
Hepatocellular carcinoma (HCC) is the second most common cause of cancer related deaths worldwide and its incidence is continuing to rise [1-3]. Curative therapies such as resection, ablation, and transplantation are not amenable to more than 75% of patients who present with intermediate to advanced stage disease at diagnosis [4]. For such patients, transarterial chemoembolization (cTACE) has become the mainstay of therapy and is the most commonly used therapy worldwide [2, 5, 6]. In cTACE, a water-in-oil emulsion of a cytotoxic drug (mostly doxorubicin) into Lipiodol is selectively administered via a microcatheter into the tumor-feeding branches of the hepatic artery followed frequently by the injection of an embolic agent (bland beads or gelfoam) to slow down arterial inflow and prevent the emulsion from breaking apart [7]. Already in the 1980s, Miyauchi and Iwai et al. described the potential advantages of dissolving lipid-soluble drugs in lipids, such as Lipiodol, linoleic acid, and olive oil. The identified benefits included tumor-selective targeting, a more pronounced anticancer effect with fewer side effects, prolonged drug retention leading to fewer needed administrations, a variety of lipids with various pharmacokinetic properties to choose from, and a practical method of administration through the arterial blood supply [8, 9].
At the current time, Lipiodol is the most often used lipid in clinical practice. Lipiodol is derived from iodinated poppy seed oil and plays a unique multi-functional role in cTACE [10, 11]. In addition to being a drug emulsifier and carrier with transient micro-embolic effects on tumor vasculature, Lipiodol functions as a contrast agent and imaging biomarker of drug delivery to the tumor both during the actual procedure and as assessed after the procedure on cone-beam and multi-detector computerized tomography (CBCT and MDCT) [10, 12, 13]. Some reports suggest that Lipiodol retention within tumors correlates well with tumor response and clinical outcome (the greater Lipiodol retention the better the tumor response and clinical outcome). It also appears that imaging features of the tumor at baseline can be used to determine lipiodol deposition within the tumor; specifically the presence of homogeneous tumor hypervascularization predicts excellent Lipiodol deposition within the tumor post-cTACE [14, 15]. This volume of Lipiodol deposition within the tumor as measured on MDCT one day after cTACE itself is capable of predicting the amount of tumor necrosis and subsequent patient survival even better [16, 17]. It is therefore clear that Lipiodol's theranostic potential is a key advantage of cTACE over other types of transarterial chemoembolotherapies using various non-Lipiodol based beads such as drug-eluting beads. Importantly, data from patients undergoing cTACE as a bridge to liver transplantation demonstrated that complete tumor coverage with Lipiodol on follow-up imaging resulted in histologically confirmed complete necrosis of the lesion [18, 19]. This finding established complete tumor coverage as an important cTACE endpoint and suggests that Lipiodol may be used as an early surrogate marker to monitor the efficacy of cTACE and predict tumor response to cTACE allowing for early optimization of treatment planning [20, 21].
However, the key biological understanding behind these unique properties of Lipiodol have never been conclusively demonstrated, yet they are critical to fully elucidate if Lipiodol is to be used as a true theranostic agent. Thus, the goal of this study is to investigate the role of Lipiodol as a tumor-specific imaging biomarker for therapeutic efficacy and investigate its inter-dependency with tumor perfusion using a radiological-pathological correlation approach in an animal model of liver cancer.
Materials and Methods
VX2 Rabbit Tumor Model
This study was approved by the institutional Animal Care and Use Committee, and was performed in accordance with the institutional guidelines. Thirty-six male New Zealand White rabbits weighing 3.5-4.2 kg underwent implantation of rabbit VX2 tumors in the left lobe of the liver as explained in detail by existing literature [22-24]. The VX2 tumor model was originally derived from a rabbit carcinosarcoma, but closely resembles the human HCC cell line from a biological standpoint [25]. The tumors were allowed to grow until a well demarcated solitary lesion with a diameter of 1.5-2.0 cm was present [26, 27]. All animals were subjected to cTACE 13-15 days after VX2 liver implantation and underwent CT imaging prior to the procedure and at several time points after cTACE followed by euthanasia. Prior to tumor implantation, animals were randomly assigned to the following three experimental groups: Group A (n = 12), in which rabbits were to be euthanized 24 h after cTACE, group B (n = 12), in which rabbits were to be euthanized seven days after cTACE, and group C (n = 12), in which rabbits were to be euthanized 20 days after cTACE.
Transarterial Chemoembolization Procedure
Lipiodol-Doxorubicin Emulsion
The doxorubicin solution was prepared prior to intra-arterial injection. Vials containing 5 mg of doxorubicin powder were reconstituted with 2 ml of sterile water for injection with a final stock concentration of 2.5 mg/mL. The doxorubicin solution was mixed to obtain a homogenous and clear solution. For each rabbit, 0.5 mL of the stock solution was mixed 1:2 with Lipiodol (Guerbet, France) i.e. one volume of doxorubicin and 2 volumes of Lipiodol, using a metallic stopcock device according to the method described by De Baere et al [28]. A slightly greater amount of Lipiodol than doxorubicin is preferred because such a ratio of Lipiodol to drug has been shown to increase the stability of the mixture, increase the targeted delivery of the mixture, and decrease the washout of the chemotherapeutic agent into the systemic circulation [29]. The doxorubicin concentration used in this study is higher than typically used for patient treatments (~50 mg or 50 mg/m2) when given systemically but not when administered intraarterially as part of the standard cTACE procedure where a single dose of 50 mg is given to patients. Such a dose allometrically adjusted for the weight of the animal is also commonly used in animal experiments [29].
Catheterization and cTACE
Anesthesia was induced and maintained using inhalant isoflurane in oxygen via a nose cone at 5% or 1.5-3%, respectively. A surgical cut down was performed to gain access to the common femoral artery with a 3-French sheath (Cook, Inc., Bloomington, IN). A 2-French catheter with a tip in the shape of a hockey stick (JB1 catheter; Cook, Inc., Bloomington, IN), specifically manufactured for this work, was advanced to the celiac axis under fluoroscopy guidance. Hereafter, a celiac arteriogram was obtained to delineate the blood supply to the liver and confirm the location of the tumor. The tumor typically appeared as a region of hypervascular blush located in the left liver lobe near the gastric fundus. Tumor-feeding vessels nearly exclusively derived from the left hepatic artery. Thus, the left hepatic artery was selectively catheterized off the common hepatic artery with the aid of a steerable guide wire (0.010-0.014 in. Transcend wire; Boston Scientific Oncology, Natick, MA). Once adequate positioning of the catheter was confirmed on fluoroscopy, the mixture of Lipiodol and doxorubicin (up to 1 mL; final doxorubicin dose, up to 1.25 mg) was slowly infused under fluoroscopic guidance. Embolization of the tumor-feeding artery was achieved by the subsequent injection of 0.1-0.3 mL beads (100-300 μm, Embospheres, BioSphere Medical, now Merit Medical, Salt Lake City, Utah) mixed with an equal volume of non-ionic contrast medium (Omnipaque 350, GE Healthcare) until the entire dose was delivered or near stasis was achieved. Upon completion of the treatment, the catheter was removed, while maintaining gentle suction in order to keep remaining beads within the catheter lumen. The common femoral artery was ligated using non-resorbable suture material to obtain hemostasis. After the procedure, the animals were monitored until fully recovered from anesthesia. Buprenorphine (0.02-0.05 mg/kg) was administered subcutaneously upon recovery for pain control. The animals were returned to the animal facilities and monitored daily until the time of sacrifice.
Contrast-enhanced CT Imaging and Perfusion Assessment
Wide-array volumetric perfusion CT scan of the liver
Multi-detector CT imaging was acquired prior to and after cTACE (day 1, day 7 and day 20) in order to determine the predictive value of tumor vascularization for Lipiodol deposition and the correlation of changes in tumor perfusion and Lipiodol retention with tumor response to treatment. Each rabbit was scanned in a 320-volumetric clinical CT scanner (Aquillon One, Toshiba, Japan) for characterization of tumor vascularity at baseline and quantification of Lipiodol deposition after treatment. The animals were sedated and placed in the CT scanner in supine position. A volumetric scan included a non-contrast enhanced CT (NECT) scan and a series of contrast-enhanced CT (CECT) scans following the injection of 1.5 mL/kg iso-osmolar contrast medium at 1 mL/sec. The volumetric scanning parameters were: field of view = 22 cm, KV = 120, mA = 80, slice thickness = 0.5 mm, scan delay = 6 sec. Total intermittent scanning time for each rabbit scan was 74 s. During the first (predominantly arterial) phase 21-23 s after contrast injection, volumetric scans were obtained every 2 s for a total duration of 25 s. During the second (delayed arterial and portal venous) phase, volumetric scans were obtained every 3s for 42 s.
Post-processing CT perfusion imaging assessment
Tumor and liver perfusion were quantitatively assessed by measuring the CT perfusion parameters arterial flow (AF), portal venous flow (PF) and perfusion index (PI) using the Vitrea Body Perfusion application (VitreaCore version 6.5, Vital Images, Minnetonka, USA). PI was defined as the ratio between the arterial perfusion and the sum of the arterial and portal venous perfusion. First, image reconstruction and automatic spatial registration were performed. Second, perfusion (in mL/100 mL/minute) was calculated on a pixel-by-pixel basis by using Fick's single compartment model. Regions of interest (ROIs) were placed in the aorta, the portal vein, liver parenchyma, and the tumor. AF, PF, and PI were calculated based on the maximal slope or the peak height of the tumor tissue concentration curve normalized to the arterial input function. An additional ROI placed in the spleen was needed to discriminate between arterial and portal venous phase in order to calculate the PI.

Volumetric Quantitative Image Analysis
Quantification of Enhancing Tumor Volume
Volumetric measurements on the baseline and follow-up 320-volumetric CT scans were used to determine the extent of contrast enhancement in the tumor and Lipiodol deposition, respectively. Specifically, quantitative segmentation software (Medisys, Philips Research, Suresnes, France) was used to segment the total tumor volume in 3D based on non-Euclidean geometry and the theory of radial basis function as described in previous work [30, 31]. On contrast-enhanced arterial phase images, both the core and enhancing rim were included into the segmentation mask of the tumor. Quantitative EASL technique (quantitative European Association of the Study of the Liver, qEASL, Medisys, Philips Research, Suresnes, France) was performed to calculate the enhancing tumor volume as described in detail elsewhere [32]. Briefly, the pre-contrast imaging set was subtracted from the contrast-enhanced arterial phase images in order to remove tissue background. A ROI was placed in a homogeneous part of healthy liver parenchyma as a subject-specific reference. Enhancing tumor volume was defined as voxels where enhancement exceeded that of the healthy liver parenchyma (>2 standard deviations above the average intensity of the reference ROI) [2, 33, 34].
Quantification of Lipiodol Deposition
On native post-cTACE CT images, Lipiodol is visualized as a hyperdense area due to its radiopacity. To investigate the role of Lipiodol as a tumor specific imaging marker, the aforementioned methodology used to assess enhancing tumor volume was applied to quantify Lipiodol deposition on NECT. Tumor segmentations on arterial phased images were used to exclude extra-tumoral non-target Lipiodol deposition from the analysis following image subtraction (arterial minus non-contrast phase). Lipiodol was then quantified using the qEASL technique.
Tissue processing and histopathological analysis
Gross pathology and Tissue processing
Necropsy was performed after sacrifice of the animal and heart, lungs, kidneys, small intestine, and stomach were inspected for non-target Lipiodol deposition and treatment toxicity. After fixation with 10% formalin, tumor tissues were sliced in 2-3 mm sections for paraffin embedment. Additionally, tumor samples (up to 1.5 ml each, in 2 ml cryovials) were first frozen in dry ice and subsequently stored at -80 ºC. Fresh frozen tissue samples were cut using a cryotome and processed for Oil Red O staining (Sigma Aldrich, St. Louis, USA).
Histopathological analysis of tumor necrosis
Paraffin blocks were cut and stained with hematoxylin and eosin (H&E). Calculation of the percentage of tumor necrosis on H&E slides was performed by a pathologist using a semi-quantitative method. Both the entire tumor and the necrotic parts were outlined for all stained slides and the average percentage of necrosis was calculated.
Immunohistochemistry staining for microvascular density
On paraffin-embedded tissue sections, immunohistochemistry (IHC) staining for CD31 was performed to demonstrate the presence of endothelial cells as a surrogate marker for the degree of tumor angiogenesis and vascularity. Microvascular density (MVD) analysis was performed using Imagescope (Aperio, Vista, USA) at a 10x magnification. Three representative areas within the tumor were chosen and vessels within this area (including upper and left border) were counted. The average number of vessels was calculated using these three values and the MVD was reported as number of vessels per mm2.
Histological Analysis of intra-tumoral Lipiodol deposition
To assess Lipiodol retention and tumor-specificity, Oil Red O (ORO) staining was used to quantify Lipiodol deposition patterns on histopathological slides. ORO is a fat-soluble dye used for staining of neutral triglycerides, like the ethyl esters of fatty acids of Lipiodol, and lipids or lipoproteins. ORO positive stain was assessed qualitatively and quantitatively. Whole stained slides were digitally scanned and evaluated at a 20X magnification. Lipiodol deposition coverage of the tumor cells was categorized into four groups: 0-25%, 26-50%, 51-75%, and 76-100%.
Transmission Electron Microscopy (TEM) of Lipiodol deposition
Fresh liver and tissue samples were collected after euthanasia and processed for transmission electron microscopy (TEM) imaging. Tissue pieces (3 mm3) were fixed in 2.0% glutaraldehyde, 2% paraformaldehyde (freshly prepared), 0.1 M sodium cacodylate, 1% sucrose and 3 mM CaCl2, at pH 7.4 and 4 ºC overnight. The samples were rinsed with buffer and post-fixed in 2% osmium tetroxide with 0.1 M sodium cacodylate and 3 mM calcium chloride on ice protected from light for one hour. After brief washing D-H2O, the cells were placed in 2% uranyl acetate (0.22 µm filtered) at room temperature in the dark for one hour. Following en-bloc staining, the cells were dehydrated in a dilution series of up to 100% ethanol, transferred through propylene oxide, embedded in Eponate 12 and cured at 60 ºC for two days.
The sections were cut on a Reichert-Jung Ultracut E (Reichert-Jung, Vienna, Austria) with a DiATOME Diamond knife (DiATOME, Hatford, USA). Sections of 80 nm were picked up on formvar coated 1×2 mm copper slot grids. Grids were viewed on a Hitachi 7600 TEM (Hitachi, Berkshire, UK) operating at 80 kV and digital images were captured with an AMT 1 K x 1 K CCD camera.
Results
Transarterial Chemoembolization procedure
All but one transarterial chemoembolization procedures were successful and no peri-procedural complications were encountered. A single animal was excluded from group A (24 h) due to a failed embolization attempt. All liver VX2 tumors were clearly visualized as a single hyper-vascular tumor on pre-treatment angiographic imaging. Following transarterial chemoembolization with the Lipiodol/doxorubicin mixture, Lipiodol deposition was clearly seen in all tumors at the different time-points (24 h, day 7, day 20).
CT Imaging and Perfusion Assessment
Baseline CT perfusion assessment of tumor vascularity
All VX2 tumors at baseline had a hyper-vascular rim with a hypo-vascular core. Quantitative analysis of CT perfusion measurements did not reveal a statistically significant difference between the AF of the tumor and the AF of either the left or the right hepatic lobe, indicating that the VX2 tumors had a perfusion similar to that of liver parenchyma. On the other hand, both PF and PI were significantly different between the tumor and the liver parenchyma, confirming that the portal venous inflow to healthy liver parenchyma was higher than that to the tumor and reflecting the fact that the PI values were affected by the PF (Table 1).
CT perfusion assessment of tumor response to TACE
CT perfusion measurements (AF, PF and PI) were acquired for each time point (baseline, 24 h, 7 days, 20 days). One day after treatment, tumor PI statistically significantly decreased (mean tumor PI pre TACE = 62.25%, mean tumor PI post TACE = 49.05%, p=0.04), which was also observed at 7 days (p=0.003), but not at 20 days (p=0.4). Tumor AF and PF decreased (Table 2) but neither was statistically significant.
Table 1
CT perfusion values of tumors, left and right hepatic lobes for all rabbits (n=36) before TACE. Tumors were implanted in the left lobe of the liver. There was no statistically significant difference between the arterial flow (AF) in the tumor compared to the left or right hepatic lobes, respectively. Both portal venous flow (PF) and the perfusion index (PI) as well as the Hounsfield units (HU) were significantly different between the tumor and right or left liver parenchyma, respectively. SD is standard deviation; SEM is standard error of the mean.
| Tumor | Left Liver (tumor side) | Right Liver (healthy side) | ||||||||||
|---|---|---|---|---|---|---|---|---|---|---|---|---|
| AF (mL/min/ 100 mL) | PF (mL/min/ 100 mL) | PI (%) | HU | AF (mL/min/ 100 mL) | PF (mL/min/ 100 mL) | PI (%) | HU | AF (mL/min/ 100 mL) | PF (mL/min/ 100 mL) | PI (%) | HU | |
| Average | 105.44 | 58.54 | 67.60 | 144.60 | 86.02 | 124.07 | 41.14 | 123.53 | 218.17 | 121.80 | 42.49 | 119.03 |
| SD | 42.58 | 38.99 | 14.90 | 23.88 | 55.35 | 63.48 | 21.90 | 25.31 | 859.71 | 64.58 | 20.29 | 23.47 |
| SEM | 6.28 | 5.75 | 2.20 | 3.52 | 8.16 | 9.36 | 3.23 | 3.73 | 126.76 | 9.52 | 2.99 | 3.46 |
| T test p-values | 0.062 | <0.0001 | <0.0001 | <0.0001 | 0.37 | <0.0001 | <0.0001 | <0.0001 | ||||
Table 2
CT perfusion values of VX2 tumors for rabbits euthanized at 24 h, 7 days, or 20 days following TACE. Paired t-test comparisons are made between baseline and follow-up measurements of the same rabbits. Note that there is a significant change in the tumor PI values after treatment (24 h group and 7 days group). SD is standard deviation; SEM is standard error of the mean.
| 24 h Group (n=11) | AF (mL/min/100 mL) | PF (mL/min/100 mL) | PI (%) | HU (-) | |
|---|---|---|---|---|---|
| Pre TACE | Mean | 122.83 | 76.00 | 49.05 | 210.78 |
| SD | 73.11 | 36.76 | 12.00 | 69.39 | |
| SEM | 36.56 | 18.382 | 6.00 | 34.69 | |
| Post TACE | Mean | 90.57 | 60.41 | 62.25 | 117.51 |
| SD | 18.70 | 19.74 | 7.90 | 24.62 | |
| SEM | 8.36 | 8.82 | 3.53 | 11.01 | |
| T test p-values | 0.32 | 0.38 | 0.04 | 0.01 | |
| 7 days Group (n=12) | AF (mL/min/100 mL) | PF (mL/min/100 mL) | PI (%) | HU (-) | |
| Pre | Mean | 104.33 | 33.39 | 78.85 | 156.39 |
| SD | 22.61 | 23.02 | 10.80 | 20.90 | |
| SEM | 7.99 | 8.13 | 3.81 | 7.39 | |
| Post | Mean | 103.77 | 91.35 | 48.14 | 212.37 |
| SD | 58.85 | 112.36 | 13.80 | 73.33 | |
| SEM | 19.61 | 37.45 | 4.60 | 24.44 | |
| T test p-values | 0.97 | 0.14 | <0.0001 | 0.04 | |
| 20 days Group (n=12) | AF (mL/min/100 mL) | PF (mL/min/100 mL) | PI (%) | HU (-) | |
| Pre | Average | 87.18 | 71.9 | 62.24 | 151.44 |
| SD | 19.35 | 60.42 | 15.63 | 22.69 | |
| SEM | 9.67 | 30.21 | 7.81 | 11.34 | |
| Post | Average | 64.67 | 62.62 | 52.45 | 136.5 |
| SD | 28.94 | 48.60 | 9.68 | 60.31 | |
| SEM | 16.71 | 28.06 | 5.58 | 34.82 | |
| T test p-values | 0.22 | 0.82 | 0.35 | 0.62 |
Figure 1
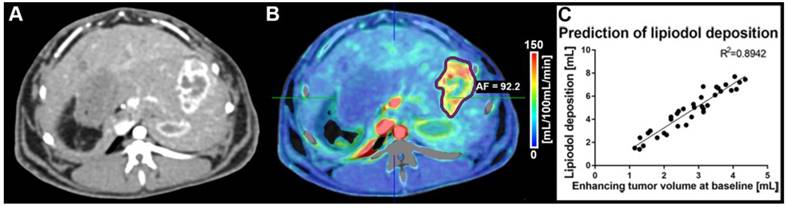
(A) Contrast-enhanced dynamic perfusion CT scan at baseline (arterial phase, 20 s delay, before TACE) showing the tumor implanted in a left lobe of the liver. The tumor rim is enhancing, while the tumor core is not taking up contrast. (B) Arterial flow (AF) color map superimposed on the contrast-enhanced CT scan shown in (A). The tumor was segmented (purple outline) and an average AF of 92.2 mL/100 mL/min was calculated for the lesion. (C) Correlation between enhancing tumor volume (calculated using the qEASL technique on perfusion imaging data) and lipiodol deposition post-cTACE (all timepoints) as calculated with qEASL using the native CT images (R2=0.8942).
Volumetric Quantitative Image Analysis
Quantification of Baseline Enhancing Tumor Volume and Lipiodol on Follow-Up Imaging
CT volumetric measurements were obtained on native and CECT volumetric scans acquired at baseline and before each pre-planned sacrifice time point. Baseline imaging was used to quantify the enhancing tumor volume prior to cTACE to be used for comparison with Lipiodol deposition volumes. At baseline, the mean total tumor volume was 15.1 cm3 and measured 14.4 cm3, 11.5 cm3 and 15.7 cm3 at 24 h, 7 days and 20 days, respectively. The enhancing tumor volume was measured using CECT images and expressed as an absolute volume in cm3/mL. Lipiodol deposition was measured on native CT images using qEASL as already described. Figure 1 depicts the relationship between enhancing tumor volume at baseline and Lipiodol deposition as measured 24h post cTACE. Persistent retention of Lipiodol in the tumor across all time points was measured (Figure 2). Lipiodol deposition was mainly visible in the rim of the tumor and was mostly absent in the tumor core. This observation correlated well with the vascularization/enhancement pattern of rim hyper-enhancement. A strong correlation (R2 = 0.894) was found between the volume of enhancing tumor tissue at baseline and the tumor volume filled with Lipiodol post TACE (R2=0.894) (Figure 1).
Tissue Processing and Histopathological Analysis
Gross pathology
For all groups, the following organs were found to be grossly intact at necropsy: heart, lungs, kidneys and guts. Acute duodenal ulcers were observed in 3 rabbits. The appearance of the liver was characterized by post-embolization changes consisting of patchy triangular pale areas, primarily in the liver lobe that was ipsilateral to the tumor. The tumor appeared necrotic in the center of all treated animals and in several cases, the tumor core showed liquefaction during necropsy, which is indicative of targeted embolization.
Figure 2
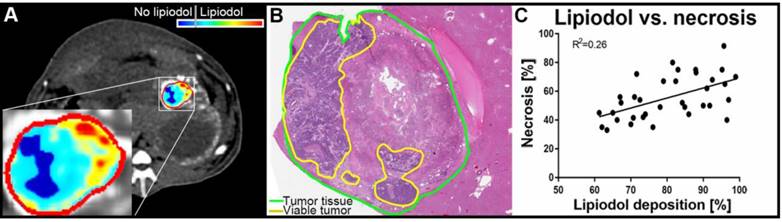
(A) qEASL quantification of lipiodol deposition on native CT images post-TACE, obtained before sacrifice of the animal 24 h after TACE. Segmentation of the tumor (outline in red) was performed on dynamic contrast-enhanced CT images to identify the tumor rim and exclude extra-tumoral lipiodol deposition in the segmentation. The color map demonstrates variable local concentrations / density of lipiodol deposition in the tumor (ranging from turquoise to red) as well as areas without lipiodol (blue). (B) The Hematoxylin and Eosin (H&E) staining of the corresponding tumor demonstrates remaining viable islands of tumor tissue (outlined in yellow), that are congruent to the under-treated areas without lipiodol deposition as visualized on CT. (C) Correlation between lipiodol deposition as calculated with qEASL using the native CT images and necrosis as determined using H&E stained slides. A weak positive correlation can be appreciated across all time points of pathological analysis.
Figure 3
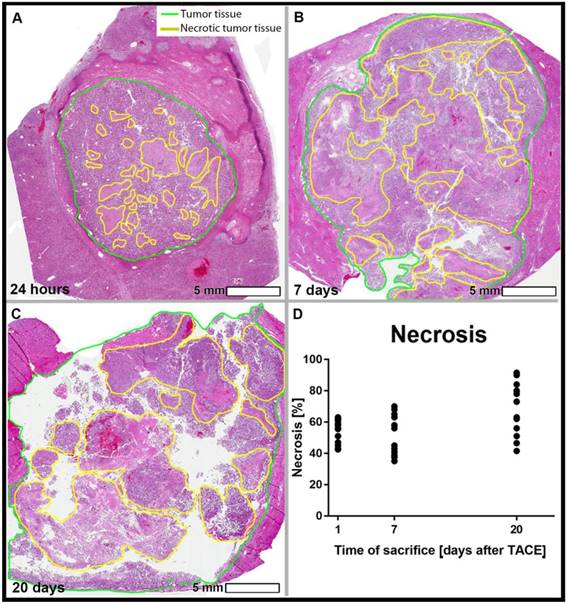
Hematoxylin and Eosin (H&E) staining on tumor slides. Viable tumor tissue present as blue, while necrotic cells are stained pink. Percentage of necrosis, as quantified using manual 3D segmentations for the tumors (cut every 0.5 cm and measured using the Aperio ImageScope Digital Pathology system) were 40% (A), 60% (B), and 70% (C) for sacrifice at 24 h (A), 7 days (B), and 20 days (C) post TACE respectively. The graph demonstrates an increasing range of tumor necrosis over the course of time (p>0.05).
Histopathological analysis of tumor necrosis
Tumor necrosis as a percentage of the whole tumor was measured using H&E-stained tissue slides. The mean tumor necrosis was 58.7% at 24 h, 60.6% at 7 days, and 69.2% at 20 days, which was not statistically significantly different between groups (Figure 3). The correlation between the percentage of Lipiodol deposition relative to the entire tumor volume and the percentage necrosis showed a weakly positive trend across all time points (R2 = 0.2609, Figure 2C).
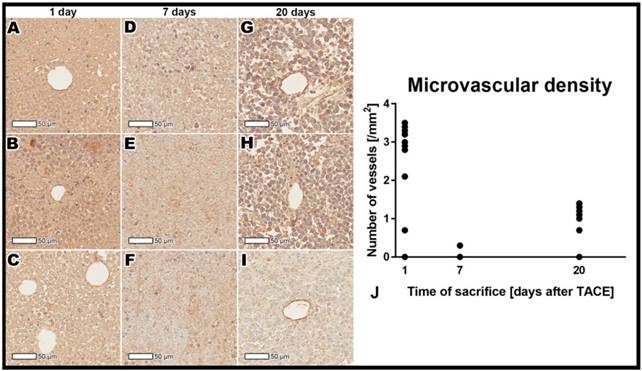
Figure 4
CD31 immuno-histopathology staining demonstrating microvasculature in the tumor rim 24 h post TACE (A-C), 7 days post TACE (D-F), and 20 days post TACE (G-I). Presence of vasculature can be observed 24 h after treatment, while complete devascularization can be appreciated 7 days after treatment. Twenty days post TACE there is intense re-vascularization of the tumor tissue. Please note that several dots representing individual cases are superimposed in graph B.
Immunohistochemistry staining for microvascular density
Quantitative assessment showed a significant decrease in the microvascular density from the 24-hour to 7-day post-TACE timepoints (p<0.001), followed by an significant increase at 20 days post TACE (p<0.001, Figure 4).
Histopathological analysis of intra-tumoral Lipiodol deposition
Histological analysis of ORO staining revealed Lipiodol droplets both within tumor vessels and endothelial cells. Moreover, Lipiodol was found in interstitial tumor tissue as well as inside the tumor cells. Both qualitative and quantitative analysis showed Lipiodol retention in the tumor over time and a washout / gradual disappearance of Lipiodol from healthy liver parenchyma adjacent to tumor tissue over time indicating Lipiodol clearance from healthy liver tissue (Figure 5).
TEM of Lipiodol deposition
Transmission electron microscopy (TEM) samples of tumor and liver tissue were examined at 1 day, 7 days and 20 days post-TACE. Lipiodol retention was evident within blood vessels, as well as within viable and necrotic tumor cells on TEM for all time points, with droplet sizes ranging from 0.5-17 μm. In several samples, Lipiodol was found to be attached to the cell membrane. Inspection at high magnification indicated that these were membrane-bound vesicles, suggesting pinocytosis as a likely mechanism of Lipiodol incorporation inside tumor cells. At 24 h, tumor cell membranes and nuclear membranes were intact and cell conjunctions were present. At 7 and 20 days, there were many non-viable cells, with damaged mitochondria, endoplasmic reticula, and nuclear membranes.
Lipiodol uptake in hepatocytes was evident 7 days after TACE. Droplet size was comparable to that in tumor cells. However, at 20 days almost all Lipiodol droplets had disappeared from the hepatocytes, which correlates well with the ORO staining results, suggesting active clearance of Lipiodol from healthy hepatocytes. Many lysosomes including end-stage lysosomes could be observed. Furthermore, lysosomes positioned directly adjacent to Lipiodol droplets and lysosomes that had digested Lipiodol droplets were found (Figure 6).
Discussion
The main findings of this study are that Lipiodol can be used as a tumor-specific imaging biomarker for therapeutic efficacy of cTACE and that tumor perfusion as represented by vascularity and enhancement can be used as a strong surrogate for successful Lipiodol deposition within the tumor after cTACE. These results therefore support the concept that Lipiodol can be used as a predictor of tumor response and treatment success. The data presented here provide pathological evidence that Lipiodol is indeed an imageable tumor-specific agent as demonstrated by its tumor-seeking capability making this agent an effective delivery medium to tumors when loaded with drugs, because it is preferentially taken up and retained by tumor cells. These tumor-specific functions enable Lipiodol to act as an effective imaging biomarker for therapeutic efficacy of cTACE. The radiological-pathological findings of this study also suggest that Lipiodol may be used as an imaging biomarker during the actual procedure of cTACE to determine embolization endpoints because pre-cTACE tumor perfusion (tumor enhancement) correlates well with Lipiodol deposition post cTACE. As such, it may help improve patient selection for cTACE based on quantification of baseline tumor parameters such as tumor enhancement. Because of its usefulness as both a diagnostic and therapeutic agent during cTACE, Lipiodol can therefore be considered an effective theranostic agent.
Figure 5
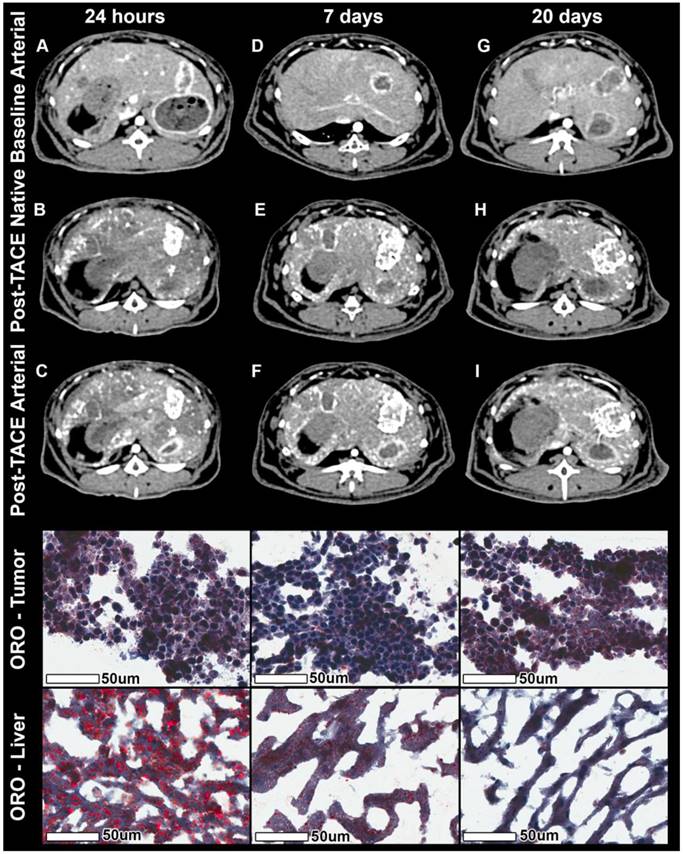
Native and contrast-enhanced CT imaging combined with Oil Red O (ORO) staining. The columns represent the time of sacrifice post TACE of 24 h, 7 days, and 20 days respectively. The rows represent from top to bottom the contrast-enhanced arterial phase CT at baseline, the native CT post TACE, the contrast-enhanced arterial phase CT images post TACE, ORO staining of three representative tumors, and three representative areas of extra-tumoral (non-target) lipiodol deposition within healthy liver parenchyma. Baseline arterial phase images show rim enhancement of the tumor and a partially necrotic tumor core. Native images post TACE show lipiodol deposition across the entire tumor (largely in the hypervascular rim regions, but also in central, necrotic tumor portions). Arterial phase images post TACE show rest-enhancement in under-treated regions as well as the radioopaque lipiodol in covered regions. ORO staining of the tumor shows constant lipiodol micro-droplets with a constant accumulation over time, while adjacent liver tissue demonstrates coarse lipiodol deposits with almost complete wash-out of lipiodol over time.
Figure 6
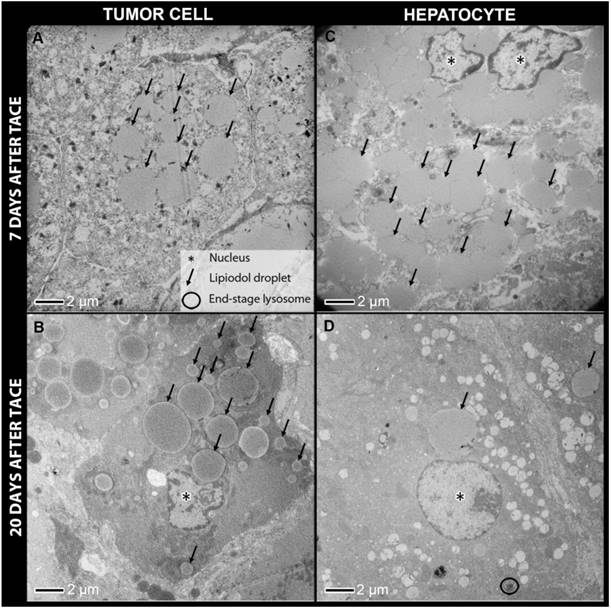
Transmission electron microscopy of tumor cells (A, B) and hepatocytes from non-target lipiodol deposition (C, D) 7 days post TACE and 20 days post TACE. Constant retention of lipiodol over time can be observed in tumor cells, while hepatocytes show a substantial decrease in the number of lipiodol droplets at 20 days post TACE when compared to 7 days post TACE. Furthermore, many end-stage lysosomes are present in hepatocytes as opposed to tumor cells.
The concept of theranostic agents, introduced in the 1990s, integrates the multifaceted capabilities of an agent for diagnosis, treatment, guidance and follow-up of a disease [35]. Given its radio-opacity, drug delivery capability and micro-embolic characteristics, Lipiodol's multifunctionality therefore includes all the key requirements of a theranostic agent during cTACE, i.e. its usefulness as a diagnostic tool and therapeutic probe all at once.
These properties have been validated in a well-established animal tumor model, which, although not derived from an HCC cell line per se, has nonetheless been validated extensively as a useful model to study various image-guided therapies because of its ability to mimic the typical features of HCC by imaging. In addition, as also reported in multiple studies, this particular animal model (rabbit VX2) is large enough that standard cTACE used in clinical practice can easily be used making the relevance of the results even more important because of the ease of translation into the clinic [36-39].
From an angiogenic standpoint, HCC typically carries a hyper-vascular phenotype [40] where high levels of pro-angiogenic factors such as vascular endothelial growth factor (VEGF) are found [41, 42]. The VX2 rabbit liver tumor is remarkably similar to that of HCC regarding its angiogenic and vascular perfusion profile. Existing data in the VX2 tumor model revealed a strong correlation between VEGF expression and MVD within the tumor [42]. Indeed, high MVD and VEGF levels are excellent predictors of poor prognosis for patients with HCC as they were associated with both tumor growth and disease progression, whereas lower levels of VEGF correlated with longer survival in a prospective trial conducted in HCC patients who underwent TACE [43]. In our experimental design where a variety of markers of tumor vascularity and MVD was investigated, cTACE induced significant reduction in MVD and a corresponding decrease in tumor perfusion as indicated by the PI. This was observed as early as one day post-cTACE reflecting the profound effect of cTACE on the vascular profile of tumors. These findings are in line with those of previous studies that showed a direct relationship between Lipiodol retention and decreased VEGF plasma levels in patients with HCC after cTACE [44]. The neo-angiogenic microvasculature in HCC is typically leaky with abnormal flow compared to that of normal liver perfusion and is further characterized by arterio-portal communication at different levels [40, 45]. Specifically, tumor vasculature communicates with surrounding portal venules and sinusoids, invading both portal and hepatic veins. These arterio-venous shunts are predominantly located at the outer margin of the tumors corresponding to the viable and actively growing portion of the tumor. This finding was supported by the observation that all VX2 tumors in our study showed hyper-enhancement in the outer rim of the tumor surrounding a hypo-enhancing, often necrotic core on baseline CECT, consistent with rapid tumor growth in aggressive tumors such as the VX2. On post-cTACE CT, Lipiodol was predominantly (yet not exclusively) found in the tumor rim which matched the area of arterial enhancement at baseline confirming the notion that Lipiodol primarily seeks out well perfused and viable regions of the tumor. It is therefore logical to find Lipiodol in such areas on post-cTACE CT. Moreover, when assessed volumetrically, the areas of greatest tumor perfusion on pre-procedural baseline CT scans significantly correlated with areas of Lipiodol deposition on post-cTACE CT. Overall, these findings suggest that precise and quantitative characterization of tumor perfusion and contrast enhancement on baseline imaging could be used as imaging biomarkers of therapeutic efficacy through its ability to reliably predict Lipiodol deposition within tumors and more generally the outcome of cTACE.
An additional important finding in our study consists of the fact that despite sustained Lipiodol retention in the tumor, devascularization (as confirmed by the decrease in PI and MVD) was not permanent since it was present at 7 days (p=0.003) but not at 20 days (p=0.4). This was found at histopathologic analysis to be due to partial tumor revascularization which itself led to recurrence or re-growth of VX2 tumor. The extremely aggressive nature of the VX2 tumor as well as the known TACE-related ischemic injury directly responsible for inducing VEGF over-expression in tumor cells may explain the increase in MVD. Such patterns of tumor recurrence are also well known and in fact commonly seen in patients with HCC [42]. Our data supports the diagnostic value of PI and use of tumor enhancement as a quantitative non-invasive surrogate marker for MVD to monitor the effects of cTACE on tumor angiogenesis, and tumor response.
The selectivity of Lipiodol “uptake” by HCC nodules and its long-lasting retention within tumors are of major clinical relevance; however the mechanism remains debated. Our study utilized ORO staining for Lipiodol as well as TEM in an attempt to elucidate the underlying mechanisms through a dedicated histopathological analysis of the patterns of Lipiodol deposition. Our data demonstrates that Lipiodol was specifically and permanently retained by tumor tissue, with intracellular Lipiodol droplets clearly visualized on TEM imaging at all time-points of animal sacrifice following cTACE. On the other hand, in the healthy liver parenchyma, Lipiodol was washed-out within 20 days after cTACE. Analysis with TEM demonstrated a large presence of end-stage lysosomes within healthy hepatocytes that cleared the intra-cellular Lipiodol deposits, indicating a possible role of lysosomes as a mechanism for Lipiodol clearance from these healthy hepatocytes. Interestingly, tumor necrosis post-cTACE increased over time but without reaching statistical significance, and some Lipiodol deposits were also visualized in remaining viable tumor tissue. Histopathological analysis within such areas of viable tumor tissue demonstrated intact cell membranes immediately after treatment, but extensive cell damage at 7 and 20 days after cTACE. On TEM, intra-cellular Lipiodol droplets were visualized in such regions absent an effective lysosomal presence from tumor cells, indicating that tumor cells are incapable of clearing Lipiodol once damaged because the absence of lysosomes. These findings therefore suggest that Lipiodol could be used as a biomarker of successful tumor targeting after cTACE. Previous studies already showed that Lipiodol could remain within HCC tumors for as long as three months after cTACE [46, 47]. The TEM data from our study provides insight into the real mechanism of Lipiodol retention within tumor cells via pinocytosis, and also identified lysosomal degradation as the likely mechanism for Lipiodol clearance from healthy hepatocytes.
This study has several limitations. First, the VX2 liver cancer model does not derive from human HCC and thus, no direct mechanistic conclusions can be drawn for human HCC. However, the VX2 tumor model is a well-established and reproducible model for the study of liver cancer. Furthermore, this model also overcomes the inherent limitations of rodent tumor models that are too small for cTACE using a clinical set-up. Due to its larger vessel size the VX2 model allows for cTACE to be used and tested according to standard protocols used in the clinical setting. Second, given the preclinical character of this study, no survival analysis was conducted. However, longitudinal imaging of the tumor-bearing animals was performed at three time points to quantify Lipiodol dynamics and washout from the tumor and healthy liver parenchyma. In this study, Lipiodol deposition was assessed as coverage of the tumor volume. Further studies are needed to assess the impact of different Lipiodol densities on the therapeutic efficacy of cTACE and the extent of necrosis on follow-up imaging.
Conclusions
This study provides radiological-pathological validation of the tumor-specific properties of Lipiodol and reveals its theranostic potential as an imaging biomarker for tumor response to cTACE. Additionally, volumetric quantification of tumor vascularization on CT brings a new tool which allows predicting responses to cTACE thereby contributing to improved therapeutic management of patients with liver cancer.
Abbreviations
AF: arterial flow; CBCT: cone beam computed tomography; CECT: contrast enhanced computed tomography; cTACE: conventional transarterial chemoembolization; HCC: hepatocellular carcinoma; IHC: immunohistochemistry; H&E: hematoxylin & eosin; MVD: microvascular density; NECT: non-enhanced computed tomography; ORO: oil red O; PI: perfusion index; PF: portal flow; TACE: transarterial chemoembolization; TEM: transmission electron microscopy; VEGF: vascular endothelial growth factor.
Competing Interests
The authors have declared that no competing interest exists.
References
1. International Agency for Research on Cancer, World Health Organization, GLOBOCAN. Cancer incidence time trends. November 2018. http://gco.iarc.fr/today/home
2. European Association For The Study Of The Liver, European Organisation For Research and Treatment of Cancer. EASL-EORTC clinical practice guidelines: management of hepatocellular carcinoma. J Hepatol. 2012;56:908-43
3. Ferlay J, Soerjomataram I, Dikshit R, Eser S, Mathers C, Rebelo M. et al. Cancer incidence and mortality worldwide: sources, methods and major patterns in GLOBOCAN 2012. Int J Cancer. 2015;136:E359-86
4. Fong ZV, Tanabe KK. The clinical management of hepatocellular carcinoma in the United States, Europe, and Asia: a comprehensive and evidence-based comparison and review. Cancer. 2014;120:2824-38
5. Bruix J, Sherman M, American Association for the Study of Liver Disease. Management of hepatocellular carcinoma: an update. Hepatology. 2011;53:1020-2
6. Yau T, Tang VY, Yao TJ, Fan ST, Lo CM, Poon RT. Development of Hong Kong liver cancer staging system with treatment stratification for patients with hepatocellular carcinoma. Gastroenterology. 2014;146:1691-700.e3
7. Lencioni R, de Baere T, Soulen MC, Rilling WS, Geschwind JF. Lipiodol transarterial chemoembolization for hepatocellular carcinoma: A systematic review of efficacy and safety data. Hepatology. 2016;64:106-16
8. Iwai K, Maeda H, Konno T, Matsumura Y, Yamashita R, Yamasaki K. et al. Tumor targeting by arterial administration of lipids: rabbit model with VX2 carcinoma in the liver. Anticancer Res. 1987;7:321-7
9. Nakakuma K, Tashiro S, Hiraoka T, Uemura K, Konno T, Miyauchi Y. et al. Studies on anticancer treatment with an oily anticancer drug injected into the ligated feeding hepatic artery for liver cancer. Cancer. 1983;52:2193-200
10. de Baere T, Dufaux J, Roche A, Counnord JL, Berthault MF, Denys A. et al. Circulatory alterations induced by intra-arterial injection of iodized oil and emulsions of iodized oil and doxorubicin: experimental study. Radiology. 1995;194:165-70
11. Kan Z, Ivancev K, Hagerstrand I, Chuang VP, Lunderquist A. In vivo microscopy of the liver after injection of Lipiodol into the hepatic artery and portal vein in the rat. Acta Radiol. 1989;30:419-25
12. Liapi E, Geschwind J-FH. Transcatheter arterial chemoembolization for liver cancer: Is it time to distinguish conventional from drug-rluting chemoembolization? CardioVascular and Interventional Radiology. 2011;34:37-49
13. Idee JM, Guiu B. Use of Lipiodol as a drug-delivery system for transcatheter arterial chemoembolization of hepatocellular carcinoma: a review. Crit Rev Oncol Hematol. 2013;88:530-49
14. Chen CS, Li FK, Guo CY, Xiao JC, Hu HT, Cheng HT. et al. Tumor vascularity and lipiodol deposition as early radiological markers for predicting risk of disease progression in patients with unresectable hepatocellular carcinoma after transarterial chemoembolization. Oncotarget. 2016;7:7241-52
15. Hasdemir DB, Dávila LA, Schweitzer N, Meyer BC, Koch A, Vogel A. et al. Evaluation of CT vascularization patterns for survival prognosis in patients with hepatocellular carcinoma treated by conventional TACE. Diagn Interv Radiol. 2017;23:217-22
16. Luca M, Riccardo B, Giorgio B, Antonio R, Indira R, Claudio Z. et al. Transarterial oily chemoembolization for the treatment of hepatocellular carcinoma: A multivariate analysis of prognostic factors. Hepatology. 1994;19:1115-23
17. Kim SJ, Choi MS, Kang JY, Choi DI, Park CK, Gwak GY. et al. Prediction of complete necrosis of hepatocellular carcinoma treated with transarterial chemoembolization prior to liver transplantation. Gut Liver. 2009;3:285-91
18. Monsky WL, Kim I, Loh S, Li C-S, Greasby TA, Deutsch L-S. et al. Semiautomated segmentation for volumetric analysis of intratumoral ethiodol Uptake and subsequent tumor necrosis after chemoembolization. American Journal of Roentgenology. 2010;195:1220-30
19. Golfieri R, Cappelli A, Cucchetti A, Piscaglia F, Carpenzano M, Peri E. et al. Efficacy of selective transarterial chemoembolization in inducing tumor necrosis in small (<5 cm) hepatocellular carcinomas. Hepatology. 2011;53:1580-9
20. Hu J, Maybody M, Cao G, Wang X, Chen H, Zhu X. et al. Lipiodol retention pattern assessed by cone beam computed tomography during conventional transarterial chemoembolization of hepatocellular carcinoma: accuracy and correlation with response. Cancer Imaging. 2016;16:32
21. Takayasu K, Arii S, Matsuo N, Yoshikawa M, Ryu M, Takasaki K. et al. Comparison of CT findings with resected specimens after chemoembolization with iodized oil for hepatocellular carcinoma. American Journal of Roentgenology. 2000;175:699-704
22. Buijs M, Vossen JA, Geschwind JF, Salibi N, Pan L, Ventura VP. et al. Quantitative proton MR spectroscopy as a biomarker of tumor necrosis in the rabbit VX2 liver tumor. J Vasc Interv Radiol. 2011;22:1175-80
23. Chen JH, Lin YC, Huang YS, Chen TJ, Lin WY, Han KW. Induction of VX2 carcinoma in rabbit liver: comparison of two inoculation methods. Lab Anim. 2004;38:79-84
24. Lee KH, Liapi E, Vossen JA, Buijs M, Ventura VP, Georgiades C. et al. Distribution of iron oxide-containing Embosphere particles after transcatheter arterial embolization in an animal model of liver cancer: evaluation with MR imaging and implication for therapy. J Vasc Interv Radiol. 2008;19:1490-6
25. Nass N, Streit S, Wybranski C, Jurgens J, Brauner J, Schulz N. et al. Validation of VX2 as a hepatocellular carcinoma model: Comparison of the molecular reaction of VX2 and HepG2 tumor cells to Sorafenib in vitro. Anticancer Res. 2017;37:87-93
26. Yamamoto A, Imai S, Kobatake M, Yamashita T, Tamada T, Umetani K. Evaluation of tris-acryl gelatin microsphere embolization with monochromatic X Rays: comparison with polyvinyl alcohol particles. J Vasc Interv Radiol. 2006;17:1797-802
27. Hong K, Kobeiter H, Georgiades CS, Torbenson MS, Geschwind JF. Effects of the type of embolization particles on carboplatin concentration in liver tumors after transcatheter arterial chemoembolization in a rabbit model of liver cancer. J Vasc Interv Radiol. 2005;16:1711-7
28. de Baere T, Zhang X, Aubert B, Harry G, Lagrange C, Ropers J. et al. Quantification of tumor uptake of iodized oils and emulsions of iodized oils: experimental study. Radiology. 1996;201:731-5
29. Deschamps F, Farouil G, Gonzalez W, Robic C, Paci A, Mir LM. et al. Stabilization improves theranostic properties of Lipiodol((R))-based emulsion during liver trans-arterial chemo-embolization in a VX2 rabbit model. Cardiovasc Intervent Radiol. 2017;40:907-13
30. Chapiro J, Wood LD, Lin M, Duran R, Cornish T, Lesage D. et al. Radiologic-pathologic analysis of contrast-enhanced and diffusion-weighted MR imaging in patients with HCC after TACE: diagnostic accuracy of 3D quantitative image analysis. Radiology. 2014;273:746-58
31. Chapiro J, Duran R, Lin M, Schernthaner RE, Wang Z, Gorodetski B. et al. Identifying staging markers for hepatocellular carcinoma before transarterial chemoembolization: Comparison of three-dimensional quantitative versus non-three-dimensional imaging markers. Radiology. 2014:141180
32. Lin M, Pellerin O, Bhagat N, Rao PP, Loffroy R, Ardon R. et al. Quantitative and volumetric European association for the study of the liver and response evaluation criteria in solid tumors measurements: feasibility of a semiautomated software method to assess tumor response after transcatheter arterial chemoembolization. J Vasc Interv Radiol. 2012;23:1629-37
33. Bruix J, Sherman M, Llovet JM, Beaugrand M, Lencioni R, Burroughs AK. et al. Clinical management of hepatocellular carcinoma. Conclusions of the Barcelona-2000 EASL conference. European Association for the Study of the Liver. J Hepatol. 2001;35:421-30
34. Lencioni R, Llovet JM. Modified RECIST (mRECIST) assessment for hepatocellular carcinoma. Semin Liver Dis. 2010;30:52-60
35. Kelkar SS, Reineke TM. Theranostics: Combining imaging and therapy. Bioconjugate Chemistry. 2011;22:1879-903
36. Brown DB, Nikolic B, Covey AM, Nutting CW, Saad WEA, Salem R. et al. Quality improvement guidelines for transhepatic arterial chemoembolization, embolization, and chemotherapeutic infusion for hepatic malignancy. Journal of Vascular and Interventional Radiology. 2012;23:287-94
37. European Association for the Study of the Liver, European Organisation for Research and Treatment of Cancer. EASL-EORTC Clinical practice guidelines: Management of hepatocellular carcinoma. Journal of Hepatology. 2012;56:908-43
38. Kritzinger J, Klass D, Ho S, Lim H, Buczkowski A, Yoshida E. et al. Hepatic embolotherapy in interventional oncology: Technology, techniques, and applications. Clinical Radiology. 2013;68:1-15
39. Lencioni R, Crocetti L. Local-Regional Treatment of hepatocellular carcinoma. Radiology. 2012;262:43-58
40. Zhu AX, Duda DG, Sahani DV, Jain RK. HCC and angiogenesis: possible targets and future directions. Nature Reviews Clinical Oncology. 2011;8:292
41. Ferrara N. Vascular endothelial growth factor: Basic science and clinical progress. Endocrine Reviews. 2004;25:581-611
42. Liao X, Yi J, Li X, Yang Z, Deng W, Tian G. Expression of angiogenic factors in hepatocellular carcinoma after transcatheter arterial chemoembolization. Journal of Huazhong University of Science and Technology. 2003;23:280-2
43. Sergio A, Cristofori C, Cardin R, Pivetta G, Ragazzi R, Baldan A. et al. Transcatheter arterial chemoembolization (TACE) in hepatocellular carcinoma (HCC): The role of angiogenesis and invasiveness. The American Journal Of Gastroenterology. 2008;103:914
44. Xiaochuan L, Chen Y, Weikang S, Gangyi L, Jingying J, Yiping W. Simultaneous determination of magnesium lithospermate B, rosmarinic acid, and lithospermic acid in beagle dog serum by liquid chromatography/tandem mass spectrometry. Rapid Communications in Mass Spectrometry. 2004;18:2878-82
45. Fan YZ. et al. Vascular changes in hepatocellular carcinoma. The anatomical record. 2008;291:721-34
46. Kim H, Park C, Lee YB, Yoo HS, Park JH, Lee WY. Effects of iodinated fatty acid ester on human hepatocellular carcinoma cells. Yonsei Med J. 1991;32:16-23
47. Park C, Choi SI, Kim H, Yoo HS, Lee YB. Distribution of Lipiodol in hepatocellular carcinoma. Liver. 1990;10:72-8
Author contact
![]() Corresponding author: Jean-Francois Geschwind, MD. PreScience Labs/Cage Pharma, 40 Harbor Road Westport, CT 06880. Phone number: (410) 446-8071 Email: jfgeschwindcom
Corresponding author: Jean-Francois Geschwind, MD. PreScience Labs/Cage Pharma, 40 Harbor Road Westport, CT 06880. Phone number: (410) 446-8071 Email: jfgeschwindcom
Citation styles
APA
van Breugel, J.M.M., Geschwind, J.F., Mirpour, S., Savic, L.J., Zhang, X., Duran, R., Lin, M., Miszczuk, M., Liapi, E., Chapiro, J. (2019). Theranostic application of lipiodol for transarterial chemoembolization in a VX2 rabbit liver tumor model. Theranostics, 9(13), 3674-3686. https://doi.org/10.7150/thno.32943.
ACS
van Breugel, J.M.M.; Geschwind, J.F.; Mirpour, S.; Savic, L.J.; Zhang, X.; Duran, R.; Lin, M.; Miszczuk, M.; Liapi, E.; Chapiro, J. Theranostic application of lipiodol for transarterial chemoembolization in a VX2 rabbit liver tumor model. Theranostics 2019, 9 (13), 3674-3686. DOI: 10.7150/thno.32943.
NLM
van Breugel JMM, Geschwind JF, Mirpour S, Savic LJ, Zhang X, Duran R, Lin M, Miszczuk M, Liapi E, Chapiro J. Theranostic application of lipiodol for transarterial chemoembolization in a VX2 rabbit liver tumor model. Theranostics 2019; 9(13):3674-3686. doi:10.7150/thno.32943. https://www.thno.org/v09p3674.htm
CSE
van Breugel JMM, Geschwind JF, Mirpour S, Savic LJ, Zhang X, Duran R, Lin M, Miszczuk M, Liapi E, Chapiro J. 2019. Theranostic application of lipiodol for transarterial chemoembolization in a VX2 rabbit liver tumor model. Theranostics. 9(13):3674-3686.
This is an open access article distributed under the terms of the Creative Commons Attribution (CC BY-NC) license (https://creativecommons.org/licenses/by-nc/4.0/). See http://ivyspring.com/terms for full terms and conditions.