Theranostics
13.3
Impact Factor
- Current Issue
- Advance Articles
- Volume 16; 2026
- Volume 15; 2025
- Volume 14; 2024
- Volume 13; 2023
- Volume 12; 2022
- Archive
- Cover Images
- Cover Suggestion
- Special Issues
Top
Introduction
Methods
Results
Discussion
Abbreviations
Supplementary Material
Acknowledgements
References
Introduction
Methods
Results
Discussion
Abbreviations
Supplementary Material
Acknowledgements
References
International Journal of Biological Sciences
International Journal of Medical Sciences
 Global reach, higher impact

Theranostics 2019; 9(8):2183-2197. doi:10.7150/thno.30834 This issue Cite
Research Paper
High OGT activity is essential for MYC-driven proliferation of prostate cancer cells
Harri M Itkonen1,2, ![]() , Alfonso Urbanucci1,3,4,5, Sara ES Martin2,6, Aziz Khan1, Anthony Mathelier1,7, Bernd Thiede8, Suzanne Walker2,
, Alfonso Urbanucci1,3,4,5, Sara ES Martin2,6, Aziz Khan1, Anthony Mathelier1,7, Bernd Thiede8, Suzanne Walker2, ![]() , Ian G Mills1,9,10
, Ian G Mills1,9,10 ![]()
1. Centre for Molecular Medicine Norway (NCMM), Nordic EMBL Partnership, University of Oslo, Oslo, Norway.
2. Department of Microbiology, Blavatnik Institute, Harvard Medical School, Boston, MA, USA.
3. Department of Core Facilities, Institute for Cancer Research, Oslo University Hospital, Oslo, Norway.
4. Department of Tumor Biology, Institute for Cancer Research, Oslo University Hospital, Oslo, Norway.
5. Institute for Cancer Genetics and Informatics, Oslo University Hospital, Oslo, Norway.
6. Current address: Chemistry Department, The College of Wooster, US.
7. Department of Cancer Genetics, Institute for Cancer Research, Oslo University Hospital Radiumhospitalet, Oslo, Norway.
8. Department of Biosciences, University of Oslo, Oslo, Norway.
9. PCUK/Movember Centre of Excellence for Prostate Cancer Research, Centre for Cancer Research and Cell Biology (CCRCB), Queen's University Belfast, UK.
10. Nuffield Department of Surgical Sciences, University of Oxford, John Radcliffe Hospital, Oxford, UK.
Received 2018-10-21; Accepted 2019-2-18; Published 2019-4-12
Citation:
Itkonen HM, Urbanucci A, Martin SES, Khan A, Mathelier A, Thiede B, Walker S, Mills IG. High OGT activity is essential for MYC-driven proliferation of prostate cancer cells. Theranostics 2019; 9(8):2183-2197. doi:10.7150/thno.30834. https://www.thno.org/v09p2183.htm
Other stylesAbstract

O-GlcNAc transferase (OGT) is overexpressed in aggressive prostate cancer. OGT modifies intra-cellular proteins via single sugar conjugation (O-GlcNAcylation) to alter their activity. We recently discovered the first fast-acting OGT inhibitor OSMI-2. Here, we probe the stability and function of the chromatin O-GlcNAc and identify transcription factors that coordinate with OGT to promote proliferation of prostate cancer cells.
Methods: Chromatin immunoprecipitation (ChIP) coupled to sequencing (seq), formaldehyde-assisted isolation of regulatory elements, RNA-seq and reverse-phase protein arrays (RPPA) were used to study the importance of OGT for chromatin structure and transcription. Mass spectrometry, western blot, RT-qPCR, cell cycle analysis and viability assays were used to establish the role of OGT for MYC-related processes. Prostate cancer patient data profiled for both mRNA and protein levels were used to validate findings.
Results: We show for the first time that OGT inhibition leads to a rapid loss of O-GlcNAc chromatin mark. O-GlcNAc ChIP-seq regions overlap with super-enhancers (SE) and MYC binding sites. OGT inhibition leads to down-regulation of SE-dependent genes. We establish the first O-GlcNAc chromatin consensus motif, which we use as a bait for mass spectrometry. By combining the proteomic data from oligonucleotide enrichment with O-GlcNAc and MYC ChIP-mass spectrometry, we identify host cell factor 1 (HCF-1) as an interaction partner of MYC. Inhibition of OGT disrupts this interaction and compromises MYC's ability to confer androgen-independent proliferation to prostate cancer cells. We show that OGT is required for MYC-mediated stabilization of mitotic proteins, including Cyclin B1, and/or the increased translation of their coding transcripts. This implies that increased expression of mRNA is not always required to achieve increased protein expression and confer aggressive phenotype. Indeed, high expression of Cyclin B1 protein has strong predictive value in prostate cancer patients (p=0.000014) while mRNA does not.
Conclusions: OGT promotes SE-dependent gene expression. OGT activity is required for the interaction between MYC and HCF-1 and expression of MYC-regulated mitotic proteins. These features render OGT essential for the androgen-independent, MYC-driven proliferation of prostate cancer cells. Androgen-independency is the major mechanism of prostate cancer progression, and our study identifies OGT as an essential mediator in this process.
Keywords: O-GlcNAc transferase, MYC, prostate cancer, glycosylation, super-enhancer
Introduction
It is well known that metabolites can affect cell fate by regulating transcription. This was initially established for the lactose-regulated lac operon in bacteria and the galactose-regulated gal regulome in yeast [1]. Metabolite-dependent regulation of transcription in multicellular organisms has also been established, and as an example, sterol synthesis is regulated by sterol regulatory element-binding protein 1 (SREBP1) [2]. In the absence of sterols, SREBP1 is cleaved, and this cleavage generates an active nuclear transcription factor that promotes expression of genes involved in sterol biosynthesis.
Altered metabolite levels are a prominent feature of cancer cells/tumors and have been directly linked to their ability to proliferate rapidly [3, 4]. One of the most prominent features of cancer cells is the 'Warburg effect', where cells exhibit increased glucose uptake and fermentation of glucose to lactate even in the presence of fully functional mitochondria and oxygen. Further underlining the increased appetite of cancer cells for glucose, this metabolite is frequently used as a tracer to localize tumors and follow response to therapy using PET-imaging [5]. In the case of prostate cancer, which is lipogenic, tumors can also be traced using 11C-Acetate [6, 7]. Cancer cells adapt to metabolite availability through transcriptional and translational regulation; however, post-translational modifications provide a rapid response to extracellular stimuli.
O-GlcNAc transferase (OGT), the sole enzyme in the human genome that modifies target protein serine and threonine residues with a single O-GlcNAc sugar, is a major metabolic integration point in cells [8]. OGT's substrate, UDP-GlcNAc, is produced via the hexosamine biosynthetic pathway (HBP), which uses glucose, glutamine, acetyl-CoA and UTP as building blocks [9]. Flux through the HBP increases in response to glucose, which leads to increased O-GlcNAcylation of nuclear proteins [10]. Among the most prominent O-GlcNAc modified factors is the C-terminal domain of RNA-Polymerase II, which regulates pre-initiation complex formation [11-13]. Increased expression of OGT has been demonstrated in most cancers, including prostate cancer, where high protein-O-GlcNAc levels have been shown to correlate with poor clinical outcome [14-16].
Prostate cancer is the most common male cancer, and the androgen receptor (AR) is the major driver and drug target in this disease [17, 18]. The AR is typically expressed at high levels in prostate cancer and positively regulates the HBP [18-20]. One mechanism by which increased HBP flux, and especially OGT activity, benefits cancer cells, is through stabilization of pro-oncogenic proteins such as MYC [14, 21, 22].
MYC is a transcription factor that is essential for the proliferation of most cancer cells [23]. The protein binds to MAX to form a complex, which, in general, positively regulates transcription [24]. MYC binds to a DNA sequence-motif known as the E-box [25]. E-boxes occur every 4kb in the human genome, but MYC binds only to the subset of these sites that are non-methylated and accessible [26]. When MYC levels increase, as they do in tumors, there is increased binding to lower affinity E-boxes [27]. Increased MYC expression leads to enhanced expression of the cell-specific transcriptional program rather than activation of new genes [28, 29].
OGT and MYC work together to enhance cancer cell proliferation [14, 21, 22]. Inhibition of OGT activity down-regulates MYC in prostate cancer cells [30], while increased glucose levels lead to OGT-mediated stabilization of MYC in liver cancer cells [21]. Cells infected with human papillomavirus, the causative agent in genital cancers, have high levels of OGT, which promotes MYC stability [31]. In activated T cells, MYC affects O-GlcNAcylation through regulation of glucose and glutamine transport [22]. These data highlight the complex interplay between OGT and MYC in cancer cells. It is currently not known if OGT affects the MYC-dependent cellular program.
Here, we show that inhibition of OGT activity disrupts the interaction between MYC and HCF-1, a known transcriptional co-activator. Inhibition of OGT enhances MYC's ability to suppress transcription of certain cell cycle genes and at the same time enhances the expression of genes involved in the degradation of cell cycle proteins. We show that OGT is required for MYC-mediated stabilization of proteins involved in mitosis. MYC's dependency on OGT becomes most evident during androgen-deprivation, a condition in which overexpression of MYC can drive proliferation. In addition, we show that OGT regulates super-enhancer-dependent transcription through chromatin compaction. Our study is the first one to promote combination of OGT inhibitor with AR-targeted therapies as a strategy for castration-resistant prostate cancer.
Methods
Cell culture conditions and treatments
LNCaP and PC3 cell lines were obtained from the ATCC and maintained according to ATCC guidelines. LNCaP and PC3 cells were grown in RPMI media supplemented with 10% FBS. For hormone starvation, cells were cultured in phenol red-free RMPI supplemented with 10% charcoal-stripped FBS. LNCaP-MYC cells were maintained as described previously [32] and MYC overexpression was induced using 2μg/ml doxycycline (Sigma). Tamoxifen-inducible OGT knockout mouse embryonic fibroblast (MEF) cell line was obtained from Dr. Natasha Zachara at the CardioPEG CoreC4 (NHLBI P01 HL107153) at Johns Hopkins University School of Medicine [33]. Cell viability was assessed using CellTiterGlo-reagent (CTG, Promega) according to the manufacturer's instructions. Each CTG-experiment was done using 384-well plates and consisted of at least 3 technical and 3 biological replicates. PUGNAc, Thiamet-G, cOmplete™ EDTA-free Protease Inhibitor Cocktail and PhosSTOP™ were purchased from Sigma. (Z)-4-Hydroxytamoxifen was obtained from Abcam (ab141943). The second-generation OGT inhibitors OSMI-2 and OSMI-4 have been described [34]. Cell cycle distribution was analyzed using the Propidium Iodide Flow Cytometry Kit (Abcam, ab139418) and the BD FACSCanto instrument (BD Biosciences). Transfections for siRNA experiments were performed using RNAiMax reagent (Sigma), and OGT targeting siRNAs were obtained from Life Technologies (s16094 and s16095).
Preparation of cell lysates
Preparation of cell lysates for western blotting (WB) was done as previously described [19]. Antibodies were obtained from Cell Signaling Technology: MYC #5605, OGT #24083, CDK1 #9116, Cyclin B1 #4138, PLK1 #4513, p-H3ser10 #9701, H3 #4499, p-S2/5-Pol II #4735, GSK3β #12456; from Sigma: OGA #HPA036141; from Abcam: RL2 #ab2739, Actin #ab49900 and from Bethyl Laboratories: HCF-1 #A301-399a. Reverse Phase Protein Array (RPPA) samples were prepared using the same protocol as for WB, and RPPA was purchased as a service from MD Anderson. Signal from 302 antibodies was detected.
Chromatin immunoprecipitation
Chromatin immunoprecipitation (ChIP) was performed from ~2x10⁷ cells by first cross-linking cells with 1% para-formaldehyde (pFa) at room temperature for 10 minutes. PFa was quenched by addition of 125mM glycine for 10 minutes, and cells were washed twice in ice-cold PBS. Next, cells were solubilized into ChIP lysis buffer (0.1% SDS, 1% Triton X-100, 150mM NaCl, 1mM EDTA, 20mM Tris-HCl pH8.0, protease inhibitor, phosphatase inhibitor and 50µM PUGNAc (the last three added fresh)), and samples were sonicated using Bioruptor (Diagenode) to obtain DNA fragments of 200-500 base pairs in length (confirmed by agarose gel analysis for every experiment). After sonication, samples were centrifuged, and the supernatant was used for ChIP. Antibodies for ChIP were: RL2 #ab2739 (Abcam), MYC AF3696 (R&D systems) and HCF-1 #A301-399a (Bethyl Laboratories). ChIP was performed overnight at +4˚C, and beads were washed as follows: 2x in wash buffer 1 (0.1% SDS, 0.1% Na-deoxycholate, 1% Triton X-100, 0.15M NaCl, 1mM EDTA, 20mM HEPES pH8.0), 1x in wash buffer 2 (0.1% SDS, 0.1% Na-deoxycholate, 1% Triton X-100, 0.5M NaCl, 1mM EDTA, 20mM HEPES pH8.0), 1x in wash buffer 3 (0.25M LiCl, 0.5% Na-deoxycholate, 0.5% NP-40, 1mM EDTA, 20mM HEPES pH8.0) and 2x in wash buffer 4 (10mM EDTA, 20mM HEPES pH8.0). After this, DNA was extracted using phenol-chloroform extraction and used for sequencing or qPCR. RNA for RT-qPCR and RNA-seq was isolated using an illustraMiniSpin kit (GE Healthcare) according to the manufacturer's instructions, and cDNA was synthesized using a qScript cDNA Synthesis Kit (Quanta Biosciences). Primers for ChIP-qPCR and RT-qPCR are provided in Supplementary Table.
Formalin-assisted isolation of regulatory elements
One million LNCaP cells were plated for 3 days and half of media was replaced to fresh media when cells were treated with DMSO or 20µM OSMI-4 for 24 hours. Cells were fixed by adding formaldehyde in 1% final concentration for 10 minutes at room temperature and fixation was stopped by addition of 125mM glycine (final) for 5 minutes at room temperature. Plates were washed with ice cold PBS, cells pelleted by centrifugation (1000rpm, 10 minutes) and lysed in 0.5% SDS, 0.5% TritonX 100, 150mM NaCl, 10mM EDTA, 50mM Tris-HCl pH8.0 containing 1X protease inhibitor. Samples were sonicated using Bioruptor. Input sample was taken and the rest of the sample was subjected to three subsequent phenol:chloroform:isoamyl alcohol (25:24:1) extractions to isolate protein-free DNA in the aqueous phase using columns (#2302830, 5Prime, QuantaBio). All the samples (including input) were treated with proteinase K for 1 hour at +55˚C, DNA de-crosslinked at +65˚C for 4 hours and purified using standard phenol-chloroform extraction. qPCR was used to evaluate chromatin compaction relative to input.
Analysis of the ChIP-seq data
Summary of read counts for ChIP-seq are provided in Supplementary Table. The raw reads from previously published studies and generated for this study (ChIP-seq of MYC and O-GlcNAc) were mapped with novoalign (http://www.novocraft.com) to the human reference genome (build hg19) with default parameters. Only reads with q>20 and a maximum of 5 read duplicates per genomic location were allowed by our filtering. Peak detection (i.e., binding site detection) for both ChIP- and DHS-seq was performed with MACS1.4 [35] with default parameters. Overlaps between datasets were performed with bedtools v2.25.0 [36]. Read distribution analysis around center feature peaks was performed as previously described [37] or using bwtool 1.0 - Data operations on bigWig files [38]. To assess the presence of motifs of transcription factors (TFs) in the O-GlcNAc dataset, we looked for overrepresented TF motifs. Prediction of TF binding was performed using “findMotifsGenome.pl” with motif lengths from 6 to 30 nt, and peaks distribution analysis was performed with “annotatePeaks.pl”, both parts of the HOMER package [39].
Analysis of the RNA-seq data
RNA-seq raw paired-end reads from different lanes were concatenated and trimmed with Trimgalore (v.0.4.1). We used Salmon (v0.9.1) [40] to quantify the expression of transcripts from UCSC human genome (hg19). We run Salmon with default parameter and corrected input data for fragment-level GC biases using parameter --gcBias. We performed differential expression analysis using DEBrowser [41] with DESeq2 [42] by uploading the read counts retrieved from Salmon. Principal component analysis of RNA-seq data was plotted using the function plotPCA, which is included within the DESeq2 package. The biological replicate samples showed strong correlation for each treatment (Supplementary Fig. 9).
Data availability
The ChIP-seq and RNA-seq data reported in this manuscript has been deposited in the NCBI GEO data repository (GSE121474).
RIME and oligo pulldown
RIME was performed as previously described [43]. For oligo pulldown, ~2x10⁷ cells were used. All the steps were performed at 4˚C unless otherwise mentioned. Cells were washed with PBS and collected by centrifugation. Next, cells were solubilized into HKMG-buffer (10mM HEPES pH7.5, 100mM KCl, 5mM MgCl2, 10% glycerol, 0.5% NP-40, 1mM DTT, protease inhibitor, phosphatase inhibitor and 50µM PUGNAc (the last four added fresh) and sonicated using Bioruptor (Diagenode). Samples were centrifuged full speed for 10 minutes and the supernatant collected.
Biotinylated oligos were prepared by mixing 30µL of sense and anti-sense sequences (30mg per ml) with 6.6µL of 10X PCR buffer (100mM TRIS-HCl pH8.0, 15mM MgCl2). Next, this mixture was heated to 100˚C for 5 minutes and allowed to cool down to room temperature on a heat block.
One vial of Streptavidin MagneSphere® Paramagnetic Particles (Z5481, Promega) was prepared for each sample by washing three times with HKMG-buffer, and suspended into 100µL of HKMG-buffer (50µL for pre-clearing of samples, 50µL used to bind to oligo). 10µL of annealed oligos were rotated with 50µL of beads for 15 minutes in room temperature, washed 3 times with HKMG-buffer and stored on ice until use.
Cell extracts were pre-cleared with 50µL of beads for 1 hour. After this, oligo-bead complexes were added to extract and incubation was continued overnight. The next day, beads were washed five times with HKMG-buffer and stored at -80˚C until mass spectrometry analysis.
Liquid chromatography-mass spectrometry (LC-MS)
The beads from RIME and oligo pulldown were incubated with 2 µg trypsin GOLD (Promega, Madison, WI, USA) in 50 µl 25 mM ammonium bicarbonate pH 7.8 for 16 h at 37°C. The resulting peptides were purified using a 10 µl OMIX C18-SPE pipette tip (Agilent, Santa Clara, CA, USA), and dried using a Speed Vac concentrator (Concentrator Plus, Eppendorf, Hamburg, Germany). Subsequently, the tryptic peptides were dissolved in 10 µl 0.1% formic acid/2% acetonitrile and 5 µl samples were analyzed using an Ultimate 3000 RSLCnano-UHPLC system connected to a Q Exactive mass spectrometer (Thermo Fisher Scientific, Bremen, Germany) equipped with a nano-electrospray ion source. For liquid chromatography separation, an Acclaim PepMap 100 column (C18, 2 µm beads, 100 Å, 75 μm inner diameter, 50 cm length) (Dionex, Sunnyvale CA, USA) was used. A flow rate of 300 nL/min was employed with a solvent gradient of 4-35% B over 60 min. Solvent A was 0.1% formic acid and solvent B was 0.1% formic acid/90% acetonitrile. The mass spectrometer was operated in the data-dependent mode to automatically switch between MS and MS/MS acquisition. Survey full scan MS spectra (from m/z 400 to 2,000) were acquired with the resolution R = 70,000 at m/z 200, after accumulation to a target of 1x10⁶. The maximum allowed ion accumulation times were 60 ms. The method used allowed sequential isolation of up to the ten most intense ions, depending on signal intensity (intensity threshold 1.7x10⁴), for fragmentation using higher-energy collisional induced dissociation (HCD) at a target value of 1x10⁵ charges, NCE 28, and a resolution R = 17,500. Target ions already selected for MS/MS were dynamically excluded for 30 sec. The isolation window was m/z = 2 without offset. For accurate mass measurements, the lock mass option was enabled in MS mode.
Data were acquired using Xcalibur v2.5.5 and raw files were processed to generate a peak list in Mascot generic format (*.mgf) using ProteoWizard release version 3.0.331. Database searches for trypsin fragments were performed using Mascot in-house version 2.4.0 to search the SwissProt database (Human, 20279 proteins), allowing a maximum of one missed trypsin cleavage site for any given peptide, fragment ion mass tolerance of 0.05 Da, parent ion tolerance of 10 ppm, with oxidation of methionines and acetylation of the protein N-terminus as variable modifications. Scaffold (version Scaffold_4.4.8, Proteome Software Inc., Portland, OR) was used to validate MS/MS based peptide and protein identifications. Peptide identifications were accepted if they could be established at greater than 95.0% probability by the Scaffold Local FDR algorithm. Protein identifications were accepted if they could be established at greater than 99.0% probability and contained at least two identified peptides.
Results
Global chromatin O-GlcNAc mark is sensitive to OGT inhibition
In order to probe the stability of the O-GlcNAc chromatin mark, we utilized a recently reported fast-acting OGT inhibitor OSMI-2 [34] and a specific antibody recognizing the O-GlcNAc epitope [13, 44]. First, we used western blotting to assess the effects of OSMI-2 on the total O-GlcNAc levels in AR-positive (LNCaP) and AR-negative (PC3) prostate cancer cell line after 4 hours of treatment (Fig. 1A). OSMI-2 more efficiently decreased total-O-GlcNAc in PC3 cells, which was therefore selected to probe the stability of the O-GlcNAc mark on chromatin. We performed a biological triplicate ChIP-seq experiment in the presence and absence of OSMI-2 and detected 8,906 peaks in PC3 cells (Fig. 1B). Strikingly, 4 hours treatment with OSMI-2 decreased the number of O-GlcNAc peaks by 70%, which shows that this chromatin mark is remarkably un-stable and further validates that it is installed by OGT (Fig. 1B). Strong enrichment of the chromatin-bound O-GlcNAc was quantitatively and reproducibly lost upon OSMI-2 treatment, as exemplified using the promoter for the MAX gene (Fig. 1C). We validated the O-GlcNAc ChIP-seq data using OGT inhibition and genetic depletion of OGT (Supplementary Fig. 1). This is the first study to report that O-GlcNAc chromatin mark is rapidly lost when OGT activity is inhibited.
O-GlcNAc chromatin mark has been reported to localize to transcription start sites (TSS) [13, 44]. We therefore evaluated the peak distribution of O-GlcNAc in DMSO and OSMI-2 treated cells. We observed a sharp single peak for DMSO-treated cells, while OSMI-2 treatment led to a remarkable re-distribution of the single O-GlcNAc peak into two separate peaks (Fig. 1D). Next, we evaluated the peak distribution of the peaks that overlap in the DMSO and OSMI-2 ChIP-seq. In this case, both conditions showed sharp single peak. Despite OGT inhibition, we detected these O-GlcNAc marked sites, and accordingly, these common sites have the most stable O-GlcNAc mark based on the read counts (compare DMSO-treated sample in Fig. 1D to 1E). Importantly, the strength of the meta-peak was decreased by ~50% for the OSMI-2 treatment (Fig. 1E). These data show that the O-GlcNAc chromatin mark is dependent on high OGT activity. The drastic re-distribution of the O-GlcNAc peaks in response to OSMI-2 suggests that this modification participates in transcriptional regulation.
Most prostate cancers are AR-positive [18], and we therefore evaluated the conservation of the O-GlcNAc chromatin mark localization between AR-positive prostate cancer cell line (LNCaP) and PC3 cells. The majority of the LNCaP O-GlcNAc ChIP-seq sites overlapped with the O-GlcNAc sites in PC3 cells (70%, Supplementary Fig. 2A). In addition, LNCaP O-GlcNAc sites overlapped significantly with previously reported single-replicate ChIP-seq studies (Fig. 2A). The high degree of conservation between cell lines of different origin suggests that O-GlcNAc could be a regulator of fundamentally important pathways.
We selected the genes associated with the O-GlcNAc chromatin mark in both LNCaP and PC3 cells and subjected this gene set to pathway enrichment analysis to identify candidate OGT-regulated pathways in prostate cancer cells. Among the top pathways were 'RNA transport', 'ribosome', 'Ubiquitin mediated proteolysis' and 'cell cycle' (Supplementary Fig. 2B). Our data identifies a mechanism that directly links OGT to biomass production and proliferation, in support of models proposing OGT as a nutrient sensor [45]. In order to better understand the role of chromatin O-GlcNAc mark, we moved on to characterize its specific localization throughout the genome.
O-GlcNAc marks transcriptionally active chromatin and super-enhancers
The majority of chromatin-bound O-GlcNAc was found in promoters (57%), as previously reported (Fig. 2B) [13, 44]. Almost all of the O-GlcNAc sites (95%) overlapped with DNase-hypersensitive regions (DHS) and markers of active promoters (h3K4me3 and h3K27ac) but no overlap was observed with a marker of transcriptionally inactive chromatin (h3K27me3, Fig. 2C). In addition, 95% of chromatin O-GlcNAc overlapped with active transcription (RNA-Pol II and nascent RNA). These data are in agreement with reports showing that RNA-Pol II CTD is O-GlcNAc modified and that O-GlcNAc and RNA-Pol II sites overlap [11-13]. Given the prominent overlap between O-GlcNAc and RNA-Pol II chromatin-bound regions, we evaluated if OGT inhibition affects phosphorylation status of RNA Pol-II but did not observe prominent effects (Supplementary Fig. 3A). These data indicate that OSMI-2 does not exert global defect in RNA-Pol II activity but could affect expression of certain genes driven by a specific class of regulatory elements.
Super-enhancers (SE) are cell-type specific enhancers of highly transcribed genes [46]. We assessed if O-GlcNAc mark overlaps with these regulatory elements. SEs have been mapped in LNCaP cells using the h3K27ac histone modification as the surrogate [47]. Most (70%) of the SE-genes were associated with the O-GlcNAc mark (Fig. 2D). OGT inhibition decreased the expression of CDK1 and KLK3, two SE-genes selected for validation (Fig. 2E, F and Supplementary Fig. 3B). Targeting OGT has been shown to decrease the expression of CDK1, but the reason for this is not understood [30].
Figure 1
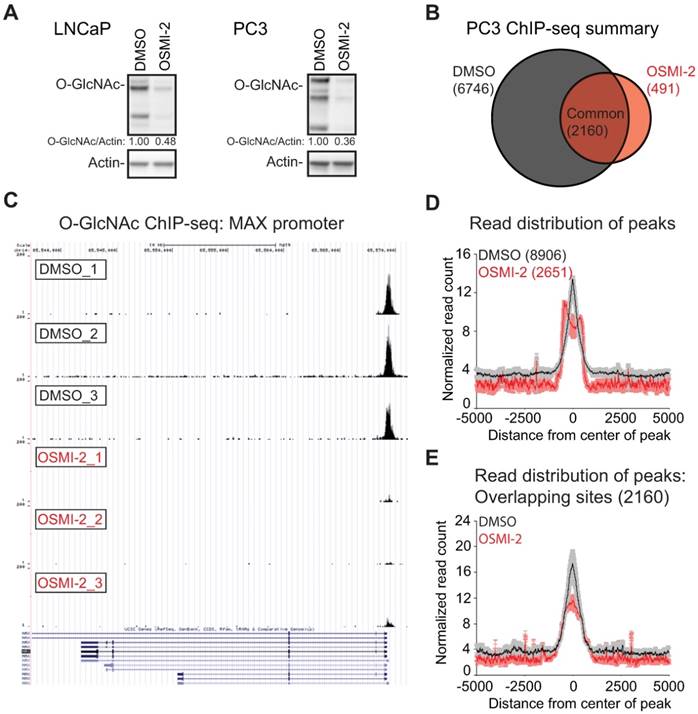
Global chromatin O-GlcNAc mark is sensitive to OGT inhibition. A) 40µM OSMI-2 treatment rapidly decreases global O-GlcNAc levels as determined using western blot after 4 hours of treatment. B) Summary of the PC3 O-GlcNAc ChIP-seq data. Cells were treated for 4 hours with DMSO or 40µM OSMI-2. The data shown represents overlap of three biological replicate samples for both DMSO and OSMI-2 treatments. C) OSMI-2 treatment decreases O-GlcNAc peak strength. University of California, Santa Cruz (UCSC) Genome Browser view of the Max gene promoter and three biological replicate O-GlcNAc ChIP-seq experiments. D) Distribution of O-GlcNAc ChIP-seq reads within ±5kb of O-GlcNAcylated regions within either DMSO or OSMI-2 conditions. Data shown is an average of three biological replicates with SEM. E) Distribution of O-GlcNAc ChIP-seq reads within ±5kb of O-GlcNAcylated regions overlapping within DMSO and OSMI-2 conditions. Data shown is an average of three biological replicates with SEM.
Figure 2
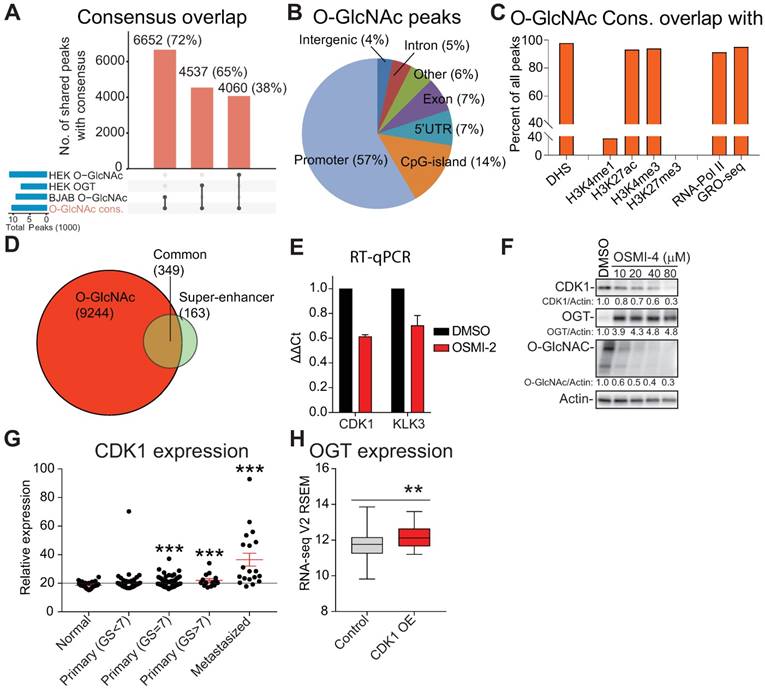
O-GlcNAc chromatin mark overlaps with active promoters and super-enhancers. A) UpSet plot shows the overlap of O-GlcNAc consensus peak-set (10,463) with previously reported OGT and O-GlcNAc ChIP-seq datasets (BJAB O-GlcNAc [GSM2295951], HEK OGT [GSE36620], and HEK O-GlcNAc [GSE36620]. B) Peak distribution of O-GlcNAc ChIP-seq data reported here with respect to known genomic elements. C) O-GlcNAc consensus overlap with previously published datasets. Accession numbers to published datasets: DNase I hypersensitive site (DHS): GSM816637, H3K4me1: GSE73994, H3K27ac: GSE73994, H3K4me3: GSE73994, H3K27me3: GSE73994, RNA-Pol II: GSE28126 and Global Run-On Sequencing (GRO-seq); retrieved from Wang et al., 2011 and analyzed according to Chae et al., 2015) [73, 74]. D) Overlap of LNCaP O-GlcNAc ChIP-seq marked genes with LNCaP super-enhancers as reported previously [47]. E) The effect of 40µM OSMI-2 (24 hours) on CDK1 and KLK3 mRNA expression. The data shown is an average of three biological replicates with SEM. F) The effect of OSMI-4 (24 hours) on CDK1 expression at the protein level. Densitometry was used to determine the intensity of the indicated proteins. G) Expression of the CDK1 gene in prostate cancer patient samples. Data was downloaded from http://www.betastasis.com/prostate_cancer/taylor_et_al_2010. The mean values with SEM are shown for each group. The significance of the data was evaluated using Student's t-test in comparison to normal samples, ***<0.001. H) Expression of OGT in prostate cancer tumor samples that overexpress CDK1 (n=19) and the rest (n=479). The figure was generated using data available through cBioPortal [75, 76].
O-GlcNAc mark did not always directly overlap with SEs (Supplementary Fig. 3C, D), and we therefore assessed if OGT activity is important to maintain chromatin-accessibility using formaldehyde-assisted isolation of regulatory elements (FAIRE). OGT inhibition led to chromatin compaction of both the CDK1 and KLK3 enhancers (Supplementary Fig. 3E). In order to position our finding into clinical setting, we evaluated the expression pattern of OGT and CDK1 in prostate cancer patient samples. CDK1 expression increases steadily from normal prostate tissue to high Gleason Score prostate cancer and tumors with high CDK1 expression have significantly elevated levels of OGT (Fig. 2G, H). These data imply that high OGT activity is important for the expression of CDK1 also in vivo.
To summarize our findings so far, we show for the first time that O-GlcNAc chromatin mark is associated with SE genes and OGT-activity is important for the expression of the genes driven by SEs. In addition, O-GlcNAc is enriched on the transcriptionally active promoters in prostate cancer cells but we do not currently know whether this modification is primarily associated with histones or transcription factors.
MYC co-occupies O-GlcNAc marked chromatin sites
Histone read distributions around chromatin-bound O-GlcNAc show that O-GlcNAc sites have the typical chromatin structure of a region bound by transcription factors (Fig. 3A). To identify candidate transcription factors binding to this motif, we performed de novo motif discovery using HOMER. The top two motifs for O-GlcNAc ChIP-seq were similar to the ETS (also known as E26 transformation-specific) transcription factor ELK4 and ELK1 motifs (Fig. 3B). We validated this overlap by confirming that 80% of the O-GlcNAc regions overlap with the prostate cancer-relevant ETS transcription factor, ETV1 (Supplementary Fig. 4A) [18]. However, we did not observe prominent overlap between O-GlcNAc occupied regions and other transcription factors relevant for prostate cancer progression (AR, FOXA1 and HOXB13, Supplementary Fig. 4A) [18].
Figure 3
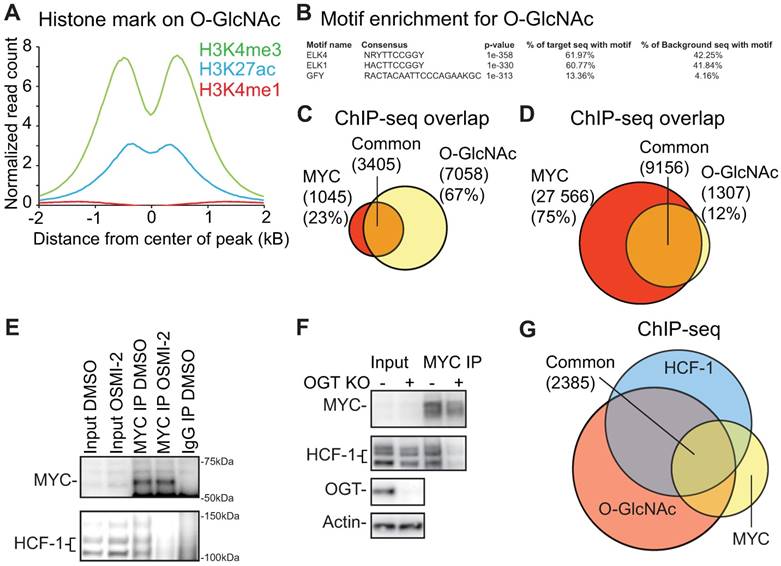
Identification of transcription factors that bind to O-GlcNAc marked chromatin. A) Distribution of differently modified histone 3 reads within ±2kb of O-GlcNAc peak. B). The top 3 motifs enriched for the O-GlcNAc ChIP-seq data showing similarity with known previously identified transcription factor motifs from published datasets. C) O-GlcNAc ChIP-seq consensus overlap with MYC ChIP-seq data reported in this study. D) O-GlcNAc ChIP-seq consensus overlap with MYC ChIP-exo dataset reported previously (GSE73994). E) OSMI-2 disrupts interaction between MYC and HCF-1. Immunoprecipitation (IP) of MYC. IgG denotes negative control. MYC was overexpressed by addition of doxycycline using the LNCaP-MYC cell line for 4 hours either in the presence or absence of 40µM OSMI-2. Experiment was repeated four times. F) Knockout of OGT disrupts the interaction between MYC and HCF-1. Experiment was performed in a mouse embryonic fibroblast cell line that has been genetically engineered to enable removal of OGT gene by addition of 0.5µM Tamoxifen (Tam). After two days of DMSO- or Tam-treatments, cell lysates were prepared and used for immunoprecipitation. Data shown is representative of two biological replicates. G) Overlap of O-GlcNAc (this study), MYC (this study) and HCF-1 (ENCSR000ECH) ChIP-seq data.
OGT has previously been reported to be a critical mediator of MYC-dependent transformation [14, 21, 22]. We therefore performed a MYC ChIP-seq experiment and observed that 77% of the MYC binding regions overlapped with chromatin-bound O-GlcNAc in prostate cancer cells (Fig. 3C). To validate the observed overlap, we used a previously published MYC ChIP-exo dataset [48]. ChIP-exo allows smaller peaks to be detected more readily, which leads to a higher number of peaks than the conventional ChIP-seq [49]. We observed that ~90% of the O-GlcNAc-marked regions overlapped with the MYC ChIP-exo peaks (Fig. 3D). O-GlcNAc chromatin mark is clearly associated with MYC binding sites but we do not yet know how OGT affects MYC function.
OGT activity is required for MYC-HCF-1 interaction
In order to further characterize the O-GlcNAc-modified and chromatin-associated protein complex that contains MYC, we used mass spectrometry. First, we performed RIME (Rapid Immunoprecipitation for Mass spectrometry of Endogenous proteins) using the same anti-O-GlcNAc antibody as we used for ChIP-seq. Second, we prepared a biotinylated oligonucleotide of the GFY-sequence, which was the third most enriched motif for O-GlcNAc ChIP-seq (Fig. 3B). Finally, we overlapped these two datasets with MYC RIME and identified a single protein, Host Cell Factor 1 (HCF-1; also called HCFC1) (Supplementary Table).
We confirmed that MYC interacts with HCF-1 in prostate cancer cells (Fig. 3E), as previously reported using a different model system [50]. HCF-1 is cleaved at one of several central repeats, explaining the multiple bands observed in the western blot; the N- and C-terminal fragments remain associated in cells to form the functional protein [51]. Both MYC and HCF-1 can be glycosylated by OGT, and we observed that a short-term treatment (4 hours) with OGT inhibitor OSMI-2 abrogates the interaction between the two (Fig. 3E) [30, 52]. Reciprocally, we immunoprecipitated HCF-1 and observed that OSMI-2 decreases the interaction between HCF-1 and MYC (Supplementary Fig. 4B). Next, we used siRNAs to knockdown OGT, and observed that this decreases the interaction between MYC and HCF-1 (Supplementary Fig. 4C). In order to confirm that OGT is important for the interaction between MYC and HCF-1, we used a MEF cell line, in which OGT gene can be deleted from the genome by tamoxifen-inducible Cre-recombinase [33]. Importantly, OGT knockout disrupted the interaction between MYC and HCF-1 (Fig. 3F).
OGT activity might be essential for transcription factor complex formation in general, and the fast-acting OSMI-2 enabled us to assess this. OSMI-2 treatment resulted in the loss of interaction between MYC and SP1, the first transcription factor reported to be O-GlcNAc modified and a known MYC-interaction partner (Supplementary Fig. 4D) [53, 54]. On the other hand, OSMI-2 did not affect the previously reported interaction between AR and HCF-1 (Supplementary Fig. 4B, E) [55]. This differential sensitivity may be important for the integration of nutrient-availability to engage with proliferative-program (MYC) or maintenance of cell-identity (AR).
Our data shows that the acute OGT inhibition affects MYC interaction with partner proteins. In support of this, treatment with OSMI-2 led to loss of MYC-targets in the O-GlcNAc ChIP-seq data (Supplementary Fig. 4F). Over half of the MYC-bound chromatin regions are additionally marked by O-GlcNAc and HCF-1, further supporting the functional relevance of the MYC-HCF-1 interaction (Fig. 3G). Based on these data, we propose that OGT is important for the MYC-dependent transcriptional program.
OGT regulates the MYC-dependent transcriptome and proteome
In order to assess the effect of OGT inhibition on MYC-dependent transcription, we used a cell line model in which MYC can be induced by the addition of doxycycline and performed RNA-seq in the presence and absence of OSMI-2. We first confirmed that OSMI-2 does not prominently affect MYC-induction at the mRNA and protein levels (Fig. 4A, B). In order to assess if OSMI-2 affects all MYC-dependent genes in one way or the other, we performed principal component analysis. The effect on gene expression was dominated by MYC-induction, in agreement with previous reports establishing MYC as a strong transcriptional activator (Supplementary Fig. 5A) [28, 29]. OSMI-2 had only a modest effect, which may be explained by the fact that OGT-expression is strongly increased and OGA down-regulated in response to OSMI-2 (Supplementary Fig. 5B).
Addition of OSMI-2 did not drastically change the MYC-induced expression profile but rather amplified it, for example by enhancing the down-regulation of KLK3 and NKX3.1 or by increasing the induction of RNF187 and DDIT4 (Supplementary Fig. 6). Interestingly, overexpression of MYC in the presence of OSMI-2 led to down-regulation of a high number of genes (Supplementary Table). We used RT-qPCR to validate that induction of MYC in the presence of OSMI-2 results in down-regulation of MMP7, ZNF812P, GINS2, ASF1B, DTL, and KLK2 (Fig. 4A). Pathway enrichment analysis of the genes that were down-regulated specifically upon the combination treatment identified the cell cycle, and more specifically, the transition from G1- to S-Phase, as the most significant process (Supplementary Fig. 7A), suggesting that OGT might be important for MYC-regulated cell cycle progression.
Next, we used reverse-phase protein array technology (RPPA) to test if OGT affects the MYC-dependent proteome. We focused on the proteins that required OGT activity to be regulated by MYC and identified 28 proteins (10% of the total detected) (Supplementary Table). Pathway enrichment analysis reported a specific point of the cell cycle, the G2-M transition, to be enriched for these proteins (Supplementary Fig. 7B). MYC-dependent expression of these 28 proteins did not strongly correlate with mRNA levels (Fig. 4C). On the other hand, for both OSMI-2 on its own and in combination with MYC overexpression, we observed a statistically significant correlation between mRNA and protein levels. We selected two proteins PLK1, and Cyclin B1, to validate the RPPA-data using RT-qPCR and western blotting. MYC-induced expression of these proteins was antagonized by OSMI-2 at the protein level but not affected at the mRNA level (Fig. 4D and Supplementary Fig. 7C).
Figure 4
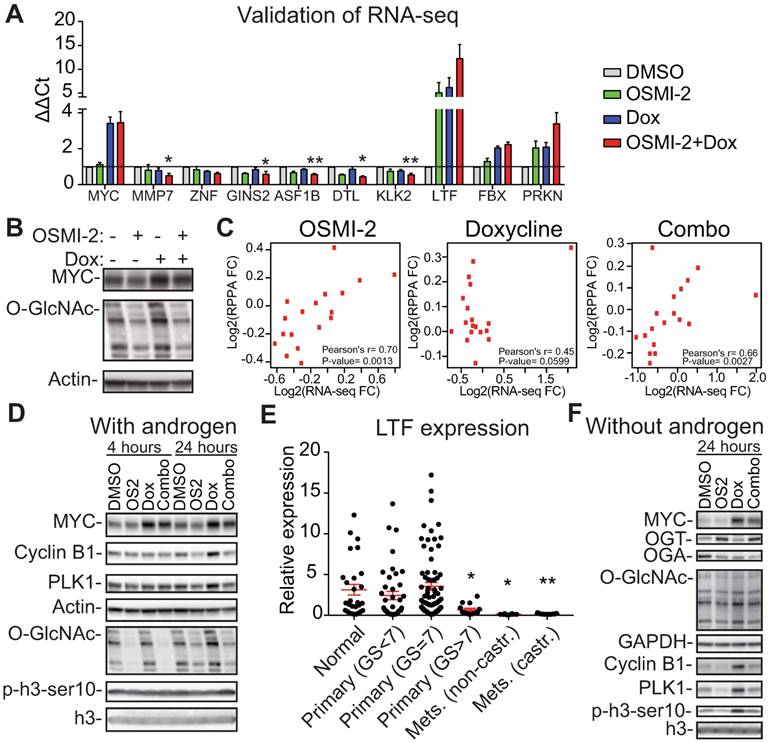
OGT affects MYC-dependent transcription. The expression of MYC was induced in the LNCaP-MYC cell line by addition of doxycycline (Dox). A) Validation of the RNA-seq data using RT-qPCR. Treatment time is 24 hours and OSMI-2 dose 40µM. MMP7, ZNF (=ZNF812P), GINS2, ASF1B, DTL and KLK2 were down-regulated in the combination treatment with OSMI-2 and doxycycline (to induce MYC), while LTF, FBX (=FBXO32) and PRKN were up-regulated. Data shown is an average of three biological replicates with SEM. Student's t-test was used to evaluate statistical significance between Dox and Dox+OSMI-2 condition, *<0.05 and **<0.01. B) Cells were treated with Dox and 40µM OSMI-2 for 24 hours and analyzed by western blotting. C) Pearson correlation of mRNA and protein expression for the proteins that were induced by MYC-overexpression and antagonized by OSMI-2. D) MYC-induced upregulation of PLK1 and Cyclin B1 is antagonized by OSMI-2 (OS2). Cells were treated as indicated and samples were analyzed using western blotting. E) Expression of the LTF gene in prostate cancer patient samples. Data was downloaded from http://www.betastasis.com/prostate_cancer/taylor_et_al_2010. The mean values with SEM are shown for each group. The significance of the data was evaluated using Student's t-test in comparison to normal samples, *<0.05, **<0.01. F) LNCaP-MYC cells were grown in the absence of androgens for 3 days, treated as indicated for an additional 24 hours, protein lysates were collected and western blot was used to detect the indicated proteins.
To identify potential mechanisms for OSMI-2 induced down-regulation of MYC-regulated proteins, we turned our attention to the genes that were induced when OSMI-2 was combined with MYC overexpression. Induction of MYC in the presence of OSMI-2 resulted in a 12-fold increased expression of the lactotransferrin (LTF)-gene (Fig. 4A). O-GlcNAc, MYC, and HCF-1 were all bound to the enhancer of the LTF-gene (Supplementary Fig. 8A, B, C). LTF acts as a tumor-suppressor through its ability to induce the expression of ubiquitin ligases and the protein is negatively regulated by OGT [56]. Based on our RNA-seq data, we identified and subsequently validated that two ubiquitin ligases, FBXO32 and PRKN, are induced by OGT inhibition (Supplementary Table and Fig. 4A). In order to understand the potential clinical relevance of LTF in prostate cancer, we evaluated its expression in patient samples. Interestingly, LTF is abundantly expressed in normal prostate tissue and in low-grade tumors (Gleason score<7), but its expression is completely shut down in the metastatic tissue (Fig. 4E).
Taken together, OGT regulates MYC-dependent transcription of certain mRNAs involved in the control of G1-S transition and additionally promotes protein stability of mitotic proteins. MYC-induced expression of ubiquitin ligases adds another layer of complexity to MYC-dependent regulation of cell function; this response will be further characterized in future studies. Our data suggest that OGT should be especially important for MYC-driven proliferation.
OGT is required for MYC-dependent proliferation of prostate cancer cells in the absence of androgens
MYC is required for the androgen-independent proliferation of prostate cancer cells, the major cause of disease progression [48, 57]. This can be modeled in vitro using the LNCaP-MYC cell line, which requires androgens to achieve full growth potential; however, MYC-expression can be induced by addition of doxycycline and this is sufficient to promote androgen-independent proliferation [48, 58].
First, we wanted to assess if MYC can promote the expression of mitotic proteins in the absence of androgens and whether OGT activity is important in this setting. We observed an even stronger induction of Cyclin B1, and PLK1, when compared to cells growing in the presence of androgens (Fig. 4D, F and Supplementary Fig. 8D). OSMI-2 treatment almost completely antagonized MYC-induced expression of Cyclin B1, and PLK1. Overexpression of MYC also increased phosphorylation of the marker of mitosis, p-H3ser10, and this was decreased by OSMI-2. Of note, cells are able to adapt to OSMI-2 treatment by increasing the expression of OGT and decreasing the expression of OGA, and the OSMI-2 effect on total-O-GlcNAc at 24 hours of treatment in the absence of androgens is modest. Using siRNAs against OGT we confirmed that the MYC-induced increase in the expression of Cyclin B1 and PLK1 is dependent on OGT (Fig. 5A).
Second, we used flow cytometry to assess the role of OGT in MYC-induced cell cycle progression. Androgen-deprivation decreased the number of cells in S-Phase by over 50% (Fig. 5B). Overexpression of MYC was able to double the number of cells going through the S-Phase in the absence of androgens. Importantly, OSMI-2 antagonized MYC-induced accumulation of cells in the S-Phase.
We next used viability assays to confirm reports that MYC overexpression promotes proliferation of prostate cancer cells in the absence of androgens [48, 57, 58]. Overexpression of MYC increased cell viability by 25% in the absence of androgens but did not increase viability in the presence of androgens (Fig. 5C). The growth-benefit of MYC-overexpression was decreased by treatment with OSMI-2 and completely antagonized by siRNAs targeting OGT.
Here we show that the androgen-independent growth advantage induced by MYC is dependent on OGT. Our data shows that the high expression of certain factors at the protein level, even in the absence of mRNA elevation, might be important for cancer cell proliferation and could be used as biomarkers. To test this, we evaluated the predictive value of Cyclin B1 at the mRNA and protein levels in prostate cancer patients. CCNB1 mRNA is non-significantly associated with disease progression (p=0.203), while increased protein level expression of Cyclin B1 is significantly associated with disease progression (p=0.000014; Logrank test, Fig. 5D, E). These results highlight the importance of evaluating both mRNA and protein level data to understand the relevance and predictive value of prognostic markers.
Taken together, OGT is important for the MYC-driven cellular program at two levels: the transcription of genes involved in the G1-S transition and the stabilization of proteins involved in the G2-M transition. This renders high OGT activity indispensable for MYC-dependent proliferation of prostate cancer cells.
Discussion
Mammalian OGT is required for development, normal physiological functions of post-mitotic cells and proliferation of immortalized cells [33, 59-62]. Here, we have shown that OGT regulates MYC-dependent transcription and affects levels of mitotic proteins in prostate cancer cells.
In general, the functional role of OGT in the regulation of transcription is poorly understood, but one of the most prominent O-GlcNAc modified proteins is RNA-Pol II itself. Glycosylation of RNA-Pol II CTD has been shown to regulate pre-initiation complex formation using in vitro assays and O-GlcNAc mark is found on the promoters in human cell lines as reported here and shown by others [12, 13, 44]. In addition, O-GlcNAc is enriched on the promoters in Caenorhabditis elegans, but the modification is not responsive to nutrients [63]. Perturbation of OGT activity in specific cell or organ type has prominent effects on transcription and overall physiology of the animal in mouse studies [62, 64], however, given the high number of OGT-targets, it is not possible to attribute these effects directly to transcription. We observed that prostate cancer super-enhancer (SE) genes are also marked by the O-GlcNAc chromatin mark and that OGT inhibition decreases the expression of SE-mRNAs (Fig. 2D, E). This implies that OGT activity may be particularly important for highly transcribed genes. In the future, it is important to establish how inhibition of OGT affects transcription using GRO- and NET-seq type assays.
Figure 5
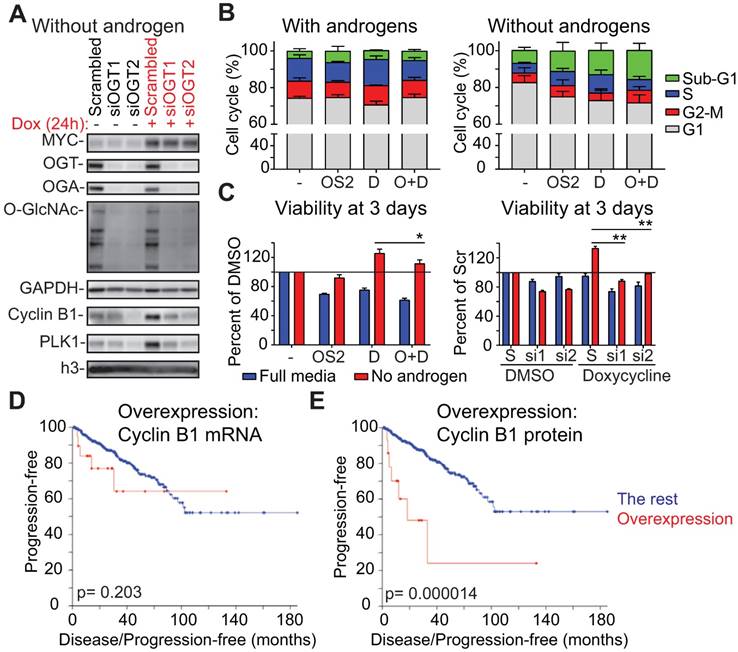
OGT is required for MYC-induced proliferation of prostate cancer cells in the absence of androgens. A) OGT knockdown was started at the same time as androgen-deprivation, which lasted for 3 days, at which point cells were treated with doxycycline for 24 hours as indicated. Samples were analyzed using western blot. Data shown is representative of 2 biological replicates. B) Propidium iodide staining and flow cytometry were used to determine cell cycle distribution after 24 hours treatment (cells were first androgen-deprived for 3 days as indicated). OSMI-2 dose was 40 µM. The data shown is an average of three biological replicates with SEM. OSMI-2= OS2; Dox= D. C) Viability of cells was assessed using the Cell Titer Glo-reagent after 3 days of treatment. Data shown is an average of three biological replicates with SEM and significance was assessed using the Student's t-test, * < 0.05, **<0.01. OSMI-2 dose was 40µM. OSMI-2= OS2; Dox= D; S=Scrambled; si1 and si2= siOGT1 and siOGT2. D) Correlation between increased expression of Cyclin B1 at the mRNA level and progression free survival was evaluated using the prostate adenocarcinoma TCGA-dataset, accessed through the cBioPortal for Cancer Genomics [76, 77]. E) Correlation between increased expression of Cyclin B1 at the protein level and progression free survival was evaluated using the prostate adenocarcinoma TCGA-dataset, accessed through the cBioPortal for Cancer Genomics [76, 77].
We show that inhibition of OGT enhances MYC-regulated transcriptional repression of certain cell cycle genes, possibly due to disruption of MYC-containing protein complexes, albeit the exact mechanism(s) for this remain to be determined (Figs. 3E, 3F and 4A). In addition, we showed that OGT is important for MYC-regulated expression of mitotic proteins (Figs. 4D, 4F, 5A). Based on these data, we propose that the decrease in OGT activity leads to suppression of cell cycle program by a dual mechanism: at the mRNA level to control initiation of the S-Phase and additionally OGT affects the stability of proteins involved in mitosis (Figs. 4A and 5A). OGT would thereby function as a metabolic rheostat and utilize its catalytic activity to halt the cell cycle in the absence of sufficient energy and promote proliferation when nutrients are abundant.
Excessive nutrient uptake is detrimental to health in general, and obesity has been linked to both breast and prostate cancers [65, 66]. A high rate of proliferation requires a constant supply of energy, but it is becoming increasingly clear that metabolism can also directly affect cell fate [3, 9, 67, 68]. It is known that glucose feeding stimulates OGT-activity in mouse liver and that overexpression of the glucose transporter GLUT3 in nonmalignant breast cells leads to loss of tissue polarity and activation of tumor-promoting pathways [10, 69]. We therefore speculate that increased blood glucose, as observed in common conditions such as pre-diabetes, which affects over 80 million Americans (source: American Diabetes Association), could serve as a second hit, and be a variation of the genetic '2-hit' hypothesis [14, 70].
OGT is essentially required in proliferating cells but post-mitotic cells can survive without it, which makes the enzyme a prototypical cancer-target [60]. OSMI-2 binds to the active site of OGT, and higher levels of the OGT's substrate, UDP-GlcNAc , in LNCaP cells than PC3 cells, renders total-O-GlcNAc levels less sensitive to this inhibitor (Fig. 1A) [19, 34]. AR promotes the expression of the hexosamine biosynthetic pathway (HBP) enzymes and prostate cancer cells therefore have high levels of UDP-GlcNAc [14, 19]. Interestingly, progression to lethal, castration-resistant prostate cancer (CRPC) leads to a prominent down-regulation of the HBP enzymes [71]. The development of CRPC is not completely understood, but one of the factors known to be able to confer CRPC phenotype is MYC [48, 57, 72]. In this study, we showed that MYC-driven, androgen-independent proliferation of prostate cancer cells requires OGT. Based on these data, OGT inhibitors could be combined with anti-androgens to target the cancer cells that become dependent on MYC.
In conclusion, we show that O-GlcNAc, MYC and HCF-1 are found in transcription start sites that contain the GFY-motif and that OGT activity is required for the robust interaction between MYC and HCF-1. Inhibition of OGT-activity impairs MYC's ability to promote androgen-independent proliferation. Our work suggests that OGT could be a drug-target in MYC-addicted tumors. Identification of new actionable targets for cancer-therapy is urgently needed, and in the future, it will be important to understand potential cancer cell-specific adaptive response(s) that are activated in response to OGT inhibition.
Abbreviations
ADI1: Acireductone Dioxygenase 1; AR: androgen receptor; ASF1B: Anti-Silencing Function 1B Histone Chaperone; CDK1: cyclin-dependent kinase 1; ChIP: chromatin immunoprecipitation; CCNB1: Cyclin B1; DDIT4: DNA Damage Inducible Transcript 4; DHS: DNase-hypersensitive regions; DTL: Denticless E3 Ubiquitin Protein Ligase Homolog; ETS: E26 transformation-specific; FAIRE: Formaldehyde-Assisted Isolation of Regulatory Elements; FBS: fetal bovine serum; FBXO32: F-Box Protein 32; FOXA1: Forkhead Box Protein A1; GINS2: GINS Complex Subunit 2; GLUT3: Glucose transporter 3; GRO-seq: Global Run-On Sequencing; H3k4me1: Mono-Methyl-Histone H3 lysine 4; H3K4me3: Tri-Methyl-Histone H3 lysine 4; H3k27ac: Acetyl-Histone H3 lysine 27; H3K27me3: Tri-Methyl-Histone H3 lysine 27; HCF-1: host cell factor 1; HBP: hexosamine biosynthetic pathway; HEK: Human embryonic kidney 293 cells; HOXB13: Homeobox protein Hox-B13; KLK3: Kallikrein Related Peptidase 3; KLK2: Kallikrein Related Peptidase 2; LTF: lactotransferrin; MMP7: Matrix Metallopeptidase 7; NET-seq: Native elongating transcript sequencing; NKX3.1: NK3 Homeobox 1; OGA: O-GlcNAcase; OGT: O-GlcNAc transferase; pFa: para-formaldehyde; p-S2/5-Pol II: RNA polymerase II CTD repeat phospho serine 2/ serine 5; p-H3ser10: Phospho-Histone H3 Ser10; PUGNAc: O-(2-Acetamido-2-deoxy-D-glucopyranosylidenamino) N-phenylcarbamate; PLK1: Polo Like Kinase 1; PRKN: Parkin RBR E3 Ubiquitin Protein Ligase; RNF187: RING-Type E3 Ubiquitin Transferase; RPPA: reverse-phase protein arrays; seq: Massively parallel sequencing; SP1: Sp1 Transcription Factor / Specificity Protein 1; SREBP1: sterol regulatory element-binding protein 1; ZNF812P: Zinc Finger Protein 812, Pseudogene.
Supplementary Material
Supplementary figures and table legend.
Supplementary table.
Acknowledgements
RPPA was purchased as a service from MD Anderson, and the RPPA facility is funded by NCI # CA16672. We would like to thank the Division of Immunology Flow Cytometry Facility at Harvard Medical School for help with flow cytometry. In addition, we thank Mr. Zebulon Levine for critical reading and commenting of the manuscript, and Dr Ace George Santiago for drawing the graphical abstract. This research was supported by the Norwegian Cancer Society (Project nr. 4521627) and by the National Institutes of Health (R01 GM094263). AK and AM are supported by the Norwegian Research Council (project number 187615), Helse Sør-Øst, and the University of Oslo through the Centre for Molecular Medicine Norway (NCMM).
Competing Interests
The authors have declared that no competing interest exists.
References
1. Towle HC. Metabolic regulation of gene transcription in mammals. J Biol Chem. 1995;270:23235-8
2. Wang X, Sato R, Brown MS, Hua X, Goldstein JL. SREBP-1, a membrane-bound transcription factor released by sterol-regulated proteolysis. Cell. 1994;77:53-62
3. Vander Heiden MG, DeBerardinis RJ. Understanding the intersections between metabolism and cancer biology. Cell. 2017;168:657-69
4. Liberti MV, Locasale JW. The Warburg effect: how does it benefit cancer cells? Trends Biochem Sci. 2016;41:211-8
5. Eary JF. Nuclear medicine in cancer diagnosis. Lancet. 1999;354:853-7
6. Dimitrakopoulou-Strauss A, Strauss LG. PET imaging of prostate cancer with 11C-acetate. J Nucl Med. 2003;44:556-8
7. Zadra G, Photopoulos C, Loda M. The fat side of prostate cancer. Biochim Biophys Acta. 2013;1831:1518-32
8. Yang X, Qian K. Protein O-GlcNAcylation: emerging mechanisms and functions. Nat Rev Mol Cell Biol. 2017;18:452-65
9. Hanover JA, Krause MW, Love DC. Bittersweet memories: linking metabolism to epigenetics through O-GlcNAcylation. Nat Rev Mol Cell Biol. 2012;13:312-21
10. Fan Q, Norgaard RC, Bindesboll C, Lucas C, Dalen KT, Babaie E. et al. LXRalpha regulates hepatic ChREBPalpha activity and lipogenesis upon glucose, but not fructose feeding in mice. Nutrients. 2017:9
11. Kelly WG, Dahmus ME, Hart GW. RNA polymerase II is a glycoprotein. Modification of the COOH-terminal domain by O-GlcNAc. J Biol Chem. 1993;268:10416-24
12. Ranuncolo SM, Ghosh S, Hanover JA, Hart GW, Lewis BA. Evidence of the involvement of O-GlcNAc-modified human RNA polymerase II CTD in transcription in vitro and in vivo. J Biol Chem. 2012;287:23549-61
13. Resto M, Kim BH, Fernandez AG, Abraham BJ, Zhao K, Lewis BA. O-GlcNAcase is an RNA polymerase II elongation factor coupled to pausing factors SPT5 and TIF1beta. J Biol Chem. 2016;291:22703-13
14. Itkonen HM, Minner S, Guldvik IJ, Sandmann MJ, Tsourlakis MC, Berge V. et al. O-GlcNAc transferase integrates metabolic pathways to regulate the stability of c-MYC in human prostate cancer cells. Cancer research. 2013;73:5277-87
15. Caldwell SA, Jackson SR, Shahriari KS, Lynch TP, Sethi G, Walker S. et al. Nutrient sensor O-GlcNAc transferase regulates breast cancer tumorigenesis through targeting of the oncogenic transcription factor FoxM1. Oncogene. 2010;29:2831-42
16. Kamigaito T, Okaneya T, Kawakubo M, Shimojo H, Nishizawa O, Nakayama J. Overexpression of O-GlcNAc by prostate cancer cells is significantly associated with poor prognosis of patients. Prostate Cancer Prostatic Dis. 2014;17:18-22
17. Itkonen H, Mills IG. Chromatin binding by the androgen receptor in prostate cancer. Mol Cell Endocrinol. 2012;360:44-51
18. Mills IG. Maintaining and reprogramming genomic androgen receptor activity in prostate cancer. Nat Rev Cancer. 2014;14:187-98
19. Itkonen HM, Engedal N, Babaie E, Luhr M, Guldvik IJ, Minner S. et al. UAP1 is overexpressed in prostate cancer and is protective against inhibitors of N-linked glycosylation. Oncogene. 2015;34:3744-50
20. Itkonen HM, Mills IG. N-linked glycosylation supports cross-talk between receptor tyrosine kinases and androgen receptor. PloS one. 2013;8:e65016
21. Buren S, Gomes AL, Teijeiro A, Fawal MA, Yilmaz M, Tummala KS. et al. Regulation of OGT by URI in response to glucose confers c-MYC-dependent survival mechanisms. Cancer cell. 2016;30:290-307
22. Swamy M, Pathak S, Grzes KM, Damerow S, Sinclair LV, van Aalten DM. et al. Glucose and glutamine fuel protein O-GlcNAcylation to control T cell self-renewal and malignancy. Nat Immunol. 2016;17:712-20
23. Dejure FR, Eilers M. MYC and tumor metabolism: chicken and egg. EMBO J. 2017;36:3409-20
24. Amati B, Brooks MW, Levy N, Littlewood TD, Evan GI, Land H. Oncogenic activity of the c-Myc protein requires dimerization with Max. Cell. 1993;72:233-45
25. Prendergast GC, Ziff EB. Methylation-sensitive sequence-specific DNA binding by the c-Myc basic region. Science. 1991;251:186-9
26. Eilers M, Eisenman RN. Myc's broad reach. Genes Dev. 2008;22:2755-66
27. Lorenzin F, Benary U, Baluapuri A, Walz S, Jung LA, von Eyss B. et al. Different promoter affinities account for specificity in MYC-dependent gene regulation. eLife. 2016:5
28. Lin CY, Loven J, Rahl PB, Paranal RM, Burge CB, Bradner JE. et al. Transcriptional amplification in tumor cells with elevated c-Myc. Cell. 2012;151:56-67
29. Nie Z, Hu G, Wei G, Cui K, Yamane A, Resch W. et al. c-Myc is a universal amplifier of expressed genes in lymphocytes and embryonic stem cells. Cell. 2012;151:68-79
30. Itkonen HM, Gorad SS, Duveau DY, Martin SE, Barkovskaya A, Bathen TF. et al. Inhibition of O-GlcNAc transferase activity reprograms prostate cancer cell metabolism. Oncotarget. 2016;7:12464-76
31. Zeng Q, Zhao RX, Chen J, Li Y, Li XD, Liu XL. et al. O-linked GlcNAcylation elevated by HPV E6 mediates viral oncogenesis. Proc Natl Acad Sci U S A. 2016;113:9333-8
32. Barfeld SJ, Fazli L, Persson M, Marjavaara L, Urbanucci A, Kaukoniemi KM. et al. Myc-dependent purine biosynthesis affects nucleolar stress and therapy response in prostate cancer. Oncotarget. 2015;6:12587-602
33. Kazemi Z, Chang H, Haserodt S, McKen C, Zachara NE. O-linked beta-N-acetylglucosamine (O-GlcNAc) regulates stress-induced heat shock protein expression in a GSK-3beta-dependent manner. J Biol Chem. 2010;285:39096-107
34. Martin SES, Tan ZW, Itkonen HM, Duveau DY, Paulo JA, Janetzko J. et al. Structure-based evolution of low nanomolar O-GlcNAc transferase inhibitors. J Am Chem Soc. 2018;140(42):13542-13545
35. Feng J, Liu T, Zhang Y. Using MACS to identify peaks from ChIP-Seq data. Curr Protoc Bioinformatics. 2011 Chapter 2: Unit 2 14
36. Quinlan AR, Hall IM. BEDTools: a flexible suite of utilities for comparing genomic features. Bioinformatics. 2010;26:841-2
37. Urbanucci A, Barfeld SJ, Kytola V, Itkonen HM, Coleman IM, Vodak D. et al. Androgen receptor deregulation drives bromodomain-mediated chromatin alterations in prostate cancer. Cell Rep. 2017;19:2045-59
38. Pohl A, Beato M. bwtool: a tool for bigWig files. Bioinformatics. 2014;30:1618-9
39. Heinz S, Benner C, Spann N, Bertolino E, Lin YC, Laslo P. et al. Simple combinations of lineage-determining transcription factors prime cis-regulatory elements required for macrophage and B cell identities. Mol Cell. 2010;38:576-89
40. Patro R, Duggal G, Love MI, Irizarry RA, Kingsford C. Salmon provides fast and bias-aware quantification of transcript expression. Nat Methods. 2017;14:417-9
41. Kucukural A, Yukselen O, Ozata DM, Moore MJ, Garber M. DEBrowser: Interactive differential expression analysis and visualization tool for count data. bioRxivorg. 2018
42. Love MI, Huber W, Anders S. Moderated estimation of fold change and dispersion for RNA-seq data with DESeq2. Genome Biol. 2014;15:550
43. Mohammed H, Taylor C, Brown GD, Papachristou EK, Carroll JS, D'Santos CS. Rapid immunoprecipitation mass spectrometry of endogenous proteins (RIME) for analysis of chromatin complexes. Nat Protoc. 2016;11:316-26
44. Deplus R, Delatte B, Schwinn MK, Defrance M, Mendez J, Murphy N. et al. TET2 and TET3 regulate GlcNAcylation and H3K4 methylation through OGT and SET1/COMPASS. EMBO J. 2013;32:645-55
45. Hardiville S, Hart GW. Nutrient regulation of signaling, transcription, and cell physiology by O-GlcNAcylation. Cell Metab. 2014;20:208-13
46. Hnisz D, Abraham BJ, Lee TI, Lau A, Saint-Andre V, Sigova AA. et al. Super-enhancers in the control of cell identity and disease. Cell. 2013;155:934-47
47. Khan A, Zhang X. dbSUPER: a database of super-enhancers in mouse and human genome. Nucleic Acids Res. 2016;44:D164-71
48. Barfeld SJ, Urbanucci A, Itkonen HM, Fazli L, Hicks JL, Thiede B. et al. c-Myc antagonises the transcriptional activity of the androgen receptor in prostate cancer affecting key gene networks. EBioMedicine. 2017;18:83-93
49. Serandour AA, Brown GD, Cohen JD, Carroll JS. Development of an Illumina-based ChIP-exonuclease method provides insight into FoxA1-DNA binding properties. Genome Biol. 2013;14:R147
50. Thomas LR, Foshage AM, Weissmiller AM, Popay TM, Grieb BC, Qualls SJ. et al. Interaction of MYC with host cell factor-1 is mediated by the evolutionarily conserved Myc box IV motif. Oncogene. 2016;35:3613-8
51. Julien E, Herr W. Proteolytic processing is necessary to separate and ensure proper cell growth and cytokinesis functions of HCF-1. EMBO J. 2003;22:2360-9
52. Capotosti F, Guernier S, Lammers F, Waridel P, Cai Y, Jin J. et al. O-GlcNAc transferase catalyzes site-specific proteolysis of HCF-1. Cell. 2011;144:376-88
53. Jackson SP, Tjian R. O-glycosylation of eukaryotic transcription factors: implications for mechanisms of transcriptional regulation. Cell. 1988;55:125-33
54. Gartel AL, Ye X, Goufman E, Shianov P, Hay N, Najmabadi F. et al. Myc represses the p21(WAF1/CIP1) promoter and interacts with Sp1/Sp3. Proc Natl Acad Sci U S A. 2001;98:4510-5
55. Stelloo S, Nevedomskaya E, Kim Y, Hoekman L, Bleijerveld OB, Mirza T. et al. Endogenous androgen receptor proteomic profiling reveals genomic subcomplex involved in prostate tumorigenesis. Oncogene. 2018;37:313-22
56. Mariller C, Hardiville S, Hoedt E, Huvent I, Pina-Canseco S, Pierce A. Delta-lactoferrin, an intracellular lactoferrin isoform that acts as a transcription factor. Biochem Cell Biol. 2012;90:307-19
57. Bernard D, Pourtier-Manzanedo A, Gil J, Beach DH. Myc confers androgen-independent prostate cancer cell growth. J Clin Invest. 2003;112:1724-31
58. Ramos-Montoya A, Lamb AD, Russell R, Carroll T, Jurmeister S, Galeano-Dalmau N. et al. HES6 drives a critical AR transcriptional programme to induce castration-resistant prostate cancer through activation of an E2F1-mediated cell cycle network. EMBO Mol Med. 2014;6:651-61
59. Shafi R, Iyer SP, Ellies LG, O'Donnell N, Marek KW, Chui D. et al. The O-GlcNAc transferase gene resides on the X chromosome and is essential for embryonic stem cell viability and mouse ontogeny. Proc Natl Acad Sci U S A. 2000;97:5735-9
60. Levine ZG, Walker S. The biochemistry of O-GlcNAc transferase: which functions make it essential in mammalian cells? Annu Rev Biochem. 2016;85:631-57
61. Alejandro EU, Bozadjieva N, Kumusoglu D, Abdulhamid S, Levine H, Haataja L. et al. Disruption of O-linked N-acetylglucosamine signaling induces ER stress and beta cell failure. Cell Rep. 2015;13:2527-38
62. Lagerlof O, Slocomb JE, Hong I, Aponte Y, Blackshaw S, Hart GW. et al. The nutrient sensor OGT in PVN neurons regulates feeding. Science. 2016;351:1293-6
63. Krause MW, Love DC, Ghosh SK, Wang P, Yun S, Fukushige T. et al. Nutrient-driven O-GlcNAcylation at promoters impacts genome-wide RNA Pol II distribution. Front Endocrinol. 2018;9:521
64. Li MD, Ruan HB, Hughes ME, Lee JS, Singh JP, Jones SP. et al. O-GlcNAc signaling entrains the circadian clock by inhibiting BMAL1/CLOCK ubiquitination. Cell Metab. 2013;17:303-10
65. De Pergola G, Silvestris F. Obesity as a major risk factor for cancer. J Obes. 2013;2013:291546
66. Klil-Drori AJ, Azoulay L, Pollak MN. Cancer, obesity, diabetes, and antidiabetic drugs: is the fog clearing? Nat Rev Clin Oncol. 2017;14:85-99
67. DeBerardinis RJ, Lum JJ, Hatzivassiliou G, Thompson CB. The biology of cancer: metabolic reprogramming fuels cell growth and proliferation. Cell Metab. 2008;7:11-20
68. Pavlova NN, Thompson CB. The emerging hallmarks of cancer metabolism. Cell Metab. 2016;23:27-47
69. Onodera Y, Nam JM, Bissell MJ. Increased sugar uptake promotes oncogenesis via EPAC/RAP1 and O-GlcNAc pathways. J Clin Invest. 2014;124:367-84
70. Knudson AG Jr. Mutation and cancer: statistical study of retinoblastoma. Proc Natl Acad Sci U S A. 1971;68:820-3
71. Kaushik AK, Shojaie A, Panzitt K, Sonavane R, Venghatakrishnan H, Manikkam M. et al. Inhibition of the hexosamine biosynthetic pathway promotes castration-resistant prostate cancer. Nat Commun. 2016;7:11612
72. Labbe DP, Brown M. Transcriptional regulation in prostate cancer. Cold Spring Harb Perspect Med. 2018:8
73. Wang D, Garcia-Bassets I, Benner C, Li W, Su X, Zhou Y. et al. Reprogramming transcription by distinct classes of enhancers functionally defined by eRNA. Nature. 2011;474:390-4
74. Chae M, Danko CG, Kraus WL. groHMM: a computational tool for identifying unannotated and cell type-specific transcription units from global run-on sequencing data. BMC bioinformatics. 2015;16:222
75. Taylor BS, Schultz N, Hieronymus H, Gopalan A, Xiao Y, Carver BS. et al. Integrative genomic profiling of human prostate cancer. Cancer cell. 2010;18:11-22
76. Cerami E, Gao J, Dogrusoz U, Gross BE, Sumer SO, Aksoy BA. et al. The cBio cancer genomics portal: an open platform for exploring multidimensional cancer genomics data. Cancer Discov. 2012;2:401-4
77. Gao J, Aksoy BA, Dogrusoz U, Dresdner G, Gross B, Sumer SO. et al. Integrative analysis of complex cancer genomics and clinical profiles using the cBioPortal. Sci Signal. 2013;6:pl1
Author contact
![]() Corresponding authors: Harri M Itkonen; h.m.itkonencom. Department of Microbiology, Harvard Medical School, 4 Blackfan Circle, Boston, MA 02115, Phone: (617) 432-5498. Ian G. Mills; ian.millsox.ac.uk. Suzanne Walker; suzanne_walkerharvard.edu.
Corresponding authors: Harri M Itkonen; h.m.itkonencom. Department of Microbiology, Harvard Medical School, 4 Blackfan Circle, Boston, MA 02115, Phone: (617) 432-5498. Ian G. Mills; ian.millsox.ac.uk. Suzanne Walker; suzanne_walkerharvard.edu.
Citation styles
APA
Itkonen, H.M., Urbanucci, A., Martin, S.ES., Khan, A., Mathelier, A., Thiede, B., Walker, S., Mills, I.G. (2019). High OGT activity is essential for MYC-driven proliferation of prostate cancer cells. Theranostics, 9(8), 2183-2197. https://doi.org/10.7150/thno.30834.
ACS
Itkonen, H.M.; Urbanucci, A.; Martin, S.ES.; Khan, A.; Mathelier, A.; Thiede, B.; Walker, S.; Mills, I.G. High OGT activity is essential for MYC-driven proliferation of prostate cancer cells. Theranostics 2019, 9 (8), 2183-2197. DOI: 10.7150/thno.30834.
NLM
Itkonen HM, Urbanucci A, Martin SES, Khan A, Mathelier A, Thiede B, Walker S, Mills IG. High OGT activity is essential for MYC-driven proliferation of prostate cancer cells. Theranostics 2019; 9(8):2183-2197. doi:10.7150/thno.30834. https://www.thno.org/v09p2183.htm
CSE
Itkonen HM, Urbanucci A, Martin SES, Khan A, Mathelier A, Thiede B, Walker S, Mills IG. 2019. High OGT activity is essential for MYC-driven proliferation of prostate cancer cells. Theranostics. 9(8):2183-2197.
This is an open access article distributed under the terms of the Creative Commons Attribution (CC BY-NC) license (https://creativecommons.org/licenses/by-nc/4.0/). See http://ivyspring.com/terms for full terms and conditions.