Theranostics
13.3
Impact Factor
- Current Issue
- Advance Articles
- Volume 16; 2026
- Volume 15; 2025
- Volume 14; 2024
- Volume 13; 2023
- Volume 12; 2022
- Archive
- Cover Images
- Cover Suggestion
- Special Issues
Top
Introduction
Methods
Results
Discussion
Conclusions
Abbreviations
Acknowledgements
Supplementary Material
References
Introduction
Methods
Results
Discussion
Conclusions
Abbreviations
Acknowledgements
Supplementary Material
References
International Journal of Biological Sciences
International Journal of Medical Sciences
 Global reach, higher impact

Theranostics 2019; 9(5):1490-1509. doi:10.7150/thno.29546 This issue Cite
Research Paper
Drug Repositioning Inferred from E2F1-Coregulator Interactions Studies for the Prevention and Treatment of Metastatic Cancers
Deborah Goody1*, Shailendra K. Gupta2*, David Engelmann1, Alf Spitschak1, Stephan Marquardt1, Stefan Mikkat3, Claudia Meier1, Charlotte Hauser4, Jan-Paul Gundlach4, Jan-Hendrik Egberts4, Hubert Martin5, Toni Schumacher1, Anna Trauzold4, Olaf Wolkenhauer2, Stella Logotheti1, Brigitte M. Pützer1,6 ![]()
1. Institute of Experimental Gene Therapy and Cancer Research, Rostock University Medical Center, Rostock, Germany;
2. Department of Systems Biology and Bioinformatics, University of Rostock, Rostock, Germany;
3. Core Facility Proteomics, ZEMFO, Rostock University Medical Center, Rostock, Germany;
4. Institute for Experimental Cancer Research, Medical Faculty, CAU, Kiel, and Department of Surgery, UKSH, Campus Kiel, Kiel, Germany;
5. Department of Neuropathology, University Hospital Charité, Berlin, Germany;
6. Department Life, Light and Matter of the Interdisciplinary Faculty at Rostock University, Rostock, Germany.
*Equally contributing first authors
Received 2018-8-28; Accepted 2018-12-18; Published 2019-2-20
Citation:
Goody D, Gupta SK, Engelmann D, Spitschak A, Marquardt S, Mikkat S, Meier C, Hauser C, Gundlach JP, Egberts JH, Martin H, Schumacher T, Trauzold A, Wolkenhauer O, Logotheti S, Pützer BM. Drug Repositioning Inferred from E2F1-Coregulator Interactions Studies for the Prevention and Treatment of Metastatic Cancers. Theranostics 2019; 9(5):1490-1509. doi:10.7150/thno.29546. https://www.thno.org/v09p1490.htm
Other stylesAbstract

Metastasis management remains a long-standing challenge. High abundance of E2F1 triggers tumor progression by developing protein-protein interactions (PPI) with coregulators that enhance its potential to activate a network of prometastatic transcriptional targets.
Methods: To identify E2F1-coregulators, we integrated high-throughput Co-immunoprecipitation (IP)/mass spectometry, GST-pull-down assays, and structure modeling. Potential inhibitors of PPI discovered were found by bioinformatics-based pharmacophore modeling, and transcriptome profiling was conducted to screen for coregulated downstream targets. Expression and target gene regulation was validated using qRT-PCR, immunoblotting, chromatin IP, and luciferase assays. Finally, the impact of the E2F1-coregulator complex and its inhibiting drug on metastasis was investigated in vitro in different cancer entities and two mouse metastasis models.
Results: We unveiled that E2F1 forms coactivator complexes with metastasis-associated protein 1 (MTA1) which, in turn, is directly upregulated by E2F1. The E2F1:MTA1 complex potentiates hyaluronan synthase 2 (HAS2) expression, increases hyaluronan production and promotes cell motility. Disruption of this prometastatic E2F1:MTA1 interaction reduces hyaluronan synthesis and infiltration of tumor-associated macrophages in the tumor microenvironment, thereby suppressing metastasis. We further demonstrate that E2F1:MTA1 assembly is abrogated by small-molecule, FDA-approved drugs. Treatment of E2F1/MTA1-positive, highly aggressive, circulating melanoma cells and orthotopic pancreatic tumors with argatroban prevents metastasis and cancer relapses in vivo through perturbation of the E2F1:MTA1/HAS2 axis.
Conclusion: Our results propose argatroban as an innovative, E2F-coregulator-based, antimetastatic drug. Cancer patients with the infaust E2F1/MTA1/HAS2 signature will likely benefit from drug repositioning.
Keywords: metastasis, E2F1-coregulator, MTA1, pharmacophore modeling, drug repositioning
Introduction
Occurrence of metastasis indicates the terminal, incurable stage of cancer disease. Over 90% of cancer-related deaths are attributed to metastasis, rendering its management a still-unmet, major challenge in cancer therapeutics. Although a variety of effective agents for tumor growth control have been developed, there is no established antimetastatic drug [1]. A major reason for this shortfall is that, thus far, secondary tumors have been tackled similarly to primary tumors. It was not until recently that we came to realize that distinct gene expression patterns and niches of the metastatic tumors, neoangiogenesis and changes in tumor microenvironment (TME) can severely affect their drug responsiveness [1]. As long as the arsenal of antimetastatic drugs remains poor, metastases tend to be treated like a primary tumor, providing rather limited survival benefit [2]. Understanding the specific mechanisms governing disease progression will promote the development of therapies for metastasis prevention and management [3, 4].
The major transcription factor (TF) E2F1 is a critically important regulator of key events in the metastatic cascade across several cancer types [5, 6]. E2F1 is the archetypal member of the E2F family and a pivotal regulator of genes required for cell cycle progression, proliferation, and differentiation [7, 8]. Although, at the disease onset, E2F1 acts as a tumor suppressor and promotes apoptosis following DNA damage to block malignant transformation [9, 10], it switches to facilitate cancer progression at late stages [11]. We established that E2F1 can engage cells to a metastatic fate by inducing chemoresistance, angiogenesis, secondary site extravasation, and epithelial- mesenchymal transition (EMT) [10, 12-17]. High E2F1 levels correlate frequently with tumor aggressiveness and poor patient outcomes in several cancer types, including melanoma, bladder, breast, prostate, and small-cell lung carcinomas [18-22].
One possible explanation for this change in the behavior of E2F1 might, at least in part, be explained by the proposed concept of coregulators of TFs. According to this, DNA-binding TFs recruit coactivetors and corepressors to enhance or reduce their transcriptional activity on target gene promoters. Levels of these coregulators are critical for the TF function, since they can amplify or attenuate TF's effect on target genes. Thus, these interactions serve as molecular switches that link upstream signaling events to the downstream transcriptional programs [23]. During disease progression, levels of coregulators that are able to form complexes with several TFs are altered, thereby modulating their transcriptional activity towards an invasive outcome [23-25]. In line with this, it was recently shown that coactivators overexpressed in invasive cancer cells can direct E2F1 to enhance the transcription of metastasis-inducing genes [14, 16, 17]. Since disruption of these malignant associations might restore E2F1's 'bright-side' towards an anti-invasive outcome, characterization of the E2F1 coregulome emerges as a need in terms of developing novel therapies for targeted antimetastatic strategies against E2F1-driven aggressive tumors.
Following this concept, we employed a Co-IP-mass spectrometry (Co-IP/MS) approach to screen, in a high-throughput manner, for E2F1- coregulator interactions in metastatic cancer cells with translational value as antimetastatic therapies. We identified the hitherto unknown interaction partner MTA1, which, in E2F1-positive cancers, forms a complex that synergistically potentiates expression of prometastatic targets such as HAS2, thereby promoting an aggressive TME. Using a structure- based pharmacology approach and pharmacophore models, we found that argatroban, a small-molecule, FDA-approved drug currently used against heparin- induced thrombocytopenia, disrupts the E2F1:MTA1 interaction. Perturbation of the E2F1:MTA1 regulatory network by argatroban suffices to inhibit metastasis in vitro and in clinically relevant mouse models of metastasis. Based on this newly identified function, drug repositioning of argatroban offers new therapeutic applications for the prevention and treatment of metastatic cancers.
Methods
Cell lines and treatments
H1299 (lung), PC-3 and LNCaP (prostate), T24 and UMUC3 (bladder), and MDA-MB-231 (breast) cell lines were purchased from American Type Culture Collection (ATCC, Manassas, VA, USA). SK-Mel-29 and SK-Mel-147 (melanoma), PancTuI and Colo357 (pancreas) cell lines were described elsewhere [26]. Cells were cultured in RPMI or DMEM with 10% fetal calf serum. Stable PC-3.ER-E2F1 and H1299.ER-E2F1 cells, expressing E2F1 protein that is fused to the hormone-binding domain of the estrogen receptor (ER), were grown in medium containing 2 µg/ml and 0.25 µg/ml puromycin, respectively. The ER.E2F1 fusion protein was activated by treatment with 0.5 µM 4-hydroxytamoxifen (4-OHT). Transfections were performed using TurboFect (Thermo Scientific, Waltham, USA). E2F1, E132, E2F1-Flag, and MTA1 expression plasmids have been described previously [11, 27, 28]. All plasmids were confirmed by sequencing. Cells were treated with silibinin or argatroban (Sigma-Aldrich, Saint Louis, MO, USA) at a final concentration of 10 µM, 50 µM or 100 µM for 24 h.
Co-immunoprecipitation and mass spectrometry (Co-IP/MS)
For Co-IP, cells were prepared using Protein G Immunoprecipitation Kit (Roche, Basel, Switzerland). Cells were lysed and total cell lysates were incubated for 1 h with 4 µg of anti-Flag antibody (M2, Sigma-Aldrich, Saint Louis, MO, USA), anti-E2F1 (KH-95, Santa Cruz Biotechnology), or anti-mouse IgG antibody (Santa Cruz Biotechnology, Dallas, TX, USA). Protein G-Agarose beads were added and the immune complexes were precipitated overnight at 4 °C, under rotation. Beads were washed extensively with a washing buffer, boiled in SDS sample buffer, fractionated by SDS-PAGE, and immunoblotted using MTA1 (A-11, Santa Cruz Biotechnologies, Dallas, TX, USA), E2F1, and Flag antibodies. For UPLC-MS/MS analysis of potential E2F1 binding proteins, eluted Co-IP samples were resolved on SDS-PAGE (4-12% NuPAGE, Life Technologies, Carlsbad, CA, USA) and stained with colloidal coomassie. Gel sample lanes were cut into defined pieces, de-stained, and trypsinized. The resulting peptide solutions were extracted, subjected to UPLC-MS/MS (nano ACQUITY/SYNAPTG2 HDMSe, Waters, Milford, MA, USA), and analyzed using the PLGS software (ProteinLynx Global SERVER, Waters, Milford, MA, USA).
GST-pull-down
Experiments were performed as previously described [17]. Beads coated with GST or GST-E2F1 fusion proteins were incubated with equivalent amounts of lysates from MTA1-transfected cells, followed by IB with an anti-MTA1 antibody.
3D structure modeling, in silico protein-protein interaction and computational site-directed mutagenesis
Three-dimensional (3D) structure of MTA1 protein sequence (NCBI accession no.: NP_004680.2) was generated using iterative threading assembly refinement server (I-TASSER, Ann Arbor, MI, USA) [29, 30] by utilizing spatial information for ELM2- SANT domains from PDB ID: 3BKX [31] and, for the regions between amino acid residues 656 to 711, from PDB IDs: 4PBY and 4PC0 [32]. The best model predicted by I-TASSER server was further optimized for loops and side chains using Looper and ChiRotor tools [33, 34] in Biovia Discovery Studio 4.0 software suite (BIOVIA, San Diego, CA, USA) after assigning CHARMm force field. To remove any steric overlap in the model, a Smart Minimizer algorithm was used, which combines Steepest Descent methods followed by the Conjugate Gradient Method available in Biovia Discovery Studio 4.0. Potential interaction sites between E2F1, E2F2 and MTA1 proteins were predicted and refined using the Dock Protein (ZDOCK) and Refined protein (RDOCK) protocols available in Biovia Discovery Studio 4.0. For this purpose, the top 2,000 poses based on ZDOCK score were analyzed and clustered using all-against-all RMSD with an interface cut-off of 10 Å. From the top 100 clusters based on cluster density, interaction poses with the highest ZDOCK score were selected from each cluster. Further, the RDOCK protocol was used to refine these interaction poses by removing clashes and optimizing polar and charge interactions [35, 36]. Based on the RDOCK score, which represents the sum of ACE desolvation energy of the protein complex and the electrostatic energy after the second CHARMm minimization, a final list was obtained with a rearrangement of the previously selected 100 poses. The top 10 poses from this list were subsequently analyzed for amino acid residues that are involved in the E2F1:MTA1 interaction. To compare the affinity of MTA1 with E2F family members, the best models based on RDOCK scores for E2F1 and E2F2 were selected and analyzed using the PDBePISA web server (http://www.ebi.ac.uk/msd- srv/prot_int/pistart.html) [37], which assesses the macromolecular interfaces using structural and chemical properties of interfacing residues.
To investigate if the interacting amino acid residues between E2F1 and MTA1 have a role in complex stabilization, we performed computational site-directed mutagenesis experiments using the 'Calculate Mutation Energy (Binding)' protocol available in Biovia Discovery Studio 4.0. For this, we mutated amino acid residues one-by-one into alanine to estimate the impact of each mutation on the complex binding. The mutation binding energy is calculated as follows:
ΔΔGmut = ΔΔGbind(mutant) - ΔΔGbind(wild type),
where ΔΔGmut is the mutation energy and ΔΔGbind is the difference in the free energy of the complex and unbound state. Mutations were characterized as destabilizing (ΔΔGmut > 0.5 Kcal/mol), stabilizing (ΔΔGmut > -0.5 Kcal/mol) and neutral (-0.5 ≤ ΔΔGmut ≤ 0.5 Kcal/mol).
Pharmacophore modeling and in silico screening of drug library
The Structure-Based Pharmacophore (SBP) method is based on the selection of chemical features present in the active site of a protein to screen compounds from chemical libraries that are likely to bind within that site [38, 39]. We used the 'Common Feature Pharmacophore Generation' protocol of Biovia Discovery Studio 4.0 to generate 3D pharmacophore models by considering crucial interaction patterns between MTA1 and E2F1 amino acid residues for the top 10 interaction poses which were selected based on RDOCK score. The best pharmacophore model selected in this way contains six pharmacophore features with two hydrogen bond acceptors, two hydrogen bond donors, and two hydrophobic groups. In order to increase the selectivity, we also included the 'excluded volume constrains' to the best selected pharmacophore model to highlight potentially forbidden sites for the drug molecules during the screening process. We were interested in identifying potential disruptors that prevent MTA1 from interacting with E2F1. For this, we used ZINC database subset 'Zdd', which is a collection of 2,924 commercially available, FDA- approved drugs/nutraceuticals in use for humans for the construction of virtual ligand library. The screened ligands were arranged in a decreasing order of their FIT score, which is a measure of how well the ligand fits the pharmacophore. In order to further confirm the interactions of screened drugs/ nutraceuticals with MTA1, we performed controlled molecular docking studies of demeclocycline and argatroban within the potential binding site of MTA1 associated in the interaction with E2F1. For this, we used the CDOCKER protocol of Biovia Discovery Studio 4.0, which is a grid-based molecular docking method, to dock ligands into the receptor active site [40].
Viral vectors
Lentiviral plasmids (pLKO.1-puro) encoding sh.E2F1 (clone ID: TRCN253), sh.MTA1 (clone ID: TRCN97), and sh.control (sh.ctrl; SHC002 and SHC202, respectively) were purchased from Sigma- Aldrich (Saint Louis, MO, USA). VSV-G enveloped pseudotyped lentiviral vectors were generated in HEK293T (ATCC, Manassas, VA, USA) packaging cells by cotransfection of pLKO.1 plasmid containing shRNA sequences with pAX2 and VSV-G/pMD2.G (Addgene, Watertown, MA, USA) by the calcium phosphate method [41].
Semi-quantitative and qRT-PCR
Total RNA isolation, semi-quantitative PCR, and quantitative RT-PCR were performed as previously described [17]. Primer sequences were as follows: E2F1-F, 5'-GCTGGACCACCTGATGAATATCT-3'; E2F1-R, 5'-GGAGGGGCTTTGATCACCATAA-3'; MTA1-F, 5'-TTGATGCCCAGTAGGGGTCT-3'; MTA1-R, 5'-GTAGAACACGTCATCCGGGG-3'; HAS2-F, 5'-GACTGAAGTGCAACGGAAAC-3'; HAS2-R, 5'-ACAATGCATCTTGTTCAGCTCT-3'; HAS3-F, 5'-CTGCCTTGGCTTTCGGGA-3'; Actin-F, 5'-CGGGAAATCGTGCGTGACATTA-3'; Actin-R, 5'-ACCGCTCATTGCCAATGGTGAT-3'.
Promoter reporter constructs and luciferase reporter assay
MTA1 promoter luciferase construct was obtained by generating a DNA fragment containing the region -270 to -116 base pairs (bps) from human genomic DNA using PCR-primer MTA1-P-F, 5'-AGGGATCACCAGGGAAATGGC-3' and MTA1-P-R, 5'-CCTTCCCGGACAGTTCCTCT-3'. The amplimer was subcloned into pcDNA3.1, digested with KpnI/XhoI and ligated into pGL3-basic reporter plasmid. Similarly, the HAS2 promoter (-724 to -196 bps) plasmid was produced. Using the primer pair HAS2-P-F, 5'-CAGGCCGGTTCTAAACTCCAATGA- 3'; HAS2-P-R, 5'-GCGCGCTGTTTGAGTATGTTTACG-3' a DNA fragment was amplified and subsequently cloned into pGL3-basic. All plasmids were sequenced to verify sequence integrity. Luciferase activity was measured 24 h after cotransfection using a Luciferase Reporter Assay System (Promega, Madison, WI, USA). Values were normalized to total protein concentrations in cell extracts.
Chromatin immunoprecipitation
ChIP assays were performed essentially as described [11]. Protein-DNA complexes were immunoprecipitated using the anti-E2F1 antibody KH-95 or control IgG. Input represents 10% of sheared chromatin prior to immunoprecipitation. Primer sequences were: MTA1-P-F, 5'-AGGGATCACCAGGGAAATGGC-3'; MTA1-P-R, 5'-CCTTCCCGGACAGTTCCTCT-3'; HAS2-P-F, 5'-CAGGCCGGTTCTAAACTCCAATGA-3'; HAS2-P-R, 5'-GCGCGCTGTTTGAGTATGTTTACG-3; BIRC-5-F, 5'-CGCCTCTACTCCCAGAAG-3' and BIRC-5-R, 5'-TGTAGAGATGCGGTGGTC-3'.
Invasion and migration assay
Cell invasion and motility assays were conducted as described previously [16].
Cell viability assay
For XTT assays (Trevigene Inc., Gaithersburg, MD), 1x 10⁵ SK-Mel-147 and 8x10⁴ PC-3 cells were seeded in 12-well plates and supplemented with different concentrations of demeclocycline, argatroban or silibinin. Cells were incubated with TACS XTT labeling mixture for 2 h and supernatants of the cells were pipetted into 96-well plates. The conversion of XTT to formazan was quantified by measuring the spectral absorbance at 490 nm. Cell viability was measured every 24 h for 2 days.
Survival studies
Overall survival curves were analyzed by SigmaPlot (Systat Software, San Jose, CA, USA) according to the Kaplan-Meier method using the log-rank test. Prostate, pancreas, melanoma and Pan-Cancer data were retrieved from The Cancer Genome Atlas (TCGA) database and separated according to the median values of either E2F1, MTA1, and HAS2 mRNA levels or combinations thereof, using the Xena cancer browser (https://xena.ucsc. edu/).
Microarrays
Cells stably expressing sh.ctrl or sh.E2F1 and sh.MTA1 after lentiviral transduction were harvested 96 h post-transduction, while PC-3 cells treated with either 100 µM argatroban or DMSO were harvested after 24 h. Following RNA isolation, equal RNA amounts were analyzed using AffymetrixGeneChip Human Transcriptome 2.0 Arrays (Affymetrix, Santa Clara, CA, USA) in duplicate for each sample. Background-corrected signal intensities were determined, processed, and normalized using the Transcriptome Analysis Console and SST and RMA algorithms (TAC, Affymetrix, Santa Clara, CA, USA). Gene transcripts not detected in any samples were excluded from statistical analysis. Genes differentially regulated by knockdown of E2F1 or MTA1 were isolated. Downregulated (≤ -2 fold) E2F1 and (≤ -1.5 fold) MTA1 targets were further analyzed using the DAVID Tool enrichment analysis (https://david.ncif crf.gov/content.jsp?file=citation.htm). Target genes with putative E2F1 binding sites were considered for further analysis. These genes were ranked based on the weighted sum of their fold changes using the ratio of median log2 fold change of the targets in the shE2F1 versus shMTA1 array and were functionally characterized according to Gene Ontology (GO) terms.
ELISA
1x10⁵ cells were seeded in 48-well plates and incubated for 24 h under appropriate treatments (argatroban addition or sh.E2F1, sh.MTA1 or sh.ctrl). Culture supernatants were collected and quantification of hyaluronic acid was performed by the enzyme- linked sandwich assay Hyaluronan DuoSet ELISA (R&D Systems, Minneapolis, MN, USA) following the manufacturer's instructions.
Animal studies
To analyze drug efficiency in a melanoma metastasis model in vivo, 3×10⁶ tumor cells, stably transduced with sh.ctrl, sh.E2F1, sh.MTA1 or pretreated with 100 µM argatroban (for 24 h), were injected intravenously (i.v.) into the tail vein of 6-week-old male athymic NMRI nude mice (Charles River, Sulzfeld, Germany). Argatroban was administered intraperitoneally (i.p). at a dose of 9 mg/kg body weight every other day over 4 weeks. Finally, lung tissue was surgically excised, fixed in 4% paraformaldehyde, paraffin-embedded, and processsed for histological analysis with hematoxylin and eosin (H&E) staining. For quantification of pulmonary metastasis, the relative area of tumors was expressed as a percentage of the total lung area and calculated using ImageJ program.
For the clinically adapted orthotopic pancreatic ductal adenocarcinoma (PDAC) xenotransplantation model, four-week-old female SCID beige mice were obtained from Charles River and two experimental settings were employed. In the first approach, 1x10⁶ PancTuI cells, stably transfected with control sh.RNA, sh.RNA against E2F1, or sh.RNA against MTA1, were inoculated orthotopically into the pancreas. All mice (12 animals per group) developed primary tumors and were subjected to re-laparotomy fifteen days later by subtotal resection of the tumor-bearing pancreas, as described previously [42, 43]. Two mice, one from sh.E2F1- and one from sh.MTA1-group, died due to complications after tumor resection, while the remaining animals recovered well. On day 31 post tumor-cell inoculation, all mice were sacrificed and organs as well as tumors were preserved and examined. In the second round, wild-type 1x10⁶ PancTuI cells were injected orthotopically and the primary tumors were resected thirteen days later as described above. Three days post-resection, mice were randomly assigned into two groups (n = 11 each). Mice of one group were treated i.p. with argatroban (9 mg/kg body weight/day), while control mice received 0.9% saline (125 µl). Animals were sacrificed 31 days post-inoculation; organs and tumors were preserved and examined. All animal experiments were performed according to ethical standards, in compliance with the local authorities (V312-7224.121 (75-5/12)).
Western blotting, immunohistochemistry and immunofluorescence
Protein detection was performed as described [17] using antibodies KH-95 against E2F1, A-11 for MTA1 detection, TBP (Abcam, Cambridge, UK), HAS2 (ab140671, Abcam), β-actin (AC-74, Sigma- Aldrich, Saint Louis, MO, USA), and CD206 (ab64693, Abcam). Immunofluorescence staining of slides was conducted with Alexa Fluor 488 (Invitrogen, Carlsbad, CA, USA) and DAPI (5 mg/mL). Images were obtained using an inverted confocal laser scanning microscope (ELYRA PS.1, Zeiss, Oberkochen, Germany).
Statistical analysis
All quantitative values were expressed as mean ± standard deviation (SD). For in vitro assays, SigmaPlot (Systat Software, San Jose, CA, USA) was used to determine statistics, performing 2-tailed Student's t-test. For Kaplan-Meier analyses, significance was estimated using the log-rank test. For the melanoma mouse model and the orthotopic mouse model, statistical significance was evaluated with 2-tailed Student's t-test and Mann-Whitney test, respectively. P-values less than 0.05 were considered significant.
Results
E2F1 physically interacts with MTA1
To identify the complexome of E2F1, we prepared cellular extracts from melanoma cells expressing endogenously high amounts of E2F1 [11], and performed immunoprecipitation with anti-E2F1 or control IgG antibodies (Figure 1A). Precipitates were separated, in-gel digested, and subjected to liquid chromatography followed by mass spectrumetry. Unspecific IgG precipitates were excluded from further analysis. In the group of proteins co-purified with E2F1, we found classical interacting partners such as RB and DP-1, together with MTA1, which, thus far, has never been described as an E2F1 interacting partner (Figure 1A, right). MTA1 is upregulated in most malignant cancers and induces cell transformation, DNA repair, and EMT, acting either as corepressor or coactivator of TFs [44]. As shown in Figure 1B, MTA1 co-localizes with E2F1 in the nucleus of the SK-Mel-147 cell line. The in vivo interaction of both proteins was validated in tumor cells overexpressing E2F1-Flag by co-immunoprecipitation with Flag-antibody and subsequent immunoblotting (IB) using antibody against MTA1 (Figure 1C), as well as through GST-pull-down experiments with whole-cell lysates from SK-Mel-147 and PC-3 cells (Figure 1D).
Next, the interaction sites between E2F1 and MTA1 were identified through computational protein-protein interaction (PPI) analysis. For this purpose, we used our previously designed three- dimensional (3D) model of E2F1 [16] and a newly designed, optimized 3D-model of MTA1 using iterative threading assembly refinement (I-TASSER) server [29, 30]. PPIs between E2F1 and MTA1 were predicted using the ZDOCK and RDOCK algorithms [35, 36] with the best interacting pose demonstrated in Figure 1E (amino acid residues involved in PPI are shown in Table S1). MTA1 is predicted to interact with E2F1 through a vast portion of its BAH-, ELM2-, and SANT-domains. Moreover, dimerization and transactivation domains of E2F1 are very important for MTA1 interaction. Additionally, to evaluate if there is a preference of MTA1 for E2F1, we estimated the binding affinity of MTA1 for other members of the E2F family. For this purpose, we generated the E2F2 structure and predicted the best interaction pose with MTA1 (Figure S1). Solvation energies from the complex formation (ΔGs) indicated a higher binding affinity of MTA1 for E2F1 than E2F2 (E2F1: ΔGs = -7.0 kcal/mol versus E2F2: ΔGs = +1.1 kcal/mol). Hence, we focused on the E2F1:MTA1 interaction. The binding interfaces between E2F1:MTA1 were further confirmed via computational, site-directed mutagenesis experiments. Interacting residues at the best binding pose of E2F1 and MTA1 (Table S1) were mutated one-by-one into alanine. After each mutation, we calculated the mutation binding energy of the complex (Tables S2-S3). All residues that, upon mutation, either destabilize or stabilize the complex were considered as active players of the E2F1:MTA1 interaction.
MTA1 is a direct E2F1 transcriptional target
Binding partners of E2F1 can, at the same time, be E2F1 transcriptional targets [14, 16, 17]. With this in mind, we examined if E2F1 regulates MTA1 expression. Depletion of E2F1 across several E2F1-expressing cancer cell lines using specific shRNA severely impaired both transcript and protein levels of MTA1 (Figure 2A). Conversely, MTA1 expression was substantially upregulated upon E2F1 overexpression or 4-OHT-mediated activation in stable ER-E2F1 cell lines (Figure 2B). Additionally, immunofluorescence of E2F1 and MTA1 in H1299.ER-E2F1 and PC-3.ER- E2F1 cells following 4-OHT treatment showed enhanced MTA1 staining and nuclear co-localization (Figure 2C, left panels). The protein levels of MTA1 increased in the nuclear fraction of E2F1-activated cells (Figure 2C, right panels).
Since MTA1 expression is E2F1-dependent, we examined if MTA1 is a direct transcriptional target of E2F1. Bioinformatic analysis of the MTA1 promoter predicted one putative binding motif for E2F1. ChIP assays revealed that E2F1 is recruited to this promoter region (-270 to -116 bps) of MTA1 upon E2F1 expression (Figure 2D). The MTA1 promoter region comprising the E2F1-binding site was cloned into a pGL3-luciferase reporter construct. Cotransfection of this construct with expression plasmids encoding either wild-type E2F1 or an E2F1 mutant deficient for DNA-binding (E132) in H1299, SK-Mel-29, and LNCaP cells demonstrated that the MTA1 promoter is activated through E2F1 in a dose-dependent manner. In contrast, no significant promoter upregulation was noticed in response to the E2F1 mutant or empty vector (ctrl) (Figure 2E).
The E2F1:MTA1 complex promotes cancer cell invasion
The fact that E2F1 and MTA1 are co-elevated in invasive cancer cell lines versus non-invasive ones (Figure S2) provides hints that the E2F1:MTA1 complex might mediate the invasive potential of tumor cells. To monitor the effect of this complex in cancer cell motility, we separately depleted E2F1 or MTA1 in highly invasive PC-3, SK-Mel-147, and PancTuI cells by transducing them with a lentiviral vector expressing sh.E2F1 or sh.MTA1, and performed Matrigel assays. Knockdown of E2F1 led to a decrease of MTA1 in these cell lines and significantly reduced their migratory/invasive capacity (Figure 3A). Cell invasiveness was also severely impaired when MTA1 was completely abrogated, while high E2F1 levels remained unchanged (Figure 3B). Notably, neither E2F1 nor MTA1 knockdown affected proliferation in the aforementioned cells (Figure S3). In addition, invasive growth, induced by E2F1 overexpression in initially less aggressive cells such as LNCaP, was strongly reduced upon MTA1 ablation (Figure 3C). These results demonstrate that the pro-invasive potential of E2F1 greatly depends on its physical interaction with MTA1. To investigate the clinical relevance of this finding, we performed Kaplan-Meier analyses of RNA-Seq data from TCGA cohorts in patients with malignant melanoma, prostate, and pancreatic carcinoma, as well as the Pan-Cancer data which include 36 different cancer subtypes. High E2F1 levels alone are consistently associated with poor outcomes, while MTA1 levels alone are associated with survival in a cancer type-dependent manner (Figure S4). Nevertheless, high co-expression levels of E2F1 and MTA1 significantly and consistently correlate with poor overall survival across all cancer types tested (Figure 3D-E and Figure S4). In summary, our data show that E2F1 abundancy is a prerequisite for a negative prognostic value of MTA1, and the latter facilitates E2F1's oncogenic function, indicating its ability to cooperate with E2F1 towards favoring tumor invasion.
Figure 1
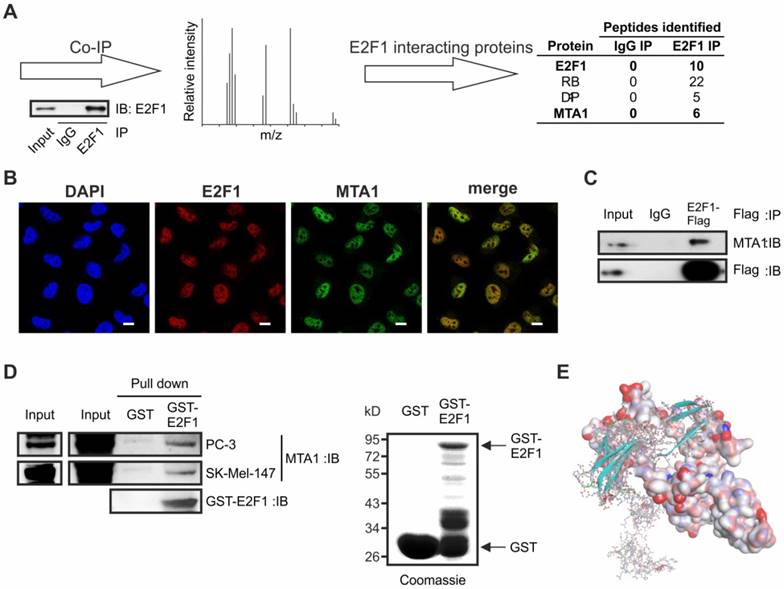
E2F1 interacts physically with MTA1 in cancer cells. (A) Schematic workflow of Co-IP/MS. Extracts from SK-Mel-147 cells were co-immunopurified with E2F1 or control IgG, separated and stained. The protein bands were analyzed by high-throughput mass spectrometry. E2F1-specific binding proteins were listed, after exclusion of IgG-unspecific binding proteins. (B) Immunofluorescence showing nuclear co-localization of endogenous E2F1 (red) and MTA1 (green) in SK-Mel-147 cells. Nuclei were counter-stained with DAPI (blue). Scale bar: 10 µm. (C) SK-Mel-147 cell lysates overexpressing E2F1-Flag were immunoprecipitated (IP) with anti-Flag antibody and immunocomplexes were blotted with anti-MTA1 and anti-Flag. (D) GST-pull-down of lysates of PC-3 and SK-Mel-147 overexpressing MTA1 against GST-E2F1 fusion protein or GST alone (control), followed by IB for MTA1. Input represents 10% of the protein amount used in the assays. (E) In silico prediction of E2F1 and MTA1 protein interaction indicates optimized protein structure of E2F1 with soft surface and MTA1 as a ball-and-stick structure.
Figure 2
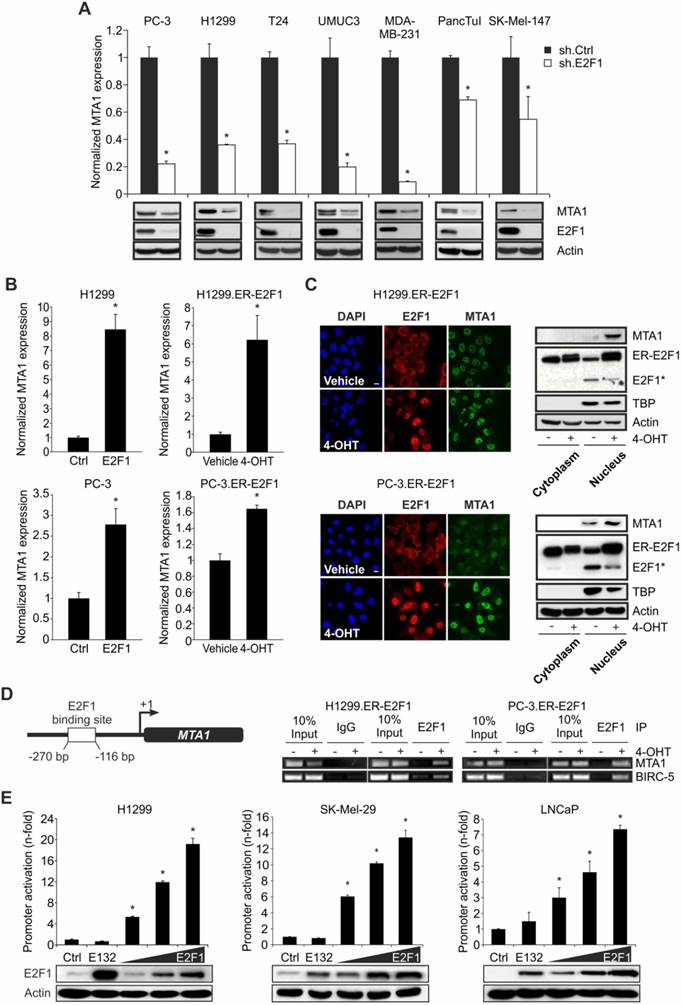
E2F1 regulates MTA1 expression. (A) qRT-PCR and IB of MTA1 following E2F1 knockdown in PC-3, H1299, T24, UMUC3, MDA-MB-231, PancTuI and SK-Mel-147 cells. (B) qRT-PCR of MTA1 following E2F1 overexpression or activation of ER-E2F1 in H1299 (top) and PC-3 cells (bottom). (C) Left panel: Immunofluorescence showing nuclear localization of MTA1 (green) and E2F1 (red) in H1299.ER-E2F1 (top) and PC-3.ER-E2F1 (bottom) after 4-OHT induction. Nuclei were counter-stained with DAPI (blue). Right panel: IB of nuclear and cytoplasmic fractions of H1299.ER-E2F1 and PC-3.ER-E2F1 cells following 4-OHT treatment. TATA-Box binding protein (TBP) is shown as positive control for nuclear fraction. Asterisk (*) depicts the endogenous E2F1 levels. Scale bar: 10 µm. (D) Scheme of the MTA1 promoter with the predicted E2F1 binding site (left) and ChIP assay (right) in H1299.ER-E2F1 and PC-3.ER-E2F1 cells showing E2F1 binding to the MTA1 promoter. BIRC-5 was used as a positive control. (E) Relative luciferase activities after cotransfection of MTA1 promoter construct with increasing amounts (1, 2 and 3 µg) of wild-type or mutant (E132) E2F1 in depicted cell lines. E2F1 expression was confirmed by IB. Actin was used as a loading control. Bar graphs are represented as means ± SD of three independent experiments (2-tailed Student's t-test, *p< 0.05). Fold changes were calculated relative to controls (set as 1).
Figure 3
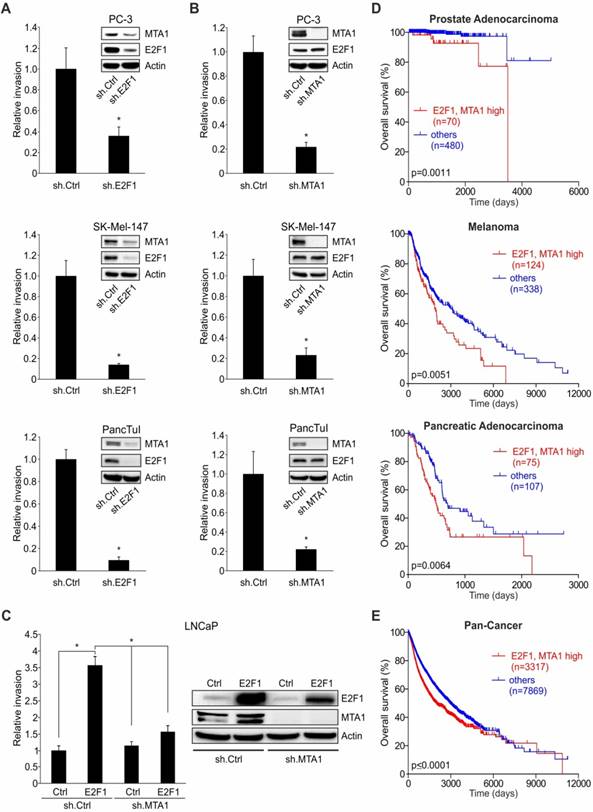
E2F1 and MTA1 induce cancer cell invasion and correlate with poor patient prognosis. (A, B) Cell invasion assays in PC-3, SK-Mel-147 and PancTuI cells with sh.RNA-mediated knockdown of (A) E2F1 or (B) MTA1. (C) Cell invasion assays in LNCaP cells which were first transduced with a lentiviral vector expressing sh.MTA1 and then transfected with E2F1 plasmid. E2F1 and MTA1 protein levels were monitored by IB using actin as loading control. Data shown are means ± SD of 3 independent experiments; 2-tailed Student's t-test, *p< 0.05. (D, E) Correlation of E2F1 and MTA1 co-expression with patient survival in prostate adenocarcinoma (top), melanoma (middle) and pancreatic adenocarcinoma (bottom) (D) and Pan-Cancer cohort (E) using the UCSC Xena browser. Overall survival curves of Kaplan-Meier analyses indicate that patients (n) with combined high E2F1 and MTA1 transcript levels (red) had significantly poorer overall survival than all other patients (blue). Log-rank test p-values are depicted on the survival curves.
MTA1:E2F1 complex mediates invasion via transcriptional coregulation of hyaluronan synthase 2
E2F1 has been shown to transactivate coregulators, which in turn physically associate with E2F1 to synergistically regulate genes essential to angiogenesis, extracellular matrix (ECM) remodeling, tumor cell survival, and interactions with vascular endothelial cells [14, 16, 17], thereby creating feedforward loops among E2F1, the coregulator, and common downstream targets. Therefore, we examined whether MTA1 and E2F1 follow this pattern, also creating feedforward loops with prometastatic genes. In search for putative genes that may be coregulated by an E2F1:MTA1 complex, we performed whole transcriptome analysis in E2F1- and MTA1-depleted PC-3 cells to screen for commonly affected transcripts. Differentially expressed transcripts affected by both proteins could be putatively subjected to an E2F1:MTA1 coregulation (Figure 4A, left). Using the DAVID Tool enrichment analysis, the list of targets commonly downregulated by E2F1 and MTA1 was further narrowed down to 24 candidates that have putative E2F1 binding sites. GO analysis indicated that these candidates are, among others, involved in pathways of cell migration (Figure 4A, right). From those potential candidates, HAS2 showed one of the highest fold changes based on ranking their weighted sum of fold changes using the ratio of median log2 fold change of the targets in the shE2F1 versus shMTA1 microarray. HAS2 was also clustered with potential E2F1/MTA1 coregulated targets with an implication in extracellular matrix organization and cell invasion (Figure 4A, right, Table S4). In support, HAS2 levels were co-elevated along with E2F1 and MTA1 levels in metastatic melanoma [45], prostate [46], and pancreatic tumors [47] versus their respective primary tumors, as revealed by the Oncomine™ platform analysis (Figure 4B). In agreement, an increment of HAS2 mRNA transcripts was also significantly correlated with high co-expression of E2F1 and MTA1 in the Pan-Cancer cohort (p=2.296 × 10⁻²⁶), implying that the correlation of high E2F1:MTA1 levels with elevated HAS2 levels is a common denominator across several cancer types. Notably, HAS2 is known to promote tumor progression [48-50] and also to regulate production of hyaluronic acid (or hyaluronan/HA), a main component of the ECM which is accumulated in the TME of many cancers [51, 52]. Indeed, Pan-Cancer data analysis confirmed that HAS2 is an indicator of poor prognosis across a wide range of cancer types (Figure S5A). Based on these data, HAS2 emerged as a representative target for evaluating the transcriptional activity of the prometastatic E2F1:MTA1 complex. As shown in Figure 4B, HAS2 mRNA considerably decreased in PC-3 cells upon E2F1 or MTA1 inhibition. Conversely, overexpression of E2F1 resulted in the upregulation of HAS2 transcripts (Figure 4C, left panel). Importantly, this increase of HAS2 in response to E2F1 addition was seen only in the presence of MTA1 and abolished after treatment with sh.MTA1 (Figure 4C, right panel). Notably, the expression of HAS3 was not altered, neither by knockdown of each individual complex protein nor by overexpression of E2F1 (Figure 4B-C), confirming the specificity of the E2F1:MTA1 complex for HAS2.
HAS2 promoter analysis in the UCSC genome browser predicted a putative E2F1 binding site at position -593 to -582 bps upstream to the transcription start site. ChIP experiments showed a strong binding of E2F1 to this HAS2 promoter region upon 4-OHT addition to inducible PC-3.ER-E2F1 cells that led to the upregulation of HAS2 levels (Figure 4D). The HAS2 promoter, containing the E2F1 binding site, was cloned into the pGL3-luciferase reporter construct and transiently co-transfected with expression plasmids for E2F1, MTA1 or both. Although E2F1 or MTA1 expression significantly increased luciferase activity in PC-3 cells, a much stronger and up to 45-fold upregulation of reporter activity was observed when both interacting proteins were co-expressed (Figure 4E, left panel). Similar results were obtained for SK-Mel-29 cells (Figure 4E, right panel), demonstrating a cooperative effect of MTA1 and E2F1 on the activation of the HAS2 promoter in a cell-context-independent manner. Conversely, when endogenous levels of E2F1, MTA1 or both were depleted through transfection of SK-Mel-147 cells with sh.E2F1- and sh.MTA1-expressing plasmids, HAS2 levels significantly decreased with the most potent reduction achieved upon simultaneous knockdown of both proteins (Figure 4F, right panel). Accordingly, this was accompanied by a drastic reduction of their invasive capacity, with the strongest decline of invasiveness and loss of HAS2 expression observed in cells lacking the transcription factor plus its coregulator (Figure 4F, left panel). Consistent with HAS2 downregulation, the levels of HA released by melanoma cells stably expressing sh.E2F1 and sh.MTA1 were reduced, as measured by ELISA in conditioned media (Figure 4G). Together, these results demonstrate that MTA1 cooperates with E2F1 to potentiate transcriptional activity on the HAS2 target gene promoter, thereby leading to increased HA production and increased invasiveness. Moreover, high co-expression of E2F1, MTA1, and HAS2 is associated with poor survival in melanoma patients (Figure 4I). Due to the small number of patients for prostate and pancreatic cancer when grouping together all three factors, we were unable to calculate a statistically significant prognosis (Figure S5B). Analyzing the Pan-Cancer cohort, we bypassed this limitation and observed that, compared to high E2F1 and MTA1 alone (Figure 4J, black), an increased HAS2 expression worsened the prognosis (Figure 4J, red), whereas patients with low HAS2 levels showed higher survival rates (Figure 4J, cyan). Additionally, the expression levels of E2F1, MTA1, and HAS2 correlate with each other in the Pan-Cancer cohort (E2F1:MTA1: ρ=0.2745, E2F1:HAS2: ρ=0.1651, MTA1:HAS2: ρ=0.07137). In summary, E2F1, MTA1, and HAS2 create an axis that promotes aggressiveness through HA upregulation. In line with our expression profiling data, a high E2F1/MTA1/HAS2 signature is prognostic for poor overall survival across a wide range of cancer types.
Figure 4
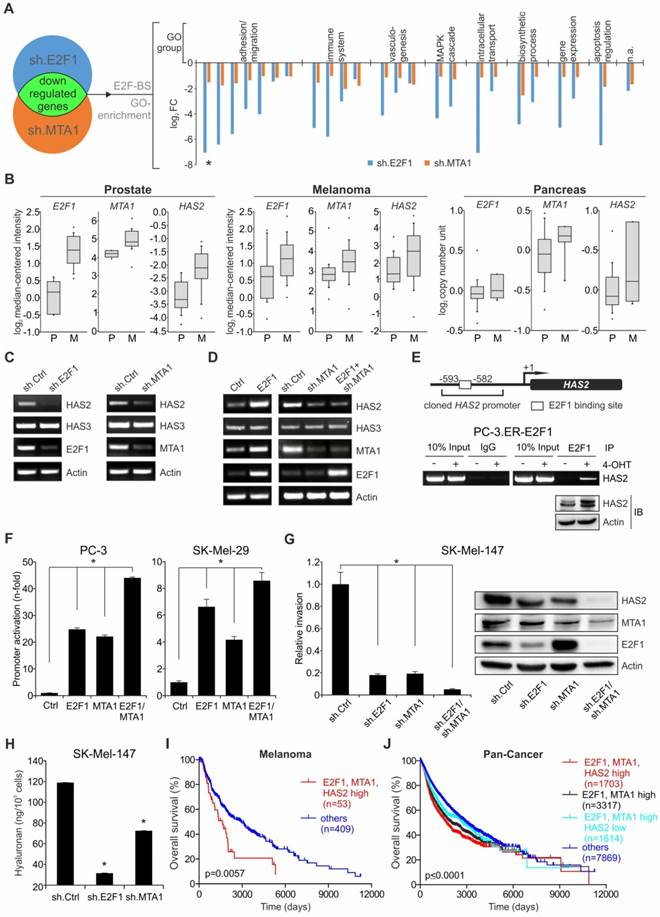
The E2F1:MTA1 complex induces HAS2 expression to promote a malignant phenotype. (A) A scheme for array-based prediction of common targets of E2F1 and MTA1. Downregulated genes were analyzed for E2F-binding sites (E2F-BS) and categorized into GO-term based subgroups. A pair of bars represents one target gene (a ranked list of those genes based on weighted sum of their fold changes in both microarrays is given as Supplemental Table S4). The asterisk (*) marks HAS2. (B) Association of E2F1, MTA1, and HAS2 levels with the metastatic potential of prostate (P: n=10, M: n=21), melanoma (P: n=16, M: n=40) and pancreatic cancer (P: n=22, M: n=6); obtained from the Oncomine™ database. In each graph, the solid lines within the boxes represent the median value and boxes show the 25th to 75th percentile range. Bars represent 90% confidence intervals with circles representing outliers. P: primary tumor; M: metastasis. (C) Semi-quantitative RT-PCR for HAS2 and HAS3 mRNA in PC-3 cells with knockdown of E2F1 (sh.E2F1) or MTA1 (sh.MTA1). (D) Semi-quantitative RT-PCR for HAS2 and HAS3 mRNA in PC-3 cells with E2F1 overexpression (left) or E2F1 overexpression plus MTA1 knockdown (sh.MTA1) (right). (E) A scheme of putative E2F1 binding site on the HAS2 promoter (top). ChIP assay in PC-3.ER-E2F1 cells (bottom). IB for HAS2 in PC-3.ER-E2F1 cells upon 4-OHT induction. (F) Relative luciferase activities after cotransfection of HAS2 promoter construct with E2F1, MTA1, or E2F1 and MTA1 expression plasmids in depicted cells. (G) Relative cell invasion in SK-Mel-147 cells with knockdown for E2F1 (sh.E2F1), MTA1 (sh.MTA1), or both. Corresponding protein levels of HAS2 after E2F1 and MTA1 knockdown were monitored by IB, using actin as loading control. (H) ELISA for HA release on cell culture supernatants of SK-Mel-147 stably transduced with either sh.E2F1 or sh.MTA1. (I, J) Kaplan-Meier analyses of (I) melanoma patients and (J) the Pan-Cancer cohort showing that patients with high E2F1/MTA1 (black) split into a subgroup with high HAS2 (red) and one with low HAS2 levels (cyan), versus all other patients (blue). Log-rank test p-values are depicted on the survival curves. Bar graphs represent means ± SD of three independent experiments; 2-tailed Student's t-test, *p< 0.05.
Figure 5
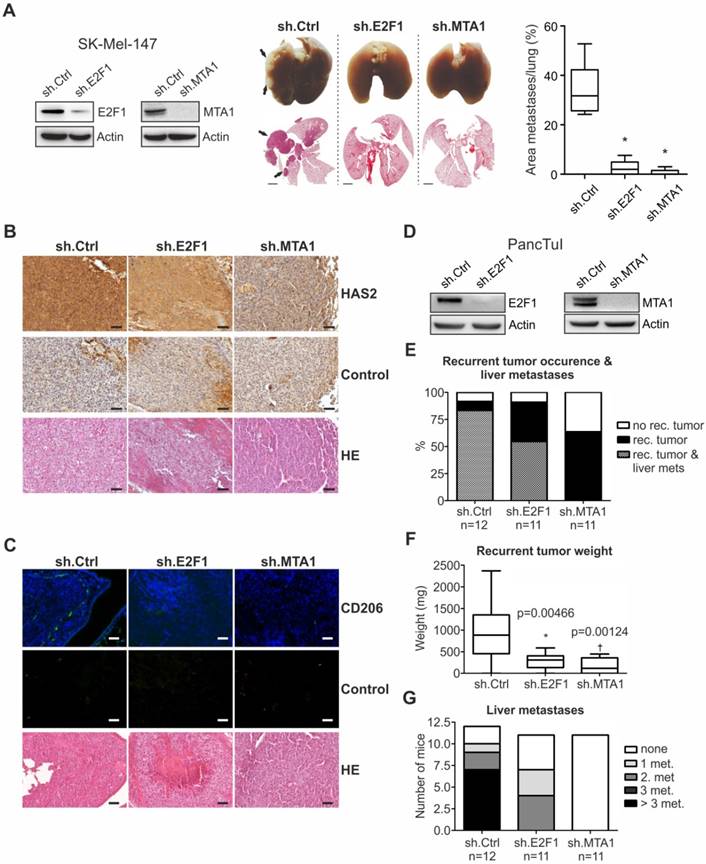
E2F1 or MTA1 knockdown suppresses metastases formation in vivo. (A) IB depicting E2F1 and MTA1 knockdown in SK-Mel-147 cells stably expressing sh.ctrl, sh.E2F1, or sh.MTA1 prior to i.v. injection in mice (left). Representative lung images (center top; arrow; metastases) and corresponding hematoxylin/eosin sections (center bottom). Metastases (top) and pulmonary nodules (bottom) on lungs of mice injected with sh.ctrl-expressing cells are depicted with arrows. Metastatic dissemination is measured as relative area of metastases versus total lung area (right; n=5/group, 2-tailed Student's t-test, *p< 0.05). Scale bar: 2 mm. (B, C) IHC of (B) HAS2 levels (brown staining, scale bar: 50 µm) and (C) CD206 marker of recruitment of tumor-associated macrophages (green staining) on metastasized pulmonary tissue (scale bar: 100 µm). (D) IB depicting E2F1, and MTA1 knockdown in PancTuI cells stably expressing sh.ctrl, sh.E2F1 or sh.MTA1, prior to their orthotopic injection into SCID-beige mice. Metastatic outcome was estimated via (E) occurrence of recurrent tumor and liver metastases, (F) recurrent tumor weight and (G) number of liver metastases, after resection of the primary tumors (Mann-Whitney-U test, * p= 0.00466; † p= 0.00124).
Disruption of the E2F1:MTA1/HAS2 circuit reduces metastasis by altering TME
To assess whether the E2F1:MTA1/HAS2 interaction can be targeted towards an antimetastatic outcome, we evaluated the in vivo metastatic potential of cancer cells where formation of the E2F1:MTA1 complex is abolished by knockdown of either E2F1 or MTA1. First, SK-Mel-147 cells, stably expressing sh.RNA directed against MTA1 or E2F1 (Figure 5A, left panel, also used in vitro), were delivered i.v. into nude mice. The metastatic potential of circulating tumor cells was determined by quantitatively analyzing areas of metastatic tissues versus total lung area in histological sections. Macroscopic and microscopic examination of the lungs showed massive metastases mainly in animals injected with control cells (ranging from 27% to 54%), whereas knockdown of either E2F1 (0% to 7.6%) or, to a greater extent, MTA1 (0% to 3%) markedly abolished the formation of pulmonary nodules (Figure 5A, center and right panels). As determined by immunohistochemistry (IHC), tumors originating from unmodified cells exhibited higher HAS2 levels compared to E2F1- or MTA1-knockdown cells (Figure 5B). HAS2, in turn, activates M2 type tumor-associated macrophages (TAMs) via HA production, thereby generating a prometastatic tumor environment [48, 50]. In line with this, HAS2 downregulation in tumors derived from cells where E2F1 or MTA1 was depleted demonstrated reduction in the proportion of TAMs, as estimated by immunofluorescence detection of TAMs using the M2 TAM marker CD206 [48] (green fluorescence staining, Figure 5C). Overall, disruption of the E2F1:MTA1 complex efficiently impairs the establishment of a prometastatic TME. This is achieved, at least in part, by reducing the HAS2/HA production.
We further confirmed the antimetastatic effect after perturbation of the E2F1:MTA1 complex in a pancreatic cancer model. SCID beige mice were orthotopically xenotransplanted with PancTuI cells stably expressing shRNA against E2F1 or MTA1 and compared to sh.ctrl. (Figure 5D). All animals developed primary tumors. Fifteen days after cell inoculation, re-laparotomy was performed and the tumor-bearing pancreata were carefully mobilized and resected by subtotal pancreatectomy. Assessment of mice on day 31 revealed that inhibition of E2F1 as well as MTA1 strongly attenuates recurrent tumor occurrence and formation of liver metastases (Figure 5E). Moreover, mice bearing PancTuI tumors originating from sh.E2F1- or sh.MTA1-expressing cells showed a significant decrease in recurrent tumor weight after resection (Figure 5F), but more remarkably, MTA1 depletion completely abolished metastatic dissemination of PancTuI cells into the liver after pancreatectomy (Figure 5G).
Structural systems pharmacology-based identification of FDA-approved drugs that inhibit the E2F1:MTA1 complex
Given the antimetastatic potential of perturbation of the E2F1:MTA1 interaction, we aimed to block the formation of the E2F1:MTA1 malignant complex by selectively inactivating MTA1 while leaving E2F1 intact. To this end, we used a pharmacophore modeling approach to perform high-throughput screening of a library of FDA-approved, small- molecule drugs/nutraceuticals that are able to bind to MTA1 surfaces, mediating its PPI with E2F1. First, we identified key amino acid residues of MTA1 present at the interaction interface of E2F1 and used them for structure-based pharmacophore modeling using the 'create pharmacophores' protocol available in Biovia Discovery Studio 4.0 software suite. From the top 10 pharmacophore models generated on the MTA1 surface, we selected the best one where maximum pharmacophore features were associated with the key amino acid residues involved in the E2F1 interactions. The best pharmacophore model comprised six features: two hydrogen bond acceptors near MTA1: Ser319 and Leu320, two hydrogen bond donors near MTA1:Lys318 and Ser322, and two hydrophobic groups being the indole side chain of MTA1:Trp317, contributing to a pi-anion electrostatic interaction with Asp436 and a pi-sigma hydrophobic interaction with Leu435 of E2F1 at the top interaction pose. Additionally, twelve exclusion volumes were also considered (Figure S6A).
This pharmacophore model was used as an input query for high-throughput screening of potential inhibitors of E2F1:MTA1 interaction from a virtual library of 2,924 FDA-approved drugs/nutraceuticals. We found a total of 16 substances predicted to interact with MTA1 residues which are involved in the interaction with E2F1 and ranked them according to their FIT scores (Table S5). These compounds include active substances for indications other than cancer, such as drugs with antibacterial, anticoagulant, antioxidant or anti-inflammatory activity. Of note, the list includes argatroban and silibinin, which both have recently been reported to exert antimetastatic effects [53-57]. This is also supported by our XTT assays demonstrating that neither argatroban nor silibinin affect proliferation (Figure S7A-B). In addition, compared to, for example, demeclocycline (rank 1), argatroban and silibinin are less cytotoxic at clinically relevant doses (Figure S7C). Our controlled molecular docking studies of argatroban in the binding cavity of MTA1 indicated that argatroban is a more effective ligand of MTA1 than demeclocycline (Figure S6B-C).
Subsequently, we focused on evaluating these compounds' inhibitory capacity on the interaction between E2F1 and MTA1 and their ability to intercept the E2F1:MTA1/HAS2 axis. Computational models of argatroban and silibinin fitting into the binding cavity of MTA1 are shown in Figure 6A. To validate these predictions, Co-IPs using anti-E2F1 or IgG as control were conducted in whole lysates from PC-3 cells treated with argatroban, silibinin or vehicle. Figure 6B (upper panel) illustrates that the amount of MTA1 co-immunopurified with E2F1 considerably decreased upon compound addition, with the strongest effect observed when testing argatroban. In addition, the inhibitors significantly reduced E2F1 binding to the HAS2 promoter (Figure 6B, bottom). HAS2 promoter activation through E2F1 in conjunction with MTA1 was significantly impaired in response to both drugs, but argatroban displayed the most potent inhibitory effect (Figure 6C). Since argatroban inhibits E2F1:MTA1 complex formation and HAS2 promoter activation more efficiently than silibinin, we selected argatroban for further studies.
Figure 6
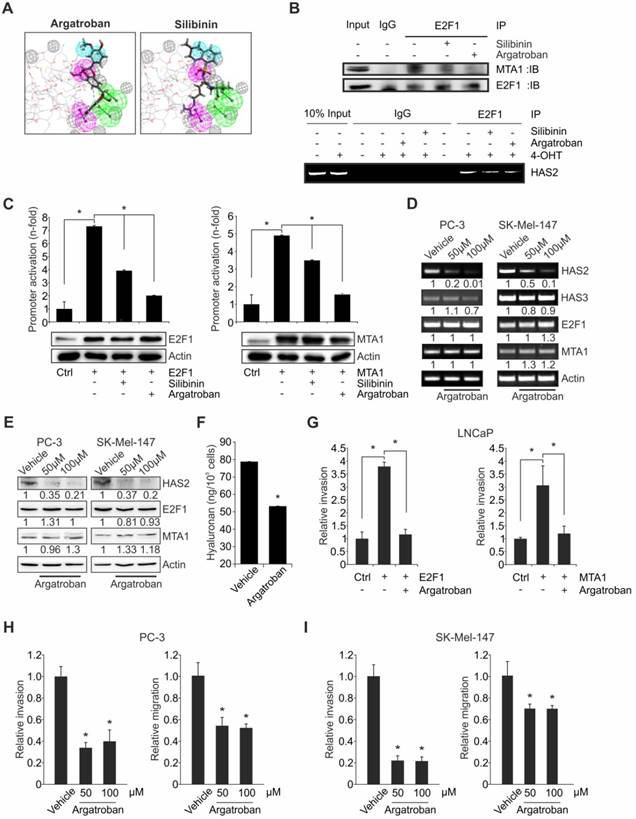
Argatroban disrupts the E2F1:MTA1 complex inhibiting HAS2 and reducing invasion in cancer cells. (A) Computational prediction of drug molecules with a potential to inhibit E2F1:MTA1 based on an MTA1 pharmacophore model. The E2F1-binding domain of MTA1 is shown as ball and stick and potential inhibitor as yellow structure. Spheres indicate chemical bonds between compounds and MTA1: green: H-bond acceptors; pink: H-bond donor; blue: hydrophobic bond; gray: excluded volume. (B) Co-immunoprecipitation in PC-3 cells in the presence or absence of either silibinin or argatroban using MTA1 and E2F1 antibodies (upper panel). Both compounds decrease MTA1 binding to E2F1, while argatroban exhibits a more drastic decrease. Lower panel: ChIP assay for E2F1 binding on HAS2 promoter using PC-3.ER-E2F1 cells with inducible E2F1 expression in the presence of either argatroban or silibinin. (C) Relative luciferase activities after HAS2 promoter construct cotransfection with E2F1 (left) or MTA1 (right) in LNCaP cells with or without compounds. E2F1-induced and MTA1-induced activity of the HAS2 promoter is decreased by both compounds, while argatroban shows the most marked reduction. (D, E) HAS2, E2F1 and MTA1 transcript (D, HAS3 = negative control) and protein levels (E) in PC-3 and SK-Mel-147 cells treated with 50 µM or 100 µM argatroban. Actin is used for equal loading. Band intensities were quantified relative to the vehicle-treated controls. (F) ELISA for HA levels in argatroban-treated versus untreated SK-Mel-147 cells. (G) Matrigel assays of LNCaP cells overexpressing E2F1 or MTA1 in presence or absence of argatroban. (H, I) Matrigel and migration assays in (H) PC-3 and (I) SK-Mel-147 upon argatroban treatment. Bar graphs represent means ± SD of three independent experiments; 2-tailed Student's t-test, *p< 0.05.
To monitor the effect of argatroban on the E2F1:MTA1 complex, we evaluated HAS2 expression in aggressive PC-3 and SK-Mel-147 cells in the absence or presence of this drug. As shown in Figure 6D, drug-treated cells display a clear reduction of HAS2 transcripts. In contrast, mRNA expression of HAS3, which is not a target of the E2F1:MTA1 complex, remained unchanged. More importantly, HAS2 protein also decreased substantially upon argatroban administration in both cell lines (Figure 6E). Intriguingly, E2F1 and MTA1 levels were not affected, strongly indicating that the loss of HAS2 expression occurs via inhibition of the PPI between E2F1 and MTA1. Consistently, HA levels in conditioned media from argatroban-treated cells markedly declined relative to untreated cells, as evidenced by HA ELISA (Figure 6F). Thus, disruption of the PPIs between E2F1 and MTA1 by treatment of cells with argatroban suffices to reduce its regulatory activity on HAS2, eventually leading to decreased HA levels in the conditioned medium. In order to examine whether argatroban-mediated disruption of the E2F1:MTA1 complex leads to reduced invasiveness, Matrigel assays in the presence or absence of argatroban were performed by overexpressing E2F1 or MTA1 in LNCaP cells. In particular, exogenous addition of E2F1 or MTA1 failed to induce invasiveness in the presence of argatroban, compared to controls in the absence of the drug (Figure 6G). Further, administration of different concentrations of argatroban to PC-3 (Figure 6H) and SK-Mel-147 (Figure 6I) cells, which endogenously express high levels of both E2F1 and MTA1 (Figure S2), confirmed the inhibitory effect of the compound on the invasive and migratory traits.
The effectiveness of argatroban in fighting metastases was further confirmed in vivo in two mouse models, as shown in Figure 7. Mice were i.v. injected with argatroban-pretreated parental SK-Mel- 147 cells and were subsequently treated by an i.p. drug administration for four weeks. A strong decline in metastatic growth (> 90 %) resulting in only a few lung foci was observed in these mice compared to untreated controls (Figure 7A). IHC analyses of lung tumors grown in argatroban-treated animals revealed a much lower HAS2 expression (Figure 7B) that was accompanied by a reduction in the proportion of TAMs (Figure 7C). Additionally, we tested the therapeutic efficacy of argatroban in pancreas-to-liver metastasis, using our clinically adapted orthotopic xenotransplantation model [42]. Primary tumors established via intrapancreatic injection of human parental PancTuI cells were resected 13 days after implantation. Three days after resection, mice were treated i.p. with argatroban for another 15 days. Strikingly, the size of the local recurrences and the number of liver metastases severely decreased upon argatroban treatment (Figure 7D-F). In conclusion, our data demonstrate that argatroban exhibits a strong antimetastatic effect via disrupting the PPI between MTA1 and E2F1, leading to inhibition of the HAS2/HA axis.
Discussion
Antimetastatic regimens are urgently needed, but developing New Molecular Entities (NMEs) to effectively combat cancer progression is tedious. Until recently, cancer precision medicine has relied on the “lock-and-key” specificity, meaning that molecules that are newlydesigned to target a certain pathway are anticipated to eradicate tumors in a highly selective manner, thereby maximizing efficacy and minimizing sideeffects [58]. In practice, however, the majority of innovative drugs with a promising profile in preclinical settings demonstrated inadequate efficacy and/or safety on clinical subjects. These failure rates have been discouragingly high and disproportional to the costs of developing new drugs from scratch [59, 60]. Nevertheless, “Deus ex machina”, polypharmacology [61], and drug repositioning [62] promote a paradigm shift in drug research and development. On one hand, polypharmacology questions the “lock-and-key” dogma by counter- suggesting that many drugs can be effective against one disease, and that one drug can show efficacy against diseases with distinct clinical manifestations [61]. On the other hand, drug repositioning refers to discovering, validating and marketing previously approved drugs for new indications. From this point of view, re-profiling of well-established drugs might be a key approach for future cancer treatment. Due to their known safety and efficacy profiles against other indications, they pose advantages for easier introduction into clinical trials, faster filing and regulatory approval procedures and significantly reduced financial costs compared to NMEs [63]. Tools and platforms are under development or already in place for supporting data-driven, rather than chance- driven, prediction of the repositioning potential of drugs [64-67].
In this study, we unveiled that in invasive cancers, increased E2F1 levels transactivate MTA1. Then, MTA1 develops PPIs with E2F1 to form coactivator complexes that potentiate expression of metastasis-related targets, such as HAS2, leading to extracellularly increased HA production and enhanced cell migratory and invasive capacity. Disruption of this prometastatic circuit by targeting the E2F1:MTA1 PPI reduces HA synthesis, as well as the infiltration of TAMs in the TME. Formation of the prometastatic complex can be targeted by inhibiting the expression of either E2F1 or MTA1 through de novo synthesized sh.RNAs. Moreover, structure- based pharmacophore modeling identified inhibitors that can perturb a particular E2F1-coregulator complex, in this case E2F1:MTA1, from a virtual library of already-marketed, small-molecule drugs. In this respect, the small-molecule compound argatroban demonstrates strong antimetastatic efficacy in vivo by specifically blocking the assembly of E2F1 and MTA1, thereby providing promises for rapid translation of antimetastasis therapy using drug repositioning.
Figure 7
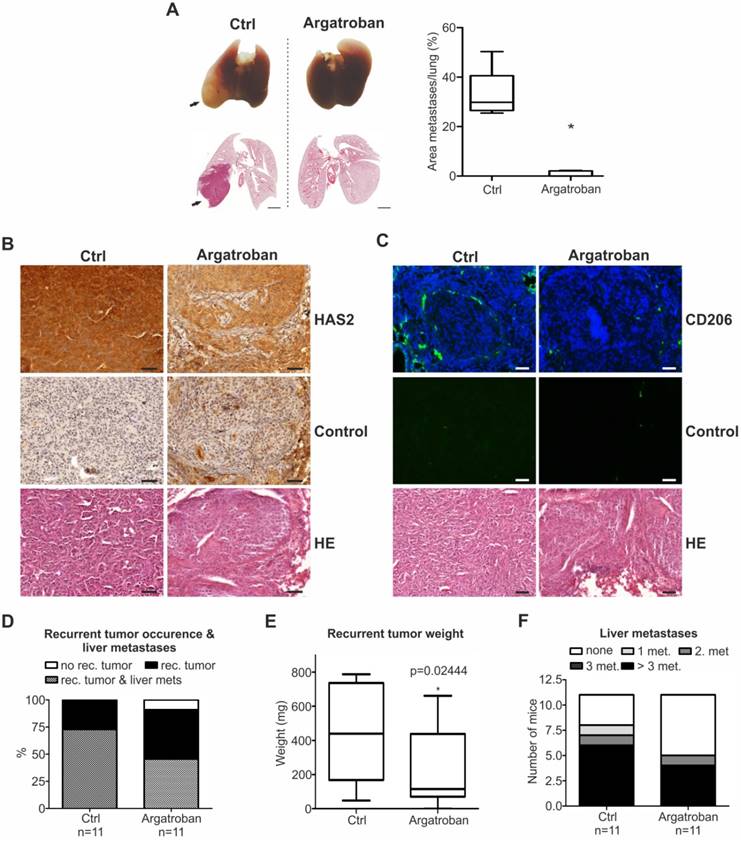
Argatroban treatment inhibits metastasis in vivo. (A) Representative lung images (top) and the corresponding hematoxylin/eosin sections (bottom) from mice intravenously injected with SK-Mel-147 and subsequently treated with argatroban. Metastases (top) and pulmonary nodules (bottom) on lungs of argatroban-treated versus untreated mice are depicted with arrows. Metastatic dissemination is measured as relative area of metastases versus total lung area (right; n=5/group, 2-tailed Student's t-test, *p< 0.05). Scale bar: 2 mm. (B, C) IHC of (B) HAS2 levels (brown staining, scale bar: 50 µm) and (C) CD206 (green staining, scale bar: 100 µm) on metastasized pulmonary tissue. (D-F) Primary tumors were resected by subtotal pancreatectomy 13 days after inoculation of PancTuI cells (1x10⁶) and i.p. treatment of mice with either argatroban (9 mg/kg/day) or 0.9% saline (ctrl) was initiated 3 days post-resection. Metastatic outcome was estimated via (D) occurrence of recurrent tumor and liver metastases, (E) recurrent tumor weight (Mann-Whitney-U test, p=0.024444) and (F) number of liver metastases.
Argatroban is a reliable and predictable anticoagulant that binds reversibly and selectively to the thrombin active site and inhibits thrombin-catalyzed or -induced reactions, including fibrin formation, activation of coagulation factors V, VIII, and XIII, activation of protein C, and aggregation of platelets. The compound is currently prescribed against heparin-induced thrombocytopenia and for use in patients undergoing percutaneous coronary intervention [68]. Argatroban's antimetastatic potential has been recognized earlier [53-55]; however, in lack of previous insights on the underlying molecular mechanism, it was hypothesized that this effect is mediated via its well-known mechanism of action as a competitive inhibitor of thrombin [69]. Here, we demonstrate that the metastasis-inhibitory property of argatroban relies on a distinct mechanism of action that involves disruption of the interaction of E2F1 with its newly identified coactivator MTA1, eventually leading to downregulation of metastatic targets. Disruption of this interaction suffices to prevent aggressive cancer cells from forming metastases. Of note, argatroban is efficient against metastatic pancreatic tumors. This finding might be valuable, as this type is one of the most difficult-to-cure cancers [70]. Although RNAi-based therapeutics against E2F1 or MTA1 have also the potential to be developed as NMEs towards the same purpose, their high antineoplastic and antimetastatic effects in the current approach are mainly connected with the stable modulation of injected cancer cells in both metastasis models. In our clinically adapted in vivo models, argatroban's significant antimetastatic properties were demonstrated by intraperitoneal administration of low, non-toxic doses. This suggests that argatroban could present a genuine therapeutic solution that is being forwarded to bedside faster than shRNAs, whose greatest challenge is delivery. Moreover, drug safety data from phase 1 and 2 clinical trials of argatroban are already in place [71].
Our study further underscores that E2F1's aggressive behavior largely depends on the spatio- temporal availability of its coregulators. E2F1 is dragged into metastasis-supporting processes once a malignant fate is established [5, 72]. Rewiring of E2F1 to malignant networks is mediated by an increasing repertoire of E2F1 coregulators that enhance E2F1's transcription programs to favor expression of genes underlying invasiveness [16, 17, 24, 73, 74]. MTA1, the newly identified member of this prometastatic E2F1 coregulome, is frequently upregulated in metastatic cancers and is causatively associated with cell transformation, DNA repair, and EMT. It participates in the nucleosome remodeling and deacetylase (NuRD) complex and contributes to its stabilization and assembly [75]. The malignant E2F1:MTA1 complex is predicted to be formed via the BAH- and SANT-domains, which, in several proteins, are involved in transcriptional regulation, as well as its ELM2 domain, which is significant for the recruitment of histone deacetylases [75]. Clinically, the E2F1/ MTA1 signature is translated into poor prognosis.
Argatroban is predicted to inhibit the complex formation by binding to the above-mentioned interacting surfaces of MTA1. Thus, E2F1 transcribes MTA1, but argatroban binds to the newly synthesized MTA1 protein molecules via these surfaces, rendering MTA1 essentially unable to develop malignant PPIs. Considering the growing evidence for the critical significance of coregulators as rheostats of E2F1 -mediated aggressiveness, this is the first time that targeting of a prometastatic E2F1-coregulator interaction towards inhibiting metastasis was achieved through the use of already-marketed drugs.
HAS2, the representative transcriptional target of the metastatic E2F1:MTA1 complex, is a hyaluronic synthase that catalyzes the synthesis of HA, a glycosaminoglycan polymer which is both a key structural component of the ECM and a signaling molecule involved in inflammatory response and immunomodulation [76, 77]. HA is also critical for TME architecture and tumor-stromal cell interactions [78]. Upon increased HAS2 activity, long HA molecules are produced and extruded to the extracellular space, where they can bind directly to matrix components and cell surface receptors, collectively referred to as hyaladherins. HA cross-links with matrix components such as versican, aggrecan, tumor necrosis factor-inducible gene 6 (TSG-6), and serum-derived hyaluronan-associated protein (SHAP) to form a pericellular meshwork that defines the mechanical properties of tumors. Moreover, it interacts with typical HA receptors, such as cluster of differentiation 44 (CD44) or receptor for hyaluronan-mediated motility (RHAMM) to trigger phosphoinositide 3-kinase/serine-threonine kinase 1 (PI3K/AKT), mitogen-activated protein kinase (MAPK), and extracellular signal-regulated kinase (ERK) signaling cascades, thereby enhancing cell survival, drug resistance, EMT, and the migratory capacity of tumor cells [79]. In addition, HA can interact with immune cells through CD44, the only receptor that has been demonstrated to bind HA to immune cells [77]. It can also modulate toll-like receptor 2 and 4 (TLR2/4) downstream signaling which reprograms inflammatory cells towards creating a tumor-permissive environment via immunosuppression and neutrophil transformation [80]. Since the TME contains several types of immune cells which, depending on their type, tend to occupy specific locations [81], the HA-immune cell interactions emerge as potential effectors of the so-called immune contexture ( i.e., the density, functional orientation, and spatial organization of the immune infiltrate) [81].
Targeting HA-turnover pathways is, thus, an appealing therapeutic strategy since HA depletion could manage lesions in a “two-birds-with-one-stone” manner by simultaneously modulating both the tumor and the surrounding microenvironment that supports it, including the infiltrated immune cells. Hyaluronidases, the degrading enzymes of HA which, together with HAS2, regulate HA turnover, have been suggested to alter tumor properties and increase the penetration and uptake of chemotherapeutic drugs [52]. Hyaluronidase, mainly of bovine origin, could yield serious adverse events though, especially if administrated systemically, due to its tendency to induce allergic reactions as well as increased risk of inflammation and joint pains to non-malignant tissues, where HA is also present [52]. Consequently, argatroban may present an appealing alternative to HA-targeting strategies since it precisely intervenes with the HAS2/HA axis only at sites with increased of E2F1:MTA1 levels, as these are the progressing malignant tissues.
Last but certainly not least, several hyaladherins (RHAMM, CD44, and versican) are part of a recently unveiled E2F1 interacting map that underlies EMT and metastasis [72]. Given the critical role of hyaladherins and HA binding for shaping both the TME [79] and immune responses [77], this observation provides insights on a possible association of an E2F1-regulated interactome with immunological aspects of tumors. E2F1 might orchestrate alterations in the TME and immune contexture in favor of metastasis via exerting a broader effect on HA- binding molecules in addition to or in support of, respectively, the E2F1:MTA1/HAS2 axis. It currently remains unknown whether E2F1 affects the ability of tumors to evade immune surveillance, which immune components might be E2F1-susceptible and which are the underlying mechanisms. For several years, we used to think of E2F1 as an indispensable component of the DNA damage response and repair (DDR/R) signaling network and, therefore, its oncogenic behavior seemed rather paradoxical. Importantly, it was recently suggested that DDR/R crosstalk with immune response (ImmR) signaling networks and that disequilibrium in the DDR/R-ImmR alias opens the “bag of Aeolus” in terms of disease progression [82]. While DDR/R-ImmR crosstalk prevents oncogenesis at early stages, it passes to the dark side to support disease progression at later stages [82]. In this respect, the E2F1 paradox might be explained, if it is hypothesized that E2F1 stands at the crossroads between DDR/R and ImmR, mediating their interactions. The E2F1 role in onco-immunology emerges as a subject of fruitful future research, which might open new avenues for next-generation therapeutics.
Conclusions
Uncovering the metastasis-promoting E2F1: MTA1/HAS2 network and using structure-based pharmacophore modeling, we propose argatroban as an innovative, E2F1-coregulator-based antimetastatic drug. Treatment of high E2F1/MTA1-expressing tumors with argatroban in clinically safe doses disrupts this complex, modulates the TME and prevents metastasis and cancer relapses.
Abbreviations
AKT: serine/threonine kinase 1; CD44: cluster of differentiation 44; 4-OHT: 4-hydroxytamoxifen; E2F1: E2F transcription factor 1; EMT: epithelial-mesenchymal transition; ER: estrogen receptor; ERK: extracellular signal-regulated kinase; GST: glutathione S- transferase; HA: hyaluronan/hyaluronic acid; HAS2: hyaluronan synthase 2; IB: immunoblot; IgG: immunoglobulin G; (co-) IP: (co-) immunoprecipitation; MAPK: mitogen-activated protein kinase; MS: mass spectrometry; MTA1: metastasis associated 1; PI3K: phosphoinositide 3-kinase; PPI: protein-protein interaction; sh: small hairpin; RHAMM: receptor for hyaluronan-mediated motility; SHAP: serum-derived hyaluronan-associated protein; TAM: tumor-associated macrophage; TF: transcription factor; TME: tumor microenvironment, TLR: toll-like receptor; TSG-6: tumor necrosis factor-inducible gene 6.
Acknowledgements
This work was supported by grants from the German Cancer Aid (109801 to B.M. Pützer and D. Engelmann) and the German Federal Ministry of Education and Research (BMBF) as part of the project eBio:SysMet to B.M. Pützer and O. Wolkenhauer, and eBio:MelEVIR to O.Wolkenhauer. We thank Anja Stoll for technical assistance, and Ottmar Herchenröder for helpful discussion and critical reading of the manuscript. We are very grateful to Ilona Klamfuss for support with in-house mouse studies and Dirk Koczan for microarray assistance.
Author contributions
DE, DG and BMP conceived the project and interpreted the data. DG, SL, SKG and BMP wrote the manuscript. DG, DE, AS and BMP designed experiments and analyzed data. DG, CM, AS and TS performed experiments. SM performed bioinformatics analyses. SKG performed in silico structural and pharmacophore modeling and drug library screening. SM contributed with mass spectrometry analysis. JPG, CH and JHE carried out animal experiments in the orthotopic pancreatic cancer, and DG and CM in the melanoma metastasis model and analyzed data. HM performed pathology review. AT and OW helped with logistics.
Supplementary Material
Supplementary figures and tables.
Competing Interests
The authors have declared that no competing interest exists.
References
1. Steeg PS, Theodorescu D. Metastasis: a therapeutic target for cancer. Nat Clin Pract Oncol. 2008;5:206-19
2. Gandalovicova A, Rosel D, Fernandes M, Vesely P, Heneberg P, Cermak V. et al. Migrastatics-Anti-metastatic and Anti-invasion Drugs: Promises and Challenges. Trends Cancer. 2017;3:391-406
3. Brabletz T, Lyden D, Steeg PS, Werb Z. Roadblocks to translational advances on metastasis research. Nat Med. 2013;19:1104-9
4. Steeg PS. Targeting metastasis. Nat Rev Cancer. 2016;16:201-18
5. Engelmann D, Pützer BM. The dark side of E2F1: in transit beyond apoptosis. Cancer Res. 2012;72:571-5
6. Pützer BM, Engelmann D. E2F1 apoptosis counterattacked: evil strikes back. Trends Mol Med. 2013;19:89-98
7. Hallstrom TC, Mori S, Nevins JR. An E2F1-dependent gene expression program that determines the balance between proliferation and cell death. Cancer Cell. 2008;13:11-22
8. Chen HZ, Tsai SY, Leone G. Emerging roles of E2Fs in cancer: an exit from cell cycle control. Nat Rev Cancer. 2009;9:785-97
9. Stanelle J, Pützer BM. E2F1-induced apoptosis: turning killers into therapeutics. Trends Mol Med. 2006;12:177-85
10. Engelmann D, Pützer BM. Translating DNA damage into cancer cell death-A roadmap for E2F1 apoptotic signalling and opportunities for new drug combinations to overcome chemoresistance. Drug Resist Updat. 2010;13:119-31
11. Alla V, Engelmann D, Niemetz A, Pahnke J, Schmidt A, Kunz M. et al. E2F1 in melanoma progression and metastasis. J Natl Cancer Inst. 2010;102:127-33
12. Alla V, Kowtharapu BS, Engelmann D, Emmrich S, Schmitz U, Steder M. et al. E2F1 confers anticancer drug resistance by targeting ABC transporter family members and Bcl-2 via the p73/DNp73-miR-205 circuitry. Cell Cycle. 2012;11:3067-78
13. Johnson JL, Pillai S, Pernazza D, Sebti SM, Lawrence NJ, Chellappan SP. Regulation of matrix metalloproteinase genes by E2F transcription factors: Rb-Raf-1 interaction as a novel target for metastatic disease. Cancer Res. 2012;72:516-26
14. Engelmann D, Mayoli-Nüssle D, Mayrhofer C, Fürst K, Alla V, Stoll A. et al. E2F1 promotes angiogenesis through the VEGF-C/VEGFR-3 axis in a feedback loop for cooperative induction of PDGF-B. J Mol Cell Biol. 2013;5:391-403
15. Knoll S, Fürst K, Kowtharapu B, Schmitz U, Marquardt S, Wolkenhauer O. et al. E2F1 induces miR-224/452 expression to drive EMT through TXNIP downregulation. EMBO Rep. 2014;15:1315-29
16. Meier C, Spitschak A, Abshagen K, Gupta S, Mor JM, Wolkenhauer O. et al. Association of RHAMM with E2F1 promotes tumour cell extravasation by transcriptional up-regulation of fibronectin. J Pathol. 2014;234:351-64
17. Wang Y, Alla V, Goody D, Gupta SK, Spitschak A, Wolkenhauer O. et al. Epigenetic factor EPC1 is a master regulator of DNA damage response by interacting with E2F1 to silence death and activate metastasis-related gene signatures. Nucleic Acids Res. 2016;44:117-33
18. Eymin B, Gazzeri S, Brambilla C, Brambilla E. Distinct pattern of E2F1 expression in human lung tumours: E2F1 is upregulated in small cell lung carcinoma. Oncogene. 2001;20:1678-87
19. Baldini E, Camerini A, Sgambato A, Prochilo T, Capodanno A, Pasqualetti F. et al. Cyclin A and E2F1 overexpression correlate with reduced disease-free survival in node-negative breast cancer patients. Anticancer Res. 2006;26:4415-21
20. Vuaroqueaux V, Urban P, Labuhn M, Delorenzi M, Wirapati P, Benz CC. et al. Low E2F1 transcript levels are a strong determinant of favorable breast cancer outcome. Breast Cancer Res. 2007;9:R33
21. Lee JS, Leem SH, Lee SY, Kim SC, Park ES, Kim SB. et al. Expression signature of E2F1 and its associated genes predict superficial to invasive progression of bladder tumors. J Clin Oncol. 2010;28:2660-7
22. Sharma A, Yeow WS, Ertel A, Coleman I, Clegg N, Thangavel C. et al. The retinoblastoma tumor suppressor controls androgen signaling and human prostate cancer progression. J Clin Invest. 2010;120:4478-92
23. O'Malley BW, Kumar R. Nuclear receptor coregulators in cancer biology. Cancer Res. 2009;69:8217-22
24. Ciró M, Prosperini E, Quarto M, Grazini U, Walfridsson J, McBlane F. et al. ATAD2 is a novel cofactor for MYC, overexpressed and amplified in aggressive tumors. Cancer Res. 2009;69:8491-8
25. Merrell KW, Crofts JD, Smith RL, Sin JH, Kmetzsch KE, Merrell A. et al. Differential recruitment of nuclear receptor coregulators in ligand-dependent transcriptional repression by estrogen receptor-α. Oncogene. 2011;30:1608-14
26. Egberts JH, Cloosters V, Noack A, Schniewind B, Thon L, Klose S. et al. Anti-tumor necrosis factor therapy inhibits pancreatic tumor growth and metastasis. Cancer Res. 2008;68:1443-50
27. Ji W, Zhang W, Xiao W. E2F-1 directly regulates thrombospondin 1 expression. PLoS One. 2010;5:e13442
28. Pakala SB, Rayala SK, Wang RA, Ohshiro K, Mudvari P, Reddy SD. et al. MTA1 promotes STAT3 transcription and pulmonary metastasis in breast cancer. Cancer Res. 2013;73:3761-70
29. Roy A, Kucukural A, Zhang Y. I-TASSER: a unified platform for automated protein structure and function prediction. Nat Protoc. 2010;5:725-38
30. Zhang Y. I-TASSER server for protein 3D structure prediction. BMC Bioinformatics. 2008;9:40
31. Millard CJ, Watson PJ, Celardo I, Gordiyenko Y, Cowley SM, Robinson CV. et al. Class I HDACs share a common mechanism of regulation by inositol phosphates. Mol Cell. 2013;51:57-67
32. Alqarni SS, Murthy A, Zhang W, Przewloka MR, Silva AP, Watson AA. et al. Insight into the architecture of the NuRD complex: structure of the RbAp48-MTA1 subcomplex. J Biol Chem. 2014;289:21844-55
33. Spassov VZ, Yan L, Flook PK. The dominant role of side-chain backbone interactions in structural realization of amino acid code. ChiRotor: a side-chain prediction algorithm based on side-chain backbone interactions. Protein Sci. 2007;16:494-506
34. Spassov VZ, Flook PK, Yan L. LOOPER: a molecular mechanics-based algorithm for protein loop prediction. Protein Eng Des Sel. 2008;21:91-100
35. Chen R, Li L, Weng Z. ZDOCK: an initial-stage protein-docking algorithm. Proteins. 2003;52:80-7
36. Li L, Chen R, Weng Z. RDOCK: refinement of rigid-body protein docking predictions. Proteins. 2003;53:693-707
37. Krissinel E, Henrick K. Inference of macromolecular assemblies from crystalline state. J Mol Biol. 2007;372:774-97
38. Sanders MP, Roumen L, van der Horst E, Lane JR, Vischer HF, van Offenbeek J. et al. A prospective cross-screening study on G-protein-coupled receptors: lessons learned in virtual compound library design. J Med Chem. 2012;55:5311-25
39. Rechfeld F, Gruber P, Kirchmair J, Boehler M, Hauser N, Hechenberger G. et al. Thienoquinolines as novel disruptors of the PKCepsilon/RACK2 protein-protein interaction. J Med Chem. 2014;57:3235-46
40. Wu G, Robertson DH, Brooks CL 3rd, Vieth M. Detailed analysis of grid-based molecular docking: A case study of CDOCKER-A CHARMm-based MD docking algorithm. J Comput Chem. 2003;24:1549-62
41. Salmon P, Trono D. Production and titration of lentiviral vectors. Curr Protoc Hum Genet. 2007 Chapter 12: Unit 12 10
42. Egberts JH, Schniewind B, Sipos B, Hinz S, Kalthoff H, Tepel J. Superiority of extended neoadjuvant chemotherapy with gemcitabine in pancreatic cancer: a comparative analysis in a clinically adapted orthotopic xenotransplantation model in SCID beige mice. Cancer Biol Ther. 2007;6:1227-32
43. Tepel J, Kruse ML, Kapischke M, Haye S, Sipos B, Kremer B. et al. Adjuvant treatment of pancreatic carcinoma in a clinically adapted mouse resection model. Pancreatology. 2006;6:240-7
44. Liu J, Wang H, Huang C, Qian H. Subcellular localization of MTA proteins in normal and cancer cells. Cancer Metastasis Rev. 2014;33:843-56
45. Riker AI, Enkemann SA, Fodstad O, Liu S, Ren S, Morris C. et al. The gene expression profiles of primary and metastatic melanoma yields a transition point of tumor progression and metastasis. BMC Med Genomics. 2008;1:13
46. Chandran UR, Ma C, Dhir R, Bisceglia M, Lyons-Weiler M, Liang W. et al. Gene expression profiles of prostate cancer reveal involvement of multiple molecular pathways in the metastatic process. BMC Cancer. 2007;7:64
47. Harada T, Chelala C, Bhakta V, Chaplin T, Caulee K, Baril P. et al. Genome-wide DNA copy number analysis in pancreatic cancer using high-density single nucleotide polymorphism arrays. Oncogene. 2008;27:1951-60
48. Kobayashi N, Miyoshi S, Mikami T, Koyama H, Kitazawa M, Takeoka M. et al. Hyaluronan deficiency in tumor stroma impairs macrophage trafficking and tumor neovascularization. Cancer Res. 2010;70:7073-83
49. Bernert B, Porsch H, Heldin P. Hyaluronan synthase 2 (HAS2) promotes breast cancer cell invasion by suppression of tissue metalloproteinase inhibitor 1 (TIMP-1). J Biol Chem. 2011;286:42349-59
50. Okuda H, Kobayashi A, Xia B, Watabe M, Pai SK, Hirota S. et al. Hyaluronan synthase HAS2 promotes tumor progression in bone by stimulating the interaction of breast cancer stem-like cells with macrophages and stromal cells. Cancer Res. 2012;72:537-47
51. Tammi RH, Kultti A, Kosma VM, Pirinen R, Auvinen P, Tammi MI. Hyaluronan in human tumors: pathobiological and prognostic messages from cell-associated and stromal hyaluronan. Semin Cancer Biol. 2008;18:288-95
52. Whatcott CJ, Han H, Posner RG, Hostetter G, Von Hoff DD. Targeting the tumor microenvironment in cancer: why hyaluronidase deserves a second look. Cancer Discov. 2011;1:291-6
53. Asanuma K, Wakabayashi H, Hayashi T, Okuyama N, Seto M, Matsumine A. et al. Thrombin inhibitor, argatroban, prevents tumor cell migration and bone metastasis. Oncology. 2004;67:166-73
54. Asanuma K, Wakabayashi H, Okamoto T, Asanuma Y, Akita N, Yoshikawa T. et al. The thrombin inhibitor, argatroban, inhibits breast cancer metastasis to bone. Breast Cancer. 2013;20:241-6
55. Schulze EB, Hedley BD, Goodale D, Postenka CO, Al-Katib W, Tuck AB. et al. The thrombin inhibitor Argatroban reduces breast cancer malignancy and metastasis via osteopontin-dependent and osteopontin-independent mechanisms. Breast Cancer Res Treat. 2008;112:243-54
56. Chu SC, Chiou HL, Chen PN, Yang SF, Hsieh YS. Silibinin inhibits the invasion of human lung cancer cells via decreased productions of urokinase-plasminogen activator and matrix metalloproteinase-2. Mol Carcinog. 2004;40:143-9
57. Wu K, Zeng J, Li L, Fan J, Zhang D, Xue Y. et al. Silibinin reverses epithelial-to-mesenchymal transition in metastatic prostate cancer cells by targeting transcription factors. Oncol Rep. 2010;23:1545-52
58. Gibbs JB. Mechanism-based target identification and drug discovery in cancer research. Science. 2000;287:1969-73
59. Hay M, Thomas DW, Craighead JL, Economides C, Rosenthal J. Clinical development success rates for investigational drugs. Nat Biotechnol. 2014;32:40-51
60. Gashaw I, Ellinghaus P, Sommer A, Asadullah K. What makes a good drug target? Drug Discov Today. 2012;17(Suppl):S24-30
61. Hopkins AL. Network pharmacology. Nat Biotechnol. 2007;25:1110-1
62. Allison M. NCATS launches drug repurposing program. Nat Biotechnol. 2012;30:571-2
63. Ashburn TT, Thor KB. Drug repositioning: identifying and developing new uses for existing drugs. Nat Rev Drug Discov. 2004;3:673-83
64. Brown AS, Patel CJ. A standard database for drug repositioning. Sci Data. 2017;4:170029
65. Wu H, Huang J, Zhong Y, Huang Q. DrugSig: A resource for computational drug repositioning utilizing gene expression signatures. PLoS One. 2017;12:e0177743
66. Corsello SM, Bittker JA, Liu Z, Gould J, McCarren P, Hirschman JE. et al. The Drug Repurposing Hub: a next-generation drug library and information resource. Nat Med. 2017;23:405-08
67. Hart T, Dider S, Han W, Xu H, Zhao Z, Xie L. Toward Repurposing Metformin as a Precision Anti-Cancer Therapy Using Structural Systems Pharmacology. Sci Rep. 2016;6:20441
68. Bambrah RK, Pham DC, Rana F. Argatroban in heparin-induced thrombocytopenia: rationale for use and place in therapy. Ther Adv Chronic Dis. 2013;4:302-4
69. Kapoor S. Emerging applications of argatroban in the management of systemic malignancies: potential benefits besides its primary role as an antithrombin agent. Circ Res. 2013;112:e24
70. Ryan DP, Hong TS, Bardeesy N. Pancreatic adenocarcinoma. N Engl J Med. 2014;371:2140-1
71. Koster A, Fischer KG, Harder S, Mertzlufft F. The direct thrombin inhibitor argatroban: a review of its use in patients with and without HIT. Biologics. 2007;1:105-12
72. Khan FM, Marquardt S, Gupta SK, Knoll S, Schmitz U, Spitschak A. et al. Unraveling a tumor type-specific regulatory core underlying E2F1-mediated epithelial-mesenchymal transition to predict receptor protein signatures. Nat Commun. 2017;8:198
73. Yeo SY, Ha SY, Yu EJ, Lee KW, Kim JH, Kim SH. ZNF282 (Zinc finger protein 282), a novel E2F1 co-activator, promotes esophageal squamous cell carcinoma. Oncotarget. 2014;5:12260-72
74. Wang LY, Hung CL, Chen YR, Yang JC, Wang J, Campbell M. et al. KDM4A Coactivates E2F1 to Regulate the PDK-Dependent Metabolic Switch between Mitochondrial Oxidation and Glycolysis. Cell Rep. 2016;16:3016-27
75. Millard CJ, Fairall L, Schwabe JW. Towards an understanding of the structure and function of MTA1. Cancer Metastasis Rev. 2014;33:857-67
76. Jiang D, Liang J, Noble PW. Hyaluronan as an immune regulator in human diseases. Physiol Rev. 2011;91:221-64
77. Lee-Sayer SS, Dong Y, Arif AA, Olsson M, Brown KL, Johnson P. The where, when, how, and why of hyaluronan binding by immune cells. Front Immunol. 2015;6:150
78. Itano N, Kimata K. Altered hyaluronan biosynthesis in cancer progression. Semin Cancer Biol. 2008;18:268-74
79. Kultti A, Li X, Jiang P, Thompson CB, Frost GI, Shepard HM. Therapeutic targeting of hyaluronan in the tumor stroma. Cancers (Basel). 2012;4:873-903
80. Nikitovic D, Tzardi M, Berdiaki A, Tsatsakis A, Tzanakakis GN. Cancer microenvironment and inflammation: role of hyaluronan. Front Immunol. 2015;6:169
81. Fridman WH, Zitvogel L, Sautès-Fridman C, Kroemer G. The immune contexture in cancer prognosis and treatment. Nat Rev Clin Oncol. 2017
82. Pateras IS, Havaki S, Nikitopoulou X, Vougas K, Townsend PA, Panayiotidis MI. et al. The DNA damage response and immune signaling alliance: Is it good or bad? Nature decides when and where. Pharmacol Ther. 2015;154:36-56
Author contact
![]() Corresponding author: Brigitte M. Pützer, MD, PhD, Institute of Experimental Gene Therapy and Cancer Research, Rostock University Medical Center, Rostock, Germany. Tel: +49(0)3814945068, Fax: +49(0)3814945062, Email: brigitte.puetzeruni-rostock.de
Corresponding author: Brigitte M. Pützer, MD, PhD, Institute of Experimental Gene Therapy and Cancer Research, Rostock University Medical Center, Rostock, Germany. Tel: +49(0)3814945068, Fax: +49(0)3814945062, Email: brigitte.puetzeruni-rostock.de
Citation styles
APA
Goody, D., Gupta, S.K., Engelmann, D., Spitschak, A., Marquardt, S., Mikkat, S., Meier, C., Hauser, C., Gundlach, J.P., Egberts, J.H., Martin, H., Schumacher, T., Trauzold, A., Wolkenhauer, O., Logotheti, S., Pützer, B.M. (2019). Drug Repositioning Inferred from E2F1-Coregulator Interactions Studies for the Prevention and Treatment of Metastatic Cancers. Theranostics, 9(5), 1490-1509. https://doi.org/10.7150/thno.29546.
ACS
Goody, D.; Gupta, S.K.; Engelmann, D.; Spitschak, A.; Marquardt, S.; Mikkat, S.; Meier, C.; Hauser, C.; Gundlach, J.P.; Egberts, J.H.; Martin, H.; Schumacher, T.; Trauzold, A.; Wolkenhauer, O.; Logotheti, S.; Pützer, B.M. Drug Repositioning Inferred from E2F1-Coregulator Interactions Studies for the Prevention and Treatment of Metastatic Cancers. Theranostics 2019, 9 (5), 1490-1509. DOI: 10.7150/thno.29546.
NLM
Goody D, Gupta SK, Engelmann D, Spitschak A, Marquardt S, Mikkat S, Meier C, Hauser C, Gundlach JP, Egberts JH, Martin H, Schumacher T, Trauzold A, Wolkenhauer O, Logotheti S, Pützer BM. Drug Repositioning Inferred from E2F1-Coregulator Interactions Studies for the Prevention and Treatment of Metastatic Cancers. Theranostics 2019; 9(5):1490-1509. doi:10.7150/thno.29546. https://www.thno.org/v09p1490.htm
CSE
Goody D, Gupta SK, Engelmann D, Spitschak A, Marquardt S, Mikkat S, Meier C, Hauser C, Gundlach JP, Egberts JH, Martin H, Schumacher T, Trauzold A, Wolkenhauer O, Logotheti S, Pützer BM. 2019. Drug Repositioning Inferred from E2F1-Coregulator Interactions Studies for the Prevention and Treatment of Metastatic Cancers. Theranostics. 9(5):1490-1509.
This is an open access article distributed under the terms of the Creative Commons Attribution (CC BY-NC) license (https://creativecommons.org/licenses/by-nc/4.0/). See http://ivyspring.com/terms for full terms and conditions.