Impact Factor
- Issue 14; 2026
- Issue 13; 2026
- Issue 12; 2026
- Issue 11; 2026
- Issue 10; 2026
- Volume 16; 2026
- Advance Articles
- Past Issues
- Cover Images
- Cover Suggestion
- Index & Coverage
- Special Issues
Introduction
Methods
Results
Discussion
Abbreviations
Supplementary Material
Acknowledgements
References
International Journal of Biological Sciences
International Journal of Medical Sciences
 Global reach, higher impact

Theranostics 2019; 9(5):1348-1357. doi:10.7150/thno.32043 This issue Cite
Research Paper
Real-Time Monitoring of Pharmacokinetics of Antibiotics in Biofilms with Raman-Tagged Hyperspectral Stimulated Raman Scattering Microscopy
Kideog Bae1, Wei Zheng1,2, Ying Ma1, Zhiwei Huang1 ![]()
1. Optical Bioimaging Laboratory, Department of Biomedical Engineering, Faculty of Engineering, National University of Singapore, Singapore 117576
2. Department of Medicine, Yong Loo Lin School of Medicine, National University of Singapore and National University Health System, Singapore 119260
Received 2018-12-6; Accepted 2019-1-5; Published 2019-2-14
Abstract

Antibiotics resistance developed by biofilms has posed a clinical challenge in the effective treatment of bacterial infections. However, the resistance mechanisms have not been well understood due to a lack of suitable tools for dynamic observation of the interplay between antibiotics and biofilm. In this work, with the use of rapid hyperspectral stimulated Raman scattering microscopy associated with an aryl-alkyne-based Raman tag synthesized, we investigate dynamic interactions between vancomycin and Staphylococcus aureus (S. aureus) biofilm to gain new insights into the resistance mechanisms of the biofilm.
Methods: We utilize spectral focusing hyperspectral stimulated Raman scattering microscopy ensued with multivariate curve resolution analysis to spectrally decompose S. aureus biofilm into its major components (i.e., bacteria and extracellular polymeric substances). Concurrently, vancomycin is conjugated with aryl-alkyne Raman tag (Raman peak at 2218 cm-1) for in vivo tracking of its uptake into biofilm without tissue interference.
Results: We find that vancomycin penetration is a non-uniform diffusion process with penetration depths limited by the preferential affinity to the cell clusters. Semi-quantitative analysis shows that the majority of vancomycin binds to the bacteria, achieving intracellular concentrations of up to 4- to 10- fold higher than the administered dosage. The diffusion constant of ~3.16 µm2/min based on the diffusion and antibiotic binding equations is obtained that well accounts for the antibiotic penetration into the biofilm. SRS longitudinal monitoring of antibiotic effect on the growth of biofilms shows that the antibiotics can eradicate the upper layer of the biofilm exposed to sufficient dosages, while the lower layer of the biofilm at a sub-inhibitory dose remains viable, eventually re-growing to significant bio-volume.
Conclusion: The Raman-tagged hyperspectral SRS microscopy developed is a powerful imaging tool for dynamic monitoring of inhibitory effects of antibiotics on the growing biofilm in vivo, which would facilitate the formulation of new antibiotics for more effective treatments of bacterial infections in near future.
Keywords: stimulated Raman scattering, Raman tag, coherent Raman scattering, antibiotics, biofilm
Introduction
Biofilm is known to exhibit enhanced antibiotic resistance by 10- to 1,000- fold compared to its genetically identical planktonic counterparts [1]. Consequently, clinical cases associated with bacterial infections (e.g., endocarditis and contamination of medical implants) are often relapsing or chronic after antibiotics treatments. Deeper knowledge of the resistance is necessary to seek clues for more effective use of the existing antibiotics or the development of new antibiotics. General resistance mechanisms found so far include cell wall modifications, enzymatic alternation of antibiotic binding affinity and genetic adaptations, but the limited penetration of the agents into the biofilm has been regarded as the primary cause of the resistance [2]. It has been suggested that the transport of antibiotics may be restricted by several factors such as adhesive extracellular polymeric matrix (EPS) or the increased effective path lengths due to the presence of large cell clusters in the transport paths [3, 4]. However, there has been no consensus on the major retardance factors against the solute transport.
For clear elucidation of the limited penetration, fluorescence imaging techniques have been routinely used to characterize the dynamics of antibiotics inside the biofilm such as penetration depths and diffusive permeabilities [5, 6]. But the interplay between the antibiotics and biofilm has not been investigated, despite the presumption that there could be a strong correlation between the limited antibiotic penetration and the complex biofilm structures comprising cell clusters and EPS [7]. The major limitation is due to the technical difficulty in concurrently labeling the bacteria and EPS, which consist of proteins, DNA and polysaccharides with a limited number of available fluorescent probes [8]. Raman microscopy, which does not require staining, can be a suitable alternative for biochemical studies on complex biological systems and thus, has been successfully used for multiplexed imaging and analysis of biofilms [9, 10]. However, the low quantum efficiency of the Raman effect (typically 10-6-10-8 relative to the excitation laser power) significantly prolongs the image acquisition time, limiting its use for rapid dynamic observations. Surface- enhanced Raman scattering (SERS), an enhancement process of the Raman signal up to ~1012-fold by bringing the metal substrates (e.g., Ag, Au, or Cu) near the analytes, is proven capable of real-time Raman imaging of biofilms [11]. The main drawback of SERS techniques is its poor reproducibility, owing to the high distance-dependence of the SERS intensity with the analytes (I~1/d12), hampering its quantitative biochemical analysis [12]. Hence, multiplexed, real-time and quantitative imaging methods are much in need to realize the dynamic visualization of the interactions between antibiotics and biofilm components during the antibiotic penetration.
Stimulated Raman scattering (SRS) microscopy is a vibrational spectroscopic imaging technique without nonresonant background interference, suited for quantitative imaging of biosamples with chemical specificity [13]. Under a tight focusing of two excitation laser beams (pump beam, ωp; Stokes beam, ωs < ωp), the matching of the beat frequency (ωp- ωs) to the targeted chemical bond in the sample leads to an enhancement of Raman signal by up to 104-fold. Further, a broader range of spectral information can be obtained by hyperspectral scanning techniques such as wavelength-sweeping [14], parallel multiplexing [15] and spectral focusing [16]. With the merits of its high biochemical selectivity and sensitivity, hyperspectral SRS microscopy has been utilized for rapid, label-free molecular imaging in biological systems [17, 18]. In parallel with the advances in SRS instrumentation, a new type of Raman imaging probes inspired from click chemistry [19] have been synthesized for complementary uses with SRS microscopy. For instance, the Raman tags/probes which have C≡C, C≡N or C≡D bonds [20] exhibit vibrational frequencies lying in the silent region (1800-2800 cm-1) without interference from Raman spectra of most biological/biomedical samples. Conjugation of the Raman tags with the targeted molecules thus renders a unique Raman peak to achieve high SRS imaging specificity without background interferences (termed as biorthogonal imaging) in biological and biomedical systems. Further, unlike fluorescent dyes which often suffer from signal fluctuations due to photobleaching and sensitivity to micro-environments, SRS signal is highly stable to perform reliable quantitation of the Raman-tagged molecules during the prolonged measurement period. It has been demonstrated that the Raman tag can be synergistically used with SRS microscopy for monitoring of metabolic processes and tracking of small molecules in biological systems [21, 22].
In this work, we apply the developed hyperspectral SRS microscopy coupled with a Raman tag to visualize the interplay between vancomycin (i.e., antibiotic) and Staphylococcus aureus (S. aureus) biofilm in real-time. Rapid hyperspectral SRS imaging based on spectral focusing followed by spectroscopic decomposition method (i.e., multivariate curve resolution analysis (MCR)) is used to generate 3-D label-free image of the S. aureus biofilm resolved into the bacteria and EPS components. Meanwhile, conjugation of the aryl-alkyne-based Raman tag synthesized to vancomycin allows in vivo monitoring of the antibiotic penetration and its dynamic interactions with the bacteria and EPS simultaneously. Utilizing the excellent photostability and linear dependence of SRS signal with the concentration of antibiotics, the intracellular dosages and diffusion constant of the penetrating vancomycin are further quantified. This study aims to uncover the factors that limit the penetration of vancomycin through real-time monitoring of antibiotic interactions with heterogeneous structures of S. aureus biofilm.
Methods
Spectral focusing hyperspectral SRS microscopy
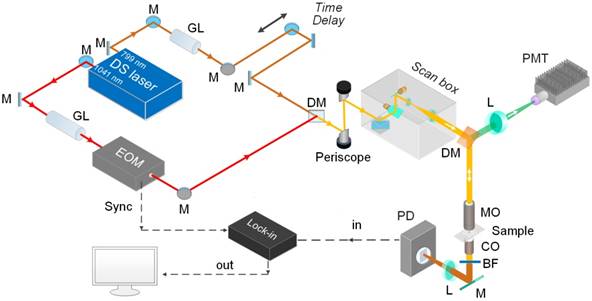
Figure 1 shows the schematic of spectral focusing hyperspectral SRS microscopy system developed for vibrational bioimaging [16]. A femtosecond pulse laser (Insight DS dual, Spectra-Physics) operating at a repetition rate of 80 MHz offers a 1041 nm laser pulse (pulse width of 120 fs) as the Stokes beam while the tunable output ranging from 680 to 1300 nm (pulse width of 100 fs) is used as pump beam. Electro-optical modulator (EOM) is used for amplitude-modulation of the Stokes beam at 20 MHz. The two excitation beams are collinearly combined at a dichroic mirror and passed to a laser-scanning microscope (MPM-4R, Thorlabs Inc.). An objective with high numerical aperture (NA) (XLUMPLFLN 20×, NA=1.0, Olympus Inc.) is used for tight focusing of the two beams onto the sample. After SRS processes on the sample, the two beams are collected by a condenser (CC Achromat/Aplanat, NA=1.4, Nikon) in the forward direction. A bandpass filter (795/75, Semrock) placed in the detection path spectrally blocks the Stokes beam from the collected beams. Thus, the pump beam alone will be detected by a photodiode (FDS1010, Thorlabs Inc.). The phase-sensitive detection is achieved by a lock-in amplifier (APE-Berlin) with a time constant of 19.6 µs (Supplementary Figure S1; and the mechanism of phase-sensitive detections and spectral focusing are described in details in Supplementary Material). To facilitate hyperspectral SRS imaging, the pump and Stokes laser beams are linearly chirped using 48 and 50 cm glass rods (SF-57), respectively, before microscope; and the resultant pulse widths of the pump and Stokes beams become 1.7 ps and 2 ps, respectively. The chirping enables us to scan the Raman shift differences by changing the inter-pulse delay between the pump and Stokes pulses (the working principle of spectral focusing technique is explained in Supplementary Material) [16]. A synchronization between the motorized delay stage and the frame grabber of the microscope is set up for automatic spectral scanning of the Raman shifts. The SRS intensity modulations due to the changes in the overlapping efficiency between the two beams are calibrated by measuring the intensity change of Rhodamine 6G over the same scanning range. For hyperspectral scanning from 2830- 2980 cm-1, the pump beam at 799 nm is used. For vancomycin-Raman tag imaging at 2218 cm-1, the pump beam is tuned to 846 nm. For two-photon excitation fluorescence (TPEF) imaging, a photomultiplier tube (PMT) detector is placed in the epi-detection path after a bandpass filter to block the laser leakage into the detector.
Schematic of spectral focusing hyperspectral SRS microscopy for bioimaging. M, mirror; GL, Glass rod; EOM, Electro-Optical Modulator; DM, dichroic mirror; GM; galvo mirror; MO, microscope objective; CO, condenser; BF, band-pass filter; L, lens; PD, photodiode; PMT, photomultiplier tube.
Multivariate curve resolution (MCR) analysis
MCR analysis is a post-processing algorithm that can be used to decompose the hyperspectral SRS image stack into the corresponding spectrum of each major species and concentration maps in the samples. The algorithm of MCR is built based on the bilinear model where the spectroscopic data matrix (D) of unknown mixture can be represented by the product of pure concentration maps (C) and pure spectra (ST) of the k species in the sample [23]:
(1)
where E is the error matrix indicating noise of the data. The number of components (k) can be determined by principal component analysis (PCA). For decomposition of chemical spectra, non-negative concentrations and spectra can be imposed as constraints. Given the initial spectra of S estimated by using simple-to-use interactive self-modeling mixture analysis (SIMPLISMA) [24], the C and ST are iteratively optimized using the alternative least squares method. In each round of iteration, the fitting performance is compared with the percentage of variance explained between the raw data and MCR spectra (r2). The iteration is ended when the convergence set of 1% is reached. The MCR algorithm is available in the MCR-ALS toolbox in MATLAB [25].
Cell culture
Staphylococcus aureus (ATCC 29213, ATCC) was subcultured in tryptic soy broth (TSB) media for 12 hr. After centrifuged at 4,000 rpm for 5 min, the collected pellet was diluted with phosphate buffer solution (PBS) for measurement of the optical density at 600 nm (OD600). The concentration of S. aureus is adjusted to show the OD600 of 0.03 (corresponding to S. aureus concentration of 4.5×10⁷ CFU/mL) and subsequently added to a 50-mm Poly-d-lysine-coated glass coverslip-bottom dishes (MatTek Co., Ashland, MA). The dish was left in an incubator at 37°C with fresh TSB media for 24 hr. The 1-day-old S. aureus biofilm was collected and washed with PBS 2 times before hyperspectral SRS imaging. To monitor the penetration of Van-PEPEA, 2 mg/ml of Van-PEPEA is directly injected into the buffer media under SRS microscope. To monitor the effect of Van-PEPEA on the biofilm, another batch of the 1-day-old S. aureus biofilm is incubated with 10 µg/ml of Van-PEPEA dispersed in TSB media. Each sample is collected for hyperspectral SRS imaging at the time points of 24 and 48 hr, respectively.
Results
Characterization of van-PEPEA
Vancomycin is an antibiotic drug against gram-positive bacteria including S. aureus. The glycopeptide chain of vancomycin facilitates binding to the peptidoglycan layer on the cell wall of S. aureus to prevent cross-linking of N-acetylmuramic acid (NAM)- and N-acetylglucosamine (NAG)-peptide subunits with the peptidoglycan matrix, which forms a building block of the bacterial cell wall (Figure 1A) [26]. Consequently, the cell-wall biosynthesis for cell divisions is inhibited. Further, the cross-linking makes the cell wall layer more permeable to induce selective inhibition of ribonucleic acid synthesis, thereby leading to the eventual death of the bacteria. Therefore, the physical binding to the cell wall is the critical step for the initiation of the antibiotic effect.
For specific tracking of vancomycin within the biofilm, we synthesized 2-(4-(phenylethynyl)phenyl)ethan-1-amine (PEPEA) Raman tag for conjugation with vancomycin (van-PEPEA; Figure 2B). We attached two phenyl rings at the both ends of the C≡C bond, which greatly enhance the polarizability and thus, increase the Raman scattering cross-section area of C≡C stretching as compared to a bare C≡C bond alone [27]. Such a synthesis strategy allows imaging of Raman-tagged vancomycin with high signal-to-noise ratio. We confirm the presence of the alkyne at 2218 cm-1 peak in the silent region (1800-2800 cm-1) of the biological samples (Supplementary Figure S2). Hence, vibrational resonance at 2218 cm-1 would allow highly specific SRS imaging of vancomycin without interference from the inherent biochemicals within the biofilm.
Vancomycin conjugated with PEPEA retains its antibiotic functionalities. (A) Schematic of the binding mechanism of vancomycin on the cell wall of S. aureus. (B) Synthesis process of van-PEPEA (Detailed information on the synthesis steps and NMR and mass spectroscopy (Supplementary Figure S6) characterization are available in the Supplementary Material). (C) Bacterial growth curves at the exponential growth phase under incubation in different media (culture medium; 10 µg/ml vancomycin in PBS; 10 µg/ml van-PEPEA in PBS) (Details of the experiments are described in the Supplementary Material). (D) SRS images of planktonic S. aureus after incubation with van-PEPEA for 30 min. The top image visualizes S. aureus at Raman shift of 2935 cm-1 (CH3 stretching of cellular proteins). The middle image is obtained at Raman shift of 2218 cm-1 due to resonance with C≡C in van-PEPEA. The bottom image is the overlay image of the two upper images. All the images are obtained within 10 s with 19.6 µs of pixel dwell time for 384 × 128 pixels (120 × 40µm) and averaging 4 times. The average powers of the pump beam (799 nm for 2935 cm-1; 846 nm for 2218 cm-1) and Stokes beam (1041 nm) on the samples are 20 and 40 mW, respectively.
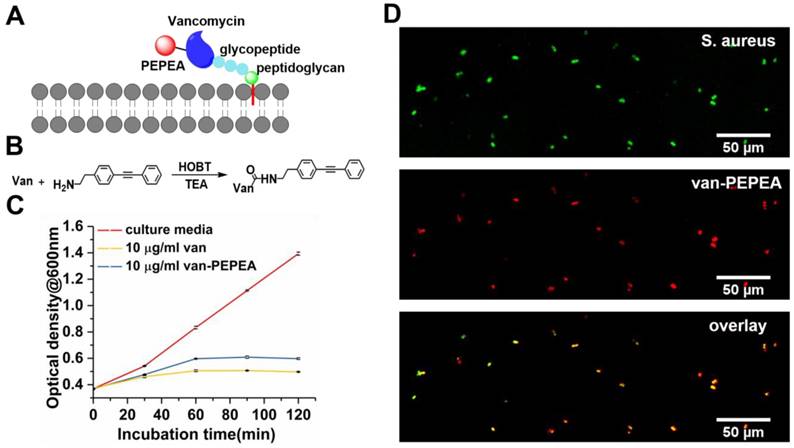
Next, we verify whether van-PEPEA retains the inherent functionality as antibiotics after conjugation with the Raman tag. We incubate planktonic (free-floating) S. aureus with van-PEPEA and measure the optical density of the sub-samples at 600 nm every 30 min. Figure 2C shows that the van-PEPEA can cause significant inhibition on the bacteria growth compared to the control. To further confirm that the inhibition is due to the binding of vancomycin, we apply SRS technique to image planktonic S. aureus samples at the 30-min time point. At the Raman shift of 2935 cm-1 of cellular proteins, general morphology of S. aureus can be imaged label-free. A good overlap between SRS images at 2218 cm-1 and 2935 cm-1 suggests that van-PEPEA has successfully bound onto S. aureus during incubation (Figure 2D). Further, we observe that SRS signal from van-PEPEA completely vanishes at the off-resonant Raman shift of 2260 cm-1, confirming the high affinity of alkyne Raman tag bound to vancomycin.
Spectral decomposition of S. aureus biofilm
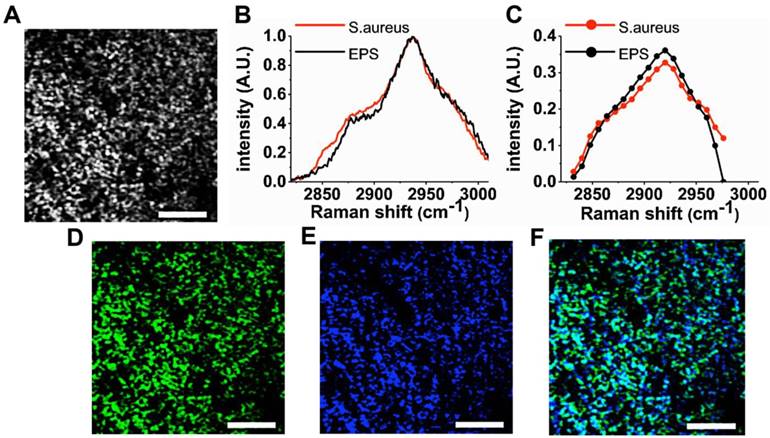
We demonstrate that hyperspectral SRS imaging technique can visualize the heterogeneous structures (e.g., bacteria and EPS) of the S. aureus biofilm. For hyperspectral imaging, we employ spectral focusing technique to achieve rapid scanning from 2830-2980 cm-1 without the need for wavelength sweeping [16]. Figure 3A shows a representative SRS image of the hyperspectral image stack. A movie of the entire SRS image stack and the corresponding SRS spectrum are available in the supplementary information (Supplementary Movie S1 and Supplementary Figure S3). The representative image clearly delineates the bacteria clusters due to the strong resonance with CH3 stretching of cellular proteins at 2935 cm-1 at subcellular resolution (lateral resolution of ~500 nm) offered by SRS microscopy. The weak SRS signal is also detected concurrently from EPS between adjacent bacteria, since EPS is a composite of different molecules (polysaccharides, extracellular enzymes and DNA, etc) that exhibit CH3 stretching as well. As a result, the specificity for different biofilm components is generally low in the raw SRS images. In order to improve the specificity for bacteria and EPS, the raw hyperspectral SRS image stack is decomposed using the multivariate curve resolution (MCR) analysis. Here, we set the number of the major components in the sample as two, as the biofilm mainly consists of bacteria and EPS in a broad sense. Subsequently, we perform MCR analysis as described in Materials and Methods with hyperspectral SRS image stack as input. In the data set, r2 was 95% with convergence condition of 0.1%. The MCR spectra obtained show a high resemblance with spontaneous Raman spectra measured in an independent experiment (Figure 3B and 3C). Based on the comparison with the known spontaneous Raman spectra, the pair of MCR spectra and concentration profiles are labelled. The image corresponding to the pure S. aureus (Figure 3D) gives a more specific visualization of the bacteria. Similarly, the concentration profile (Figure 3E) represents EPS wrapping around the bacteria cluster as the extracellular matrix. Therefore, the morphology described in each MCR image matches their identities determined by the spontaneous Raman spectra. The heterogeneous structure of the biofilm is more vivid in the composite image (Figure 3F) compared to the raw SRS image (Figure 3A). For 3D visualization, z-scanning is performed with an interval of 1.5 μm along the z-direction into the biofilm (Supplementary Movie S2).
Visualization of the heterogeneous structure of S. aureus biofilm. (A) Representative SRS image obtained at 2935 cm-1 (CH3 stretching of proteins). The low image contrast between S. aureus and extracellular matrix is due to the non-specific distribution of proteins. (B) Spontaneous Raman spectra of S. aureus and EPS. The pure samples of S. aureus and EPS separated from a 1-day-old S. aureus biofilm and spectral measurements are performed using micro-Raman spectroscopy (Invia, Renishaw). (C) Pure spectra decomposed from the average SRS spectra (Figure S3) using multivariate curve resolution (MCR) analysis. Corresponding concentration profiles for S. aureus (D) and EPS (E) and their composite image. (F) For MCR analysis, a stack of SRS image from 2830- 2980 cm-1 with an interval of 15 cm-1 is used as an input. The stack of 11 images is obtained within 40 s with 19.6 µs of pixel dwell time for 128 × 128 pixels (40 × 40µm) and averaging 4 times. Scale bar = 10 µm.
Monitoring of penetration of van-PEPEA into biofilm in vivo
We have investigated the penetration of van-PEPEA into the biofilm in vivo. We directly apply van-PEPEA to the biofilm immersed in PBS (clocked at t=0 min) and perform x-z line scan (z-step size of 1.5 μm along the z-direction into the biofilm (x = 40 µm, z = 22.5 µm); 5-min interval from t = 5 to 60 min). Figure 4A displays the snapshot of the evolution of van-PEPEA (red) within the visualized biofilm (Video is available in Supplementary Movie S3). In general, the penetration of van-PEPEA barely reaches the largest depth of 22.5 µm within the field-of-view. While some transport solute reaches as far as 15 µm, the maximum penetration depths are even shorter in the other transport paths (10 µm; Figure 4B), suggesting the considerable variations in penetration depths achieved across the biofilm. The z-profiles in Figure 4B show the fluctuations of van-PEPEA signal along the z-direction, implying local modulations of the antibiotic penetration into the biofilm.
Dynamic interactions between van-PEPEA and S. aureus biofilm. (A) Composite x-z SRS images (Green: S. aureus; Blue: EPS; Red: van-PEPEA) depicting the penetration of van-PEPEA over time (t= 0 to 60 min). The green and blue channels are obtained by MCR decomposition of the hyperspectral SRS images of the S. aureus biofilm. Distribution of van-PEPEA is obtained by tuning Raman shift to 2218 cm-1. Each x-z plane is obtained within 15 s with 9.6 µs of pixel dwell time for 128 × 84 pixels (40 × 40 µm) and averaging 4 times. (B) Intensity profiles of van-PEPEA acquired along the dotted lines (orange and blue) on the red channel of the composite image at t=60 min. (C) Mander's coefficients between van-PEPEA and S. aureus (Red), and van-PEPEA and EPS (Black) as a function of time. At each time point, the coefficients are longitudinally measured from 5 ROIs (n=5; range of standard deviation=4.20-9.03% for S. aureus; 5.28-16.2% for EPS). Scale bar = 10 µm.
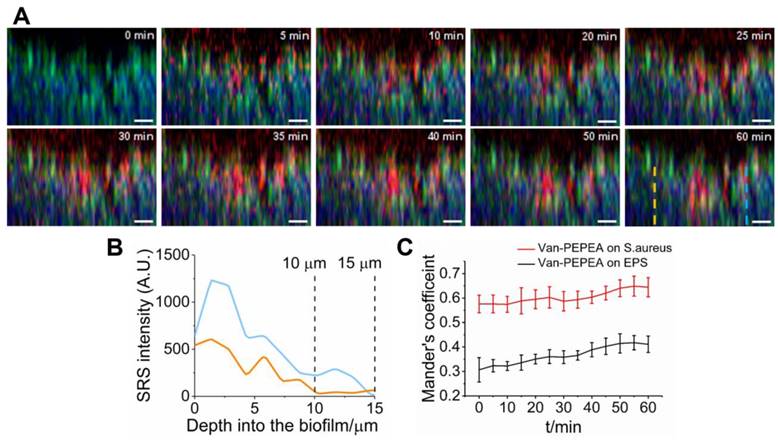
To further assess the extent of interactions between the van-PEPEA and biofilm, we quantify the co-localizations between van-PEPEA and the components of the biofilm in terms of the Mander's overlap coefficient, which determines the proportions of the pixels in the van-PEPEA channel overlapping with S. aureus and EPS channels, respectively [28]. Figure 4C shows the increasing trends of the Mander's coefficients over time, indicating a continuous uptake of van-PEPEA. In general, co-localization between van-PEPEA and S. aureus is higher than EPS. In addition, the high coefficient value marked at the beginning of penetration implies that the binding is in a rapid fashion.
Quantitative analysis of diffusion of van-PEPEA into biofilms
Here, we quantitatively characterize the diffusion of van-PEPEA into biofilms. First, we obtain the intracellular concentration map of van-PEPEA. In the SRS image at 2218 cm-1, the direct conversion of the alkyne signal into the corresponding local concentrations of van-PEPEA is permitted due to the linear concentration dependence of SRS as well as the high photostability and specificity of the alkyne signal. A standard curve (Supplementary Figure S4) based on the pure van-PEPEA of known concentrations is used for the calibration. The uneven penetration of van-PEPEA becomes more evident in the concentration maps (Figure 5A and Supplementary Movie S4), highlighting the selective accumulation of van-PEPEA due to the heterogeneous architecture of the biofilm. The final concentrations are ranged from 16 to 40 mg/ml. To further determine the diffusivity of the biofilm, we construct an analytical model by combining the Fick's second law (to describe diffusion) [29] and the law of mass action [30] to investigate the 1D diffusion and binding of van-PEPEA to the S. aureus and EPS simultaneously.
Quantification of van-PEPEA diffusion into biofilm (A) Concentration map of van-PEPEA distributions in Figure 4A. The SRS intensity of van-PEPEA is calibrated based on the standard calibration curve of known van-PEPEA concentrations (Supplementary Figure S4). Scale bar = 10 µm. (B) in vivo evolution profiles of van-PEPEA at different depths. Dashed lines represent the fitting results using Eq. 1 for each depth. The range of standard error is 0.822-11.6%. R2 values are ranged from 0.47-0.89 with the average of 0.77. For better display, the standard error bar is multiplied by 5.
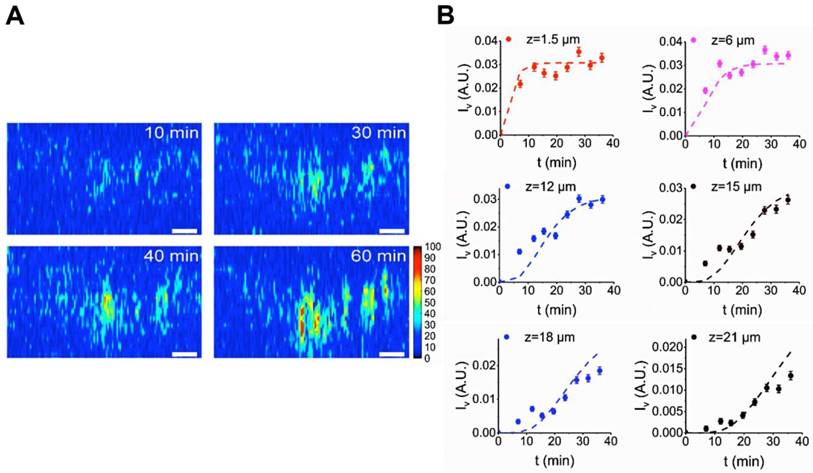
(2)
where D = diffusion constant of biofilm, ISA = intensity of the MCR concentration map for S. aureus, IEPS = intensity of the MCR concentration map for EPS, Iv = intensity of the SRS image at 2218 cm-1 for van-PEPEA, and = fitting constants. The detailed derivation of the model can refer to Supplementary Material. Figure 5B shows the fitting results of the evolution profile of van-PEPEA at each depth interval (for simplicity, the display only shows a few intervals, but for actual fitting, the full range of 1.5 µm interval is utilized). The diffusion coefficient is estimated to be ~3.16 µm2/min. Given
 , the average penetration depth of van-PEPEA for 60 min can be estimated to be ~13.8 µm, which is consistent with our observations in Figure 4.
Monitoring of inhibitory effect of van-PEPEA on S. aureus biofilm
Although it has been reported that vancomycin fails to eradicate biofilms due to the increased antibiotic resistance [31], there has been a lack of longitudinal studies to assess the antibiotic efficacy due to the difficulty in simultaneously monitoring the growing biofilm and vancomycin over time. Here, we demonstrate that the hyperspectral SRS imaging associated with aryl-alkyne Raman-tag can facilitate the longitudinal assessment of the inhibitory effect of vancomycin on the growing biofilm in vivo. Figure 6A shows that at 24 hr after treatment with vancomycin, the S. aureus biofilm exhibits reduced growth with more regions being void of cells compared to the control. After quantitative analysis of the bacterial growth by calculating the fraction of the bio-volume in the entire field-of-volume (Figure 6B), we found that the treated biofilm is about 2-fold smaller in volume than the control sample (unpaired two-sided Student's t-test, p < 0.01). Evidently, the extensive distribution of vancomycin over the treated biofilm (red channel) suggests the action of the inhibitory effect. Despite the significant reduction of the treated biofilm, complete eradication is hardly achieved, possibly due to the limited penetration to the lower layers of the biofilm as observed repeatedly in our earlier results.
Inhibitory effect of van-PEPEA on the growth of the 1-day-old S. aureus biofilm. (A) 3D visualization of S. aureus (green) and van-PEPEA (red) distributions after incubation with van-PEPEA for 24 and 48 hr. The x-z orthogonal view indicates the thickness of growing S. aureus biofilm. (B) Measurements of the volume fractions of S. aureus from Figure 6A. The number of white voxels from binarized images is divided by the total number of the voxels in the field-of-volume (40×40×10 µm; voxel size ~0.3×0.3×1.5 µm). (C) Average SRS intensity of van-PEPEA distributed over the biofilm incubated for 24-72 hr, reflecting the amount of van-PEPEA present in the biofilm. All measurements are repeated on 8 different images for statistical validation (n=8). For hyperspectral SRS imaging, a stack of 11 images covering 2830-2980 cm-1 is obtained within 40 s with 19.6µs of pixel dwell time for 128 × 128 pixels (40 × 40µm) and averaging 4 times. For SRS imaging of van-PEPEA, SRS image at Raman shift of 2218 cm-1 is obtained within 3 s with the same imaging parameters. 3D SRS images are obtained by z-scanning over 10 µm with an interval of 2 µm. Scale bar = 10 µm.
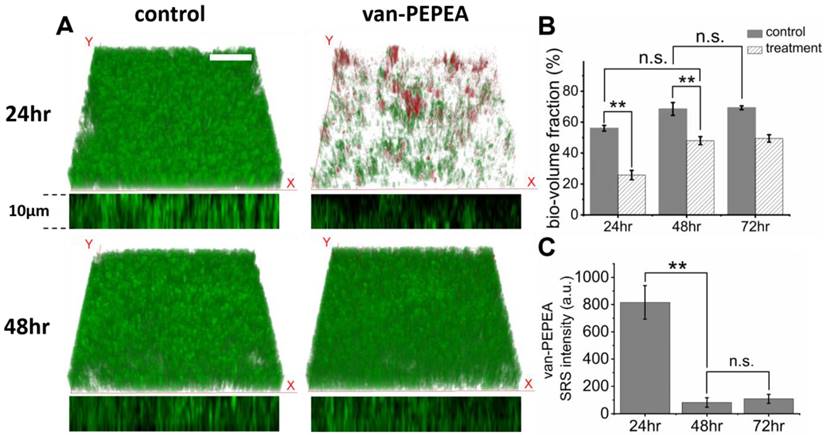
Consequently, at a longer incubation time (48 hr), the biofilm begins to re-grow to a significant volume. We find that it shows no significant difference from the control at 24 hr (unpaired two-sided Student's t-test, p>0.05), suggesting that from 24-48 hr, the treated biofilm has grown as much as the control from 0-24 hr. Meanwhile, the amount of vancomycin within the biofilm is found to be significantly reduced (Figure 6C), indicating that the bound S. aureus has been cleared from the biomass after being killed under the antibiotic effect, and eventually van-PEPEA is released back to the media.
Discussion
By taking advantages of the rapid hyperspectral SRS microscopy coupled with aryl-alkyne Raman tag synthesized, we realize for the first time the dynamic visualization of the interplay between vancomycin and biofilm components in vivo, gaining new insights into the mechanism of antibiotic resistance.
For visualization of the key components in the biofilm (bacteria and EPS), we demonstrate that Raman-tagged hyperspectral SRS imaging technique followed by MCR analysis can generate separate MCR concentration maps of the S. aureus and EPS with high specificity (Figure. 3D-F). We cross-validate each MCR result against corresponding fluorescence images obtained using SYTO 9 (Thermo Fisher Scientific) to stain the bacteria and Fluorescein-labeled Aleuria Aurantia Lectin (AAL) (Vector Laboratories Inc.) to visualize the polysaccharides in EPS (Supplementary Figure S5). The two types (SRS and fluorescence) of the images highlight the same target features, indicating a positive validation outcome. It is noted that in the regions where bacteria clusters are far apart, EPS is absent as well. These regions are likely to be the water channel in which SRS signal is void in the Raman band from 2830-2980 cm-1 [32]. Thus, the scanning range of the wavenumbers selected yields desirable MCR results that optimally decompose the hyperspectral SRS images into the specific components of the cells and EPS only. Infrared (IR) and Raman spectroscopy may be suggested as alternative tools to achieve the same spectral decomposition between the bacteria and EPS within the biofilm [33]. However, a rapid acquisition of 2/3D biofilm images would not be feasible with spontaneous Raman or IR imaging due to the poor signal-to-noise ratio or strong water absorption. Our spectral focusing hyperspectral SRS imaging technique proves the capability to acquire highly specific images of S. aureus and EPS within 40 s, which can be utilized to study dynamic interactions with vancomycin.
In our dynamic imaging (Fig. 4), limited penetration of vancomycin is evident as a congruent result with earlier studies with confocal fluorescence microscopy. Several explanations have been provided for the observation. Steward attributed it to the dense cell clusters that have increased the effective path length of the penetrating antibiotics [3]. Alternatively, the presence of the adhesive extracellular polymeric matrix (EPS) that can trap the antibiotic is proposed as the cause of the limited penetration [4]. However, Mander's co-localization analysis shows that co-localization of van-PEPEA with S. aureus is significantly higher than EPS due to the preferential binding affinity of vancomycin to the bacteria over EPS. Consequently, the regions of higher cell density trap the antibiotics in the midway, limiting their penetration depths. Similarly, the variations of penetration depths across the biofilm is likely caused by the uneven distributions of the bacteria. This implies that the limited penetration is mainly caused by binding of the antibiotic to the bacteria. On contrary, we notice a less vancomycin overlapping with the EPS, weakening the hypothesis on the role of EPS as a barrier against antibiotics.
The intracellular concentration mapping of van-PEPEA within the biofilm indicates that the regions penetrated by van-PEPEA can be treated with antibiotics of 4 to 10 folds higher concentrations than the administered dosage of 2 mg/ml. Consequently, in the longitudinal monitoring of the growing biofilms, the upper layer of the biofilm can be eradicated after 24 hr incubation with van-PEPEA. On the other hand, the bacteria at the lower layer, which are exposed to a sub-inhibitory dose of the drug due to the limited penetration, remain viable and eventually re-grow into substantial biomass after 48 hr incubation. Such an observation is supported by SRS results from our analytical model. Assuming that the typical thickness of a 3-day-old S. aureus biofilm is 100 µm [34], the estimated diffusion coefficient (3.16 µm2/min) requires 3160 min or 53 hrs to reach the bottom layer of the biofilm, a consistent prediction with our SRS imaging observations. Therefore, our quantitative analysis and longitudinal monitoring of the biofilm growth provides an evidence that the antibiotic resistance of biofilm observed is developed from the limited drug penetration.
In summary, we demonstrate that hyperspectral SRS microscopy associated with aryl-alkyne Raman tag synthesized is a powerful imaging technique for dynamic monitoring of the interplay among bacteria, EPS and vancomycin in vivo. We discover that the penetration of vancomycin within the biofilm is non-uniform with limited penetration depths achieved. Semi-quantitative analysis on the degree of overlapping between the vancomycin and the key biofilm components reveals that the phenomenon is attributed to the rapid binding of vancomycin to the bacteria. Further longitudinal monitoring of the antibiotic effects on the growth of the biofilms confirms that the shallower regions (< 15 µm) in the biofilm show eradiation of the bacteria, while the bacteria at the deeper regions remains viable, eventually re-growing to a significant volume. Therefore, Raman-tagged hyperspectral SRS imaging technique developed in this work has ability for pharmacokinetic studies of antibiotics as well as for longitudinal monitoring of antibiotic effects on biofilms, which would facilitate the formulation of new antibiotics for more effective treatments of bacterial infections in near future.
Abbreviations
EPS: extracellular polymeric matrix; SRS: stimulated Raman scattering; DNA: deoxyriboNucleic Acid; SERS: surface-enhanced Raman scattering; S. aureus: staphylococcus aureus; EOM: electro-optical modulator; TPEF: two-photon excited fluorescence; PMT: photomultiplier tube; MCR: multivariate curve resolution; PCA: principal component analysis; PEPEA: 2-(4-(phenylethynyl)phenyl)ethan-1-amine; AAL: aleuria aurantia lectin.
Supplementary Material
Supplementary figures and video legends.
Supplementary video 1.
Supplementary video 2.
Supplementary video 3.
Supplementary video 4.
Acknowledgements
This work was supported by the Academic Research Fund (AcRF)- Tier 1 and Tier 2 from Ministry of Education (MOE) (MOE2014-T2-1-010), and the National Medical Research Council (NMRC) (NMRC/TCR/016-NNI/2016; NMRC/BnB/0012b/ 2014; NMRC/BnB/0012c/2014), Singapore.
Competing Interests
The authors have declared that no competing interest exists.
References
1. Archer NK, Mazaitis MJ, Costerton JW, Leid JG, Powers ME, Shirtliff ME. Staphylococcus aureus biofilms: properties, regulation, and roles in human disease. Virulence. 2011;2:445-459
2. Mah TFC, O'Toole GA. Mechanisms of biofilm resistance to antimicrobial agents. Trends Microbiol. 2001;9:34-39
3. Stewart PS. Diffusion in biofilms. J Bacteriol. 2003;185:1485-1491
4. Teirlinck E, Samal SK, Coenye T, Braeckmans K. Penetrating the Bacterial Biofilm: Challenges for Antimicrobial Treatment. In: Functionalized Nanomaterials for the Management of Microbial Infection: A Strategy to Address Microbial Drug Resistance. 2016:49-76
5. Jefferson KK, Goldmann DA, Pier GB. Use of confocal microscopy to analyze the rate of vancomycin penetration through Staphylococcus aureus biofilms. Antimicrob Agents Chemother. 2005;49:2467-2473
6. Daddi Oubekka S, Briandet R, Fontaine-Aupart MP, Steenkeste K. Correlative time-resolved fluorescence microscopy to assess antibiotic diffusion-reaction in biofilms. Antimicrob Agents Chemother. 2012;56:3349-3358
7. Marquès C, Tasse J, Pracros A, Collin V, Franceschi C, Laurent F. et al. Effects of antibiotics on biofilm and unattached cells of a clinical Staphylococcus aureus isolate from bone and joint infection. J Med Microbiol. 2015;64:1021-1026
8. Flemming HC, Wingender J. The biofilm matrix. Nat Rev Microbiol. 2010;8:623-633
9. Pätzold R, Keuntje M, Anders-Von Ahlften A. A new approach to non-destructive analysis of biofilms by confocal Raman microscopy. Anal Bioanal Chem. 2006;386:286-292
10. Sandt C, Smith-Palmer T, Pink J, Brennan L, Pink D. Confocal Raman microspectroscopy as a tool for studying the chemical heterogeneities of biofilms in situ. J Appl Microbiol. 2007;103:1808-1820
11. Ivleva NP, Wagner M, Szkola A, Horn H, Niessner R, Haisch C. Label-free in situ SERS imaging of biofilms. J Phys Chem B. 2010;3:548-556
12. Otto A. On the significance of Shalaev's “hot spots” in ensemble and single-molecule SERS by adsorbates on metallic films at the percolation threshold. J Raman Spectrosc. 2006;37:937-947
13. Freudiger CW, Min W, Saar BG, Lu S, Holtom GR, He C. et al. Label-free biomedical imaging with high sensitivity by stimulated Raman scattering microscopy. Science. 2008;322:1857-1861
14. Lu F-K, Basu S, Igras V, Hoang MP, Ji M, Fu D. et al. Label-free DNA imaging in vivo with stimulated Raman scattering microscopy. Proc Natl Acad Sci. 2015;112:11624-11629
15. Liao C-S, Wang P, Wang P, Li J, Lee HJ, Eakins G. et al. Spectrometer-free vibrational imaging by retrieving stimulated Raman signal from highly scattered photons. Sci Adv. 2015;1:e1500738-e1500738
16. Bae K, Zheng W, Lin K, Lim SW, Chong YK, Tang C. et al. Epi-Detected Hyperspectral Stimulated Raman Scattering Microscopy for Label-Free Molecular Subtyping of Glioblastomas. Anal Chem. 2018;90:10249-10255
17. Ji M, Lewis S, Camelo-Piragua S, Ramkissoon SH, Snuderl M, Venneti S. et al. Detection of human brain tumor infiltration with quantitative stimulated Raman scattering microscopy. Sci Transl Med. 2015;7:309ra163
18. Wang Z, Zheng W, Hsu SC-Y, Huang Z. Optical diagnosis and characterization of dental caries with polarization-resolved hyperspectral stimulated Raman scattering microscopy. Biomed Opt Express. 2016;7:1284-1293
19. Kolb HC, Sharpless KB. The growing impact of click chemistry on drug discovery. Drug Discov Today. 2003;8:1128-1137
20. Yamakoshi H, Dodo K, Palonpon A, Ando J, Fujita K, Kawata S. et al. Alkyne-tag Raman imaging for visualization of mobile small molecules in live cells. J Am Chem Soc. 2012;134:20681-20689
21. Wei L, Hu F, Shen Y, Chen Z, Yu Y, Lin CC. et al. Live-cell imaging of alkyne-tagged small biomolecules by stimulated Raman scattering. Nat Methods. 2014;53:5827-5831
22. Tipping WJ, Lee M, Serrels A, Brunton VG, Hulme AN. Imaging drug uptake by bioorthogonal stimulated Raman scattering microscopy. Chem Sci. 2017;8:5606-5615
23. Ruckebusch C, Blanchet L. Multivariate curve resolution: A review of advanced and tailored applications and challenges. Anal Chim Acta. 2013;765:28-36
24. Windig W, Guilment J. Interactive Self-Modeling Mixture Analysis. Anal Chem. 1991;63:1425-1432
25. Jaumot J, Gargallo R, De Juan A, Tauler R. A graphical user-friendly interface for MCR-ALS: A new tool for multivariate curve resolution in MATLAB. Chemom Intell Lab Syst. 2005;76:101-110
26. Watanakunakorn C. Mode of action and in-vitro activity of vancomycin. J Antimicrob Chemother. 1984;14:7-18
27. Eisler S, Slepkov AD, Elliott E, Luu T, McDonald R, Hegmann FA. et al. Polyynes as a model for carbyne: Synthesis, physical properties, and nonlinear optical response. J Am Chem Soc. 2005;127:2666-2676
28. Manders EMM, Verbeek FJ, Aten JA. Measurement of co-localization of objects in dual-colour confocal images. J Microsc. 1993;169:375-382
29. Philibert J. One and a Half Century of Diffusion: Fick, Einstein, Before and Beyond. Diffus Fundam. 2006;4:6.1-6.19
30. Klotz IM. The application of the law of mass action to binding by proteins; interactions with calcium. Arch Biochem. 1946;9:109-117
31. Claessens J, Roriz M, Merckx R, Baatsen P, Van Mellaert L, Van Eldere J. Inefficacy of vancomycin and teicoplanin in eradicating and killing Staphylococcus epidermidis biofilms in vitro. Int J Antimicrob Agents. 2015;45:368-375
32. Costerton JW, Lewandowski Z, DeBeer D, Caldwell D, Korber D, James G. Biofilms, the customized microniche. J Bacteriol. 1994;176:2137-2142
33. Wartewig S, Neubert RHH. Pharmaceutical applications of Mid-IR and Raman spectroscopy. Adv Drug Deliv Rev. 2005;57:1144-1170
34. Mann EE, Rice KC, Boles BR, Endres JL, Ranjit D, Chandramohan L. et al. Modulation of eDNA release and degradation affects Staphylococcus aureus biofilm maturation. PLoS One. 2009;4:e5822
Author contact
![]() Corresponding author: Dr. Zhiwei Huang, Optical Bioimaging Laboratory, Department of Biomedical Engineering, Faculty of Engineering, National University of Singapore, 9 Engineering Drive 1, Singapore 117576. Tel: +65- 6516-8856, Fax: +65- 6872-3069, E-mail: biehzwedu.sg
Corresponding author: Dr. Zhiwei Huang, Optical Bioimaging Laboratory, Department of Biomedical Engineering, Faculty of Engineering, National University of Singapore, 9 Engineering Drive 1, Singapore 117576. Tel: +65- 6516-8856, Fax: +65- 6872-3069, E-mail: biehzwedu.sg