Impact Factor
- Issue 10; 2026
- Issue 9; 2026
- Issue 8; 2026
- Issue 7; 2026
- Issue 6; 2026
- Volume 16; 2026
- Advance Articles
- Past Issues
- Cover Images
- Cover Suggestion
- Index & Coverage
- Special Issues
Introduction
Materials and Methods
Results
Discussion
Abbreviations
Supplementary Material
Acknowledgements
References
International Journal of Biological Sciences
International Journal of Medical Sciences
 Global reach, higher impact

Theranostics 2019; 9(4):945-960. doi:10.7150/thno.30516 This issue Cite
Research Paper
MicroRNA-23a-3p Inhibits Mucosal Melanoma Growth and Progression through Targeting Adenylate Cyclase 1 and Attenuating cAMP and MAPK Pathways
Meng Ma1,2*, Jie Dai1*, Huan Tang1, Tianxiao Xu1, Sifan Yu1, Lu Si1, Chuanliang Cui1, Xinan Sheng1, Zhihong Chi1, Lili Mao1, Xiaowen Wu1, Lu Yang1, Huan Yu1, Siming Li1, Bin Lian1, Bixiang Tang1, Xuan Wang1, Xieqiao Yan1, Xue Bai1, Li Zhou1, Yan Kong1 ![]() , Jun Guo1
, Jun Guo1 ![]()
1. Key Laboratory of Carcinogenesis and Translational Research (Ministry of Education/Beijing), Department of Renal Cancer and Melanoma, Peking University Cancer Hospital and Institute, Beijing 100142, China
2. Department of Radiotherapy, Beijing Chest Hospital, Capital Medical University, Beijing Tuberculosis and Thoracic Tumor Research Institute, Beijing 101149, China.
*M. Ma and J. Dai contributed equally to this work
Received 2018-10-8; Accepted 2018-12-22; Published 2019-1-25
Abstract

Mucosal melanoma (MM) is the second most common melanoma subtype in Asian populations. Deregulation of microRNAs (miRNAs) has been extensively investigated in various cancers, including cutaneous melanoma. However, the roles of miRNAs in MM are unclear. In this study, we carried out miRNA profiling in MM, and we investigated the clinical and biological roles of miR-23a-3p in MM.
Methods: miRNA expression in MM was profiled by miRNA microarray analysis. The expression of miR-23a-3p was quantitated by qRT-PCR in a cohort of 117 patients with MM, and its prognostic significance was evaluated. The biological effect of miR-23a-3p was demonstrated by both in vitro and in vivo studies through ectopic expression of miR-23a-3p. The target gene of miR-23a-3p and molecular pathway influenced by it was characterized using in silico target prediction tools, dual luciferase reporter assays, knockdown, and rescue experiments.
Results: Microarray and qRT-PCR results showed that the miR-23a-3p level was substantially lower in MM, and low miR-23a-3p expression was significantly associated with poor outcomes. Ectopic expression of miR-23a-3p suppressed MM cell proliferation, migration, invasion, and tumorigenicity, indicating that miR-23a-3p has a tumor-suppressive role in MM. Mechanistic investigations identified adenylate cyclase 1 (ADCY1) as a direct target of miR-23a-3p in MM, and knockdown of ADCY1 recapitulated all the phenotypic characteristics of miR-23a-3p overexpression. Targeting of ADCY1 by miR-23a-3p resulted in the suppression of cyclic adenosine monophosphate (cAMP) and mitogen-activated protein kinase (MAPK) signaling pathways.
Conclusions: Our data highlight the molecular etiology and clinical significance of miR-23a-3p in MM and reveal its major target and biological function. miR-23a-3p may represent a new prognostic biomarker or therapeutic target in MM.
Keywords: miR-23a-3p, ADCY1, mucosal melanoma, cAMP, MAPK
Introduction
Mucosal melanoma (MM) is a very important subtype of melanoma with an incidence of 22.6-39.6% in Asian populations [1, 2], whereas it accounts for only approximately 1.3% of all melanomas in Caucasians [3]. MM originates from melanocytes residing within the mucosal surfaces of the body. The most common primary site of MM is the head and neck region, including the nasal and oral cavities, followed by the anorectal and genital mucosal surfaces. Rare sites of origin include the pharynx/larynx, esophagus, small intestine, urinary tract, and gallbladder [4, 5]. As MM occurs in occult sites and always has nonspecific symptoms, MM is often diagnosed at a late stage, resulting in poor survival compared to cutaneous melanoma (CM) and ocular melanoma (OM) [5]. The 5-year survival of MM is only 34% (range 3-69%), compared with 89.0% of CM and 78.4% of OM [6]. In addition to the different epidemiologic patterns and clinical manifestations, CM is strongly associated with exposure to UV light; however, the etiology and pathogenesis of MM remains unclear [4, 7]. Therefore, the identification of disease-associated biomarkers and therapeutic targets will substantially contribute to the development of effective MM diagnosis and treatment methods.
miRNAs are a class of evolutionarily conserved noncoding RNAs that play crucial roles in post-transcriptional regulation through base pairing with 3'-untranslated regions (3'-UTRs) of target genes [8, 9]. This interaction results in mRNA cleavage or repression of productive translation, and consequently, in silencing of the target gene [9]. Increasing evidence shows that deregulation of miRNAs is a crucial event in tumor progression, and miRNA expression signatures have been reported to be associated with tumor staging, disease recurrence, drug resistance, and survival [10-12]. miRNAs are much more stable than mRNAs in formalin-fixed paraffin-embedded (FFPE) tissues or biobank-stored animal or blood samples, allowing their use as biomarkers even after years of storage [13]. A 16-miRNA signature including miR-23a-3p was analyzed for stage II and III colon cancer, as a low 16-miRNA level was associated with better 5-year disease-free survival (DFS) in the study cohort [14]. Stark and colleagues identified a panel of 17 melanoma-related miRNAs was able to predict the stage, recurrence, and survival of patients based on their expression in FFPE melanoma tissues [15]. Thus, cancer-specific miRNA expression signatures may be useful as diagnostic and prognostic evaluation tools.
To date, the involvement and regulatory mechanisms of miRNAs in MM oncogenesis and their therapeutic significance for MM remain poorly understood. Here, we identified miR-23a-3p as a potential prognostic factor for predicting the outcome of MM patients. Moreover, in vitro and in vivo studies demonstrated that miR-23a-3p overexpression suppressed MM cell growth and metastasis by regulating cAMP and MAPK signaling pathways by directly targeting ADCY1. Overall, our data revealed a mechanism underlying the tumorigenesis and progression of MM mediated by miR-23a-3p induced genetic pathways.
Materials and Methods
Patient samples and cell lines
FFPE and fresh-frozen MM tissue samples from patients hospitalized in the Peking University Cancer Hospital between January 2012 and December 2016 were analyzed for miR-23a-3p as well as ADCY1 expression. The diagnosis of melanoma was confirmed by hematoxylin and eosin (H&E) staining and immunohistochemistry (IHC) for melanoma markers (HMB-45, S-100, or MART-1) of the samples. Clinical and pathological data, including gender, age, primary anatomic site, tumor-node-metastasis (TNM) stage, ulceration status, and tumor thickness (Breslow thickness) were collected. Final follow-up was carried out in January 2018; median follow-up time was 24.0 months (range 4.0-98.0 months).
MM cell lines GAK and VMRC-MELG were purchased from the JCRB Cell Bank, and HMVII cells were purchased from Sigma. GAK originates from an inguinal lymph node of a vaginal melanoma patient, VMRC-MELG originates from primary colon melanoma, and HMVII originates from primary vaginal melanoma. HEK293T cells were purchased from Cell Bank of Chinese Academy of Sciences. GAK, VMRC-MELG, HMVII, and HEK293T cells were maintained at 37 °C in 5% CO2 in Ham's F12 with 10% heat-inactivated fetal bovine serum (FBS), Eagle's MEM with non-essential amino acids with 15% FBS, Ham's F10 with 15% FBS, and DMEM with 10% FBS, respectively. All media were supplemented with 100 U/mL penicillin, 100 mg/mL streptomycin, and 2 mM GlutaMAX. All cell culture reagents were purchased from GIBCO.
Microarray analysis
Ten MM tissues and three normal mucosal nevi tissues were used to evaluate miRNAs expression. We used Agilent Human miRNA (8*60K) V19.0 (Design ID: 46064), the RNA labeling and array hybridization were conducted according to the manufacturer's recommendations. The slides were washed in staining dishes with Gene Expression Wash Buffer Kit, then scanned using the Agilent Microarray Scanner and Feature Extraction software 10.7 with default settings. Raw data were normalized by the quantile algorithm in the Gene Spring software 11.0. P-values were calculated using a paired t-test. The miRNAs with a fold change ≥ 2 and P ≤ 0.05 were regarded as significantly different. The microarray analysis was performed by Shanghai Bohao Biotechnology Company.
RNA isolation and quantitative reverse transcription PCR (qRT-PCR)
Total RNAs were extracted from FFPE specimens using the RecoverAllTM Total Nucleic Acid Isolation Kit (Invitrogen), total RNAs from fresh-frozen tissues and cell lines were extracted using the mirVanaTM miRNA Isolation Kit (Invitrogen) according to the manufacturer's instructions. Pelleted normal human epidermal melanocytes (HEMs) cell pellets were purchased from Sciencell, and miRNA expression was detected according to the TaqMan microRNA assay protocol (Applied Biosystems). Ten nanograms of RNA was reverse-transcribed using the TaqMan MicroRNA Reverse Transcription Kit (Applied Biosystems). To evaluate ADCY1 expression, cDNA was synthesized using the High Capacity cDNA Reverse Transcription Kits (Applied Biosystems). Taqman probes for miR-23a-3p, U6, ADCY1, and GAPDH were purchased from Applied Biosystems. Expression data were normalized to the endogenous expression levels of U6 snRNA and GAPDH for miRNAs and mRNAs, respectively.
Oligonucleotides transfections
For transfections, 2 × 10⁵ HMVII and VMRC-MELG cells were seeded into 6-well plates and were cultured as described above overnight, and then miR-23a-3p mimics, hairpin inhibitors, or their scrambled controls (Ambion), and siRNAs specific for ADCY1 or the scramble control (RiboBio) were transfected into the cells at a concentration of 50 nM using Lipofectamine RNAiMAX (Invitrogen). Cells were harvested 24 or 48 h after transfection for subsequent analyses. The sequences of siRNAs for ADCY1 were as follows: siRNA1 (si-ADCY1 #1), 5'- GCCTGATTCTCTCAGATAT-3'; siRNA2 (si-ADCY1 #2), 5'-GGAAGGTTCATATCACAAA-3'.
Lentivirus packaging and transduction
The self-inactivating transfer vector plasmid containing precursor miR-23a (Lenti-pMIR-23a), scramble control (Lenti-pMIR-Ctrl), and the packageing kit were purchased from System Biosciences and were used according to the manufacturer's instructions. HMVII and VMRC-MELG cells were incubated with harvested viral particles and were plated for colony-forming experiments the next day. The shRNA lentivirus carrying siRNAs specific to ADCY1 and expressing lentivirus containing an ADCY1 coding sequence were purchased from Genechem and were used according to the manufacturer's instructions.
Cell proliferation assays
Cell viability was assessed using the CellTiter-Glo Assay (Promega). Cells were harvested at 24 h after transfection and were seeded into 96-well plates at 2,000-3,000 cells/well and cultured for 24, 48, 72, or 96 h. Then, 10 μL CellTiter-Glo reagent was added into each well. After mixing the solutions on an orbital shaker for 10 min at room temperature, luminescence was measured using a Synergy 2 microplate reader (BioTek).
Plate clone formation assays
A cell suspension was seeded into a 6-well plate at 600 cells/well, and the plate was incubated at 37 °C with 5% of CO2 for 14 days until visible clones appeared. Then, the cell culture medium was discarded and the cells were washed with phosphate-buffered saline (PBS) three times. The cells were fixed with 4% paraformaldehyde (Solarbio) for 15 min and then stained with 0.1% crystal violet (Sigma) for 15 min before washing with deionized water and air-drying. Colonies were counted under a light microscope.
Cell cycle analysis
Cells were harvested at indicated times, washed twice with PBS, and fixed in 75% ethanol at 4 °C overnight. After fixation, the ethanol was removed and propidium iodide (PI)/RNase staining buffer (BD Pharmingen) was added. After incubation at room temperature for 15 min, cell cycle profiles were obtained using a Accuri C6 flow cytometer (BD Biosciences) and analyzed with the Modfit software (Verity Software House Inc).
Cell apoptosis assays
Cell apoptosis was assessed using the Annexin V-FITC/PI Apoptosis Detection Kit (Dojindo Laboratories) according to the manufacturer's protocol. Cells were digested with trypsin without ethylene diamine tetraacetic acid (EDTA) at 24 and 48 h after transfection and were suspended in the binding buffer. Then, the cells were incubated with Annexin V-FITC and PI stains for 15 min and subjected to flow-cytometric analysis.
Wound-healing assays
HMVII and VMRC-MELG cells were grown to confluence in 6-well plates and treated with miRNA mimics or siRNAs. Twenty-four hours after transfection, the cells were digested, reseeded into 24-well plates at the density of 5 × 10⁴ cells/well, and incubated overnight. Mitomycin C was added to the melanoma cells at a final concentration of 5 μg/ml to inhibit melanoma cell proliferation, and one hour later, linear scratch wounds were created on the confluent monolayers using a 200-μL pipette tip. Non-adherent cells were removed by washing three times with PBS. Images were taken at time point 0, 12, 24, and 48 h. The percentage decreases in the wound gaps were calculated using ImageJ software.
Transwell migration and invasion assays
HMVII and VMRC-MELG cells were transfected with miRNA mimics or siRNAs, and the cells were harvested and suspended in cell culture medium without FBS 24 h after transfection. For the invasion assay, 1 × 10⁵ HMVII cells or 8 × 10⁴ VMRC-MELG cells were seeded into 24-well plates with Matrigel-coated Transwell inserts (Corning). For the migration assay, the cells were seeded onto membranes in the absence of Matrigel. Complete medium containing FBS was added to the lower chamber, and non-invaded or non-migrated cells were gently removed with a cotton swab after 48 or 24 h. Invasive or migratory cells located on the lower surface of the insert were fixed in 4% paraformaldehyde (Solarbio), stained with 0.1% crystal violet (Sigma), and counted under a light microscope.
In vivo tumor growth and metastasis assays
Five-week-old female NOD/SCID mice were subcutaneously injected with 2 × 10⁶ HMVII cells in 0.1 mL of PBS, and when palpable tumors were formed, the tumors were measured using a Vernier caliper every three days. Tumor volume (V) was determined by measuring the length (L) and width (W) of the tumor and was calculated as V = (L × W2) × 0.5. Thirty days after inoculation, mice were sacrificed and the tumors were weighed and photographed.
For in vivo metastasis assays, mice were intravenously injected with 2 × 10⁵ HMVII cells in 0.2 mL of PBS via the tail vein. The mice were sacrificed 35 days after cell injection, and the presence and sizes of metastases were assessed. All animal experiments were approved by the Medical Ethics Committee of the Beijing Cancer Hospital & Institute and were undertaken in accordance with the Guide for the Care and Use of Laboratory Animals (eighth edition).
Dual luciferase reporter assays
The full length of ADCY1 3'-UTR with wild-type putative miR-23a-3p binding site or a binding site mutated at the 3'-UTR region were cloned into the pMIR-REPORT vector downstream of CMV promoter. The firefly luciferase construct was cotransfected with a control Renilla luciferase vector into HEK293T cells in the presence of either miR-23a-3p or miR-control. The dual luciferase assay (Promega) was carried out 48 h after transfection. The experiment was performed three times independently.
Measurement of cAMP levels
Intracellular cAMP levels were determined by a competition enzyme-linked immunoassay using the Cyclic AMP XP Chemiluminescent Assay Kit (Cell Signaling Technology). Briefly, 4 × 10³ cells were seeded in 96-well plates and incubated overnight. Then, miR-23a-3p mimic or ADCY1 siRNA in serum-free mediums was added into plates and the plates were further incubated for 24 h. Intracellular cAMP was extracted using 1× lysis buffer (Cell Signaling Technology) and was detected according to the manufacturer's instruction.
Measurement of protein kinase A (PKA) activity
Cells were transfected with miRNA mimics or siRNAs as described. Cells were lysed 48 h after transfection with PKA extraction buffer containing 25 mM Tris (pH 7.4), 0.5 mM EDTA, 0.5 mM ethylene glycol tetraacetic acid, 10 mM β-mercaptoethanol, 1 μg/mL leupeptin and 1 μg/mL aprotinin. PKA activity was measured using the PepTag Assay Kit (Promega) according to the manufacturer's instruction. Two micrograms of peptide was incubated with 5 g of cell homogenate in a final volume of 25 μL for 30 min at room temperature. Reactions were stopped by heating the samples at 95 °C for 10 min. The peptides were separated on a 0.8% agarose gel in 50 mM Tris-HCl (pH 8.0) at 100 V for 15 min. The gel was photographed on a transilluminator. Phosphorylated peptide migrated toward the cathode, while non-phosphorylated peptide migrated toward the anode. Bands were excised from the gel and melted by mixing with Gel Solubilization Solution and glacial acetic acid, and 250 μL of the mixture was transferred into a well of a 96-well plate and the absorbance at 570 nm was read using a spectrophotometer.
Immunoblot analysis
Total proteins were extracted from cells using PhosphoSafe Extraction Reagent (Novagen). Proteins were separated by 10% sodium dodecyl sulfate-polyacrylamide gel electrophoresis and transferred to 0.2-μm PVDF membranes. The membranes were blocked in 5% BSA in TBS-Tween 20 (TBS-T) for 2 h and incubated overnight at 4°C with the following primary antibodies: anti-ADCY1 (Santa Cruz), anti-phospho-MEK1/2 (Cell Signaling Technology), anti-total-MEK1/2 (Cell Signaling Technology), anti-phospho-ERK1/2 (Cell Signaling Technology), anti-total-ERK1/2 (Cell Signaling Technology), anti-phospho-CREB (Abcam), anti-total-CREB (Proteintech), anti-MITF (Abcam), anti-N-cadherin (Proteintech), anti-E-cadherin (Proteintech), anti-vimentin (Proteintech), and anti-slug (Proteintech). After washing with TBS-T for 3 times, the membranes were incubated with horseradish peroxidase (HRP)-conjugated secondary antibodies (MBL) for 1 h. Bands were visualized with ECL SelectTM Western Blotting Detection Reagent (GE Healthcare), and bands intensities were quantified using ImageJ software.
Immunohistochemical staining
For IHC analysis, FFPE tissue sections were deparaffinized and endogenous peroxidase activity was blocked with 3% H2O2 for 30 min in the dark. Antigen retrieval was conducted in 1 mM EDTA buffer (pH 8.0) in a pressure cooker. Primary antibodies against ADCY1 (Abcam) and Ki-67 (Cell Signaling Technology) were used at indicated concentrations. A HRP-conjugated polyclonal goat anti-rabbit secondary antibody (Dako) was diluted at 1:400, followed by a standard AEC detection protocol. The staining intensity was scored as 0 (no tumor cell staining), 1 (weak), 2 (moderate), and 3 (strong). The H-score was calculated as: H-core = staining intensity score × percentage of cells staining positive.
Statistical analysis
Statistical analyses were performed using SPSS 20.0 software (IBM). Normally distributed continuous data are reported as means ± standard deviations, and were evaluated by two-tailed unpaired Student's t-test. Categorical data are reported using frequencies and percentages, and were evaluated using Pearson's Chi-square test or Kruskal-Wallis analysis. Survival curves were established using the Kaplan-Meier method and were compared by the log-rank test. All statistical tests were two-sided, and significance was assigned at P < 0.05.
Results
miR-23a-3p is downregulated in mucosal melanoma and is associated with poor outcome
To establish the miRNA expression pattern in MM, we conduncted a miRNA microarray profiling analysis of 10 MM tissues and three normal mucosal nevi. The microarray results showed that there were 112 upregulated miRNAs and 97 downregulated miRNAs in MM as compared to the control (Figure S1).
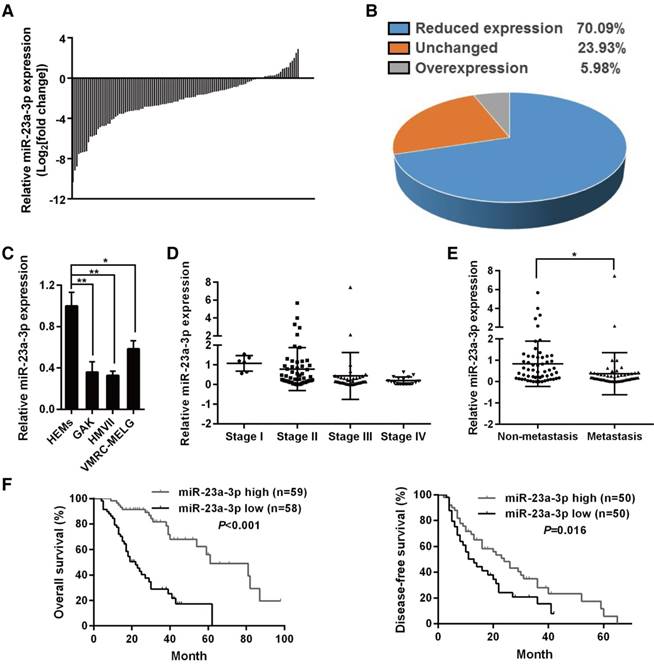
miR-23a-3p was chosen for further study as it showed significantly decreased expression in all MM samples when compared with normal mucosal nevi (Figure S1A). qRT-PCR was used for validation in an independent cohort consisting of 117 MM samples and 12 mucosal nevi, and the results confirmed that miR-23a-3p was strongly downregulated in 70.09% of all MM samples (Figure 1A-B). When we analyzed the expression of miR-23a-3p in three MM cell lines in comparison with normal HEMs, we found that miR-23a-3p was downregulated in all three MM cell lines (Figure 1C).
To investigate whether the levels of miR-23a-3p correlated with clinicopathological parameters and patient survival, we divided the cohort into low- and high- miR-23a-3p expression groups according to the ratio of the miR-23a-3p level in each tumor sample to the mean level in control nevi, and the median ratio value was chosen as the cutoff point. We found that the miR-23a-3p expression level in MM was unrelated with gender, age, ulceration state, average thickness, or primary site (Table 1). However, miR-23a-3p expression was gradually downregulated with increasing developmental stage (Figure 1D), and the expression level of miR-23a-3p in metastatic MM was significantly lower than that in localized MM (Figure 1E).
Correlation of miR-23a-3p expression to clinicopathologic features of mucosal melanoma
| Clinicopathologic features | miR-23a-3p expression | |||
|---|---|---|---|---|
| Low | High | P valuea | ||
| Gender (female/male) | 28/30 | 36/23 | 0.166 | |
| Age (median, range) | 57.5 (35-78) | 56 (26-81) | - | |
| Ulceration (%) | 31/45 (68.9) | 34/43 (79.1) | 0.277 | |
| Thickness (mm) | 5.23±3.99 | 5.24±3.90 | 0.781 | |
| TNM stage (%) | ||||
| I | 0/58 (0) | 6/59 (10.2) | 0.002 | |
| II | 20/58 (34.5) | 31/59 (52.5) | ||
| III | 14/58 (24.1) | 16/59 (27.1) | ||
| IV | 24/58 (41.4) | 6/59 (10.2) | ||
| Anatomic site (%) | ||||
| Nasal cavity & sinuses | 25/58 (43.1) | 15/59 (25.4) | 0.116 | |
| Oral cavity | 5/58 (8.6) | 9/59 (15.3) | ||
| Anorectum | 9/58 (15.5) | 9/59 (15.3) | ||
| Genitourinaryb | 12/58 (20.7) | 22/59 (37.3) | ||
| Esophagus | 7/58 (12.1) | 4/59 (6.8) | ||
a The unpaired Student's t test was used for evaluation of thickness, chi-square tests were used for evaluation of gender, ulceration, and subtypes, Kruskal-Wallis test was used for evaluation of stages. b The sites of genitourinary mucosal melanomas included vulva, vagina, urethra and cervix.
Kaplan-Meier survival analysis revealed that low miR-23a-3p expression in MM was associated with significantly poor outcome, with markedly reduced overall survival (OS) and DFS (Figure 1F-G). Multivariate analysis controlled for potential confounders was conducted after univariate analysis to identify factors that might affect the OS or DFS of patients. As shown in Table 2, the multivariate analysis confirmed that low miR-23a-3p expression was an independent prognostic indicator for reduced OS (HR 5.102, 95% CI 2.732-9.523, P < 0.001), but not for reduced DFS (P = 0.072). These results indicated the importance of miR-23a-3p expression in MM.
miR-23a-3p is downregulated in mucosal melanoma (MM) tissues and correlates with poor prognosis. miR-23a-3p expression was validated by qRT-PCR in 117 FFPE tissue samples and was normalized to the mean level in 12 normal mucosal nevus tissues. U6 was used as an endogenous control. A fold change in relative miR-23a-3p expression >2 or <1/2 was defined as significant. Waterfall plot (A) and pie chart (B) displaying relative miR-23a-3p levels in MM tissues. (C) Relative expression of miR-23a-3p in three MM cell lines and normal human epithelial melanocytes (HEMs) cells was determined by qRT-PCR. (D) miR-23a-3p levels in MM tissues from patients at different TMM stages. (E) The expression level of miR-23a-3p in metastatic MM and non-metastatic MM. (F) Kaplan-Meier curve for OS in the cohort of 117 MM patients. Patients were divided into two groups according to the ratio of the miR-23a-3p level in each tumor sample to the mean level in control nevi, and the median ratio value was chosen as the cutoff point. (G) Kaplan-Meier curve for DFS in 100 patients, excluding patients first diagnosed at stage IV.
Overexpression of miR-23a-3p inhibits mucosal melanoma cell proliferation and tumor growth
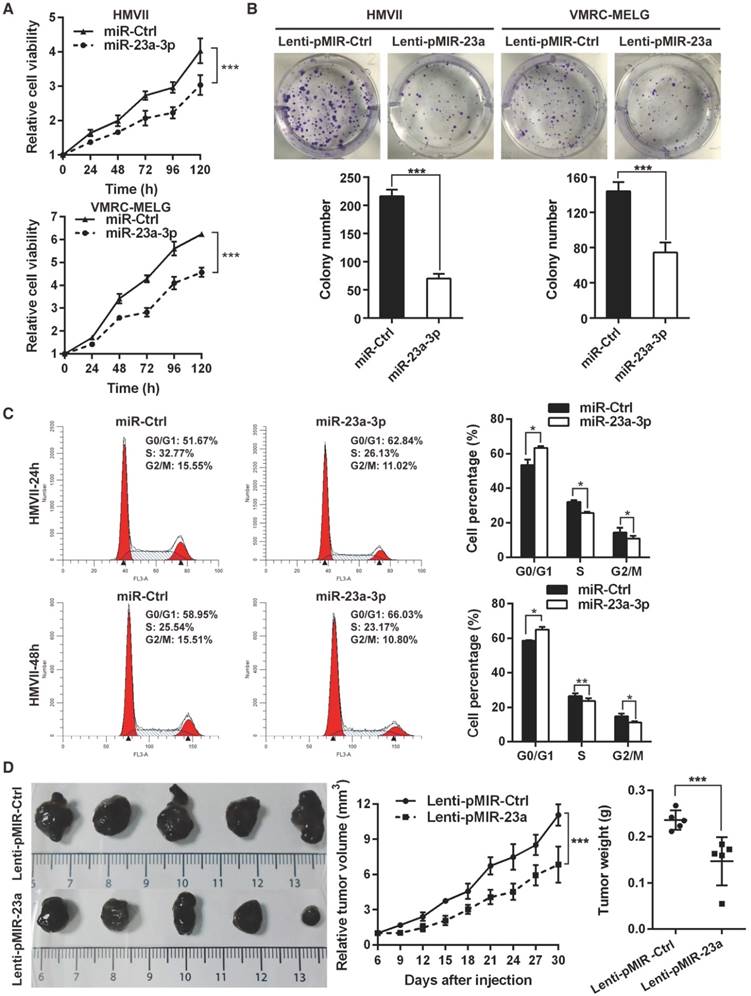
As low levels of miR-23a-3p were significantly associated with poor patient outcome, we asked whether miR-23a-3p functions as a tumor suppressor in MM. To answer this question, gain-of-function assays were carried out in HMVII and VMRC-MELG cells by transient transfection with miR-23a-3p mimic, and miR-23a-3p overexpression was confirmed by qRT-PCR (Figure S2A). Ectopic expression of miR-23a-3p showed comparable short-term anti-proliferative effects in both MM cell lines (Figure 2A). The effect of the miR-23a-3p on long-term cell proliferation of the MM cell lines was assessed by colony formation assays after the cells were transducted with lentivirus for stable overexpression of miR-23a-3p (Figure S2B). The results showed that miR-23a-3p markedly reduced colony numbers as compared to the control (Figure 2B).
To evaluate whether the antiproliferative effect of miR-23a-3p was due to cell death or cell cycle arrest, flow cytometry analysis was conducted at 24 h and 48 h after transfection. Ectopic expression of miR-23a-3p led to a significant increase in the fraction of cells in G0/G1 phase (Figure 2C, Figure S2C), while no significant alterations were observed in the apoptotic cell fraction as compared to miR-Ctrl-treated cells (Figure S2D). These data indicated that miR-23a-3p might inhibit MM cells proliferation through G0/G1 arrest.
Overexpression of miR-23a-3p inhibits mucosal melanoma growth in vitro and in vivo. (A) HMVII and VMRC-MELG MM cells were transfected with miR-23a-3p mimic or control (miR-Ctrl), and cell viability was evaluated using the CellTiter-Glo assay at the indicated time points after transfection. (B) Photos of colony formation assays of HMVII and VMRC-MELG cells infected with lentiviral miR-23a-3p (Lenti-pMIR-23a) or control construct (Lenti-pMIR-Ctrl). Data are presented as the mean ± SD (n = 3). (C) HMVII cells were stained with PI 24 and 48 h after transfection with miR-23a-3p mimic or miR-Ctrl, and cell cycle distribution was analyzed by flow cytometry. (D) HMVII cells stably overexpressing miR-23a-3p or control were injected subcutaneously in NOD/SCID mice (n = 5 in each group), and the tumor volumes were monitored every three days. The mice were sacrificed 30 days after injection and tumor weights were measured. *P < 0.05, **P < 0.01, ***P < 0.001.
Multivariate Cox regression analysis of risk factors associated with DFS and OS
| Clinicopathologic features | Category | DFS | OS | |||||||
|---|---|---|---|---|---|---|---|---|---|---|
| Univariate HR (95% CI) | P value | Multivariate HR (95% CI) | P value | Univariate HR (95% CI) | P value | Multivariate HR (95% CI) | P value | |||
| Gender | Female vs. Male | 0.936 (0.580-1.493) | 0.774 | 1.481 (0.894-2.573) | 0.127 | |||||
| Age | ≥ 60 vs. <60 | 1.030 (0.639-1.666) | 0.901 | 0.924 (0.548-1.540) | 0.756 | |||||
| Ulceration | Yes vs. No | 0.611 (0.274-1.067) | 0.088 | 0.799 (0.378-1.616) | 0.512 | |||||
| Thickness | ≥ 4 mm vs. < 4 mm | 1.476 (0.806-2.844) | 0.219 | 1.491 (0.781-3.104) | 0.242 | |||||
| TNM Stages | III and IV vs. I and II | 1.881 (1.287-3.689) | 0.006* | 2.243 (1.307-3.849) | 0.003* | 3.544 (2.636-7.975) | < 0.001* | 2.967 (2.020-4.360) | < 0.001* | |
| Anatomic site | Others vs. Head and necka | 1.031 (0.644-1.660) | 0.895 | 0.930 (0.552-1.560) | 0.781 | |||||
| miR-23a-3p expression | Low vs. Highb | 1.630 (1.086-2.902) | 0.030* | 4.133 (0.106-0.317) | < 0.001* | 5.102 (2.732-9.523) | < 0.001* | |||
a The sites of head and neck included nasal cavity, sinuses and oral cavity. b Patients were divided the cohort into low and high miR-23a-3p expression groups according to the ratio of the miR-23a-3p level in each tumor sample to the mean levels of control nevi, and the median ratio value was chosen as the cutoff point. Abbreviations: DFS, disease-free survival; OS, overall survival; HR, hazard ratio; TNM, tumor-node-metastasis.
To explore the impact of miR-23a-3p on MM behavior in vivo, we subcutaneously implanted HMVII cells stably expressing miR-23a-3p or control vector into the flanks of NOD/SCID mice. Mice bearing miR-23a-3p HMVII cells displayed significantly slower tumor growth than the control group, as the tumor volumes and tumor weights in the miR-23a-3p group at 30 days after tumor cell injection were 61.8% and 62.2%, respectively, of the values in the control group (Figure 2D). Together, these results indicated that miR-23a-3p plays a significant role in suppressing MM cell proliferation in vitro and tumor growth in vivo.
Overexpression of miR-23a-3p inhibits mucosal melanoma cell migration and invasion
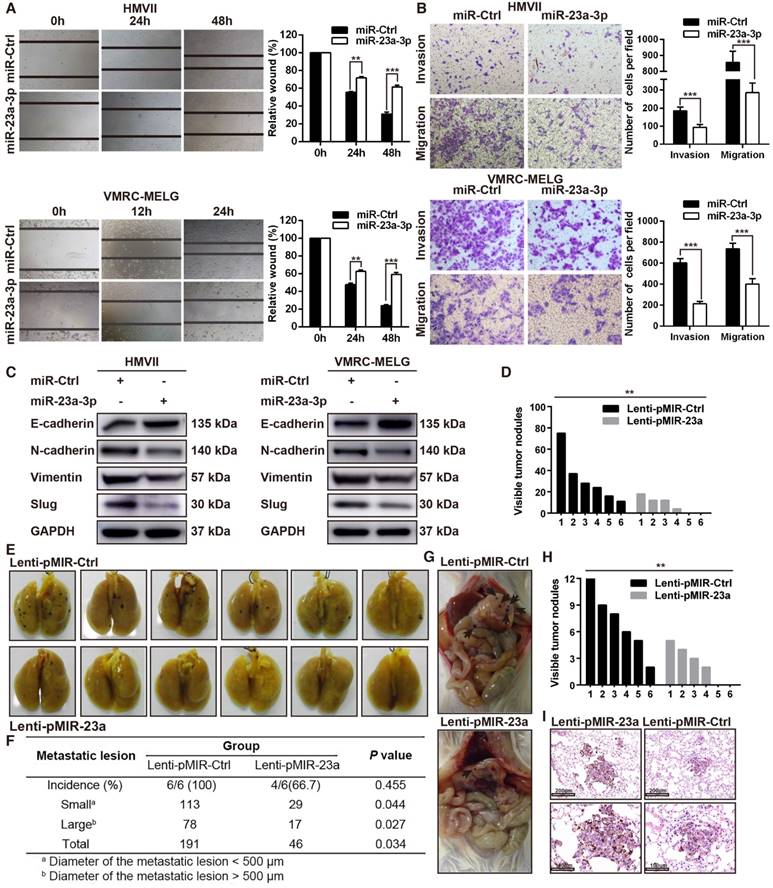
As our results revealed an association between miR-23a-3p expression and MM pathologic stage, and miR-23a-3p expression was significantly lower in metastatic than in localized disease, we reasoned that miR-23a-3p expression was associated with tumor aggressiveness and metastasis. To confirm whether miR-23a-3p could directly inhibit the metastatic phenotype of MM, we assessed cell migration and invasion using in vitro wound scratch and Boyden chamber assays. We found that ectopic delivery of miR-23a-3p mimic remarkably impeded the migration and invasion of MM cells (Figure 3A-B).
Because epithelial-to-mesenchymal transition (EMT) plays an essential role in tumor metastasis, we evaluated the expression of EMT-related factors. The expression of E-cadherin, which is crucial in holding epithelial cells tightly together to maintain the epithelial phenotype, was upregulated after miR-23a-3p overexpression. The expression levels N-cadherin, slug, vimentin, which cause loosening of the intercellular connection and are involved in the mesenchymal phenotype, were decreased after miR-23a-3p overexpression (Figure 3C).
To investigate the effect of miR-23a-3p on metastasis of MM in vivo, NOD/SCID mice were injected with HMVII cells stably expressing miR-23a-3p via the tail vein and were observed for lung and intra-abdominal metastases five weeks after injection. The numbers and sizes of metastatic colonies in the lungs were markedly smaller in mice injected with miR-23a-3p-overexpressing cells than in the control group. All mice in the control group showed lung metastases, whereas only 4 out of 6 mice in the miR-23a-3p-overexpressing group were positive for this feature (Figure 3D-F). Additionally, control mice showed significantly more intra-abdominal visible metastases than the miR-23a-3p-overexpressing group (Figure 3G-H). H&E staining revealed less metastatic nodules in miR-23a-3p-overexpressing mice than in control mice (Figure 3I). Collectively, these results indicated that miR-23a-3p inhibits the migration and invasion ability of MM cells in vitro and in vivo.
miR-23a-3p targets ADCY1 in mucosal melanoma
To identify targets of miR-23a-3p relevant to MM progression, we used three miRNA target prediction tools, including TargetScan (http://www.targetscan.org/), microRNA.org (http://www.microrna.org/), and MIRDB (http://mirdb.org/miRDB/). ADCY1, which belongs to the ADCY family and contains a well-conserved miR-23a-3p target site, was identified as a possible target of miR-23a-3p. ADCYs catalyze the conversion of ATP to cAMP, regulating cellular levels of cAMP, and cAMP signaling can cause resistance to MAPK pathway inhibition in melanoma, indicating the importance of ADCYs in melanoma [16, 17].
We examined the mRNA expression of ADCY1 in 20 fresh-frozen MM tissues and protein expression in the 117 FFPE tissues. qRT-PCR analysis of the 20 fresh-frozen MM tissues showed that ADCY1 mRNA levels were significantly higher in MM tissues with low miR-23a-3p expression than in those with high miR-23a-3p expression (Figure S3A). Further analysis demonstrated that there was a negative relationship between the expressions of ADCY1 mRNA and miR-23a-3p levels in the 20 fresh-frozen tumor samples (Figure 4A). ADCY1 mRNA was also upregulated in all three MM cell lines as compared with normal melanocytes (Figure S3B). IHC results showed a consistent inverse correlation between miR-23a-3p levels and ADCY1 protein expression (Figure 4B-C).
Overexpression of miR-23a-3p inhibits mucosal melanoma metastasis in vitro and in vivo. (A) Wound-healing assay of HMVII and VMRC-MELG cells after transfected with miR-23a-3p mimic or miR-Ctrl. Phase-contrast images were obtained at indicated time points. Bar chart graphs shown are from three independent experiments. (B) Representative images of Transwell migration and invasion assays of HMVII and VMRC-MELG cells. The numbers of invasive cells per field were calculated, and the results are presented as the mean ± SD (n = 3). (C) Western blot analysis of EMT-related markers in MM cells transfected with miR-23a-3p. (D-I) NOD/SCID mice were injected with HMVII cells infected with Lenti-pMIR-23a or Lenti-pMIR-Ctrl via the lateral tail vein. Five weeks after injection, the mice were sacrificed and the lungs and abdominal regions were dissected for microscopic histology. Lung metastatic colonies were counted and quantitatively analyzed (D and F), and photos of dissected lung with metastatic lesions are shown (E). Representative intra-abdominal metastases images (G), and quantification of visible intra-abdominal tumor nodules in the whole abdomen (H). All metastatic tumor lesions were confirmed by H&E staining, and representative pictures of lung metastatic lesions are shown (I). *P < 0.05, **P < 0.01, ***P < 0.001.
ADCY1 is a direct target of miR-23a-3p. (A) Correlation between ADCY1 mRNA and miR-23a-3p in 20 fresh-frozen MM tissues. Expression of ADCY1 mRNA and miR-23a-3p was measured by qRT-PCR and was normalized to the mean level in three normal mucosal nevi. GAPDH and U6 were used as endogenous controls, respectively. (B) Correlation between ADCY1 protein and miR-23a-3p in 117 FFPE samples. (C) Representative IHC staining images of ADCY1 in patients with low and high miR-23a-3p expression. Bar, 100 mm. (D) Putative miR-23a-3p interaction sites within the 3'-UTR of ADCY1 mRNA are indicated by boxes. Mutations were generated in the complementary site of the ADCY1 3´-UTR for the seed sequences of miR-23a-3p as shown in capital letters. (E) The full length of ADCY1 3'-UTR with putative wild-type (WT) miR-23a-3p-binding site or a binding site mutated at the 3'-UTR region (Mut) were cloned downstream of the CMV promoter in the pMIR-REPORT vector. Luciferase activity was measured after co-transfection of the reporter constructs with WT- or Mut-interacting sites of ADCY1 and miR-23a-3p mimic or miR-Ctrl in HEK293T cells. Data are presented as the mean ± SD of three independent experiments. (F) ADCY1 transcripts level at 48 h after transfection with miR-23a-3p and control as determined by qRT-PCR. GAPDH was used as an internal control. (G) HMVII and VMRC-MELG cells were transfected with miR-23a-3p mimic or inhibitor and the corresponding controls. ADCY1 protein expression after 48 h of transfection was detected by western blot analysis. Band intensities were quantified using ImageJ. (H-J) Tissue sections from subcutaneous xenografts (H), lung metastasis (I), and intra-abdominal metastasis (J) were stained with H&E, ADCY1 and Ki-67. Bar, 50 μm. *P < 0.05, **P < 0.01, ***P < 0.001.
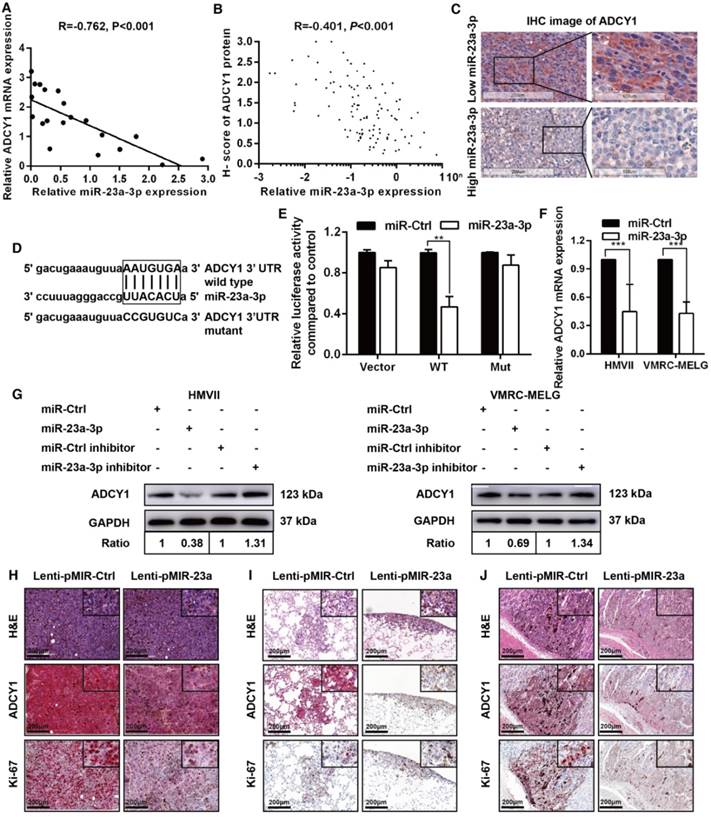
To substantiate a direct interaction between miR-23a-3p and ADCY1, we cloned a full length of the 3'-UTR of ADCY1 mRNA containing a site complementary to the seed region of miR-23a-3p (Figure 4D). Transfection of the ADCY1 3'-UTR-luciferase or ADCY1 mutant 3'-UTR reporter in combination with the miR-23a-3p mimic into 293T cells revealed that miR-23a-3p repressed the luciferase activity of the former reporter but not that of the ADCY1 mutant 3'-UTR construct (Figure 4E). Furthermore, transient overexpression of miR-23a-3p substantially decreased ADCY1 mRNA and protein levels in MM cells, whereas suppression of the miR-23a-3p activity using a miR-23a-3p inhibitor resulted in increased ADCY1 expression (Figure 4F-G).
We conducted IHC for ADCY1 in xenograft tumors to confirm the effects of miR-23a-3p on ADCY1 expression. As expected, ADCY1 protein levels were significantly downregulated in miR-23a-3p-overexpressing tumors in comparison to control tumors (Figure 4H). In addition, Ki-67 expression analysis verified that miR-23a-3p overexpression in xenografts was associated with clearly weaker Ki-67 staining, suggesting decreased cell proliferation (Figure 4H). We also observed decreased expression of ADCY1 in miR-23a-3p stably overexpressing lung and intra-abdominal metastases (Figure 4I-J). Together, these results supported that ADCY1 is targeted and regulated by miR-23a-3p.
Inhibition of ADCY1 mimics the effects of miR-23a-3p overexpression
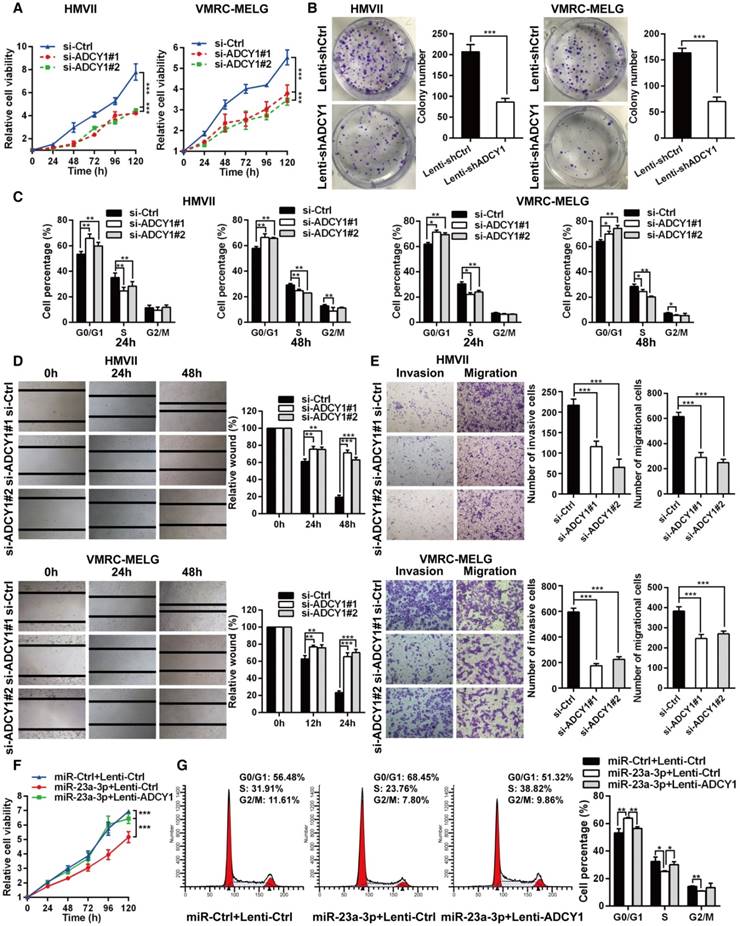
To identify the role of ADCY1 in MM pathogenesis, we determined whether inhibition of ADCY1 resulted in MM repression by using siRNA-mediated knockdown of ADCY1 in HMVII and VMRC-MELG cells (Figure S4A-B). Inhibition of ADCY1 led to repressed cell proliferation, delayed cell cycle progression, and reduced migration and invasion in vitro (Figure 5A-E), which was consistent with the effects of miR-23a-3p overexpression. In addition, E-cadherin was increased, whereas N-cadherin, vimentin, and slug were decreased, as shown by immunoblot analysis (Figure S4C). Additionally, we carried out rescue experiments to examine the functional relationship between miR-23a-3p and ADCY1 further. In HMVII cells stably overexpressing an ADCY1-coding sequence but lacking the 3'-UTR, the anti-proliferative effects of miR-23a-3p restoration were abrogated (Figure 5F-G).
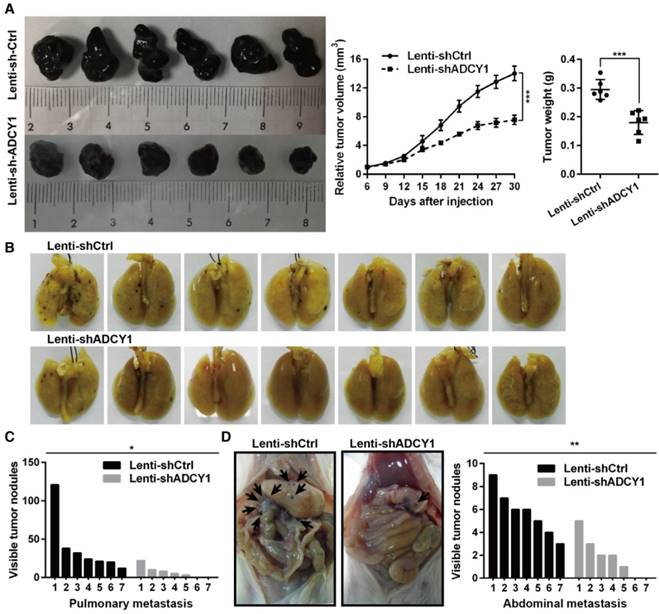
Furthermore, we studied the impact of ADCY1 on MM cell growth and metastasis in vivo by injecting ADCY1-knockdown or control HMVII cells into NOD/SCID mice, either subcutaneously or via the tail vein. Notably, decreased expression of ADCY1 correlated with slower tumor growth and less metastasis formation (Figure 6A-D). Taken together, these results demonstrated that knockdown of ADCY1 recapitulated all the phenotypic characteristics of miR-23a-3p overexpression, and suggested that the suppressive effect of miR-23a-3p is, at least in part, mediated by inhibition ADCY1.
miR-23a-3p inhibits cAMP and MAPK pathways in mucosal melanoma through ADCY1
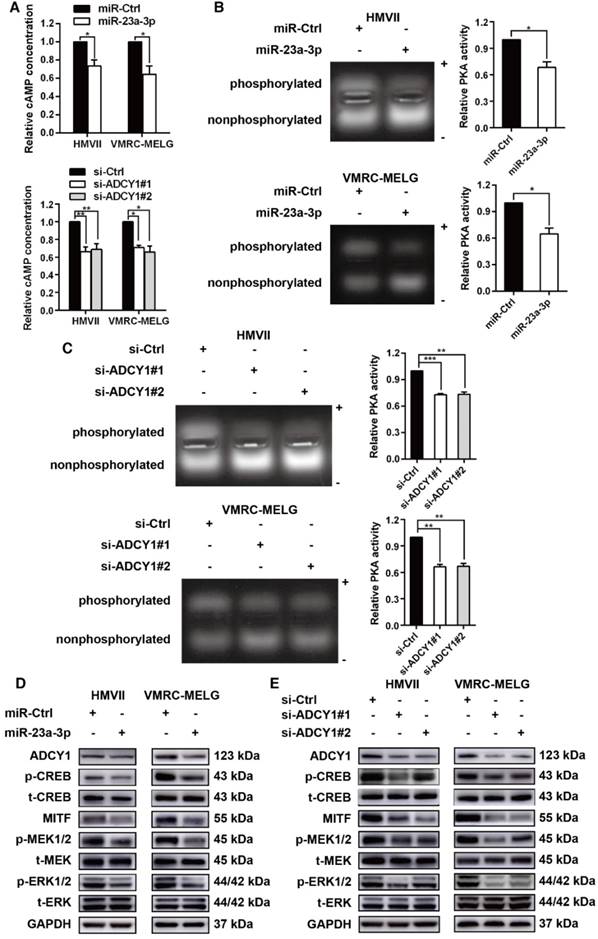
As ADCY1 promotes the production of cAMP and activation of cAMP signaling, we explored whether the downstream effector of ADCY1 was indeed influenced by miR-23a-3p in MM cell lines. In MM cells overexpressing miR-23a-3p, cAMP concentrations were decreased as compared to the levels in control cells (Figure 7A). Accordingly, knockdown of ADCY1 decreased the cAMP levels (Figure 7A), indicating that miR-23a-3p affected cAMP formation through ADCY1. Next, we detected the activity and expression of other components in this pathway, including PKA and the canonical PKA substrate, CREB. PKA activity was determined by its ability to phosphorylate the substrate peptide PepTag A1. Consistent with the changes in intracellular cAMP, both miR-23a-3p overexpression and ADCY1 knockdown strongly reduced the fraction of phosphorylated PKA substrate (Figure 7B-C). Immunoblot showed that miR-23a-3p overexpression or ADCY1 knockdown in MM cells resulted in decreased phospho-CREB levels and MITF expression (Figure 7D-E). When we assessed crosstalk effects between cAMP and MAPK, we observed obvious decreases in p-MEK1/2 and p-ERK1/2 after miR-23a-3p overexpression or ADCY1 knockdown (Figure 7D-E). Based on these findings, we proposed a pathway of miR-23a-3p mediated regulation of cAMP and MAPK signaling via ADCY1 in MM cells.
Discussion
MM has distinct genetic characteristics, includeing a lower somatic mutational burden than CM (8,193 vs. 86,495 single-nucleotide variants per tumor) and a higher frequency of focal amplifications and chromosomal aberrations [18, 19]. In addition, the landscape of driver mutations differs between MM and CM, as BRAF (~50%) and NRAS (25-30%) mutations are the most important mutations in CM [20, 21], where MMs are more likely to harbor KIT (15-39%), NF1 (18-20%), SF3B1 (20%), and GNAQ/11 (9.8%) aberrations [22-26]. Aberrant miRNA expression, which can be either oncogenic or tumor-suppressive, is another common feature of many cancers [10-12]. The miRNA expression signature of CM has been widely studied, but miRNA-related studies in MM are rare [15, 27-29].
In the present study, we first analyzed the miRNA profile in MM, and the data revealed that miR-23a-3p levels were downregulated in all MM samples. qRT-PCR results of FFPE tissues further validated that miR-23a-3p expression was substantially lower in advanced MM, and analysis of OS and DFS demonstrated that low miR-23a-3p expression was significantly associated with poor prognosis. Furthermore, ectopic expression of miR-23a-3p suppressed MM cell proliferation, migration, invasion, and tumorigenicity, which indicated a tumor-suppressor role of miR-23a-3p in MM. To date, the functions of miR-23a-3p in tumorigenesis and metastasis have been controversial; while some reports that miR-23a-3p can promote cell proliferation and is upregulated in gastric cancer and pancreatic ductal cancer, other studies concluded that miR-23a-3p inhibits cell proliferation and is downregulated in prostate cancer and osteosarcoma [30-33].
ADCY1 knockdown phenocopies the effects of miR-23a-3p overexpression in vitro. (A) HMVII and VMRC-MELG cells were transfected with two ADCY1 siRNAs, and cell viability was measured using the CellTiter-Glo assay. (B) Photos of colony formation of HMVII and VMRC-MELG cells infected with ADCY1-specific shRNA (Lenti-shADCY1) or control construct (Lenti-shCtrl). Data are presented as the mean ± SD (n = 3). (C) HMVII and VMRC-MELG cells were stained with PI at 24 and 48 h after transfection with ADCY1 siRNAs, and cell cycle distribution was analyzed by flow cytometry. (D-E) Migration and invasion abilities of HMVII and VMRC-MELG cells transfected with two ADCY1-specific siRNAs were assessed using wound-healing (D) and Transwell (E) assays. (F-G) HMVII cells stably transfected with ADCY1-expression plasmid were transfected with miR-23a-3p mimics or miR-Ctrl, and cell viability was analyzed by CellTiter-Glo assay (F) and cell cycle distribution (G) was analyzed by flow cytometry. *P < 0.05, **P < 0.01, ***P < 0.001.
These discordant findings indicate that whether miR-23a-3p functions as an oncogene or a tumor suppressor depends on the cancer type. Guo et al. investigated the serum miRNAome in 192 melanoma patients and 51 cancer-free controls, and found that serum miR-23a was significantly downregulated in melanoma patients and strongly correlated with poor clinical outcomes. They further examined miR-23a expression in 66 melanoma tissues and five CM cell lines, and the results showed miR-23a was significantly decreased in metastatic melanoma tissues and cell lines [34]. These findings are consistent with our observation in MM patients, indicating that miR-23a-3p acts as a tumor suppressor in both CM and MM.
In this study, we identified ADCY1 as a critical mediator of miR-23a-3p action in MM, and miR-23a-3p could coordinately repress multiple signaling pathways by targeting ADCY1. In mammals, there are ten isoforms of ADCY, including nine membrane-bound (ADCY1-ADCY9) and one soluble isoform (sAC) [16, 35]. Very little is known about the expression of the various isoforms in melanocytes and melanoma, and the precise roles and mechanisms of ADCY1 in MM remain elusive. In our study, knockdown of ADCY1 or overexpression of miR-23a-3p led to a decrease in intracellular cAMP, and subsequently, inhibition of PKA activity. It is well known that PKA activates CREB through phosphorylation at Ser133, and CREB is a ubiquitously expressed transcription factor that binds to the CRE regulatory region of its target genes, including MITF [16, 36]. Our study showed that phospho-CREB and MITF levels were significantly downregulated after inactivation of PKA by miR-23a-3p restoration or ADCY1 knockdown. Furthermore, CREB has been implicated in melanoma tumor growth and metastasis [36, 37], and promotes EMT in non-small cell lung cancer and renal cell carcinoma in a CREB-1/STAT3- or CREB/MMP-dependent manner [38, 39], which is consistent with our finding that inhibition of metastasis of MM cells by miR-23a-3p was associated with a decrease in EMT.
ADCY1 knockdown phenocopies the effects of miR-23a-3p overexpression in vivo. (A) HMVII cells stably transfected with shADCY1 were subcutaneously injected into NOD/SCID mice, the tumor volumes were monitored, and tumor weights were measured after the mice were sacrificed on day 30. (B-D) HMVII cells stably transfected with shADCY1 were injected via the lateral tail vein into NOD/SCID mice, metastatic colonies were counted and quantitatively analyzed, and representative lung (B) and intra-abdominal (D) metastases images are shown. *P < 0.05, **P < 0.01, ***P < 0.001.
miR-23a-3p inhibits the cAMP and MAPK pathways in mucosal melanoma through ADCY1. HMVII and VMRC-MELG cells were transfected with miR-23a-3p mimics or two ADCY1-specific siRNAs and their corresponding controls as described. (A) Intracellular cAMP content was measured using the Cyclic AMP XP Chemiluminescent Assay and was normalized to the level in control-treated cells. (B-C) PKA activity was detected using a PepTag assay. Representative photographs are shown and PKA activities were normalized to those in control-treated cells. (D-E) Immunoblot analysis of the phosphorylation and expression of cAMP and MAPK pathway-associated downstream factors 48 h after treatment with miR-23a-3p mimic (D) or ADCY1 siRNAs (E). GAPDH served as a loading control.
Deregulation of the MAPK pathway has been found to play a pivotal role in melanoma carcinogenesis and progression, as activated ERK promotes proliferation and suppresses apoptosis of cancer cells by phosphorylating a large number of downstream substrates, and MITF is a direct target of phospho-ERK [40]. Genetic alterations that cause dysregulation of the MAPK pathway contribute to the development of most melanomas [41]. In melanocytes and RAS wild-type melanoma cells, cAMP activates BRAF and ERK [16, 35, 42]; however, in RAS-mutated melanoma, CRAF is utilized to activate ERK and this switch in RAF utilization is due to the disruption of cAMP signaling [43]. In BRAF wild-type uveal melanoma, inhibition or deletion of PKA reduced BRAF activity, ERK signaling, and cell proliferation. This finding demonstrates a key role of cAMP/PKA in promoting ERK signaling in BRAF wild-type uveal melanoma cell growth [44]. Furthermore, cAMP plays a role in inducing melanoma MAPK inhibitor resistance, and ADCY9 has been found to confer resistance to all tested MAPK inhibitors [17]. This report uncovered new roles of ADCYs in melanoma. These studies indicate that there is a crosstalk between the cAMP and MAPK pathways in melanoma; therefore we hypothesized that reintroduction of miR-23a-3p could regulate the MAPK pathway. Our results showed that phospho-MEK and phospho-ERK levels were markedly downregulated in miR-23a-3p-overexpressing MM cells. The downregulation of ERK activation and MITF expression by miR-23a-3p was in line with the observation that miR-23a-3p inhibited MM cell proliferation and metastasis. The existence of such crosstalk between the two important signaling pathways has also been demonstrated in other types of cancers, including non-small cell lung carcinoma and prostate cancer [45-48].
In summary, our study indicated that miR-23a-3p is downregulated in MM and demonstrated the potential role of miR-23a-3p in tumorigenesis. Functional studies suggest a critical role for miR-23a-3p in cell proliferation and metastasis by regulating the cAMP and MAPK signaling pathways through direct targeting of ADCY1. These findings suggest that miR-23a-3p might be useful as a biomarker, and targeting the miR-23a-3p pathway may represent a new therapeutic strategy to suppress MM progression. Our study also provided novel insights into the involvement of the cAMP pathway in MM.
Abbreviations
3'UTRs: 3'-untranslated regions; ADCY1: adenylate cyclase 1; ATP: adenosine triphosphate; BSA: bovine serum albumin; cAMP: cyclic adenosine monophosphate; cDNA: complementary deoxyribonucleic acid; CM: cutaneous melanoma; CMV: cytomegalovirus; CO2: carbon dioxide; CREB: cAMP responsive element binding protein; DFS: disease-free survival; EDTA: ethylene diamine tetraacetic acid; DMEM: dulbecco's modified eagle medium; EMT: epithelial-to-mesenchymal transition; ERK: extracellular regulated MAP kinase; FBS: heat-inactivated fetal bovine serum; FITC: fluorescein isothiocyanate; FFPE: formalin-fixed paraffin-embedded; GNA11: G protein subunit alpha 11; GNAQ: G protein subunit alpha q; H2O2: hydrogen peroxide; H&E: hematoxylin and eosin; HEMs: human epidermal melanocytes; HMB-45: human melanoma black 45; HR: hazard ratio; HRP: horseradish peroxidase; IHC: immunohistochemistry; JCRB: Japanese Collection of Research Bioresources; MAPK: mitogen-activated protein kinase; MART-1: melanoma antigen recognized by T cells 1; MEK: MAP kinase-ERK kinase; MEM: minimal essential media; miRNAs: micro ribonucleic acid; MITF: microphthalmia-associated transcription factor; MM: mucosal melanoma; MMP: matrix metalloproteinase; mRNA: messenger ribonucleic acid; NF1: neurofibromin 1; OM: ocular melanoma; OS: overall survival; PBS: phosphate-buffered saline; PI: propidium iodide; PKA: protein kinase A; PVDF: polyvinylidene fluoride; qRT-PCR: quantitative real-time polymerase chain reaction; RNA: ribonucleic acid; SF3B1: splicing factor 3b subunit 1; shRNA: short hairpin RNA; siRNA: short interfering RNA; snRNA: small nuclear RNA; STAT3: signal transducer and activator of transcription 3; TNM: tumor-node-metastasis; UV: ultraviolet.
Supplementary Material
Supplementary figures.
Acknowledgements
This work was supported by grants from the Beijing Talents Foundation (2016000021223ZK18), National Natural Science Foundation of China (81672696), and Beijing Municipal Administration of Hospitals Clinical medicine Development of special funding support (ZYLX201603).
Author Contributions
M.M. and J.D. conducted most of the experiments, analyzed and interpreted the data, and wrote the primary manuscript. H.T., T.X., and S.Y. supported the mice experiments. L.S., C.C., X.S., and Z.C. provided human samples. L.M., S.L., B.L., B.T., X.W., X.Y., X.B., and L.Z provided clinical data and pathological characteristics. X.W., L.Y., and H.Y. supported the data analysis. Y.K. and J.G. designed the project and edited the paper.
Competing Interests
The authors have declared that no competing interest exists.
References
1. Chi Z, Li S, Sheng X. et al. Clinical presentation, histology, and prognoses of malignant melanoma in ethnic Chinese: a study of 522 consecutive cases. BMC Cancer. 2011;11:85
2. Chan KK, Chan RC, Ho RS. et al. Clinical patterns of melanoma in Asians: 11-year experience in a tertiary referral center. Ann Plast Surg. 2016;77(Suppl 1):S6-S11
3. Chang AE, Karnell LH, Menck HR. The National Cancer Data Base report on cutaneous and noncutaneous melanoma: a summary of 84,836 cases from the past decade. The American College of Surgeons Commission on Cancer and the American Cancer Society. Cancer. 1998;83:1664-78
4. Spencer KR, Mehnert JM. Mucosal melanoma: epidemiology, biology and treatment. Cancer Treat Res. 2016;167:295-320
5. Lian B, Cui CL, Zhou L. et al. The natural history and patterns of metastases from mucosal melanoma: an analysis of 706 prospectively-followed patients. Ann Oncol. 2017;28:868-73
6. Bishop KD, Olszewski AJ. Epidemiology and survival outcomes of ocular and mucosal melanomas: a population-based analysis. Int J Cancer. 2014;134:2961-71
7. Gavriel H, McArthur G, Sizeland A. et al. Review: mucosal melanoma of the head and neck. Melanoma Res. 2011;21:257-66
8. Bartel DP. MicroRNAs: genomics, biogenesis, mechanism, and function. Cell. 2004;116:281-97
9. He L, Hannon GJ. MicroRNAs: Small RNAs with a big role in gene regulation. Nat Rev Genet. 2004;5:522-31
10. Farazi TA, Hoell JI, Morozov P. et al. MicroRNAs in human cancer. Adv Exp Med Biol. 2013;774:1-20
11. Croce CM. Causes and consequences of microRNA dysregulation in cancer. Nat Rev Genet. 2009;10:704-14
12. Andorfer CA, Necela BM, Thompson EA. et al. MicroRNA signatures: clinical biomarkers for the diagnosis and treatment of breast cancer. Trends Mol Med. 2011;17:313-19
13. Hall JS, Taylor J, Valentine HR. et al. Enhanced stability of microRNA expression facilitates classification of FFPE tumour samples exhibiting near total mRNA degradation. Brit J Cancer. 2012;107:684-94
14. Jacob H, Stanisavljevic L, Storli KE. et al. Identification of a sixteen-microRNA signature as prognostic biomarker for stage II and III colon cancer. Oncotarget. 2017;8:87837-47
15. Stark MS, Klein K, Weide B. et al. The prognostic and predictive value of melanoma-related microRNAs using tissue and serum: a microRNA expression analysis. EBioMedicine. 2015;2:671-80
16. Rodríguez CI, Setaluri V. Cyclic AMP (cAMP) signaling in melanocytes and melanoma. Arch Biochem Biophys. 2014;563:22-7
17. Johannessen CM, Johnson LA, Piccioni F. et al. A melanocyte lineage program confers resistance to MAP kinase pathway inhibition. Nature. 2013;504:138-42
18. Furney SJ, Turajlic S, Stamp G. et al. Genome sequencing of mucosal melanomas reveals that they are driven by distinct mechanisms from cutaneous melanoma. J Pathol. 2013;230:261-9
19. Hayward NK, Wilmott JS, Waddell N. et al. Whole-genome landscapes of major melanoma subtypes. Nature. 2017;545:175-180
20. Cancer Genome Atlas Network. Genomic Classification of Cutaneous Melanoma. Cell. 2015;161:1681-96
21. Tsao H, Chin L, Garraway LA. et al. Melanoma: from mutations to medicine. Genes Dev. 2012;26:1131-55
22. Gavriel H, McArthur G, Sizeland A. et al. Review: mucosal melanoma of the head and neck. Melanoma Res. 2011;21:257-66
23. Curtin JA, Busam K, Pinkel D. et al. Somatic activation of KIT in distinct subtypes of melanoma. J Clin Oncol. 2006;24:4340-6
24. Cosgarea I, Ugurel S, Sucker A. et al. Targeted next generation sequencing of mucosal melanomas identifies frequent NF1 and RAS mutations. Oncotarget. 2017;8:40683-92
25. Yang HM, Hsiao SJ, Schaeffer DF. et al. Identification of recurrent mutational events in anorectal melanoma. Modern Pathol. 2017;30:286-96
26. Sheng X, Kong Y, Li Y. et al. GNAQ and GNA11 mutations occur in 9.5% of mucosal melanoma and are associated with poor prognosis. Eur J Cancer. 2016;65:156-63
27. Segura MF, Belitskaya-Lévy I, Rose AE. et al. Melanoma microRNA signature predicts post-recurrence survival. Clin Cancer Res. 2010;16:1577-86
28. Chan E, Patel R, Nallur S. et al. MicroRNA signatures differentiate melanoma subtypes. Cell Cycle. 2011;10:1845-52
29. Caramuta S, Egyházi S, Rodolfo M. et al. MicroRNA expression profiles associated with mutational status and survival in malignant melanoma. J Invest Dermatol. 2010;130:2062-70
30. Hu X, Wang Y, Liang H. et al. miR-23a/b promote tumor growth and suppress apoptosis by targeting PDCD4 in gastric cancer. Cell Death Dis. 2017;8:e3059
31. Wu G, Li Z, Jiang P. et al. MicroRNA-23a promotes pancreatic cancer metastasis by targeting epithelial splicing regulator protein 1. Oncotarget. 2017;8:82854-71
32. Cai S, Chen R, Li X. et al. Downregulation of microRNA-23a suppresses prostate cancer metastasis by targeting the PAK6-LIMK1 signaling pathway. Oncotarget. 2015;6:3904-17
33. Wang G, Li B, Fu Y. et al. miR-23a suppresses proliferation of osteosarcoma cells by targeting SATB1. Tumor Biol. 2015;36:4715-21
34. Guo W, Wang H, Yang Y. et al. Down-regulated miR-23a contributes to the metastasis of cutaneous melanoma by promoting autophagy. Theranostics. 2017;7:2231-49
35. Nardin C, Fitzpatrick L, Zippin JH. Diverse effects of cAMP signaling in melanoma support the role of distinct cAMP microdomains in melanomagenesis, metastasis, and resistance to therapy. OA Dermatology. 2014;2:5
36. Xie S, Price JE, Luca M. et al. Dominant-negative CREB inhibits tumor growth and metastasis of human melanoma cells. Oncogene. 1997;15:2069-75
37. Dobroff AS, Wang H, Melnikova VO. et al. Silencing cAMP-response element-binding protein (CREB) identifies CYR61 as a tumor suppressor gene in melanoma. J Biol Chem. 2009;284:26194-206
38. Cho JH, Hong WG, Jung YJ. et al. Gamma-Ionizing radiation-induced activation of the EGFR-p38/ERK-STAT3/CREB-1-EMT pathway promotes the migration/invasion of non-small cell lung cancer cells and is inhibited by podophyllotoxin acetate. Tumor Biol. 2016;37:7315-25
39. Wang X, Cui H, Lou Z. et al. Cyclic AMP responsive element-binding protein induces metastatic renal cell carcinoma by mediating the expression of matrix metallopeptidase-2/9 and proteins associated with epithelial-mesenchymal transition. Mol Med Rep. 2017;15:4191-8
40. Smalley KS. A pivotal role for ERK in the oncogenic behaviour of malignant melanoma? Int J Cancer. 2003;104:527-32
41. Fecher LA, Arnaravadi RK, Flaherty KT. The MAPK pathway in melanoma. Curr Opin Oncol. 2008;20:183-9
42. Buscà R, Abbe P, Mantoux F. et al. Ras mediates the cAMP-dependent activation of extracellular signal-regulated kinases (ERKs) in melanocytes. EMBO J. 2000;19:2900-10
43. Dumaz N. Mechanism of RAF isoform switching induced by oncogenic RAS in melanoma. Small GTPases. 2011;2:289-92
44. Calipel A, Mouriaux F, Glotin AL. et al. Extracellular signal-regulated kinase-dependent proliferation is mediated through the protein kinase A/B-Raf pathway in human uveal melanoma cells. J Biol Chem. 2006;281:9238-50
45. Walker GE, Antoniono RJ, Ross HJ. et al. Neuroendocrine-like differentiation of non-small cell lung carcinoma cells: regulation by cAMP and the interaction of mac25/IGFBP-rP1 and 25.1. Oncogene. 2006;25:1943-54
46. Vossler MR, Yao H, York RD. et al. cAMP activates MAP kinase and Elk-1 through a B-Raf- and Rap1-dependent pathway. Cell. 1997;89:73-82
47. Chen T, Cho RW, Stork PJ. et al. Elevation of cyclic adenosine 3',5'-monophosphate potentiates activation of mitogen-activated protein kinase by growth factors in LNCaP prostate cancer cells. Cancer Res. 1999;59:213-8
48. Stork PJ, Schmitt JM. Crosstalk between cAMP and MAP kinase signaling in the regulation of cell proliferation. Trends Cell Biol. 2002;12:258-66
Author contact
![]() Corresponding authors: Jun Guo, M.D., Ph.D., Department of Renal Cancer and Melanoma, Peking University Cancer Hospital & Institute, 52# Fucheng Road, Haidian District, Beijing 100142, China. E-mail: guoj307com; or Yan Kong, M.D., Ph.D., Department of Renal Cancer and Melanoma, Peking University Cancer Hospital & Institute, 52# Fucheng Road, Haidian District, Beijing 100142, China. E-mail: k-yan08com
Corresponding authors: Jun Guo, M.D., Ph.D., Department of Renal Cancer and Melanoma, Peking University Cancer Hospital & Institute, 52# Fucheng Road, Haidian District, Beijing 100142, China. E-mail: guoj307com; or Yan Kong, M.D., Ph.D., Department of Renal Cancer and Melanoma, Peking University Cancer Hospital & Institute, 52# Fucheng Road, Haidian District, Beijing 100142, China. E-mail: k-yan08com