Theranostics
13.3
Impact Factor
- Current Issue
- Advance Articles
- Volume 16; 2026
- Volume 15; 2025
- Volume 14; 2024
- Volume 13; 2023
- Volume 12; 2022
- Archive
- Cover Images
- Cover Suggestion
- Special Issues
Top
Introduction
Results and discussion
Conclusion
Methods
Abbreviations
Supplementary Material
Acknowledgements
References
Introduction
Results and discussion
Conclusion
Methods
Abbreviations
Supplementary Material
Acknowledgements
References
International Journal of Biological Sciences
International Journal of Medical Sciences
 Global reach, higher impact

Theranostics 2018; 8(21):5870-5889. doi:10.7150/thno.27351 This issue Cite
Research Paper
Radiation-responsive scintillating nanotheranostics for reduced hypoxic radioresistance under ROS/NO-mediated tumor microenvironment regulation
Yan Dou1, Yajuan Liu2, Fangshi Zhao1, Yanyan Guo3, Xue Li3, Menglin Wu3, Jin Chang2, Chunshui Yu1 ![]()
1. Department of Radiology and Tianjin Key Laboratory of Functional Imaging, Tianjin Medical University General Hospital, Tianjin, 300052, P. R. China.
2. School of Life Sciences, Health Science Platform, Tianjin University, Tianjin Engineering Research Center for Micro-Nano Biomaterials and Detection-Treatment Technology, Tianjin, 300072, P. R. China.
3. Department of Radiology and Department of Radiation Oncology, The Second Hospital of Tianjin Medical University, Tianjin, 300211, P. R. China.
Received 2018-5-19; Accepted 2018-10-27; Published 2018-11-12
Citation:
Dou Y, Liu Y, Zhao F, Guo Y, Li X, Wu M, Chang J, Yu C. Radiation-responsive scintillating nanotheranostics for reduced hypoxic radioresistance under ROS/NO-mediated tumor microenvironment regulation. Theranostics 2018; 8(21):5870-5889. doi:10.7150/thno.27351. https://www.thno.org/v08p5870.htm
Other stylesAbstract

Abstract: Hypoxia-induced radioresistance is the primary reason for failure of tumor radiotherapy (RT). Changes within the irradiated tumor microenvironment (TME) including oxygen, reactive oxygen species (ROS) and nitric oxide (NO) are closely related to radioresistance. Therefore, there is an urgent need to develop new approaches for overcoming hypoxic radioresistance by incorporating TME regulation into current radiotherapeutic strategies.
Methods: Herein, we explored a radiation-responsive nanotheranostic system to enhance RT effects on hypoxic tumors by multi-way therapeutic effects. This system was developed by loading S-nitrosothiol groups (SNO, a NO donor) and indocyanine green (ICG, a photosensitizer) onto mesoporous silica shells of Eu3+-doped NaGdF4 scintillating nanocrystals (NSC).
Results: Under X-ray radiation, this system can increase the local dosage by high-Z elements, promote ROS generation by X-ray-induced photodynamic therapy, and produce high levels of NO to enhance tumor-killing effects and improve hypoxia via NO-induced vasodilation. In vitro and in vivo studies revealed that this combined strategy can greatly reinforce DNA damage and apoptosis of hypoxic tumor cells, while significantly suppressing tumor growth, improving tumor hypoxia and promoting p53 up-regulation and HIF1α down-regulation. In addition, this system showed pronounced tumor contrast performance in T1-weighted magnetic resonance imaging and computed tomography.
Conclusion: This work demonstrates the great potential of scintillating nanotheranostics for multimodal imaging-guided X-ray radiation-triggered tumor combined therapy to overcome radioresistance.
Keywords: nanoscintillators, hypoxia-induced radioresistance, X-ray induced photodynamic therapy, nitric oxide, multimodal imaging
Introduction
Radioresistance is the primary reason for the failure of radiotherapy (RT) for malignant tumors [1-2]. Despite killing tumor cells via direct DNA damage and cytotoxic reactive oxygen species (ROS), ionizing radiation (IR) may also alter tumor microenvironment (TME) to promote radioresistance [3-4]. Hypoxia has been recognized as the most important feature of TME and the leading cause of radioresistance, which is caused by abnormal vessels and uncontrolled cell proliferation of tumors [5-6]. IR-induced vascular depletion aggravates hypoxia, which greatly reduces the production of ROS and increases the expression of hypoxia-inducible factor 1α (HIF1α), and ultimately promotes DNA repair and weakens the radiosensitivity of tumors [7-9]. Consequently, how to enhance the effect of RT on hypoxia tumors has attracted much attention.
High-Z nanomaterials have been used as radiosensitizers to make hypoxic tumors more sensitive to radiation by enhancing local dose deposition [10-12]. By virtue of synergetic therapeutic effects, the combination of RT with photodynamic therapy (PDT) has been proposed as another strategy for enhancing radiotherapeutic efficacy [13-15]. X-ray-induced PDT (X-PDT) has recently been proposed by utilizing lanthanide-based and metal-based scintillating nanomaterials to serve as indirect irradiation sources for photosensitizers under X-ray radiation [16-20]. The combination of RT and X-PDT can generate a large amount of ROS under X-ray radiation, which can promote tumor suppressor protein p53-dependent apoptosis and DNA radiation damage [21-23]. However, local oxygen consumption during the PDT process deteriorates tumor hypoxia and reduces antitumor therapeutic efficacy [24], while hypoxia and heterogeneous photosensitizer dose were the primary limitations of PDT used in the clinic [25]. Therefore, it is necessary to develop new approaches for achieving effective hypoxic sensitization by incorporating TME regulation into current strategies.
It has been appreciated that both RT and PDT can induce the production of nitric oxide (NO), which in turn affects the response of tumor cells to these treatments [26-27]. The effect of NO on RT and PDT is bidirectional depending on the NO concentration [28]: low NO concentration protects tumor cells from destruction and facilitates tumor progression; in contrast, high NO concentration promotes cytotoxicity and apoptosis [29-31]. Furthermore, elevated NO levels can also promote fixation of DNA radiation damage and enhance the sensitivity of hypoxic tumor cells to ROS [32]. In addition, NO has been proved to be an important vasodilator since the 1990s by relaxing vascular smooth muscles and consequently increasing blood flow, and many exogenous NO donors (e.g., isosorbide dinitrate) have been widely used in the clinical treatments of cardiovascular diseases [33-34]. Recently, NO-mediated vessel dilation has been proposed to be a promising approach to enhance the regional concentration of oxygen in tumors by modulating tumor blood flow, thereby reducing hypoxia-related resistance [35-38]. Therefore, introducing high levels of NO into the RT/X-PDT strategy is beneficial for overcoming radioresistance and largely raises the antitumor efficacy.
Herein, we have designed a kind of radiation-responsive scintillating nanotheranostic system to enhance RT effects on hypoxic tumors by multi-way therapeutic effects. This system was first developed by loading S-nitrosothiol groups (SNO, a NO donor) and indocyanine green (ICG, a photosensitizer) on mesoporous silica-coated Eu3+-doped NaGdF4 scintillating nanocrystals (NSC) (Figure 1A). X-ray radiation on this system can trigger multiple anti-tumor effects by: (i) increasing local dose deposition due to high-Z elements (Eu and Gd); (ii) generating ROS by activating ICG through NSC during the X-PDT process; and (iii) producing high NO concentration by radiation fracture of the S-N bond of SNO to enhance tumor-killing effects of RT/X-PDT and improve hypoxia via NO-induced vasodilation (Figure 1B). In vitro studies showed that these processes work in a combined manner, which greatly reinforces DNA damage and apoptosis in hypoxic tumor cells. In vivo studies revealed that this system could remarkably inhibit tumor growth, improve tumor hypoxia, and promote p53 up-regulation and HIF1α down-regulation. In comparison to the currently available nanomaterials [16-20], this system can realize the combined therapeutic effect of high local dosage, ROS, and NO levels that are all triggered by X-ray radiation and can be in vivo monitored by T1-weighted magnetic resonance (MR)/computed tomography (CT) imaging.
Results and discussion
Preparation and characterization of NSC@mSiO2-SNO/ICG NPs
This nanosystem was successfully synthesized by four steps (Figure S1A). Firstly, NSC with blossom-cluster-like morphology (Figure S1B) was prepared by a stoichiometric hydrothermal route. To provide docking sites and better biocompatibility for in vivo application, mesoporous silica was deposited on NSC (NSC@mSiO2, Figure S1C). Then, SNO groups were conjugated to the surface of NSC@mSiO2 nanoparticles (NPs) through nucleophilic substitution (NSC@mSiO2-SNO, Figure S1D), and FDA-approved ICG was subsequently loaded (Figure S1E). TEM images showed NSC@mSiO2-SNO/ICG NPs with uniform sizes having ~80 nm (SD = 8.68) of crystalline NSC core and ~25 nm (SD = 2.45) of mesoporous silica shell (Figure 2A). The legible core/shell structure and composition distribution were further verified by corresponding element mapping (Figure 2B).
In order to demonstrate the mesoporous structure of NSC@mSiO2-SNO/ICG NPs, nitrogen adsorption-desorption analysis was carried out. These obtained isotherms were similar to type IV adsorption isotherms with a H3 hysteresis loop between 0.4 and 1.0 relative pressure (P/P0), indicating the mesoporous characteristics of silica shells (Figure S2A-C). The BJH (Barrett-Joyner-Halenda) pore-size distributions were also determined (Figure S2D-F), showing narrow size distributions for all samples. In addition, BET (Brunauer-Emmett-Teller) surface areas and pore volumes were also calculated (Table S1). Pure NSC@mSiO2 NPs exhibited a high BET surface area of 347 m2 g-1 and a pore volume of 0.99 cm3 g-1, suggesting good mesoporous performance. After SNO conjugation, the pore size and pore volume showed a slight decrease, while the surface area was not remarkably reduced, indicating that the pore channels were not blocked after SNO conjugation. Further ICG loading led to smaller pore size, pore volume and specific surface area. The final NSC@mSiO2-SNO/ICG NPs exhibited a BET surface area of 276 m2 g-1 and a pore volume of 0.79 cm3 g-1 with pore size at 3.6 nm.
Figure 1
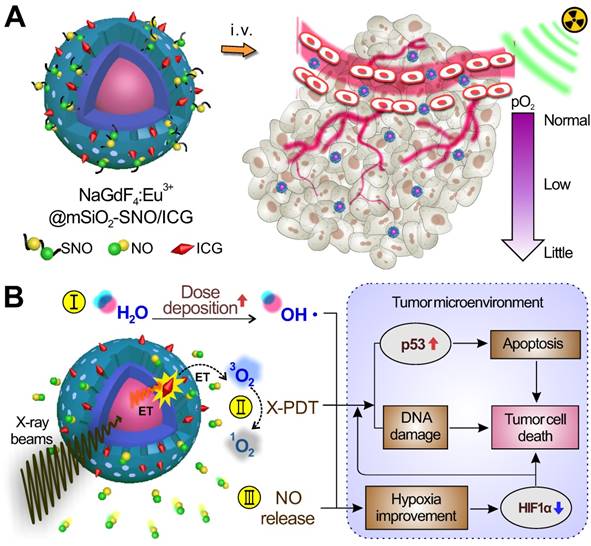
(A) Schematic of the structure of NSC@mSiO2-SNO/ICG NPs and their passive accumulation in tumors via the EPR effect. (B) X-ray radiation on this system would trigger multiple tumoricidal responses by: (I) increasing dose deposition to accelerate radiolysis, (II) producing cytotoxic ROS by activating ICG based on the scintillation effect of NSC, and (III) releasing high levels of NO due to radiation fracture of S-N bonds. The above combined therapeutic processes would promote p53 up-regulation for apoptosis and DNA damage. The high NO levels would improve hypoxia and promote HIF1α down-regulation within the TME.
X-ray diffraction analysis displayed that diffraction peaks of all samples were well-indexed to hexagonal β-phase of both NaGdF4 (JCPDS 27-0699) and NaEuF4 (JCPDS 49-1897) (Figure 2C). Moreover, a broad diffraction band centered at 2θ = 22° verified the successful amorphous SiO2 coating (Figure 2C), which was also confirmed by FTIR spectra with vibration of Si-O at 1080 cm-1 (Figure 2D). Characteristic peaks of S-N= at 705 cm-1 and N=O at 1506 cm-1 in FTIR spectra (Figure 2D) and the specific absorption band of 350-380 nm in UV-vis-NIR absorption spectra (Figure 2E) demonstrated that SNO groups were really conjugated to the NPs. Addition of the ICG component was validated by the broad absorption centered at 780 nm in UV-vis-NIR absorption spectra (Figure 2E), suggesting that NIR light could stimulate NSC@mSiO2-SNO/ICG NPs to produce ROS. Meanwhile, ICG loading capacity and entrapment efficiency were calculated to be 9.7% and 35.84% (w/w) (Figure S3). NSC@mSiO2-SNO/ICG NPs had an average hydrodynamic size of ~111 nm (SD = 8.13, PDI = 0.096) (Figure S4) and final zeta potential of -12 mV (Figure 2F), which would facilitate their passive accumulation in tumors for in vivo applications [39]. Then, the colloidal stability of this nanosystem was evaluated by incubation with distilled deionized (DI) water, phosphate buffered saline (PBS), and RMPI-1640 medium with and without fetal bovine serum (FBS). DLS sizes and photos showed no obvious agglomeration with little size changes observed in 7 days, and there were some slight accumulations after two weeks (Figure S5). These results indicated the relatively good colloidal stability of NSC@mSiO2-SNO/ICG NPs, which might benefit from the coverage of SNO groups that prevent aggregation caused by condensation of thiol and silanol groups between NPs [40-41].
Figure 2
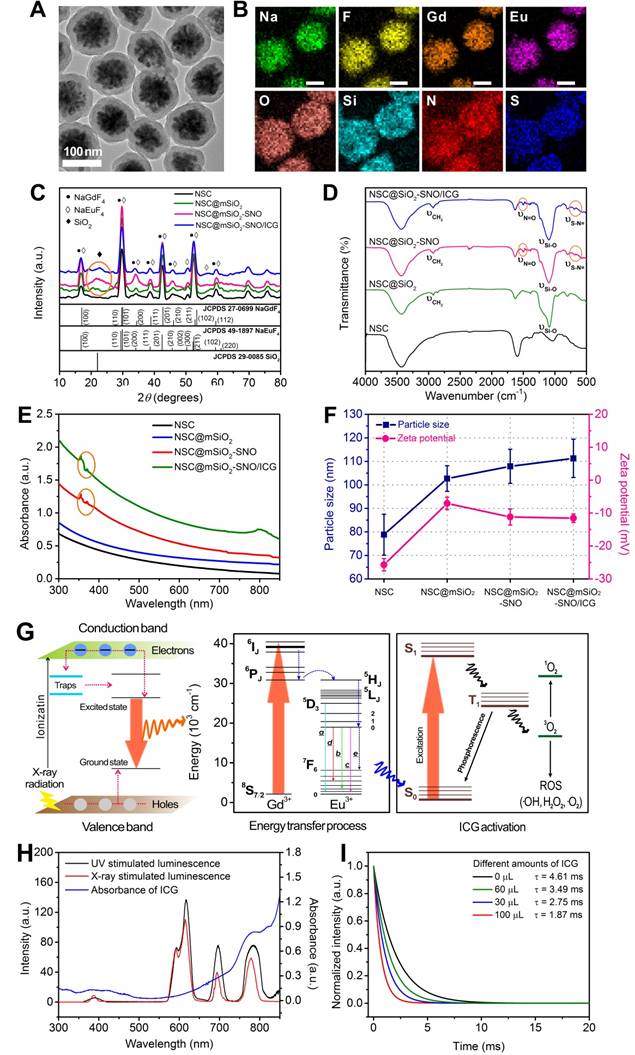
(A) TEM images of NSC@mSiO2-SNO/ICG NPs. (B) Corresponding element mappings (Na, F, Gd, Eu, O, Si, N and S). Scale bars, 50 nm. XRD patterns (C), FT-IR spectra (D), UV-vis-NIR absorption spectra (E) and hydrodynamic sizes and zeta potentials (F) of NSC, NSC@mSiO2 NPs, NSC@mSiO2-SNO NPs, and NSC@mSiO2-SNO/ICG NPs. (G) Schematic and energy level plot of X-ray excited luminescent process. (H) Spectrum overlap between X-ray excited luminescence of NSC@mSiO2-SNO NPs and the absorption of ICG. (I) Luminescence decay profile monitored at 780 nm for NSC@mSiO2-SNO/ICG NPs with difference amount of ICG loading.
X-ray excited luminescent process of NSC@mSiO2-SNO/ICG NPs
Scintillators were initially discovered and applied in high-energy physics, ray detectors and nuclear medical instruments [42]. Only recently, nano-sized scintillators represented by rare-earth halides have been exploited as promising candidates for X-ray transverters in tumor PDT [43]. As a scintillator, the prepared europium (Eu)-doped NaGdF4 nanocrystals convert high-energy X-ray into pulsed light, which serves as an indirect irradiation source for the photosensitizer ICG in this work. The scintillating performance of the NSC cores can be comprehended by the luminescence mechanism illustrated by energy band theory (Figure 2G, left). The scintillation process includes the following three stages: (i) absorption of high-energy rays creates plenty conductance electrons and valence holes, which can move freely between lattices; (ii) energy transfer from electron-hole pairs to luminescent ions or trap capture; and (iii) fluorescence emission from the excited state back to the ground state via cascade transition from sensitizer ions Gd3+ to neighboring emitter ions Eu3+, as described in the energy level diagram schematic (Figure 2G, right) [43]. Specifically, the energy discrepancy between 6IJ→6PJ of Gd3+ matches well with that of 5D0→7FJ of Eu3+, which contributes to all emission bands at wavelengths higher than 500 nm in the UV-excited photoluminescence spectra and X-ray luminescence spectra (Figure S6). Consistent with previous reports [44], the intensities of 5D0→7F2 (616 nm, c) transition were stronger than that of 5D0→7F1 (591 nm, b) transition, indicating the acentric symmetry of Eu3+ ions in the hexagonal NaGdF4 phases for all samples. The intensity of 5D3→7F1 (390 nm, a) transition was caused by cross-relaxation between higher 5DJ levels due to the large doping ratio of Eu3+ (15 mol%). Furthermore, the unusual emissions of 5D0→7F4 (698 nm, d) transition and 5D0→7F6 (780 nm, e) transition were also attributed to Eu3+ located in the shells.
For X-PDT, the therapeutic effect is directly determined by the effective energy transfer, which is largely dependent on the well overlapping of scintillation cores' emission with photosensitizers' absorption [45]. Interestingly, the emission of NSC@mSiO2-SNO NPs at 780 nm overlaps the ICG characteristic absorption band centered at 784 nm (Figure 2H), indicating that ICG could be considered an efficient acceptor for NSC@mSiO2-SNO NPs. In addition, the photosensitizer loading strategy can also influence energy transfer efficiency, and mesoporous silica coating was used in our work to load photosensitizers, because their porous structure and large surface area were beneficial for enhanced X-PDT (Figure S2 and Table S1) [45]. After the loading of ICG, X-ray luminescence spectra showed that the emission of the NPs, which is centered at 780 nm, is replaced by the emission band of ICG, which is centered at 808 nm (Figure S6A). This phenomenon was not observed in UV-excited photoluminescence spectra (Figure S6B), indicating that only X-ray radiation induced energy transfer from NSC@mSiO2-SNO NPs to ICG molecules. To confirm this energy transfer, fluorescence decay curves of NSC@mSiO2-SNO/ICG NPs were measured at 780 nm at different ICG loading concentrations. All the curves were described by a single exponential decay law and the measured luminescence lifetimes were in the range of milliseconds (Figure 2I). With increasing ICG loading concentration, the lifetime of this nanosystem gradually reduced compared with that of NPs without ICG loaded (Figure 2I). These results demonstrated the occurrence of energy transfer in NSC@mSiO2-SNO/ICG NPs from the NSC core to ICG under X-ray radiation. Furthermore, shortening the distance between photosensitizers and scintillation cores will help to further improve energy transfer efficiency [45].
X-ray-induced ROS and NO production by NSC@mSiO2-SNO/ICG in vitro
To further evaluate the potential of utilizing NSC@mSiO2-SNO/ICG NPs for X-PDT, ROS generation capability was assessed by analyzing the production of hydroxyl radicals (·OH) and singlet oxygen (1O2) at various radiation doses. ·OH formed from radiolysis selectively bleaches methylene blue (MB) to lower its absorption at ~664 nm. Compared with control (DI-water), a considerable drop in MB absorption was observed for NSC@mSiO2-SNO NPs, revealing its high radiosensitization. Since ICG cannot absorb radiation energy without the scintillating conversion effect of NSC core, it was difficult to produce more ·OH using free ICG alone. For NSC@mSiO2-SNO/ICG NPs, the introduction of ICG to NSC@mSiO2-SNO NPs further enhanced ·OH formation under radiation, because X-PDT occurred at this time, resulting in the direct reaction of triplet-excited electrons with activated ICG biomolecules (Figure 3A-B and Figure S7). Additionally, 3-coumarin-carboxylic acid (3-CCA) was also used as a specific probe to validate the production of ·OH, which can react with 3-CCA to produce 7-hydroxycoumarin-3-carboxylic acid with strong fluorescence signal [46]. The results showed that the fluorescence intensity of NSC@mSiO2-SNO/ICG NPs was significantly higher than that of NSC@mSiO2-SNO NPs (Figure S8), further demonstrating the increased production of ·OH after ICG loading under radiation. Furthermore, the activated ICG could transfer energy to surrounding molecular triplet oxygen (3O2), resulting in cytotoxic 1O2 production, which is responsible for cell apoptosis and vascular injuries [45]. 1O2 production can be monitored by irreversible quenching of 1,3-diphenylisobenzofuran (DPBF), exhibiting decreased absorption at ~417 nm (Figure S9). Compared with DI-water, free ICG and NSC@mSiO2-SNO NPs, only NSC@mSiO2-SNO/ICG NPs induced greatly increased production of 1O2 (Figure 3C-D), indicating the effective X-PDT induced by NSC@mSiO2-SNO/ICG NPs. So, the X-PDT process can be regarded as a conversion from radiation energy to ROS-produced chemical energy. According to previously reported work [19], X-PDT efficiency could be evaluated by calculating the ROS production efficiency under different radiation doses. In our work, X-PDT was only induced by NSC@mSiO2-SNO/ICG NPs, and its average ROS production efficiency was calculated to be about 9.93% (Table S2), compared to 0.32% of NSC@mSiO2-SNO NPs and 0.0083% of free ICG, indicating the effective X-PDT process. These findings implied the essential role of the NSC core as an effective convertor for ICG activation and consequently ROS production when exposed to X-ray radiation.
Figure 3
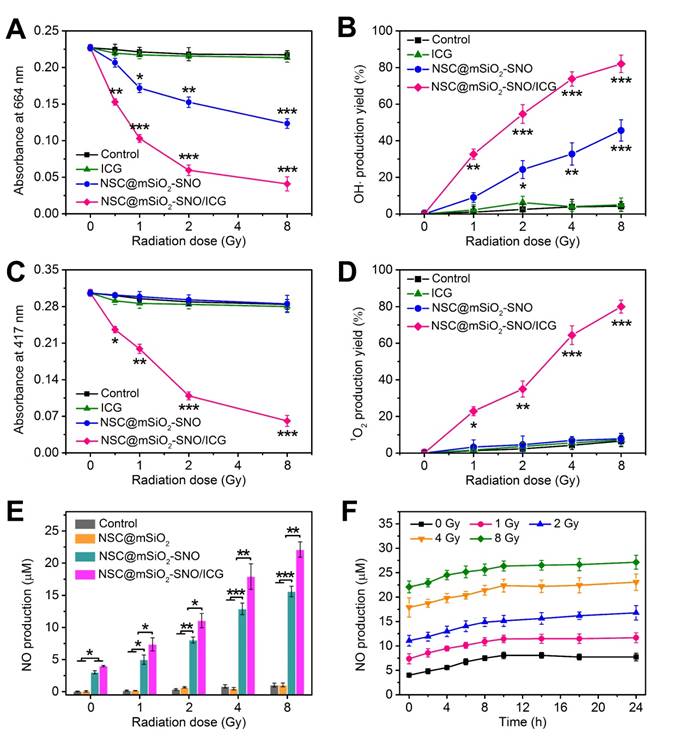
(A-D) Absorption decay of MB at 664 nm (A) and DPBF at 417 nm (C) to respectively determine the production yield of ·OH (B) and 1O2 (D). (E) NO production concentrations subjected to X-ray radiation with varied doses. (F) Persistent accumulation of NO within 24 h from NSC@mSiO2-SNO/ICG NPs after radiation at varied doses. X-ray energy: 6 MeV. Error bars: mean ± standard deviation for at least three replicates. P values: *P < 0.05; **P < 0.01; ***P < 0.001.
NO released from NSC@mSiO2-SNO/ICG NPs under X-ray radiation was detected using nitrate reductase and measured as nitrite absorbance at 550 nm (Figure S10). Compared to control and NSC@mSiO2 NPs, NSC@mSiO2-SNO NPs caused abundant NO production within the micromolar range, suggesting that NO derived from the SNO component via cleavage of the S-N bond by X-ray radiation (Figure 3E). This could be explained by the finding that the S-N bond of SNO can be broken by high-energy X-rays, which are able to cleave S-S covalent bonds with a bond energy (240 kJ mol-1) higher than that of S-N bond (150 kJ mol-1) [47-48]. Because oxidative radicals may accelerate this decomposition [49], we speculated that the ICG decoration for ROS production would further elevate this radiation-responsive NO release. This hypothesis was substantiated by the finding that NSC@mSiO2-SNO/ICG NPs showed much greater NO release than NSC@mSiO2-SNO NPs after radiation (Figure 3E). Size and morphology observation showed that the mesoporous silica shells protected the NSC cores from damage, as all samples did not significantly change in particle size after X-ray radiation at 4 Gy (Figure S11), indicating the good stability of NSC@mSiO2-SNO NPs against radiation. Meanwhile, continuous release experiments showed that NO was released shortly after radiation, then slowly increased to the highest level at around 10 h, and this level was maintained for at least 24 h (Figure 3F). Moreover, the maximum concentration of released NO was used to evaluate the percentage of conjugated SNO groups on the surface of NSC@mSiO2 NPs, which was calculated to be 15.09% (w/w).
Radiation-induced ROS/NO production in normoxic and hypoxic tumor cells
Prior to in vitro and in vivo studies, the bio-safety of NSC@mSiO2-SNO/ICG NPs was investigated by MTT assays for different normal and cancer cells such as mouse mammary epithelial cells, human mammary epithelial MCF-10A cells, mouse breast cancer 4T1 cells, human breast cancer MCF-7 cells, human glioma U251 cells and human cervical cancer HeLa cells. Under both normoxic (21% O2) and hypoxic (2% O2) atmospheres, cell viability for all studied cell lines was still ~90% even at high concentrations (200 μg mL-1), suggesting the low cytotoxicity of this nanosystem (Figure S12). In addition, each product during the synthesis process also showed negligible cytotoxicity to 4T1 cells (Figure S13).
ROS generation in 4T1 cells treated with NSC@mSiO2-SNO/ICG NPs after radiation was evaluated by detecting green fluorescence derived from the reaction of ROS with 2',7'-dichlorofluorescein diacetate (DCFH-DA) probe, and NO generation was evaluated by detecting blue fluorescence derived from the reaction of NO with 3-amino-4-aminomethyl-2',7'-difluorescein diacetate (DAF-FM DA) probe. According to confocal laser-scanning microscopy (CLSM) images, red fluorescence emitted from the NSC cores indicated that NSC@mSiO2-SNO NPs entered the cytoplasm of 4T1 cells by endocytosis (Figure S14). Without X-ray radiation, no green fluorescence was observed in all samples. Only faint blue fluorescence was observed in SNO-conjugated samples (Figure S14), possibly due to inefficient NO release without radiation. After 4 Gy X-ray radiation, a slight enhancement of green fluorescence intensity was observed in normoxic cells, while hypoxic cells exhibited nearly no signal (Figure 4A), which supported the importance of oxygen to ROS production during RT. Because cellular uptake of NPs was not affected by oxygen conditions (Figure S15-16), only NSC@mSiO2 NPs treatments promoted ROS production in both normoxic and hypoxic conditions during RT (Figure 4B). The later introduction of SNO and ICG one by one brought more and stronger green fluorescence (Figure 4C-D). Quantitative analysis by flow cytometry revealed that NSC@mSiO2-SNO/ICG NPs treatment yielded about 2-fold ROS after radiation compared to single RT treatment (Figure 5A). Moreover, NSC@mSiO2-SNO/ICG NPs exhibited a surge of NO release with 1.5-fold production, exceeding that of NSC@mSiO2-SNO NPs (Figure 5A), which was a sharp contrast to the hardly generated NO in 4T1 cells loaded with and without NSC@mSiO2 NPs under RT exposure (Figure 4 and Figure S16), further suggesting the successful conjugation of SNO component and the promotion of NO release by ROS production. Encouragingly, the above phenomenon was also found in hypoxic groups whose blue luminescence nearly caught up to that of the normoxic groups (Figure 4C-D), which benefited from a rather high level of NO release under hypoxic conditions, although slightly lower than that under normoxic conditions (Figure 5A). These results identified that NO release can benefit from intracellular ROS production induced by X-PDT in both normoxic and hypoxic conditions.
In vitro NO-promoted RT combined with X-PDT
To evaluate the promotion effect of NSC@mSiO2-SNO/ICG NPs on post-radiation cell damage, we first analyzed the viability of 4T1 cells treated with various mass concentrations of NPs after radiation (Figure S17). Under RT exposure (4 Gy) alone, normoxic cell viability decreased to 85% while hypoxic cell viability was still maintained above 95%, suggesting an association between hypoxia and radioresistance. The cytotoxicity was remarkably increased after NSC@mSiO2 NPs (50 μg mL-1) + RT treatment. Consistent with the above results of ROS and NO production, hypoxic cytotoxicity was lower than that of normoxic, but this gap was gradually narrowed by sequentially adding SNO and ICG into the composition (Figure S18). In addition, similar changes of cell destruction as well as quantitative intracellular ROS/NO production were also found for MCF-7 cells, U251 cells and HeLa cells, suggesting that this strategy was applicable to different cancer cell lines (Figure S19-20). To assess the effect of oxygen and NSC@mSiO2-SNO/ICG NPs on cell proliferation during radiation, a colony formation assay was performed to determine the survival fractions for various treatments. For hypoxic cells, the median lethal dose was 0.72 times higher than that for normoxic cells (Figure S21), demonstrating that hypoxia can attenuate radiation damage and restore the proliferative capacity of sublethally damaged cells [8,11]. For both hypoxic and normoxic cells, the survival fractions after different NPs treatments showed that the obvious radiosensitizing effects increased with the addition of different components (Figure 5B and Figure S22). Especially, after NSC@mSiO2-SNO/ICG NPs + RT treatment, the survival fraction showed the most significant reduction (0.118 ± 0.011 for hypoxic condition, P < 0.01; 0.256 ± 0.020 for normoxic condition, P < 0.001), compared with RT alone, NSC@mSiO2 NPs + RT, and NSC@mSiO2-SNO NPs + RT treatments (Figure 5B). These results indicated that NSC@mSiO2-SNO/ICG NPs can overcome hypoxic radioresistance of tumor cells by the NO-promoted therapeutic effect of RT combined with X-PDT.
Figure 4
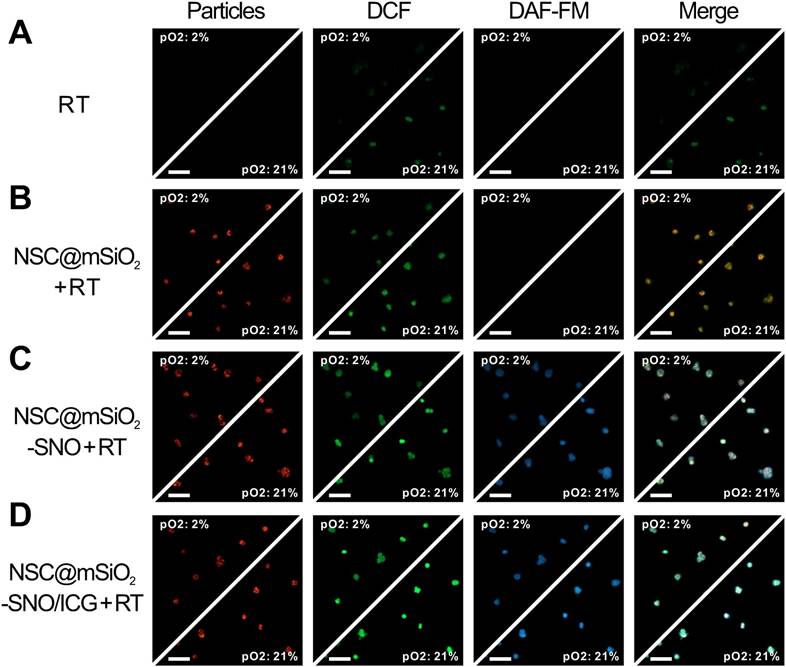
CLSM fluorescence images of ROS and NO generation in 4T1 cells after normoxic (21% O2) and hypoxic (2% O2) incubation for different treatments including RT alone (A), NSC@mSiO2 + RT (B), NSC@mSiO2-SNO + RT (C), and NSC@mSiO2-SNO/ICG + RT (D). Green and blue luminescence indicated DAF-FM DA and DCFH-DA staining respectively for intracellular ROS and NO, while red luminescence was emitted from NSC cores upon UV excitation. Merge: NSC cores/DCF/DAF-FM. X-ray energy: 6 MeV. X-ray radiation dose: 4 Gy. NPs mass concentration: 50 μg mL-1. Scale bars, 100 μm.
Figure 5
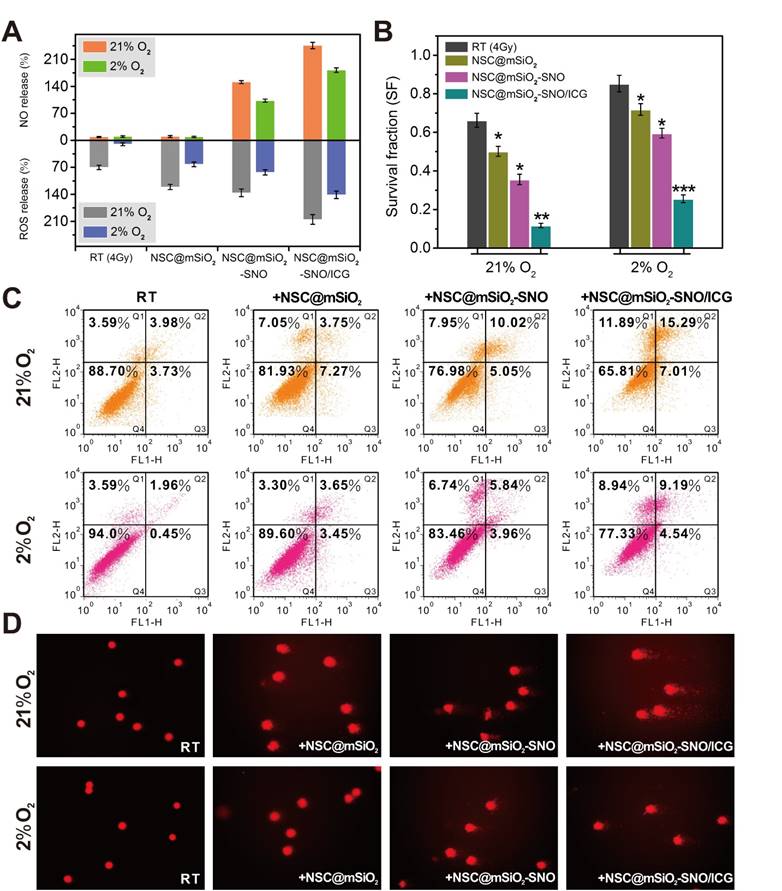
(A) Flow cytometry for quantifying intracellular ROS and NO in both normoxic (21% O2) and hypoxic (2% O2) cells after different treatments. (B) Survival fractions calculated from 4T1 cells after different treatments. (C) Flow cytometry analysis for cell apoptosis. (D) Comet images for DNA fragmentation. X-ray energy: 6 MeV. X-ray radiation dose: 4 Gy. NPs mass concentration: 50 μg mL-1. Error bars: mean ± standard deviation for at least three replicates. P values: *P < 0.05.
Moreover, corresponding radiation-induced cell apoptosis was quantitatively investigated by flow cytometry using Annexin V-FITC/PI staining. In contrast to control, non-irradiated NPs treatments led to little cell death independent of oxygen conditions (Figure S23). RT alone treatment caused a normoxic apoptotic ratio of 7.71% and a hypoxic apoptotic ratio of 2.4% (apoptotic ratio: a sum of the early apoptotic ratio in the Q3 region and the late apoptotic ratio in the Q2 region), indicating hypoxia-induced radioresistance. Compared with other NPs treatments, NSC@mSiO2-SNO/ICG NPs treatment under radiation caused significantly increased apoptotic ratio (normoxic: 22.3%; hypoxic: 13.7%) (Figure 5C). These findings suggested that NSC@mSiO2-SNO/ICG NPs can effectively reduce hypoxia-induced radioresistance via facilitating apoptosis of tumor cells.
Meanwhile, comet assay was used to judge DNA injury severity by observing and quantifying comet tails formed by denatured DNA fragments. Invisible comet tails for both control and NPs treatments without radiation supported the low cytotoxicity of NSC@mSiO2-SNO/ICG NPs (Figure S24). The 4 Gy exposure induced a small tail in normoxic cells but not in hypoxic cells, indicating that the single use of RT cannot impair DNA of hypoxic cells (Figure 5D). However, NSC@mSiO2-SNO/ICG NPs gave rise to much longer tails and significantly increased percentage of tail DNA and tail moment than did other NPs for both normoxic and hypoxic groups (Figure S25 and Table S3). Considering ROS, NO and DNA changes with sequential addition of SNO and ICG (Figure 5), NSC@mSiO2-SNO/ICG NPs could increase the radiosensitivity of hypoxic tumor cells via the DNA damage enhanced by this multi-way combined therapeutic effect.
In vivo MR/CT imaging and pharmacokinetic studies
Next, we performed T1-weighted MR and CT imaging of 4T1 xenograft tumor-bearing mice after intravenous injection of NSC@mSiO2-SNO/ICG NPs (100 μL, 25 mg kg-1 mice). MR and CT images were obtained at pre-injection and 4, 12, 24, and 48 h post-injection. Both T1-weighted MR and CT signals in tumor sites gradually increased until 24 h (Figure 6A). Quantitative MR signal intensity and CT values showed the maximum increase (3.03-fold for MR, 4.68-fold for CT) at 24 h post-injection (Figure 6B), suggesting efficient tumor accumulation of this nanosystem via the enhanced permeability and retention (EPR) effect. The corresponding longitudinal relaxivity (r1) and CT enhancement factor of this nanosystem were respectively calculated to be 16.18 mM-1 s-1 and 4.976 mM-1 HU-1, which were much higher than those of clinically used contrast agents Magnevist (3.69 mM-1 s-1) and Iohexol (2.053 mM-1 HU-1) (Figure 6C-D).
To further verify that the NPs can take advantage of the EPR effect, we studied the pharmacokinetics of intravenously injected NSC@mSiO2-SNO/ICG NPs. The blood-circulation curve followed a two-compartment model and presented a first-phase half-life of 0.460 h and a second-phase half-life of 4.515 h (Figure 6E). The biodistribution results showed that NSC@mSiO2-SNO/ICG NPs were mainly accumulated in the mononuclear phagocyte system (MPS) (liver and spleen) (Figure 6F), which is widely observed for nanomaterials. Consistent with the MR imaging results, a rather high quantity of this nanosystem was retained in the tumor, which was determined to be ∼13.9 %ID g-1 at 24 h post-injection (Figure 6G), which was attributed to the efficient EPR effect. Moreover, in order to investigate in vivo excretion, accumulation of NSC@mSiO2-SNO/ICG NPs in major tissues was detected by analyzing Ln concentrations at 1 day, 2 days, 4 days and 7 days post-injection (Figure 6H). Among all the studied tissues, NSC@mSiO2-SNO/ICG NPs had high accumulation efficiencies in the liver (~34.1 %ID g-1) and spleen (~35.4 %ID g-1) at 24 h post-injection. Within 7 days, their accumulations gradually decreased, but remained at a high level for liver (~ 0.9 %ID g-1) and spleen (~14.5 %ID g-1) at 7 days post-injection, probably due to hard-nanomaterial clearance through the MPS [50]. In addition, renal clearance was also evaluated by analyzing Ln concentrations in the kidney and urine of mice intravenously injected with NSC@mSiO2-SNO/ICG NPs. At the initial 12 h timepoint post-injection, there was ~8.2 %ID g-1 accumulation in the kidney and ~12.3 %ID g-1 cleared out via the urine, which dropped rapidly to low levels within the following days (Figure S26). So, NSC@mSiO2-SNO/ICG NPs were mainly captured and excreted by the liver and spleen, which might promote their biodegradation and consequently lead to renal clearance within 12 h post injection. The biodegradability and clearance of siliceous nanomaterials and hard-nanomaterials have been widely studied, since they are the primary factors for future clinical application [51-53]. Croissant's work used various TEM, SEM, and fluorescent images to show that siliceous nanomaterials can be degraded and further renally excreted, which could be enhanced by improving the particle porosity [51]. He and co-workers also found that fluorescently labeled mesoporous silica NPs with large sizes are mainly obtained by liver and spleen, while these NPs could be partly excreted by kidney and urine, based on the especially from 30 min to 24 h post-injection [52]. Yu's studies showed that lanthanide-based NPs can be decomposed inside the macrophages after MPS uptake [53]. Based on the above studies, in our work, the hypothesized mechanism of biodegradation in liver and spleen to renal redistribution was proposed to explain the results of some renal clearance especially within 12 h post injection. For future clinical application, size reduction and PEG surface modification would be needed to prolong the in vivo circulation time and preventing NPs from being captured by liver and spleen. Moreover, a targeting ligand could be further used to improve tumor-specific accumulation.
Figure 6
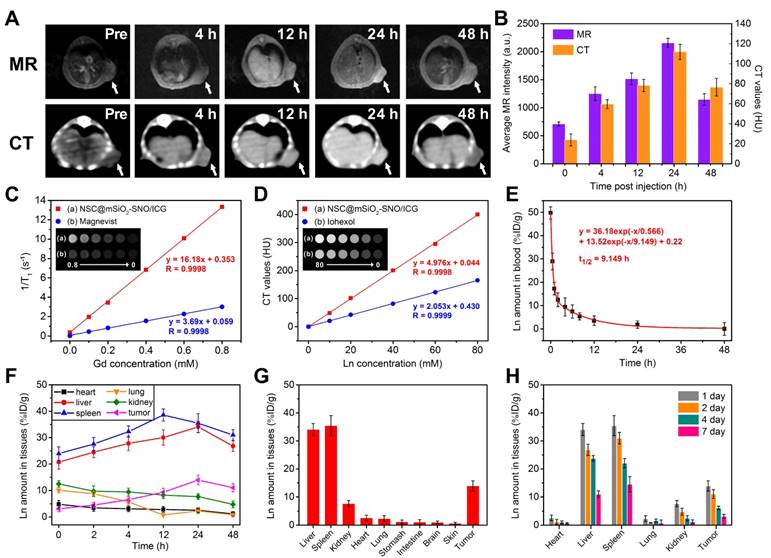
In vivo T1-weighted MR and CT images at different time points after intravenous injection of NSC@mSiO2-SNO/ICG NPs (100 μL, 25 mg/kg mice) (A) and corresponding quantitative signal intensities of tumors (B). (C) Longitudinal relaxation rates (1/T1) and T1-weighted MR images (inset) of NSC@mSiO2-SNO/ICG NPs vs. Gd concentration. (D) CT values (HU) and CT images (inset) of NSC@mSiO2-SNO/ICG NPs vs. lanthanide concentration (Ln = Gd + Eu). (E) Blood circulation profile. Time-dependent biodistribution of NSC@mSiO2-SNO/ICG NPs in 4T1 tumor-bearing mice within 48 h post-injection (F) and at 24 h post-injection (G). (H) Time-dependent biodistribution at 1 day, 2 days, 4 days and 7 days post-injection. The injection method of NPs: intravenous injection.
In vivo antitumor evaluation of NO-promoted combined RT/X-PDT
To explore the cytodistribution of NSC@mSiO2-SNO/ICG NPs in tumor tissue, we performed ex vivo immunofluorescence staining of tumor slices from 4T1 xenograft tumor-bearing mice after 24 intravenous injections of NPs. The results demonstrated that this nanosystem can be effectively uptaken by the tumor cells of tumor tissue (Figure 7A and Figure S27). Then, the mice treated with NSC@mSiO2-SNO/ICG NPs were subjected to RT exposure at 4 Gy to evaluate antitumor efficacy. In contrast to all groups without RT, RT alone slightly prohibited tumor growth (Figure S28). Impressively, compared to other NPs samples plus RT treatments, NSC@mSiO2-SNO/ICG NPs + RT treatment completely arrested tumor growth and displayed greater RT reinforcement (P < 0.01) (Figure 7B), which was further confirmed by 30-day long-term tumor inhibition studies (Figure S29). The body weights of the mice that received the different treatments fluctuated within the normal range for two weeks (Figure 7C). Neither pathological abnormalities in major normal organs (Figure S30) nor statistical discrepancy in blood routine examination (Figure S31) were observed, suggesting the biosafety of NSC@mSiO2-SNO/ICG NPs. In addition, long-term survival curves showed that NSC@mSiO2-SNO/ICG NPs + RT treatment extremely prolonged the lifespan of 4T1 xenograft tumor-bearing mice (Figure 7D). These results provided powerful proofs of the potential of NSC@mSiO2-SNO/ICG NPs for curing intractable solid tumors.
Further, this multi-way combined therapeutic effect on tumors was examined by histological analysis including hematoxylin and eosin (H&E) and terminal deoxynucleotidyl transferase dUTP nick end labeling (TUNEL) assays. For the NSC@mSiO2-SNO/ICG NPs + RT group, H&E-stained images showed substantial cell necrosis, while TUNEL-stained images revealed pronounced apoptosis and DNA damage compared to other treatment groups (Figure 7E and Figure S32). Subsequently, we utilized pimonidazole as a probe to label hypoxic regions in tumors for ex vivo immunofluorescence staining to evaluate tumor hypoxia levels after different treatments. The tumor slices exhibited severe tumor hypoxia in the control group as well as in the only NPs treatment groups (Figure S33). Semiquantitative analysis of positive hypoxic signals showed that RT alone treatment increased the percentage tumor hypoxic area from 58.44% for the non-radiation group to 63.51%, which was further obviously reduced to 50.15%, 31.47%, and 14.63% for RT treatment with NSC@mSiO2 NPs, NSC@mSiO2-SNO NPs, and NSC@mSiO2-SNO/ICG NPs, respectively (Figure 7F). The changes in hypoxic fluorescence intensity also confirmed that this nanosystem dramatically improves hypoxia in tumors (Figure 7G), which might be due to vasodilatation caused by the high levels of NO increasing blood flow and local oxygenation in the tumors [33-35].
Figure 7
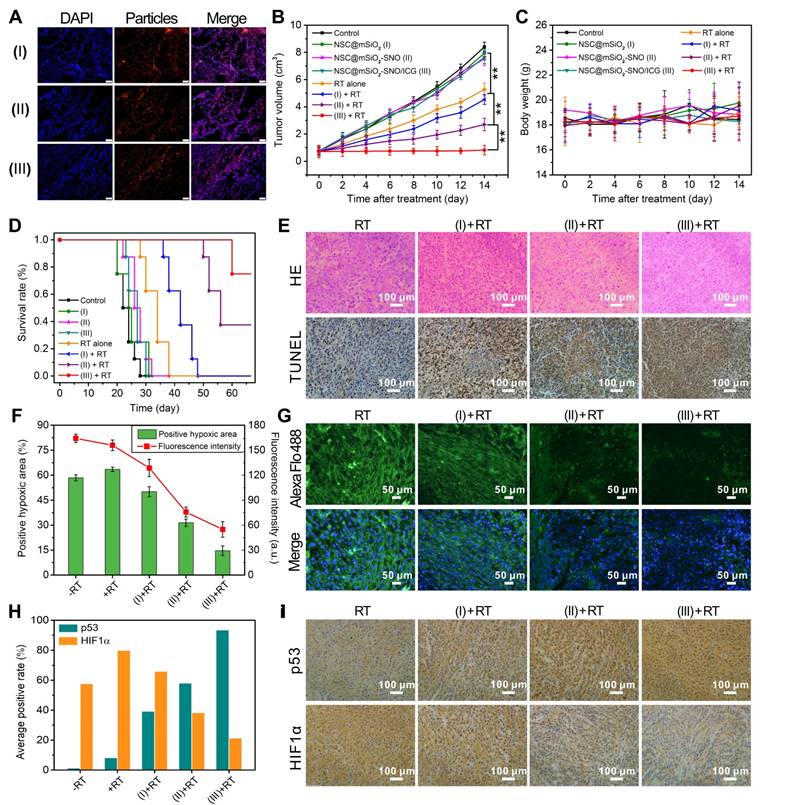
(A) Ex vivo immunofluorescence images of tumor slices from mice after 24 intravenous injections of NPs (scale bars = 50 μm). Tumor growth inhibition curves (B) and average body weights (C) of 4T1 tumor-bearing mice for different NPs (100 μL, 25 mg/kg mice) treatments with and without X-ray radiation. (D) Survival rates. (E) H&E and TUNEL staining assays of collected tumors at 14 days for histological and apoptotic observation. (F) Semiquantitative analysis of positive hypoxic regions and corresponding fluorescence intensities shown in ex vivo immunofluorescence staining images (G) of tumor slices for different treatments. (H) Average positive rates of p53 and HIF1α expression shown in immunohistochemical images (I). (I): NSC@mSiO2 NPs; (II): NSC@mSiO2-SNO NPs; (III): NSC@mSiO2-SNO/ICG NPs. Error bars: mean ± standard deviation for at least three replicates. P values: *P < 0.05; **P < 0.01. X-ray energy: 6 MeV. X-ray radiation dose: 4 Gy. The injection method of NPs: intravenous injection.
Furthermore, immunohistochemical assays showed that, following the addition of each compound one-by-one in combination with RT, the expression of p53 (an important tumor suppressor) was constantly up-regulated to 93.5% of the average positive rate, and simultaneously, the expression of HIF1α (a hypoxic indicator) was downregulated to 21.3% (Figure 7H-I). It was found that although HIF1α expressions were up-regulated with both RT and NSC@mSiO2 + RT treatment, there was a slight decrease in HIF1α expression for NSC@mSiO2 + RT treatment compared with RT. This might be due to the need for HIF-1a dephosphorylation to bind and stabilize the large amount of p53 produced during the process of radiosensitization-induced apoptosis under hypoxia [54-55]. In addition, the expressions of other tumor progression-related biomarkers, including CD34 (hematopoietic progenitor cell antigen, a biomarker of angiogenesis), Ki-67 (proliferation-associated nuclear antigen, a biomarker of cell proliferation) and MMP-2 (matrix metalloproteinase-2, a biomarker of tumor invasion), were substantially down-regulated (Figure S34). These preliminary results suggested that ROS/NO-mediated RT strategy has great potential to strengthen tumor radiosensitization, conquer tumor hypoxia and interrupt tumor progression.
Conclusion
In conclusion, we report a scintillating nanotheranostic system of NSC@mSiO2-SNO/ICG NPs to overcome radioresistance and enhance RT efficacy. This nanosystem offers strong T1-weighted MR and CT contrast enhancement in tumor regions, as confirmed by in vivo MR/CT multimodal imaging. X-ray radiation on this system triggered multiple tumoricidal responses including high local dosage, ROS production and NO release, which are respectively attributed to radiosensitization of high-Z atoms (Gd, Eu), X-PDT using NSC core as an X-ray transducer to activate ICG, and radiation fracture of S-N bonds. High levels of generated NO can enhance the tumor-killing effects of radiosensitization and X-PDT while improving hypoxia via NO-induced vasodilation. In vitro and in vivo studies showed that this combined therapeutic strategy not only greatly reinforced DNA damage and apoptosis in hypoxic tumor cells, but also significantly suppressed tumor growth, improved tumor hypoxia, increased p53 expression and decreased HIF1α expression. The expressions of other biomarkers related to tumor progression were also down-regulated, demonstrating the potential of this system to depress tumor progression. Taken together, we proposed a promising approach to develop scintillating nanotheranostics for multimodal imaging-guided X-ray radiation-triggered combined therapeutic therapy to overcome tumor radioresistance.
Methods
Materials
GdCl3·6H2O, EuCl3·6H2O, sodium citrate (Na3Cit), sodium fluoride (NaF), cetyltrimethylammonium chloride (CTAC), tetraethyl orthosilicate (TEOS), 3-mercaptopropyltrimethoxysilane (MPTES), 1,3-diphenylisobenzofuran (DPBF), t-butyl nitrite, indocyanine green (ICG), methylene blue (MB), and 3-coumarin-carboxylic acid (3-CCA) were purchased from Sigma-Aldrich. Reactive Oxygen Species Assay Kit (2',7'-dichlorofluorescein diacetate (DCFH-DA)), and Annexin V-FITC/PI Apoptosis Detection Kit, Nitric Oxide Detection Kit (3-amino-4-aminomethyl-2',7'-difluorescein diacetate (DAF-FM DA)) were obtained from Beyotime Biotechnology Co., Ltd, China. NH3·H2O (25%-28%), HCl (36%-38%), triethanolamine (TEA), sodium chloride (NaCl), ethanol (99.5%), absolute methanol, and toluene were purchased from Guangfu Fine Chemical Research Institute (Tianjin, China). All chemical agents were of analytical grade and used without any purification. Deionized (DI) water (18.2 MΩ cm) was obtained from a Milli-Q ultrapure water system.
Synthesis of NaGdF4: (15%) Eu3+ NSC NPs
β-phase blossom-cluster-like NSC NPs were synthesized by the typical citrate-based hydrothermal method [44,56]. At room temperature, 4 mL lanthanide chlorides solutions with the stoichiometric ratios GdCl3·6H2O (252.76 mg, 0.68 mmol) and EuCl3·6H2O (43.97 mg, 0.12 mmol) were mixed with 8 mL Na3Cit (70.58 mg, 2.4 mmol) as a chelating agent for metal ions under 1 h vigorous stirring. Then, 5 mL NaF (209.95 mg, 5 mmol) was dropwise added and a colloidal solution was formed within another 1 h of vigorous stirring. Subsequently, the pH value was regulated to around 8 by diluted NH3·H2O and HCl. The final solutions were transferred into a stainless steel Teflon-lined autoclave (20 mL) and afterwards heated at 210 °C for 1 h. After being cooled down completely to room temperature, NSC NPs were washed twice with DI water by centrifugation and finally dispersed in DI water for the following measurements and experiments.
Synthesis of NSC@mSiO2 NPs
Mesoporous silica coating and SNO group conjugation were performed according to previous reports [19,48]. Briefly, 5 mL prepared NSC NPs were added into 12 mL aqueous solution containing CTAC (1 g) and TEA (0.01 g) under 1.5 h vigorous stirring at room temperature. After adding 150 µL TEOS dropwise, the system temperature was increased to 80 °C and maintained for 1 h. The obtained NPs were washed twice with ethanol and then mildly stirred with 30 mL NaCl (0.03 g) ethanol solution overnight to remove the CTAC template. The final NSC@mSiO2 NPs were washed twice and partially dispersed in DI water for measurements.
Synthesis of NSC@mSiO2-SNO NPs and ICG loading
Ethanol-dispersed NSC@mSiO2 NPs were successively mixed with 37.5 µL MPTES and 60 µL NH3·H2O with overnight stirring at room temperature. The resulting NPs were washed twice with ethanol and then dispersed in 15 mL methanol/toluene (v/v = 4:1) solution and later mixed with 1 mL t-butyl nitrite for 24 h with stirring in the dark. The final NSC@mSiO2-SNO NPs were washed by centrifugation and redispersed in DI water. For ICG loading, 4 mL ICG solution (37 μg mL-1) was mixed with NSC@mSiO2-SNO NPs overnight with stirring at room temperature. The prepared NSC@mSiO2-SNO/ICG NPs were finally obtained after washing several times with DI water. In addition, the supernatant solution containing unloaded ICG was collected to determine its characteristic absorbance at 780 nm. A standard curve of absorbance vs. ICG concentration (Figure S2) was used to calculate the concentration and weight of unloaded ICG. ICG loading weight was obtained by the difference between the original input and the unloaded weight. Loading capacity and entrapment efficiency of ICG were measured according to the following equations: Loading capacity (w/w %) = (ICG loading weight / final NPs weight) × 100%; Entrapment efficiency (w/w %) = (ICG loading weight / ICG input weight) × 100%.
Characterizations
Transmission electron microscopy (Tecnai G2 F20, FEI) was used to determine the morphology and elemental mapping X-ray diffraction (XRD) was measured usong an X-ray diffractometer (Bruker AXS, D8-Focus) with 4° min-1 scanning rate in a 2θ range of 10-80°. Fourier transform infrared (FTIR) spectra were acquired using a FTS 6000 spectrometer (Bio-Rad Company, Hercules, CA). A UV-vis-NIR spectrophotometer (UV-3600 Plus, SHIMADZU) was employed to measure characteristic absorption. Dynamic light scattering (DLS) sizes and zeta potential were determined using a Nano-Zetasizer ZS 90 (England). Nitrogen adsorption-desorption isotherms were measured to evaluate BET (Brunauer-Emmett-Teller) surface areas and BJH (Barrett-Joyner-Halenda) pore size distributions using an Auto-sorb-iQA3200-4 analyzer (Quantatech Co., USA).
Element concentrations were detected by Thermo iCAP 7400 inductively coupled plasma optical emission spectrometry (ICP-OES). X-ray excited luminescence emission spectra were measured using equipment built in-house (Shanghai Institute of Ceramics, Chinese Academy of Sciences) with an F50-100 II tube (tungsten target, 75kV, 20mA) and Hamamatsu R92828 photomultiplier tube detector. Fluorescence images were obtained using a confocal laser-scanning microscope (UltraView Vox, PerkingElmer, U.S.A.). RT experiments were conducted using a clinical electron linear accelerator (ELEKTA Presice, England).
Detection of ·OH and 1O2 production
MB and DPBF were respectively used to investigate ·OH and 1O2 production. 1 mL aqueous solutions of MB (100 µL, 0.5 mM) or DPBF (100 µL, 0.5 mM) containing NSC@mSiO2-SNO/ICG NPs (50 µg mL-1) were subjected to different doses (0, 1, 2, 4 and 8 Gy) with 200 cGy min-1 dose rate. Then, the intensities of specific absorption at 664 nm for MB and 417 nm for DPBF were measured. The above tests were compared with DI water as control, ICG and NSC@mSiO2-SNO NPs. The corresponding production yield was calculated by the decreased intensity: ·OH/ 1O2 production yield (%) = (1 - NP-treated intensity / control intensity) × 100%.
In addition, 3-CCA was used as a specific probe to further evaluate ·OH production according to Guo's work [45]. Briefly, 20 mM 3-CCA was dissolved in 10 mL of 80 mM PBS solution under gentle heating and stirring. After cooling, 100 mM DMSO was added and then the sample was diluted 10 times by 80 mM PBS solution. The prepared 2 mM 3-CCA/DMSO sample was mixed with an equal volume of NSC@mSiO2-SNO/ICG NPs (50 µg mL-1) and then added to 24-well plates. After different doses (0, 1, 2, 4 and 8 Gy) of X-ray radiation with 200 cGy min-1 dose rate, the resulting solutions were filtered by centrifugation at 8330 g for 10 min, and the fluorescence intensities of the supernatants were measured using a fluorescence spectrophotometer (Hitachi F7000) at an excitation wavelength of 395 nm and emission wavelength of 442 nm. The above tests were compared with DI water as control, ICG and NSC@mSiO2-SNO NPs.
X-PDT efficiency calculation
According to a previous report [19], X-PDT efficiency (η) is calculated according to the following expression (Equation 1): η = Ec / Eem. Here, Ec is the chemical energy for ROS produced from water and can be calculated according to the following expression (Equation 2): Ec = P·OH/H2O × NA × Y (eV) = 2.6×10⁵ × Y (J). Here, Y is the number of moles of bleached MB and DPBF resulting from the PDT effect (Equation 3): Y = n0 (bm - bc) + n1 (qm - qc). Here, bm and qm are respectively the bleached percentage of MB and DPBF under radiation with NSC@mSiO2-SNO/ICG NPs, while bc and qc are respectively the bleached percentage of MB and DPBF under radiation without NSC@mSiO2-SNO/ICG NPs. Eem is the original X-ray radiation energy (D, Gy), and 1 Gy is equal to an absorbed dose of 1 J kg-1. Eem can be calculated according to the following expression (Equation 4): Eem = Vt × D = 1×10⁻⁴ × D (J). With the combination of Equations 2-4, Equation 1 becomes: η = 2.6×105 × [1.56×10-10 (bm - bc) + 1.85×10⁻¹⁰ (qm - qc)] / 1×10⁻⁴ × D = [4.056 (bm - bc) + 4.81 (qm - qc)] / 10 D. From this calculation, the average value of η in Table S2 can be recommended as the efficiency of NSC@mSiO2-SNO/ICG NPs-induced X-PDT under X-ray radiation. ROS production efficiencies of NSC@mSiO2-SNO NPs and free ICG were calculated for comparison.
Detection of NO production
Nitrate reductase was used to convert released NO to nitrate/nitrite, which was reacted with Griess agent to form violet azo compounds with characteristic absorbance at 550 nm. The intensity was detected as compared with DI water, NSC@mSiO2 NPs and NSC@mSiO2-SNO NPs. The corresponding production contents were quantitatively measured according to the manufacturer's protocol (NanJing JianCheng Bioengineering Institute) following the equation: NO concentration (µM) = (ODtest - ODcontrol) / (ODstandard - ODcontrol) × standard concentration × sample dilution multiple. In our work, the control was blank tubes; ODcontrol = 0.0164 (Figure S8, insert); ODstandard = 0.025 (Figure S8 insert); standard concentration = 100 µM; sample dilution multiple = 1.
NO concentration was used to calculate the conjugated percentage of SNO group on the surface of NPs. In order to completely release NO, we monitored the release of NO from NSC@mSiO2-SNO NPs after X-ray radiation at 12 Gy. We found that the maximum amount was reached after 24 h, and the NO concentration was calculated to be 32.80 µM. Because the molar amount of nitrogen atoms in NO is the same as that in the SNO group, the conjugating capacity of SNO group was measured according to the following equation: Conjugating capacity (w/w %) = NO molar quantity × SNO molecular weight / NPs weight × 100%.
Cell culture
Mouse breast cancer 4T1 cells (Beijing Cancer Hospital) were cultured in RPMI-1640 medium supplemented with 10% (v/v) fetal bovine serum (FBS) and 1% penicillin/streptomycin at 37 °C with 5% CO2 and 90% relative humidity. Human mammary epithelial MCF-10A cells, human breast cancer MCF-7 cells, human cervical cancer HeLa cells, and human glioma U251 cells were also cultured in standard cell media recommended by ATCC. Cell culture under normoxic (21% O2) conditions was achieved by an incubator (Thermo Scientific) with 21% O2, 5% CO2 and 74% N2. Hypoxic (2% O2) culture was realized in a self-constructed sealed aeration tank infused with gas mixture of 2% O2, 5% CO2 and 93% N2.
Primary culture of mouse mammary epithelial cells was performed according to the following methods. First, pregnant Kunming mice (10-12 weeks old) were euthanized and sterilized, and then mammary essential tissues were cut off. After PBS rinsing, mammary tissues were cut into a uniform mash using eye scissors and then transferred to aseptic centrifuge tubes. Mixed enzymes including 1.5 mg mL-1 collagenase (type I) and 0.25% trypsin were used to fully digest tissues at 37 °C for 4 h under shaking cultivation. After filtration by aseptic cell sieves, the cells were washed and collected by centrifugation (102 g, 2 min, three times) with PBS. The obtained cells were repeatedly blown into single cell suspensions and then cultured in DMEM/F12 medium supplemented with 10% (v/v) fetal bovine serum (FBS), 5 μg mL-1 insulin, 5 ng mL-1 epidermal growth factor, 1% penicillin/streptomycin and 1 μg mL-1 hydrocortisone at 37 °C with 5% CO2.
Cytotoxicity
3-(4,5-dimethylthiazol-2-yl)-2,5-diphenyltetrazolium bromide (MTT) assay was used to assess cytotoxicity. The cells were seeded in 96-well plates at 1×10⁴ per well and incubated under normoxic (21% O2) atmosphere for 24 h. Then, NSC NPs, NSC@mSiO2 NPs, NSC@mSiO2-SNO NPs and NSC@mSiO2-SNO/ICG NPs at different concentrations (10, 25, 50, 100 and 200 µg mL-1) were added by replacing fresh culture medium for 24 h normoxic (21% O2) and hypoxic (2% O2) co-incubation. Afterwards, 20 μL of 5 mg mL-1 MTT solution was added for another 4 h and cells without medium were mixed with 200 μL dimethylsulfoxide (DMSO, Tianjin Kemiou Chemical Reagent Co., Ltd.). The absorbance was monitored by a microplate reader (Thermo Scientific, USA) at a test wavelength of 560 nm. Cell viability (%) in contrast to untreated control groups represented cytotoxicity.
CLSM observation and intracellular ROS/NO measurement
104 4T1 cells were seeded into a CLSM-special dish and cultured at 37 °C under normoxic (21% O2) atmosphere for 24 h. DI water, NSC@mSiO2 NPs, NSC@mSiO2-SNO NPs and NSC@mSiO2-SNO/ICG NPs (100 µL, 50 µg mL-1) were then added for 24 h normoxic (21% O2) or hypoxic (2% O2) co-incubation. Afterwards, serum-free 1640 medium containing DCFH-DA (100 µL, 10 µM) and DAF-FM DA (100 µL, 5 μM) were added into the culture dish for 20 min, and 4 Gy X-ray radiation with 200 cGy min-1 dose rate was performed to produce ROS and NO, which could be respectively reacted with DCFH-DA and DAF-FM DA to form stable green (DCF) and blue (DAF-FM) fluorescence. Then, the cells were washed with serum-free medium three times to remove free DCFH-DA and DAF-FM DA. CLSM images of intracellular NPs, ROS and NO were respectively captured by excitation at 561 nm, 488 nm, and 405 nm. Finally, the cells were immediately collected and at least 104 events for each group was used to detect fluorescence density by flow cytometry (BD FACSCalibur). Intracellular ROS/NO could be estimated as follows: ROS/NO production (%) = Mean intensitytreated / Mean intensitycontrol × 100%.
In vitro tumor cell destruction and apoptosis assay
To evaluate in vitro tumor cell destruction, 4T1 cells were seeded in 96-well plates at 104 per well for 24 h normoxic (21% O2) incubation, and then treated with DI water, NSC@mSiO2 NPs, NSC@mSiO2-SNO NPs and NSC@mSiO2-SNO/ICG NPs at different concentrations (25, 50 and 100 µg mL-1) for another 24 h normoxic (21% O2) or hypoxic (2% O2) culture. After excess particles were removed by PBS washing, the cells were subjected to various doses of X-ray radiation (0, 1, 2, 4, 8 Gy) with 200 cGy min-1 dose rate. At 12 h post-radiation, cell viability was determined by MTT assay. In addition, cell death for MCF-7 cells, U251 cells and HeLa cells was also evaluated in accordance with the aforementioned process. For apoptosis detection, 4T1 cells were seeded into 6-well plates at 105 per well and cultured for 24 h under normoxic (21% O2) atmosphere. Then, the cells were incubated for 24 h under normoxic (21% O2) or hypoxic (2% O2) conditions with DI water, NSC@mSiO2 NPs, NSC@mSiO2-SNO NPs and NSC@mSiO2-SNO/ICG NPs (50 µg mL-1), followed by 4 Gy X-ray radiation with 200 cGy min-1 dose rate. Subsequent procedures were performed in accordance with the manufacturer's protocol. Briefly, the cells were washed, harvested, resuspended in 195 μL binging buffer and stained by adding 5 μL Annexin V-FITC and 10 μL PI for 20 min incubation at room temperature in the dark. The percentages of apoptotic and necrotic cells were determined by flow cytometry (BD FACSCalibur).
Colony formation assay
5000 4T1 cells were seeded in 25 cm2 flasks for 24 h normoxic (21% O2) incubation and then treated with DI water, NSC@mSiO2 NPs, NSC@mSiO2-SNO NPs and NSC@mSiO2-SNO/ICG NPs (50 µg mL-1) under normoxic (21% O2) or hypoxic (2% O2) conditions for another 24 h culture. Then, the cells were exposed to 4 Gy X-ray radiation with 200 cGy min-1 dose rate. After radiation, the cells in hypoxic groups were kept in hypoxic conditions for 24 h culture and then were transferred to 6 cm dishes at appropriate concentrations for 11-day normoxic incubation. The cells in normoxic groups were trypsinized immediately after radiation and then seeded in 6 cm dishes for 12-day normoxic incubation. To determine the clonogenic survival rate, the cells were stained with 0.4% crystal violet (Sigma-Aldrich). After the colony formations were fixed with paraformaldehyde, the colonies with more than 50 cells were counted. The surviving fraction (SF) was calculated by SF = colonies counted / cells seeded × PE / 100, where PE referred to the individual plating efficiency, according to previous reported work [11].
Comet assay
Single cell gel electrophoresis (comet assay) was used to evaluate DNA damage. Briefly, 4T1 cells were subjected to the same treatments as for apoptosis detection. Then, the cells were collected and diluted to single-cell suspensions with 2×10⁴ cells mL-1. 25 µL of the above cell suspension was mixed with 75 µL 0.75% low melting agarose (Promega) and layered on a slide precoated with 0.75% normal melting point agarose (Biowest). After 1 min solidification at 4 °C, the slides were immersed in fresh alkaline lysis solution containing 2.5 mM NaCl (TCRY, Tianjin), 100 mM Na2EDTA (TCRY, Tianjin), 10 mM Tris-HCl (Sigma), 10% DMSO, 1% Triton X-100 (Sigma) and 1% laurosylsarcosinate (TCRY, Tianjin) at 4 °C for 2 h in the dark, followed by electrophoresis at 20 V, 200 mA for 20 min. Finally, the slides were washed with Tris-HCl (0.4 M, pH 7.5) and stained with 2 μg mL-1 ethidium bromide (EB, Beijing SinaSun Biotechnology Co., Ltd.). After rinsing with DI water, comet images were acquired using a fluorescence microscope (Olympus, Japan) with an image acquisition system (United Technologies Building System). 200 comet cells were randomly selected for each group. Each comet was automatically analyzed by CASP software (Poland), and statistical analysis of the output results was carried out using SPSS 12.0 software. Tail DNA (%) and tail moment (a.u.) were also examined to identify DNA damage.
Animals and tumor models
Healthy female BALB/c mice (6-8 weeks old, body weight ~ 20 g) were purchased from Vital River Laboratory Animal Technology Co., Ltd. (Beijing). All animal experiments were performed in accordance with the statutory requirements of the People's Republic of China (GB14925-2010) and care regulations (SYXK2011-008) approved by the laboratory animal center, Institute of Radiation Medicine, Chinese Academy of Medical Sciences. 4T1 tumor xenograft-bearing models were established by subcutaneously injecting 107 cells per mouse into the right armpit of mice for in vivo imaging and the backside of mice for in vivo therapy. Tumor size was monitored by a vernier caliper, and tumor volume (V) was calculated as V = L × W2 / 2, where L and W are the length and width of the tumor, respectively. When the tumor volume reached ~50-60 mm3, the mice were randomly distributed into different groups for in vivo MR/CT imaging and therapy.
In vitro and in vivo MR and CT imaging
The longitudinal relaxation times (T1) of NSC@mSiO2-SNO/ICG NPs at various Gd concentrations (0-0.8 mM) were measured by a MR imaging system (HT/MRSI60-60KY, Huantong Science and Education Equipment Co. Ltd., Shanghai, China). Magnevist was used for comparison. Then, the relaxation rate r1 was calculated by fitting the 1/T1 (s-1) vs. Gd concentration (mM) curves. For in vivo MR imaging, 4T1 tumor xenograft-bearing BALB/c mice were intravenously injected with NSC@mSiO2-SNO/ICG NPs (100 μL, 25 mg kg-1 mice). T1-weighted MR images were acquired at different time points after intravenous injection and analyzed on a 3.0 T MR clinical scanner (GE Signa Excite, USA) equipped with a small animal imaging coil. The signal intensities were obtained from MR images via manually drawn tumor regions. The scanning parameters were set as follows: T1 propeller sequence, TR/TE = 360/13.8 ms, matrix acquisition = 256 × 160, slice thickness = 1 mm, slice spacing = 0.5 mm, FOV = 8 cm × 8 cm.
To assess CT contrast, NSC@mSiO2-SNO/ICG NPs at various lanthanide (Ln) concentrations (Ln = Gd + Eu, 0-80 mM) were scanned under a clinical CT imaging system (GE, HDCT750). Iohexol was used for comparison. In vivo CT imaging was performed at different time points after intravenous injection of NSC@mSiO2-SNO/ICG (100 μL, 25 mg kg-1 mice) to 4T1 tumor xenograft-bearing BALB/c mice. CT values were obtained from CT images via manually drawn regions of interest and tumor regions. The scanning parameters were set as follows: tube voltage = 80 kV, tube current = 210 mA, slice thickness = 0.625 mm, pitch = 1:1, field of view = 80 mm × 80 mm.
Pharmacokinetic studies and clearance
For blood circulation, 4T1 tumor xenograft-bearing mice were injected with NSC@mSiO2-SNO/ICG NPs (100 μL, 25 mg kg-1 mice) intravenously. Then, blood was collected from the eye socket of each mouse at the indicated time points (0.5, 1, 2, 4, 6, 8, 12, 24 and 48 h), weighed, and dissolved in digestive chloroazotic acid (HNO3/HCl = 3/1) to determine the total amount of Ln (Gd + Eu) in the blood by ICP-OES. To evaluate the in vivo biodistribution, mice were executed after intravenous administration of NSC@mSiO2-SNO/ICG NPs at the indicated time point (4, 12, 24, 48 h and 7 days). The corresponding dissected organs (heart, liver, spleen, lung, kidney and tumor) from mice (n = 3) were weighed and cut into pieces followed by digestion in aqua regia solution (HCl/HNO3 = 3/1) overnight. Then, each sample was diluted with DI water, and Ln (Gd and Eu) concentrations in these organs were measured by ICP-OES as follows: Element (%ID/g) = retained concentration / injected concentration / tumor weight × 100%. To study in vivo excretion, after intravenous administration of NSC@mSiO2-SNO/ICG NPs, mice were placed in metabolic cages to obtain their urine, and then Ln (Gd and Eu) concentrations in urine were measured by ICP-OES.
In vivo antitumor assessment
4T1 tumor xenograft-bearing BALB/c mice were randomly distributed into eight groups: control (saline), NSC@mSiO2 NPs (I), NSC@mSiO2-SNO NPs (II), NSC@mSiO2-SNO/ICG NPs (III), RT alone, (I) + RT, (II) + RT, (III) + RT, and then intravenously injected with saline (100 μL), (I) (100 μL, 25 mg kg-1 mice), (II) (100 μL, 25 mg kg-1 mice), and (III) (100 μL, 25 mg kg-1 mice). Each group included five mice.
For only NP-related groups (I, II, III), the tumors were collected for frozen tumor slices at 24 h post-injection, and then stained with DAPI to label nuclei for ex vivo immunofluorescence staining of tumor slices. For all RT-related groups, at 24 h post-injection, the tumors received 4 Gy radiation with a dose rate of 200 cGy min-1 using a clinical linear accelerator (6 MeV) with a 1.0 cm × 1.0 cm radiation field and a source-to-skin distance of 100 cm. Subsequently, tumor size and body weight of each mouse were recorded every other day for half a month. At day 14, the mice were sacrificed and the tumors were collected. Then, the tumors were photographed using a digital camera (Canon). After that, the tumors were washed with saline three times and fixed in 10% neutral-buffered formalin. For the hematoxylin and eosin (H&E) and TUNEL assays, paraffin tumor sections were stained and observed using an optical microscope (DM5500B, Leica). In addition, long-term tumor inhibition studies for 28 days were also performed, with the same conditions as the half-month tumor inhibition. Survival rates were measured as the percentage of surviving mice compared to original total mice for each group.
In vivo toxicity test
Healthy female BALB/c mice were intravenously injected with NSC@mSiO2 NPs (I), NSC@mSiO2-SNO NPs (II) and NSC@mSiO2-SNO/ICG NPs (III) respectively at the same dosage (100 μL, 25 mg kg-1 mice). Saline was used as the blank control. At 14 days post-injection, the mice were anaesthetized, and blood samples were collected for standard blood routine biochemistry tests to analyze complete blood panel parameters including red blood cells (RBC), white blood cells (WBC), mean corpuscular hemoglobin (MCH), mean corpuscular hemoglobin concentration (MCHC), mean corpuscular volume (MCV), hemoglobin (HGB), hematocrit (HCT), and platelet (PLT). Subsequently, major organs (heart, liver, spleen, lung and kidney) were harvested for pathological studies. As compared with control, H&E-stained tissue sections of (I), (II) and (III) groups were observed under an optical microscope (DM5500B, Leica) to monitor possible histological changes.
Tumor hypoxia evaluation
Tumor hypoxia was evaluated using Hypoxyprobe™-1 Kit (Hypoxyprobe, USA) for ex vivo immunofluorescence staining according to the procedure provided by the manufacturer. Briefly, after 14 days of different treatments, 4T1 tumor-bearing mice were intravenously injected with pimonidazole hydrochloride (Hypoxyprobe, USA) at 60 mg kg-1. At 1.5 h post-injection, the mice were sacrificed and the tumors were collected for frozen tumor slices. The sections were first incubated with mouse monoclonal anti-pimonidazole antibody as primary antibody to label tumor hypoxic regions. Then, the sections were incubated with Alexa Fluo 488-conjugated goat anti-mouse antibody as secondary antibody. Hypoxic signals were finally observed using a fluorescence microscope (BX51T-PHD-J11, Olympus). ImageJ software was used to statistically analyze positive hypoxic regions and signal intensities of each slice.
Immunohistochemical tests
Rabbit monoclonal anti-p53, anti-HIF-1α antibodies, rabbit polyclonal anti-CD34, anti-Ki-67, and anti-MMP-2 antibodies (abcam) were used for the staining of p53, HIF1α, CD34, Ki-67 and MMP-2, respectively. Subsequent procedures were performed in accordance with the manufacturer's instructions. Briefly, tumor slices from different groups were respectively incubated with the above antibodies (primary antibody) after being blocked with normal goat serum. Then, biotin-conjugated goat anti-rabbit IgG (secondary antibody, abcam) was added at 37 °C, and subsequently 3,3'-diaminobenzidine (DAB) staining was performed to form brown insoluble product under the presence of hydrogen peroxide. After hematoxylin counterstaining of cell nuclei, the images were obtained on a fluorescence microscope (BX51T-PHD-J11, Olympus). Image-Pro Plus (Media Cybernetics, U.S.A.) was used to determine average positive rates of each antibody.
Statistical analysis
Data are expressed as mean ± standard deviation (SD) of experiments repeated at least three times. Data analysis was performed using OriginPro 9.0 and Microsoft Excel. Significance between groups was analyzed using Student's two-tailed t-test (* p < 0.05, ** p < 0.001, and *** p < 0.0001). p < 0.05 was considered significant.
Abbreviations
BET: Brunauer-Emmett-Teller; BJH: Barrett-Joyner-Halenda; CLSM: confocal laser scanning microscopy; CT: computed tomography; DAF-FM DA: 3-amino-4-aminomethyl-2',7'-difluorescein diacetate; DAPI: 4ʹ,6-diamidino-2-phenylindole; DCFH-DA: 2',7'-dichlorofluorescein diacetate; DPBF: 1,3-diphenylisobenzofuran; 3-CCA: 3-coumarin-carboxylic acid; FBS: fetal bovine serum; FTIR: fourier transform infrared; H&E: the hematoxylin and eosin; HIF1α: hypoxia-inducible factor 1α; ICG: indocyanine green; MB: methylene blue; MR: magnetic resonance; MTT: 3-(4,5-dimethylthiazol-2-yl)-2,5-diphenyltetrazolium bromide; NO: nitric oxide; SNO: S-nitrosothiol group; TEM: transmission electron microscope; TME: tumor microenvironment; TUNEL: the terminal deoxynucleotidyl transferase dUTP nick end labeling; UV-vis-NIR: ultraviolet-visible-near infrared; X-PDT: X-ray-induced photodynamic therapy; XRD: X-ray diffraction.
Supplementary Material
Supplementary figures and tables.
Acknowledgements
This work was supported by the National Natural Science Foundation of China (81801828, 81425013) and the Postdoctoral Science Foundation of China (2017M621090). Animal experiments were performed in accordance with the guidelines of the Institutional Ethics Committee for Animal Experiments, approved by the Laboratory Animal Center, Institute of Radiation Medicine of Chinese Academy of Medical Sciences.
Competing Interests
The authors have declared that no competing interest exists.
References
1. Rancoule C, Magné N, Vallard A, Guy JB, Rodriguez-Lafrasse C, Deutsch E. et al. Nanoparticles in radiation oncology: From bench-side to bedside. Cancer Lett. 2016;375:256-62
2. Good JS, Harrington KJ. The hallmarks of cancer and the radiation oncologist: updating the 5Rs of radiobiology. Clin Oncol. 2013;25:569-77
3. Barker HE, Paget JT, Khan AA, Harrington KJ. The tumour microenvironment after radiotherapy: mechanisms of resistance and recurrence. Nat Rev Cancer. 2015;15:409-25
4. Barcellos-Hoff MH, Park C, Wright EG. Radiation and the microenvironment-tumorigenesis and therapy. Nat Rev Cancer. 2005;5:867-75
5. Brown JM, Wilson WR. Exploiting tumour hypoxia in cancer treatment. Nat Rev Cancer. 2004;4:437-47
6. Overgaard J. Hypoxic modification of radiotherapy in squamous cell carcinoma of the head and neck-a systematic review and meta-analysis. Radiother Oncol. 2011;100:22-32
7. Harada H. How can we overcome tumor hypoxia in radiation therapy? J Radiat Res. 2011;52:545-56
8. Hill RP, Bristow RG, Fyles A, Koritzinsky M, Milosevic M, Wouters BG. Hypoxia and predicting radiation response. Semin Radiat Oncol. 2015;25:260-72
9. Semenza GL. Intratumoral hypoxia, radiation resistance, and HIF-1. Cancer Cell. 2004;5:405-6
10. Retif P, Pinel S, Toussaint M, Frochot C, Chouikrat R, Bastogne T. et al. Nanoparticles for radiation therapy enhancement: the key parameters. Theranostics. 2015;5:1030-44
11. Liu Y, Liu Y, Bu W, Xiao Q, Sun Y, Zhao K. et al. Radiation-/hypoxia-induced solid tumor metastasis and regrowth inhibited by hypoxia-specific upconversion nanoradiosensitizer. Biomaterials. 2015;49:1-8
12. Dou Y, Guo Y, Li X, Li X, Wang S, Wang L. et al. Size-tuning ionization to optimize gold nanoparticles for simultaneous enhanced ct imaging and radiotherapy. ACS Nano. 2016;10:2536-48
13. Wu H, Lin J, Liu P, Huang Z, Zhao P, Jin H. et al. Reactive oxygen species acts as executor in radiation enhancement and autophagy inducing by AgNPs. Biomaterials. 2016;101:1-9
14. Chen W, Zhang J. Using nanoparticles to enable simultaneous radiation and photodynamic therapies for cancer treatment. J Nanosci Nanotechno. 2006;6:1159-66
15. Liu J, Yang Y, Zhu W, Yi X, Dong Z, Xu X. et al. Nanoscale metal-organic frameworks for combined photodynamic & radiation therapy in cancer treatment. Biomaterials. 2016;97:1-9
16. Chen H, Wang GD, Chuang YJ, Zhen ZP, Chen X, Biddinger P. et al. Nanoscintillator-mediated X-ray inducible photodynamic therapy for in vivo cancer treatment. Nano Letters. 2015;15:2249-56
17. Kaščáková S, Giuliani A, Lacerda S, Pallier A, Mercère P, Tóth É. et al. X-ray-induced radiophotodynamic therapy (RPDT) using lanthanide micelles: Beyond depth limitations. Nano Res. 2015;8:2373-9
18. Tang Y, Hu J, Elmenoufy AH, Yang X. Highly efficient fret system capable of deep photodynamic therapy established on x-ray excited mesoporous LaF3:Tb scintillating nanoparticles. ACS Appl Mater Inter. 2016;7:12261-9
19. Zhang C, Zhao K, Bu W, Ni D, Liu Y, Feng J. et al. Marriage of scintillator and semiconductor for synchronous radiotherapy and deep photodynamic therapy with diminished oxygen dependence. Angew Chem Int Ed. 2015;54:1770-4
20. Wang GD, Nguyen HT, Chen H, Cox PB, Wang L, Nagata K. et al. X-Ray induced photodynamic therapy: a combination of radiotherapy and photodynamic therapy. Theranostics. 2016;6:2295-305
21. Sabharwal SS, Schumacker PT. Mitochondrial ROS in cancer: initiators, amplifiers or an Achilles' heel? Nat Rev Cancer. 2014;14:709-21
22. Tominaga H, Kodama S, Matsuda N, Suzuki K, Watanabe M. Involvement of reactive oxygen species (ROS) in the induction of genetic instability by radiation. J Radiat Res. 2002;45:181-8
23. Zawacka-Pankau J, Krachulec J, Grulkowski I, Bielawski KP, Selivanova G. The p53-mediated cytotoxicity of photodynamic therapy of cancer: Recent advances. Toxicol Appl Pharmacol. 2008;232:487-97
24. Foster TH, Murant RS, Bryant RG, Knox RS, Gibson SL, Hilf R. Oxygen consumption and diffusion effects in photodynamic therapy. Radiat Res. 1991;126:296-303
25. Fisher AM, Murphree AL, Gomer CJ. Clinical and preclinical photodynamic therapy. Lasers Surg Med. 1995;17:2-31
26. Matsumoto H, Hayashi S, Hatashita M, Ohnishi K, Shioura H, Ohtsubo T. et al. Induction of radioresistance by a nitric oxide-mediated bystander effect. Radiat Res. 2001;155:387-96
27. Rapozzi V, Della Pietra E, Zorzet S, Zacchigna M, Bonavida B, Xodo LE. Nitric oxide-mediated activity in anti-cancer photodynamic therapy. Nitric Oxide. 2013;30:26-35
28. Burke AJ, Sullivan FJ, Giles FJ, Glynn SA. The yin and yang of nitric oxide in cancer progression. Carcinogenesis. 2013;34:503-12
29. De Ridder M, Verellen D, Verovski V, Storme G. Hypoxic tumor cell radiosensitization through nitric oxide. Nitric Oxide. 2008;19:164-9
30. Cheng H, Wang L, Mollica M, Re AT, Wu S, Zuo L. Nitric oxide in cancer metastasis. Cancer Lett. 2014;353:1-7
31. Rapozzi V, Della Pietra E, Bonavida B. Dual roles of nitric oxide in the regulation of tumor cell response and resistance to photodynamic therapy. Redox Bio. 2015;6:311-7
32. Jeffrey Man HS, Tsui AKY, Marsden PA. Nitric oxide and hypoxia signaling. Vitam Horm. 2014;96:161-92
33. Cohen RA, Weisbrod RM, Gericke M, Yaghoubi M, Bierl C, Bolotina VM. Mechanism of nitric oxide-induced vasodilatation. Circ Res. 1999;84:210-9
34. Ray CJ, Abbas MR, Coney AM, Marshall JM. Interactions of adenosine, prostaglandins and nitric oxide in hypoxia-induced vasodilatation: in vivo and in vitro studies. J Physiol. 2010;544:195-209
35. Nagane M, Yasui H, Yamamori T, Zhao S, Kuge Y, Tamaki N. et al. Radiation-induced nitric oxide mitigates tumor hypoxia and radioresistance in a murine SCCVII tumor model. Biochem Bioph Res Co. 2013;437:420-5
36. Yasuda H. Solid tumor physiology and hypoxia-induced chemo/radio-resistance: novel strategy for cancer therapy: nitric oxide donor as a therapeutic enhancer. Nitric Oxide. 2008;19:205-16
37. Reeves KJ, Reed MW, Brown NJ. Is nitric oxide important in photodynamic therapy? J Photoch Photo Bio B. 2009;95:141-7
38. Coulter JA, Mccarthy HO, Xiang J, Roedl W, Wagner E, Robson T. et al. Nitric oxide-a novel therapeutic for cancer. Nitric Oxide Biol Chem. 2008;19:192-8
39. Yu M, Zheng J. Clearance pathways and tumor targeting of imaging nanoparticles. ACS Nano. 2015;9:6655-74
40. Yamamoto E, Kuroda K. Colloidal mesoporous silica nanoparticles. Bull Chem Soc Jpn. 2016;89:501-39
41. Graf C, Gao Q, Schütz I, Noufele CN, Ruan W, Posselt U. et al. Surface functionalization of silica nanoparticles supports colloidal stability in physiological media and facilitates internalization in cells. Langmuir. 2012;28:7598-613
42. Lecoq P, Korzhik M. Scintillator developments for high energy physics and medical imaging. IEEE T Nucl Sci. 2000;47:1311-14
43. Kamkaew A, Chen F, Zhan Y, Majewski RL, Cai W. Scintillating nanoparticles as energy mediators for enhanced photodynamic therapy. ACS Nano. 2016;10:3918-35
44. Zhou T, Jiang X, Zhong C, Tang X, Ren S, Zhao Y. et al. Hydrothermal synthesis of controllable size, morphology and optical properties of β-NaGdF4: Eu3+ microcrystals. J Lumin. 2016;175:1-8
45. Hu J, Tang Y, Elmenoufy AH, Xu H, Cheng Z, Yang X. Nanocomposite-based photodynamic therapy strategies for deep tumor treatment. Small. 2015;11:5860-87
46. Cheng NN, Starkewolf Z, Davidson RA, Sharmah A, Lee C. et al. Chemical enhancement by nanomaterials under X-ray irradiation. J Am ChemSoc. 2012;134:1950-3
47. Favaudon V, Tourbez H, Houeelevin C, Lhoste JM. Carboxyl radical induced cleavage of disulfide bonds in proteins. A gamma-ray and pulse radiolysis mechanistic investigation. Biochemistry. 1990;29:10978-89
48. Cao W, Gu Y, Meineck M, Xu H. The combination of chemotherapy and radiotherapy towards more efficient drug delivery. Chem Asian J. 2014;9:48-57
49. Fan W, Bu W, Zhang Z, Shen B, Zhang H, He Q. et al. X-ray radiation-controlled NO-release for on-demand depth-independent hypoxic radiosensitization. Angew Chem Int Ed. 2016;54:14026-30
50. Tsoi KM, Macparland SA, Ma XZ, Spetzler VN, Echeverri J, Ouyang1 B. et al. Mechanism of hard-nanomaterial clearance by the liver. Nat Mater. 2016;15:1212-21
51. Croissant JG, Fatieiev Y, Khashab NM. Degradability and clearance of silicon, organosilica, silsesquioxane, silica mixed oxide, and mesoporous silica nanoparticles. Adv Mater. 2017;29:1604634
52. He Q, Zhang Z, Gao F, Li Y, Shi J. In vivo biodistribution and urinary excretion of mesoporous silica nanoparticles: effects of particle size and PEGylation. Small. 2011;7:271-80
53. Yu M, Zheng J. Clearance pathways and tumor targeting of imaging nanoparticles. ACS Nano. 2015;9:6655-74
54. Ravi R, Mookerjee B, Bhujwalla ZM, Sutter CH, Artemov D, Zeng Q. et al. Regulation of tumor angiogenesis by p53-induced degradation of hypoxia-inducible factor-1α. Genes Dev. 2000;14:34-44
55. Harris A. Hypoxia-A key regulator factor in tumor growth. Nat Rev Cancer. 2002;2:38-47
56. Sudheendra L, Das GK, Li C, Stark D, Cena J, Cherry S. et al. NaGdF4:Eu3+ nanoparticles for enhanced X-ray excited optical imaging. Chem Mater. 2014;26:1881-8
Author contact
![]() Corresponding author: chunshuiyuedu.cn (C. S. Yu)
Corresponding author: chunshuiyuedu.cn (C. S. Yu)
Citation styles
APA
Dou, Y., Liu, Y., Zhao, F., Guo, Y., Li, X., Wu, M., Chang, J., Yu, C. (2018). Radiation-responsive scintillating nanotheranostics for reduced hypoxic radioresistance under ROS/NO-mediated tumor microenvironment regulation. Theranostics, 8(21), 5870-5889. https://doi.org/10.7150/thno.27351.
ACS
Dou, Y.; Liu, Y.; Zhao, F.; Guo, Y.; Li, X.; Wu, M.; Chang, J.; Yu, C. Radiation-responsive scintillating nanotheranostics for reduced hypoxic radioresistance under ROS/NO-mediated tumor microenvironment regulation. Theranostics 2018, 8 (21), 5870-5889. DOI: 10.7150/thno.27351.
NLM
Dou Y, Liu Y, Zhao F, Guo Y, Li X, Wu M, Chang J, Yu C. Radiation-responsive scintillating nanotheranostics for reduced hypoxic radioresistance under ROS/NO-mediated tumor microenvironment regulation. Theranostics 2018; 8(21):5870-5889. doi:10.7150/thno.27351. https://www.thno.org/v08p5870.htm
CSE
Dou Y, Liu Y, Zhao F, Guo Y, Li X, Wu M, Chang J, Yu C. 2018. Radiation-responsive scintillating nanotheranostics for reduced hypoxic radioresistance under ROS/NO-mediated tumor microenvironment regulation. Theranostics. 8(21):5870-5889.
This is an open access article distributed under the terms of the Creative Commons Attribution (CC BY-NC) license (https://creativecommons.org/licenses/by-nc/4.0/). See http://ivyspring.com/terms for full terms and conditions.