Impact Factor
- Issue 14; 2026
- Issue 13; 2026
- Issue 12; 2026
- Issue 11; 2026
- Issue 10; 2026
- Volume 16; 2026
- Advance Articles
- Past Issues
- Cover Images
- Cover Suggestion
- Index & Coverage
- Special Issues
Introduction
Results
Discussion
Methods
Abbreviations
Supplementary Material
Acknowledgements
References
International Journal of Biological Sciences
International Journal of Medical Sciences
 Global reach, higher impact

Theranostics 2018; 8(17):4805-4823. doi:10.7150/thno.25025 This issue Cite
Research Paper
WNT6 is a novel oncogenic prognostic biomarker in human glioblastoma
Céline S. Gonçalves1,2, Joana Vieira de Castro1,2, Marta Pojo1,2, Eduarda P. Martins1,2, Sandro Queirós1,2, Emmanuel Chautard3,4, Ricardo Taipa5, Manuel Melo Pires5, Afonso A. Pinto6, Fernando Pardal7, Carlos Custódia8, Cláudia C. Faria8,9, Carlos Clara10, Rui M. Reis1,2,10, Nuno Sousa1,2, Bruno M. Costa1,2 ![]()
1. Life and Health Sciences Research Institute (ICVS), School of Medicine, University of Minho, Campus Gualtar, 4710-057 Braga, Portugal
2. ICVS/3B's - PT Government Associate Laboratory, Braga/Guimarães, Portugal
3. Université Clermont Auvergne, INSERM, U1240 IMoST, 63000 Clermont Ferrand, France
4. Pathology Department, Université Clermont Auvergne, Centre Jean Perrin, 63011 Clermont-Ferrand, France
5. Neuropathology Unit, Department of Neurosciences, Centro Hospitalar do Porto, Porto, Portugal
6. Department of Neurosurgery, Hospital Escala Braga, Sete Fontes - São Victor 4710-243 Braga, Portugal
7. Department of Pathology, Hospital Escala Braga, Sete Fontes - São Victor 4710-243 Braga, Portugal
8. Instituto de Medicina Molecular, Faculdade de Medicina, Universidade de Lisboa, Lisbon, Portugal
9. Neurosurgery Department, Hospital de Santa Maria, Centro Hospitalar Lisboa Norte (CHLN), Lisbon, Portugal
10. Molecular Oncology Research Center, Barretos Cancer Hospital, Barretos - S. Paulo, Brazil.
Received 2018-1-18; Accepted 2018-5-6; Published 2018-9-9
Abstract

Glioblastoma (GBM) is a universally fatal brain cancer, for which novel therapies targeting specific underlying oncogenic events are urgently needed. While the WNT pathway has been shown to be frequently activated in GBM, constituting a potential therapeutic target, the relevance of WNT6, an activator of this pathway, remains unknown.
Methods: WNT6 protein and mRNA levels were evaluated in GBM. WNT6 levels were silenced or overexpressed in GBM cells to assess functional effects in vitro and in vivo. Phospho-kinase arrays and TCF/LEF reporter assays were used to identify WNT6-signaling pathways, and significant associations with stem cell features and cancer-related pathways were validated in patients. Survival analyses were performed with Cox regression and Log-rank tests. Meta-analyses were used to calculate the estimated pooled effect.
Results: We show that WNT6 is significantly overexpressed in GBMs, as compared to lower-grade gliomas and normal brain, at mRNA and protein levels. Functionally, WNT6 increases typical oncogenic activities in GBM cells, including viability, proliferation, glioma stem cell capacity, invasion, migration, and resistance to temozolomide chemotherapy. Concordantly, in in vivo orthotopic GBM mice models, using both overexpressing and silencing models, WNT6 expression was associated with shorter overall survival, and increased features of tumor aggressiveness. Mechanistically, WNT6 contributes to activate typical oncogenic pathways, including Src and STAT, which intertwined with the WNT pathway may be critical effectors of WNT6-associated aggressiveness in GBM. Clinically, we establish WNT6 as an independent prognostic biomarker of shorter survival in GBM patients from several independent cohorts.
Conclusion: Our findings establish WNT6 as a novel oncogene in GBM, opening opportunities to develop more rational therapies to treat this highly aggressive tumor.
Keywords: biomarker, glioblastoma, oncogene, prognosis, WNT6, WNT pathway
Introduction
Glioblastoma (GBM) is the most lethal tumor of the central nervous system in adults. Despite recent advances in the understanding of the oncogenic molecular mechanisms, and improvements in neuroimaging technologies, surgery and adjuvant treatments, patients with GBM still exhibit a rapid unfavorable clinical evolution. The median survival of patients is 15 months after diagnosis, a scenario that has not changed significantly in the last decades [1-4]. In combination with their resistance to most conventional therapies, including radiotherapy and temozolomide (TMZ), GBMs are highly infiltrative and diffuse, impeding complete surgical resections. In this context, understanding the key underlying molecular mechanisms contributing to the aggressiveness of this tumor may be a critical step in the design of new and more effective precision therapies.
The WNT signaling pathway displays pleiotropic physiological functions, ranging from neurogenesis to stem cell proliferation, and has been implicated in various human cancers, including glioma [5-8]. This pathway is particularly relevant in the context of cancer stem cells (CSC), which have been pointed as critical mediators of cancer recurrence and resistance to radio- and chemo-therapy [7, 9-11]. Therefore, novel therapeutic strategies targeting particular components of the WNT pathway have been widely explored [9, 10, 12]. The WNT6 ligand is an activator of the WNT pathway, which only recently was associated with chemoresistance in gastric and bladder cancers [13, 14], poor prognosis of esophageal squamous cell carcinoma patients [15], and increased risk to develop colorectal adenoma [16]. Importantly, no studies to date have explored the relevance of WNT6 in human glioma.
In this work, we show WNT6 is overexpressed in GBM, the most common and malignant glioma, and displays typical hallmark oncogenic functions in both in vitro and in vivo GBM models by affecting the activity of classic oncogenic signaling pathways, including WNT, SFK and STAT pathways. Critically, we provide data from several independent GBM patient cohorts establishing WNT6 as a prognostic biomarker associated with shorter overall survival.
Results
WNT6 is overexpressed in primary GBM tissues
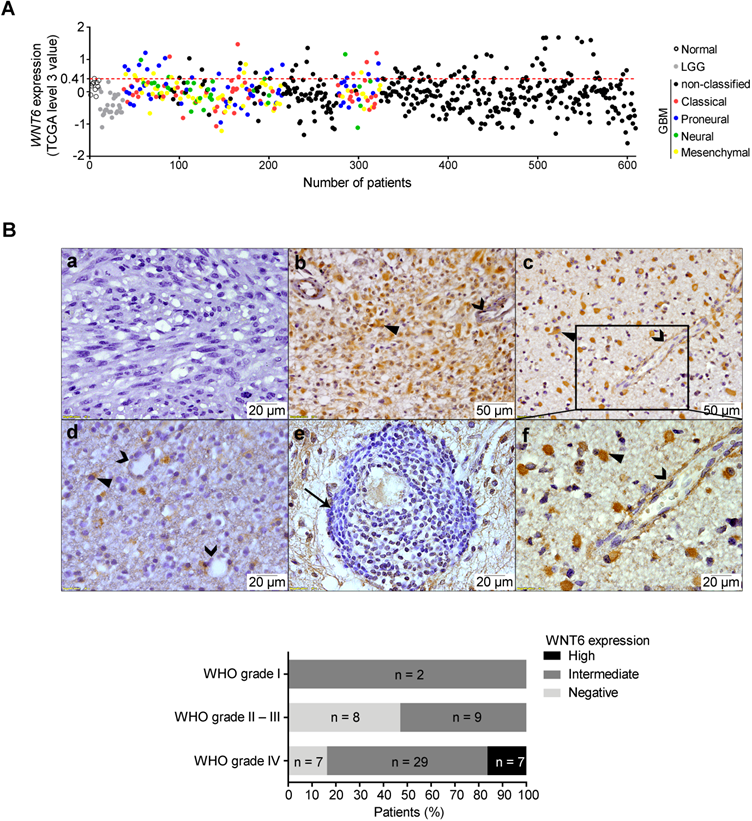
While high WNT6 expression levels were previously observed in different human cancer cell lines [13, 17, 18], little is known about its specific roles in tumors, particularly in GBM. In order to address this, we first analyzed gene expression array data from normal brains, lower-grade gliomas (LGG, WHO grades II and III) and GBM (WHO grade IV) patients deposited in TCGA [19]. When compared to normal samples, WNT6 was not overexpressed in any of the LGG patients (0/27), while 15.6% of GBM patients (89/572) presented high WNT6 levels (Figure 1A; p = 0.026). Concordantly, testing the protein levels of WNT6 by immunohistochemistry (IHC) in another dataset of glioma tissues (from Hospital Santo António; HSA) showed that only GBMs present high expression of WNT6 protein (16.3%; Figure 1B bottom; p = 0.037). WNT6 immunoreactivity expression in glioma showed to be mainly cytoplasmic (closed arrowheads), with a diffuse pattern where almost all tumor cells are positive (Figure 1B, b and c), or a more scattered pattern (Figure 1B, d). Tumor-infiltrating lymphocytes were negative for WNT6 expression (arrow; Figure 1B, e), with endothelial cells being negative or showing some faint immunoreactivity (open arrowheads; Figure 1B, b, c, d, and f). Representative images of positive and negative controls, and hematoxylin and eosin stainings are displayed in Figure S1. Together, these results show WNT6 mRNA and protein levels associate with high glioma grade, suggesting it may be important in the pathophysiology of glioma.
WNT6 is overexpressed at the mRNA and protein levels in GBM. (A) Expression levels of WNT6 in 27 lower-grade gliomas (LGG; grey dots), 572 glioblastomas (GBM, WHO grade IV; black and colored dots) and 10 unmatched normal brains (black unfilled dots) from TCGA. GBM molecular subtypes are represented as colors (red = classical; blue = proneural; green = neural; yellow = mesenchymal). WNT6 is overexpressed (TCGA data level 3 values ≥ 0.41; above red dashed line) in 16% (n = 89) of GBM samples. (B) WNT6 protein expression in WHO grades I-IV glioma samples from Hospital Santo António cohort assessed by IHC (n = 63; p = 0.037; chi-squared test). Representative images are shown for a WNT6-negative GBM (a), high WNT6 expression in GBM (b) and WHO grade III anaplastic oligoastrocytoma (c), and a WHO grade II diffuse oligodendroglioma with intermediate levels of WNT6 expression (d). WNT6 staining was mostly cytoplasmic in glioma cells (closed arrowheads) and not present in lymphocytes (e; arrow), being almost exclusively negative for endothelial cells (b-d and f; open arrowheads). Bottom graph summarizes IHC data for the whole dataset. LGG: lower-grade glioma; TCGA: The Cancer Genome Atlas; WHO: World Health Organization.
High WNT6 expression is indiscriminately present in all molecular subtypes of GBM
Several efforts have been made to stratify GBM into molecular subgroups [20-27]. We evaluated the levels of WNT6 expression among the GBM subtypes described by Verhaak et al (classical, mesenchymal, neural and proneural) [28] in a total of 4 independent cohorts, totaling 201 patients from TCGA, 59 from Freije, 159 from Gravendeel and 26 from Vital datasets. High levels of WNT6 were detected with no significant differences in subsets of patients of each GBM molecular subtype in all datasets (Figure 1A and Figure S2), suggesting WNT6 activation in GBM is independent of these molecular signatures.
WNT6 has oncogenic functions and promotes GBM aggressiveness in vitro
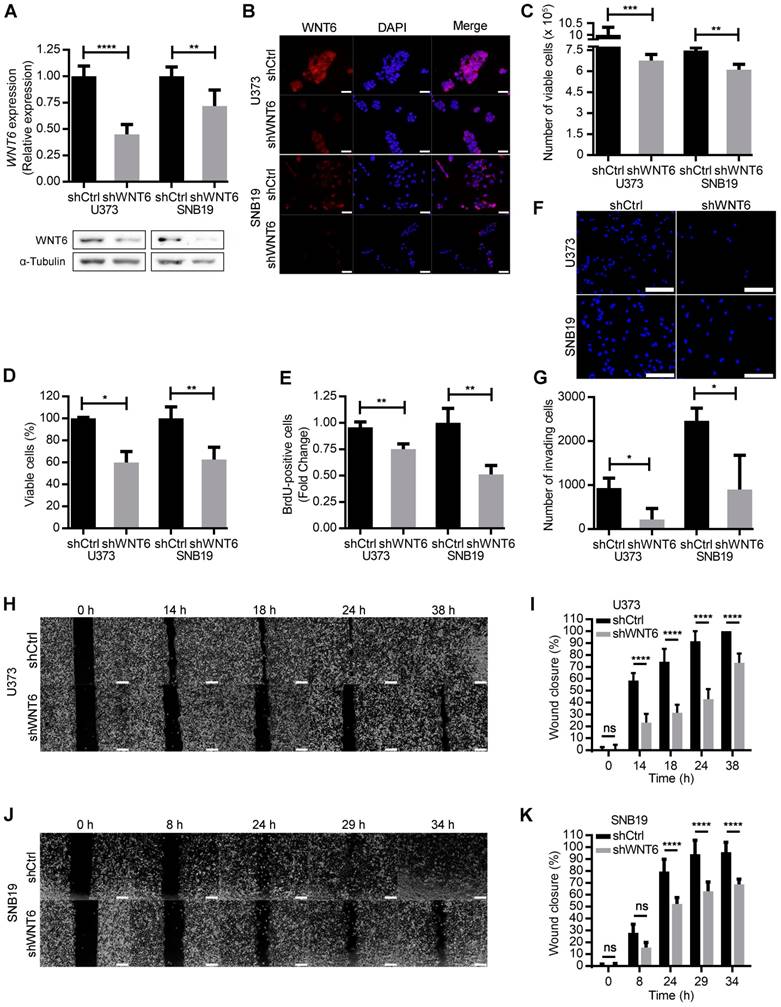
To address whether WNT6 expression influences typical cancer hallmark features of GBM cells, WNT6 expression was silenced in U373MG and SNB19 cell lines by shRNA, resulting in significantly decreased mRNA and protein levels (Figure 2A-B), as well as overexpressed in U87MG cells, which do not express WNT6 endogenously (Figure S3A). WNT6-low cells presented a significantly lower viability when compared with the corresponding WNT6-high counterparts (Figure 2C-D and Figure S3B-C). Concomitantly, WNT6 silencing significantly decreased proliferation of GBM cells (Figure 2E). Considering GBM cells display remarkable migration and invasion potentials, we tested how WNT6 affects these hallmark features of GBM. Wound healing migration assays and matrigel invasion assays showed that WNT6 significantly increases the capacity of GBM cells to migrate and invade (Figure 2F-K and Figure S3D-E). Together, these data suggest WNT6 is an important factor regulating several cancer hallmarks, which might influence GBM aggressiveness.
WNT6 promotes GBM aggressiveness in vitro. (A-B) The efficiency of WNT6 silencing in U373 and SNB19 glioblastoma cells was analyzed by qRT-PCR and WB (A), and immunofluorescence (B). (A) Top: WNT6 expression levels were normalized to TBP. Bottom: WB images are representative of 3 independent assays; α-tubulin was used as reference protein. (B) DAPI was used to stain the nucleus (40x magnification; scale bar = 50 µm). (C-D) Cell viability was measured by trypan blue (C) and MTT (D) assays in shCtrl and shWNT6 cells. (E) Cell proliferation was evaluated by BrdU incorporation. (F-G) Matrigel invasion assays were used to assess the cells' invasion capacity. Representative images (F) with cell nuclei stained with DAPI (scale bar = 250 µm) and quantification (G) of invasive U373 and SNB19 shCtrl and shWNT6 cells. (H-K) Migration (wound healing) assays were performed in U373 (H-I) and SNB19 (J-K) shCtrl and shWNT6 cells to assess the cells' migration capacity. Representative micrographs throughout time for U373 (H) and SNB19 (J) cells (40x magnification; scale bar = 250 µm). The wound gap was measured and expressed as a percentage of wound closure for U373 (I) and SNB19 (K) cells (**** p <0.001; two-way ANOVA post-hoc Sidak's test). Results represent data from at least 3 independent experiments (mean ± SD). *, p < 0.05; **, p < 0.01; ***, p < 0.005 and ****, p < 0.001 (unless otherwise stated, a two-sided unpaired t-test with Welch's correction was applied when homoscedasticity was not verified).
WNT6 increases resistance to temozolomide chemotherapy in GBM cells
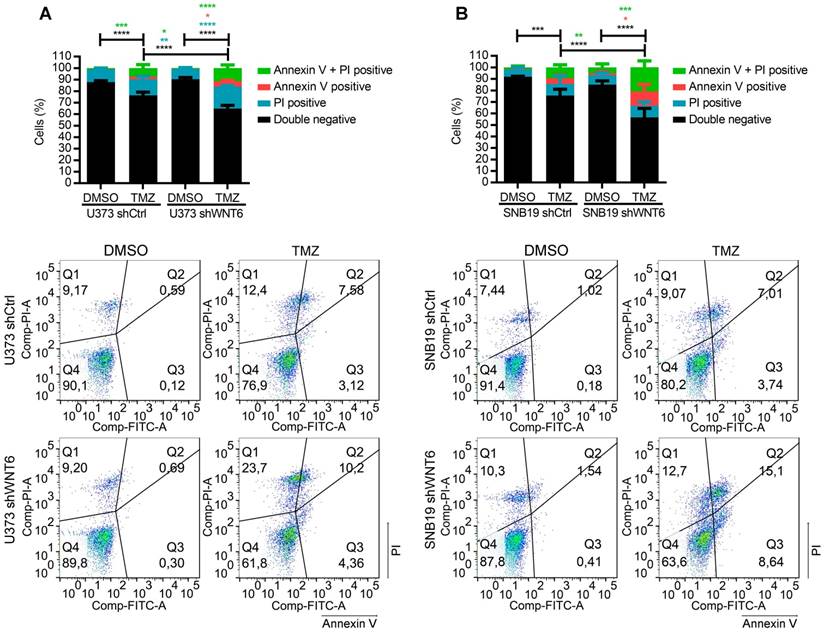
Previous reports have described the relevance of the WNT pathway in increased resistance of many cancers to radio- and chemo-therapy [7-9, 15]. In this context, we tested whether WNT6 expression may have an impact in the sensitivity of GBM cells to clinically relevant therapies, including TMZ chemotherapy and radiation. Interestingly, WNT6-silenced GBM cells were significantly more sensitive to TMZ-mediated cell death than their respective control cells (Figure 3A-B). In contrast, WNT6 did not affect sensitivity of GBM cells to radiation treatments (Figure S4). Overall, these results suggest WNT6 promotes resistance of GBM cells to TMZ, with potential clinical implications as TMZ is still the standard-of-care for these patients.
WNT6 promotes resistance to temozolomide chemotherapy in GBM cells. (A-B) U373 (A) and SNB19 (B) shCtrl- and shWNT6-transfected cells were treated with vehicle or TMZ for 6 days, and cell death was measured by Annexin-V and PI. The graphs present data of 3 independent assays (mean ± SD). Representative dot plots are displayed below. *, p < 0.05; **, p < 0.01; ***, p < 0.001 and ****, p < 0.0001 (two-way ANOVA post-hoc Tukey's test). DMSO: dimethyl sulfoxide; PI: propidium iodide; TMZ: temozolomide.
WNT6 promotes glioblastoma stem cell features
Due to the critical roles of GBM stem cells (GSC) in the pathophysiology and clinical outcome of GBM patients, we investigated how WNT6 may affect GBM cells' stemness. Interestingly, WNT6-silenced U373 and SNB19 cells showed prominent decreased levels of NESTIN and SOX2 proteins, two common markers of GSCs (Figure 4A). In addition, WNT6 expression resulted in significantly higher capacities of U373, SNB19 and U87 cells to form neurospheres when cultured under GSC conditions (Figure 4B-C and Figure S3F-G), functionally suggesting WNT6 contributes to the stem cell phenotype of GBM cells. Concordantly, WNT6 expression resulted in significantly increased neurosphere-forming frequency in a limiting dilution sphere-forming assay (1/3.81 for shCtrl vs. 1/16.11 for shWNT6; p = 0.01, likelihood ratio test, Figure 4D for U373 cells; SNB19 cells with WNT6-silencing did not form spheres in the tested conditions - data not shown; 1/62.3 for U87-Ctrl vs. 1/24.6 for U87-WNT6; p = 0.004, likelihood ratio test, Figure S3H), an assay that allows the quantification of cells with stem-like properties that are capable of forming a new neurosphere derived from a single cell.
WNT6 silencing decreases GBM stem cell features. (A) SOX2 and NESTIN double-immunostaining in U373 (left) and SNB19 (right) shCtrl/shWNT6 cells. DAPI was used to stain cell nuclei (40x magnification; scale bar = 50 µm). (B) Representative images of U373 (left) and SNB19 (right) shCtrl/shWNT6 neurospheres at days 10 and 15 after plating, respectively (40x magnification; scale bar = 250 µm). (C) Quantification of neurospheres formation (n = 3 independent assays; mean ± SD; *, p < 0.05; **, p < 0.01, two-sided unpaired t-test with Welch's correction being applied when homoscedasticity was not verified). (D) Limiting dilution assays in U373-shCtrl (black) and -shWNT6 (red) cells to assess their sphere-forming capacity. The graph is representative of 3 independent assays with similar results. The trend lines represent the estimated active cell frequency (p = 0.01, likelihood ratio test). (E) Representative images of U373 (left) and SNB19 (right) shCtrl/shWNT6 cells cultured under stem cell-adherent conditions (scale bar = 250 µm). (F) MTT assay evaluating U373 (left) and SNB19 (right) shCtrl/shWNT6 cell viability when cultured under stem cell-adherent conditions (n = 3 independent assays; mean ± SD; **, p < 0.01; ****, p < 0.0001; two-sided unpaired t-test with Welch's correction applied when homoscedasticity was not verified). (G) Heatmap representation of expression levels of WNT6 and 30 stem cell-related genes in 573 GBM patients' samples from TCGA. Each column corresponds to a patient and each line to a gene. Expression values increase from darker blue (low levels) to darker red (high levels). (H) Correlation graphs between WNT6 expression (x-axis) and the expression of stem cell genes selected based on the heatmap (y-axis; Pearson's correlation test; r and p values are indicated).
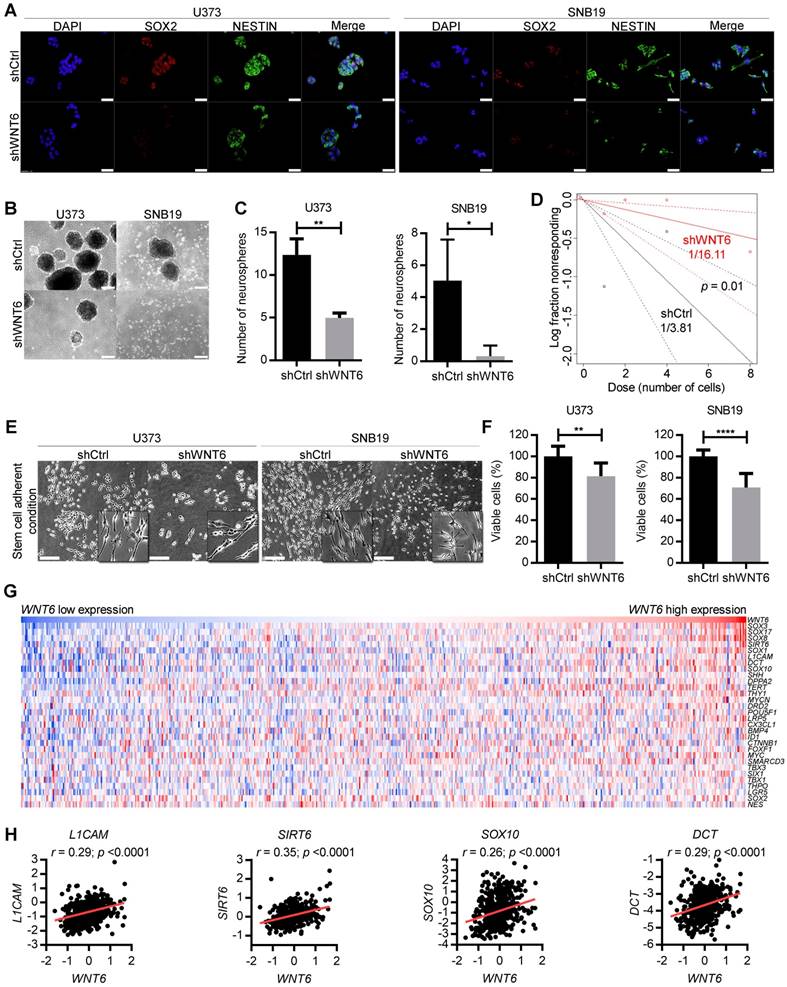
In addition to sphere-based stem cell assays, we then tested U373 and SNB19 cells cultured under specific adherent conditions that allow GSC expansion (neurosphere medium supplemented with B27, EGF and FGF in laminin-coated wells) [29]. GBM cells acquired a more elongated phenotype in these adherent stem cell conditions (Figure 4E), as previously described [29, 30]. Concordantly with our findings in “non-stem cell” conditions (Figure 2C-D), WNT6 silencing significantly impaired cell viability of U373 and SNB19 GBM cells grown in adherent stem cell-like conditions (Figure 4F). Globally, these data suggest WNT6 has an important functional role in the formation and maintenance of GSCs.
WNT6 is associated with stem cell-related genes in GBM clinical samples
To further translate our results to the clinical setting, we evaluated correlations between the expression levels of WNT6 and typical stem cell-related genes in GBM patients from TCGA. Interestingly, heatmap analyses revealed common patterns of gene expression between various stem cell-related genes and WNT6 (Figure 4G), and individual correlation graphs showed statistically significant positive correlations between the expression levels of WNT6 and these genes (p < 0.0001; Figure 4H and Figure S5). These data from GBM patients fit well with our in vitro findings, further suggesting WNT6 contributes to the stem cell phenotype of GBM cells.
High WNT6 levels accelerate GBM-associated death in intracranial mice models
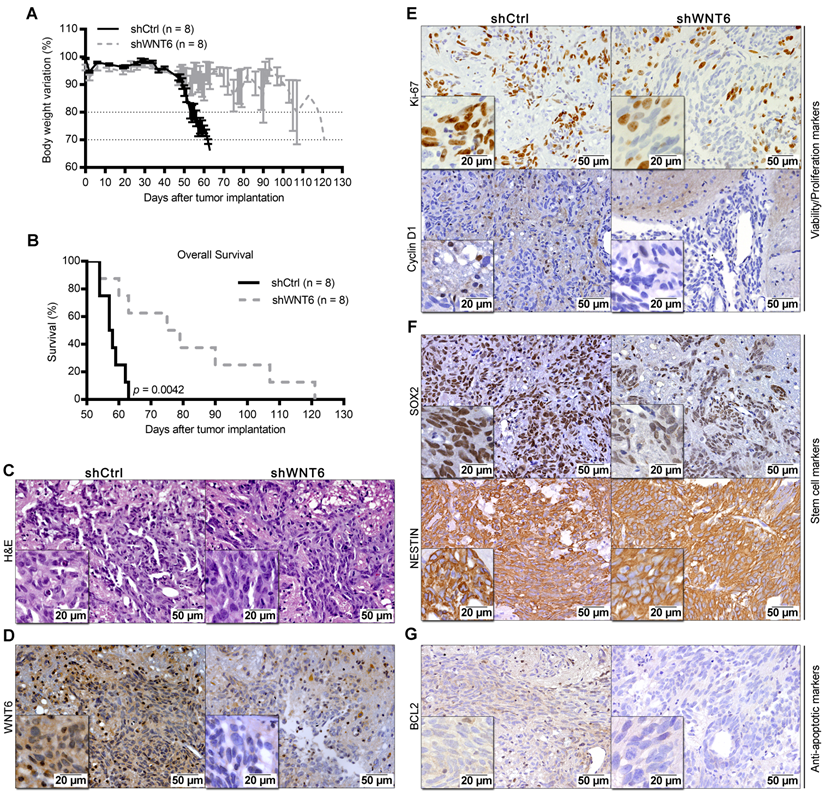
To expand our findings to in vivo models, U373-shCtrl and U373-shWNT6 (Figure 5), or U87-Ctrl and U87-WNT6 cells (Figure S3I-L) were orthotopically injected in the brain of NSG mice. Importantly, all mice bearing WNT6-low tumors presented significantly delayed evidences of GBM-related neurological symptoms and slower body weight loss than mice bearing WNT6-high tumors (Figure 5A and Figure S3I). This was accompanied by a significantly longer overall survival of U373-shWNT6 and U87-Ctrl mice as compared to mice injected with U373-shCtrl and U87-WNT6 cells, respectively (Figure 5B and Figure S3J), implicating high levels of WNT6 as a negative prognostic biomarker in orthotopic GBM in vivo models. Post-mortem hematoxylin & eosin (H&E) analyses confirmed GBM formation in all animals (Figure 5C and Figure S3K), with a very invasive phenotype typical of GBM. IHC confirmed long-term WNT6 silencing and overexpression in U373-shWNT6 and U87-WNT6 tumors, respectively (Figure 5D and Figure S3L). Histologically, shWNT6 GBM tumors also presented: i) lower proliferative activity, as observed by decreased Ki-67 and Cyclin D1 immuno-stainings (Figure 5E); ii) diminished expression of the stem cell marker SOX2, despite no alteration in the expression of NESTIN (Figure 5F); and iii) decreased expression of BCL2 protein, a critical anti-apoptotic molecule (Figure 5G). Together, these data support WNT6 as a critical mediator of GBM aggressiveness in vivo, identifying some molecular mediators that might sustain this aggressive phenotype, in line with what was observed in the in vitro assays.
WNT6 accelerates GBM-associated death in an intracranial mouse model. U373 transfected cells were orthotopically injected in the brain of NSG mice (n = 8 per group). (A) Weight curves after tumor implantation. (B) Kaplan-Meier overall survival curves of mice (p = 0.0042; Log-rank test). (C-G) Post-mortem brain histological and molecular analyses. (C-D) H&E and anti-WNT6 IHC staining were used as controls for GBM formation and successful long-term WNT6 silencing, respectively. (E-G) IHC for cell proliferation/viability markers Ki-67 and Cyclin D1 (E), stem cell markers SOX2 and NESTIN (F), and anti-apoptotic marker BCL2 (G). Scale bars' values are shown in each microphotograph (20 µm or 50 µm). H&E: hematoxylin and eosin.
WNT6 acts through β-catenin-dependent WNT signaling and downstream targets of SFKs/STAT pathways
To explore the underlying molecular mechanisms by which WNT6 influences GBM aggressiveness, the activation status of a large variety of cancer-related kinases was evaluated in U373 and SNB19 cell lines using a human phospho-kinase antibody array (Figure 6A-B). The phosphorylation levels of 4 proteins belonging to the non-receptor tyrosine Src family kinases [SFK; namely p-Fgr (Y412), p-Yes (Y426), p-Fyn (Y420) and p-Src (Y419)], and p-HSP27 (S78/S82), a member of the heat shock protein (HSP) family, were significantly decreased upon WNT6 silencing in U373 and SNB19 GBM cells (Figure 6A-B). In addition, the total levels of β-catenin were also decreased upon WNT6 silencing in both cell lines (Figure 6A-B).
WNT6 influences the activation status of WNT, SFK, and STAT pathways in GBM. Phospho-kinase arrays were performed to evaluate the phosphorylation status of cancer-related kinases in U373 (A) and SNB19 (B). Each array includes 2 technical replicates; 2 and 1 biological replicates were used for U373 and SNB19, respectively. Fold changes between phosphorylation levels of proteins in shWNT6 vs. shCtrl cells are shown (mean ± SD). HSP60 was used as reference protein. Similar alterations in the phosphorylation of particular proteins for U373 and SNB19 cells are highlighted in red. *, p < 0.05; **, p < 0.01; ***, p < 0.005; ****, p < 0.0001; two-sided unpaired t-test. (C-D) The phosphorylation status of STAT3, β-catenin, and AKT, and their respective total forms were assessed in U373 (C) and SNB19 (D) shCtrl and shWNT6 cells by WB (images are representative of 3 independent assays; α-tubulin was used as reference protein for normalization; relative expression levels are shown above each band). (E) GSEA analyses identifying signatures of genes significantly associated (ES > 0.3, and FDR < 0.3) with WNT6 in GBM patients from TCGA. ES: enrichment score; FDR: false discovery rate.
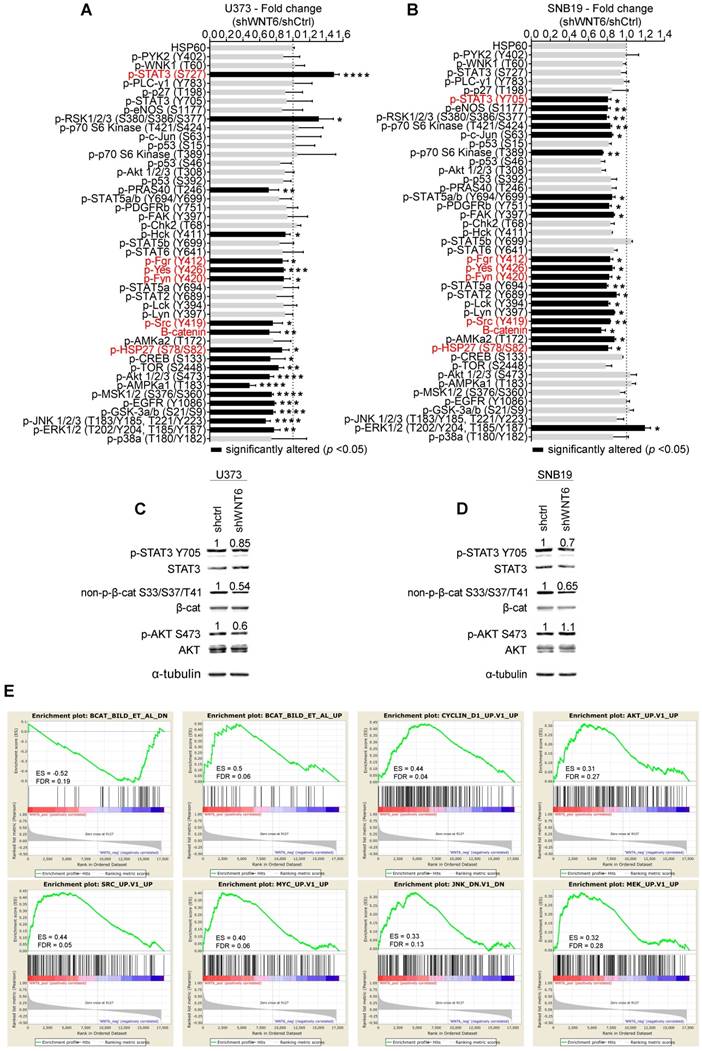
Of note, other signaling pathways were concordantly affected upon WNT6 silencing in both cell lines, but at the level of different proteins. For example, the PI3K/AKT/mTOR pathway activation was decreased in U373 cells by directly affecting the phosphorylation of activating residues of AKT and mTOR, two of the major mediators of this pathway. While these specific proteins were not significantly altered in SNB19 cells, other downstream targets of this pathway, such as p70 S6K and eNOS, showed decreased phosphorylation levels, globally resulting in similar decreased signaling of the PI3K pathway. It is also interesting to note that STAT3 phosphorylation levels were altered in WNT6-silenced U373 and SNB19 cells, but at different residues: serine 727 (S727) phosphorylation was increased in U373 cells, while tyrosine 705 (Y705) phosphorylation was decreased in SNB19 cells (Figure 6A and B). Despite the contrasting phosphorylation levels of these STAT3 residues, the biological meaning is the same, as S727 phosphorylation inactivates, while Y705 phosphorylation activates STAT3 activity [31].
In addition to these signaling pathways concordantly affected in both cell lines, cell-line specific effects were also observed, such as alterations in the phosphorylation of JNK, GSK-3a/b, and EGFR in U373 cells, and of STAT2, STAT5a, STAT5a/b, PDGFRb, and c-Jun in SNB19 cells. Again, despite these examples of cell-specific effects, the silencing of WNT6 consistently resulted in a decreased activation status of these cancer-related pathways in GBM.
To further validate the results obtained in the phospho-kinase arrays, the phosphorylation status of 3 proteins was assessed by western blot (WB) and normalized to α-tubulin (reference protein; Figure 6C-D), as performed in the arrays. Interestingly, WBs show a slight decrease of p-STAT3 Y705 in U373 cells, and a more prominent decrease in SNB19 cells, as evidenced in the phospho-arrays. Similarly, a significant decrease of non-p-β-cat S33/S37/T41 levels upon WNT6 silencing was observed in both cell lines, while only U373 presented decreased p-AKT S473 phosphorylation levels, further validating the phospho-arrays data.
To confirm that WNT6 activates the canonical WNT/β-catenin signaling pathway, TCF/LEF reporter assays were performed in both U373 shCtrl/shWNT6 cells and in U87 Ctrl/WNT6 cells. Concordantly to the aforementioned results, GBM cells with high levels of WNT6 presented a significantly increased activation of the WNT canonical pathway as compared to their negative counterparts (Figure S6A-D).
Together, these results suggest that WNT6 acts not only through β-catenin-dependent WNT signaling, but also through the activation of downstream targets of SFKs/STAT pathways, highlighting WNT6 as a critical molecule involved in a variety of crucial signaling pathways in GBM, which associate with the observed oncogenic functional effects in vitro and in vivo, and reveal putative novel targets for therapeutic interventions in WNT6-high GBMs.
WNT6-correlated genes are enriched for WNT, AKT, SRC, MYC, JNK and MAPK signaling pathways in GBM patients
To expand the WNT6-associated molecular mechanisms detected in vitro (Figure 6A-D) to clinical samples of GBM, gene set enrichment analysis (GSEA) were performed to identify transcriptomic signatures reminiscent of WNT6-associated genes in patients (Figure 6E). The gene expression profiles of GBM patients from TCGA (n = 573) were gathered, and WNT6 expression used as a continuous label (i.e., all genes were ranked based on their correlation with WNT6). WNT6-positively correlated genes revealed to be significantly enriched for genes up-regulated upon activation of WNT, AKT, SRC, MYC, JNK and MAPK signaling (all enrichment scores, ES > 0.3, and false discovery rates, FDR < 0.3; Figure 6E). Concordantly, WNT6-negatively correlated genes were enriched for genes down-regulated upon WNT signaling activation (ES > 0.3 and FDR < 0.3; Figure 6E top left). Overall, these transcriptomic results derived from GBM samples fit well with our in vitro phosphorylation data, where the same pathways were shown to be altered upon WNT6 silencing, further supporting the critical links between WNT6 and key oncogenic signaling pathways associated with glioma aggressiveness.
High levels of WNT6 expression associate with shorter overall survival in GBM patients
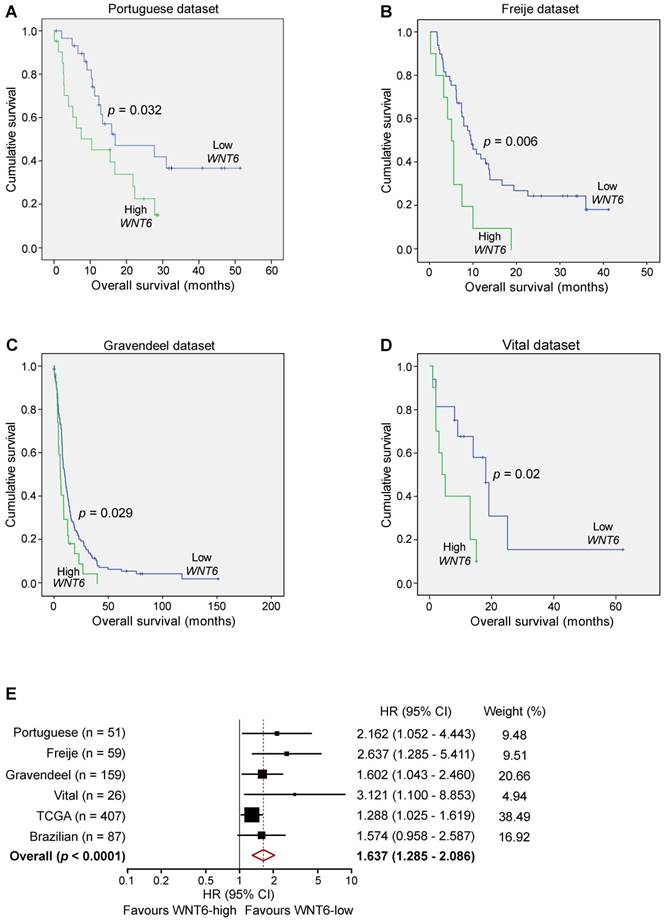
Since our data demonstrated critical roles of WNT6 in GBM aggressiveness in vitro and in vivo, and its association with GBM's key signaling pathways, we investigated the clinical significance of WNT6 expression in a variety of GBM patient datasets. In our Portuguese dataset (Hospital Braga and Hospital Santa Maria, n = 51), high levels of WNT6 mRNA were significantly associated with shorter overall survival (OS) of GBM patients (p = 0.032; log-rank test; Figure 7A). Importantly, this association between high WNT6 mRNA levels and poor prognosis in GBM patients was further validated in 3 additional independent datasets: Freije (n = 59) [24], Gravendeel (n = 159) [32] and Vital (n = 26) [33] datasets (p = 0.006, p = 0.029, p = 0.02, respectively; Figure 7B-D). These findings were then validated in 407 GBM patients with available survival data from TCGA (Table 1), in which a multivariable Cox model showed a statistically significant association between higher values of WNT6 expression and shorter OS of GBM patients (p = 0.030), independently of other prognostic variables, including patient age (p < 0.0001), Karnofsky performance status (KPS; p = 0.001), gender (p = 0.037) and treatment with chemo- or radio-therapy (p < 0.0001; Table 1). Moreover, high levels of WNT6 protein expression, evaluated by IHC in a GBM Brazilian cohort (n = 87), also showed an evident trend for shorter OS (p = 0.069; Figure S7), highlighting that both mRNA and protein levels of WNT6 may be used as a clinically valuable biomarker. To reinforce this association, a meta-analysis including all independent datasets showed that WNT6-high expression is globally associated with shorter survival of GBM patients (Hazard Ratio = 1.637; 95% confidence interval: 1.285 - 2.086; p < 0.0001; Figure 7E). Together, these results suggest that WNT6 expression may be a new prognostic factor useful for the stratification of GBM patients.
WNT6 expression is prognostically valuable in GBM patients. Kaplan-Meier survival curves of WNT6-low and WNT6-high GBM patients derived from qRT-PCR data (A) or microarray (B-E) data. (A) Portuguese dataset, n = 51, median OS 16.9 vs. 10.4 months (low vs. high WNT6 expression, respectively; p = 0.032, Log-rank test). (B) Freije dataset, n = 59, median OS 9.6 vs. 5 months (p = 0.006, Log-rank test). (C) Gravendeel dataset, n = 159, median OS 10.1 vs. 6 months (p = 0.029, Log-rank test). (D) Vital dataset, n = 26, median OS 18 vs. 4 months (p = 0.02, Log-rank test). (E) Forest plot of hazard ratios (HR), illustrating the associations between WNT6 expression and overall survival in GBM patients. Each cohort is accompanied by its HR (black square; the size of the square represents the weight of the study in the meta-analysis) and 95% confidence intervals (extending lines). The diamond represents the estimated pooled effect (HR = 1.637; 95% confidence interval: 1.285 - 2.086; p < 0.0001). CI: confidence interval; HR: hazard ratio.
High levels of WNT6 expression are significantly associated with shorter survival of GBM patients (n = 407; microarray data).
| Overall survival | ||
|---|---|---|
| p-value | Exp(B) | |
| WNT6 expression | 0.03 | 1.288 |
| Age | <0.0001 | 1.029 |
| KPS | 0.001 | 0.984 |
| Gendera,b | 0.037 | 0.771 |
| Chemo- or Radiotherapya,c | <0.001 | 0.192 |
aGender and Chemo- or Radiotherapy was used as categorical variables;
bFemale (n = 154) vs Male (n = 253);
cTreatment (n = 383) vs No treatment (n = 24).
Discussion
Deregulated signaling of the WNT pathway has been reported in several human cancers, including GBM, and has been associated with treatment resistance [13, 34-36]. This is partly due to stem cell features sustained by WNT signaling, such as increased proliferation and migration [34]. The present study is the first dissecting the functional roles and underlying molecular mechanisms mediated by WNT6 activation in human GBM, establishing it as a clinically relevant prognostic biomarker (Figure 7, Figure 8, Table 1, and Figure S7). Due to its critical functions during embryogenesis [37-42], deregulated expression of WNT6 in adults may favor tumorigenesis [13-16]. Our data show that the expression of WNT6 in gliomas is grade-dependent, at the gene and protein levels (Figure 1), similarly to what was previously described for other WNT ligands [5, 6, 43-46], thus associating WNT6 with increased malignancy of gliomas. In addition, our findings demonstrate prominent effects of WNT6 on GBM cell viability, proliferation, glioma stem cell capacity, invasion, migration and sensitivity to TMZ-based chemotherapy, comprehensively implicating WNT6 as an important oncogenic factor in glioma (Figure 2, Figure 3, Figure 4, and Figure S3). This is in agreement with the known effects of other WNT ligands in GBM [5, 6, 44, 46, 47]. According to the definition of CSC [48], we showed that WNT6 expression not only correlates with the expression of cancer stem cell-associated genes, but also functionally impacts the self-renewal capacity of GSC (Figure 4 and Figure S3F-H). Concordant with the functional effects, molecular data also showed WNT6 associates with typical GSC markers, both in GBM cells and patient samples.
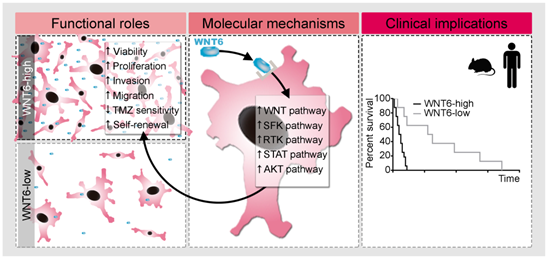
Proposed model for the functional, molecular and clinical impact of WNT6 in GBM. WNT6-high GBM cells present increased proliferation, invasion, migration, TMZ resistance and stem cell self-renewal capacities, which are accompanied by activation of the WNT, SFK, RTK, STAT and AKT pathways. Clinically, WNT6-high tumors cause shorter overall survival (both in mouse GBM models and human patients).
Considering the global effects of WNT6 in GSC phenotypes (Figure 4 and Figure S3F-H), cell motility capacity (Figure 2 and Figure S3D-E), and resistance to chemotherapy (Figure 3), it will be interesting to evaluate its potential value as a biomarker for tumor recurrence, which is of paramount importance to the clinical management of GBM as these patients recur almost universally after treatment. Importantly, we also demonstrated that WNT6 is a novel biomarker of GBM prognosis, as patients with WNT6-high tumors from a variety of independent datasets presented a significantly shorter OS than WNT6-low tumors (Figure 7, Table 1, and Figure S7), a clinical finding that is in agreement with our in vivo data (Figure 5 and Figure S3I-J). This might be linked to the WNT6 oncogenic activities, such as increased invasion/migration hampering complete tumor resection, increased tumor relapse probability due to its roles in GSC maintenance (Figure 4 and Figure S3F-H), and the response to TMZ treatment (Figure 3), which is still the gold-standard chemotherapeutic drug used for GBM patients. These findings fit well with previous reports describing that WNT6 increases the chemo-resistance of gastric [13] and bladder [14] cancer, and associates with the overall and disease-free survivals of esophageal squamous cell carcinoma patients [15]. Together, these data implicate WNT6 as a novel prognostic biomarker and putative therapeutic target for GBM patients. The fact that WNT6 levels can be easily assessed at the mRNA or protein levels with routine molecular biology techniques may also facilitate the widespread implementation of this biomarker in the clinical settings.
Taking into consideration that (i) the first step for designing novel therapeutic strategies requires not only the identification of new molecular targets, but also the understanding of their functional mechanisms, and (ii) nothing was known of WNT6-mediated signaling mechanisms in GBM or any other cancer type, our phospho-kinase arrays provide the first data on the activation status of several cancer-related pathways that may be regulated by WNT6 (Figure 6). The effects observed in β-catenin in U373 and SNB19 cells clearly suggest that WNT6 might act through the canonical WNT pathway in GBM, which was further validated with the TCF/LEF reporter assays in U373 and U87 cells (Figure S6). In addition, WNT6 silencing led to reduced phosphorylation/activation states of 4 non-receptor tyrosine Src kinases (Fgr, Yes, Fyn and Src), which have been described to contribute to the activation of downstream targets of RTKs, such as EGFR, influencing glioma aggressiveness [49-51]. WNT6 silencing also resulted in decreased phosphorylation of HSP27, an anti-apoptotic protein [52] associated with increased cell proliferation and decreased Fas-induced apoptosis in prostate cancer [53], and was shown to mediate the activation of p38/ERK (MAPK) pro-survival signaling in cervical cancer cells [54]. Nevertheless, other cell line-specific alterations in WNT6-silenced cells, namely in p-AKT, p-TOR and p-PRAS40 in U373 cells, clearly demonstrate the association between WNT6 and the activation of the PI3K/AKT/mTOR pathway, which is known to have a major role in the oncogenic process of GBM cells [55]. Regarding p-STAT3 alterations upon WNT6 silencing, it was reported that reduced p-STAT3 S727 or increased p-STAT3 Y705 lead to more aggressive glioma tumors in vivo, and enhanced glioma proliferation and invasion in vitro [31], which also fits well with a WNT6-mediated oncogenic role in GBM. Importantly, GSEA data derived from clinical GBM samples further supported the molecular links between WNT6 and these cancer-related pathways. In this context, our results, together with the reports associating the WNT pathway with the MAPK, PI3K and STAT3 pathways [56-63], strongly support a role of WNT6 in the regulation of these cancer-related pathways and suggest that WNT6 acts, at least partly, through the canonical WNT signaling, independently of the expression of other well-known canonical WNT ligands (WNT1 and WNT3a; Figure S8). Future work should focus on the potential predictive value of WNT6 for targeted therapies with specific inhibitors of WNT-related pathways (e.g., LGK974, currently tested in clinical trials for several solid tumors; NCT01351103).
In summary, this work provides significant contributions to the neuro-oncology field, profiting from the understanding of WNT6-mediated signaling pathways and from the portrayal of the functional roles and clinical value of WNT6 in GBM, potentially impacting prognostic stratification and aiding in rational treatment decisions for GBM patients.
Methods
TCGA data analysis in glioma patients
All gene expression data from samples hybridized by the University of North Carolina, Lineberger Comprehensive Cancer Center, using Agilent G4502A 244K, were downloaded from TCGA (https://portal.gdc.cancer.gov/) [19], including 572 GBMs, 27 LGGs, and 10 unmatched non-tumoral patient samples. To prevent duplicated entries from the same patient—when more than one portion per patient was available—the median expression value was used. Three probe sets hit WNT6 gene (A_23_P119916, A_32_P159877 and A_24_P208513). The provided value was pre-processed and normalized according to “level 3” specifications of TCGA. WNT6 overexpression in glioma samples was considered when higher than that in non-tumoral samples (“level 3” value ≥ 0.41). Clinical data of each patient was provided by the biospecimen core resources and includes information about patients' age at diagnosis, gender, KPS and days to death and to last follow-up.
Freije, Gravendeel and Vital datasets
WNT6 expression microarray data from Freije (n = 59) [24], (Gravendeel) n = 159 [32], and Vital (n = 26) [33] datasets of GBM patients were obtained in the GlioVis data portal [64]. The top 17% of tumors expressing highest levels of WNT6 were classified as WNT6-high in Freije (n = 10/59) and Gravendeel (n = 27/159) datasets, similar to the cutoff used for TCGA, and the top 39% for the Vital (n = 10/26) dataset due to the small number of patients. Clinical data included GBM subtype classification, OS and vital status of the patients.
Glioma primary tissues
Glioma tumor specimens were obtained from patients who underwent a craniotomy for tumor removal or stereotaxic biopsy at 4 different hospitals: Hospital Braga (HB), Hospital Santa Maria (HSM, Centro Hospitalar Lisboa Norte; samples requested from Biobanco-iMM, Lisbon Academic Medical Center, Lisbon, Portugal) and Hospital Santo António (HSA, Centro Hospitalar Porto), Portugal, and Hospital de Câncer de Barretos, Brazil. Samples from HB and HSM were reserved for RNA-based studies, transported in dry ice to the lab and stored at -80 °C. Samples from HSA and Brazil were formalin-fixed and paraffin-embedded and used for IHC analysis. Samples from Brazil were organized in triplicates into tissue microarrays (TMAs) [65]. Tumors were classified according to WHO 2007 [66] and only patients with glial tumor histological diagnosis were included in the study.
Immunohistochemistry
Tissues sections were deparaffinized and rehydrated by xylene and ethanol series. Sodium citrate buffer (10 mM, 0.05% Tween 20, pH 6) was used for antigen retrieval. Endogenous peroxidase activity was blocked with 3% H2O2 in TBS 1x for 10 min. Immunohistochemical staining was performed using the LabVision kit (UltraVision Large Volume Detection System Anti-polyvalent, HRP) according to the manufacturer's instructions. WNT6, Ki-67, Cyclin D1, SOX2, Nestin, GFAP and BCL2 antibodies were used (see Table S1 for details). Concerning Ki-67 staining, before antigen retrieval, tissues were permeabilized using TBS-Tween 0.5%, for 10 min. DAB substrate (DAKO) was used as chromogen, followed by counterstaining with hematoxylin. The TMA from the Brazilian cohort was blind-scored by a pathologist based on WNT6 staining intensity: 1 = weak, 2 = moderate and 3 = strong. The average of the triplicate spots was calculated and used for the survival analysis. An average > 2 was considered as WNT6 high expression.
Cell lines and culture conditions
Human GBM cell lines U373MG and U87MG (kindly provided by Dr. Joseph Costello, University of California, San Francisco), and SNB19 (obtained from German Collection of Microorganisms and Cell Cultures) were cultured in DMEM (Biochrom) supplemented with 10% Fetal Bovine Serum (FBS; Biochrom). Cells were maintained in a humidified atmosphere at 37 °C and 5% (v/v) CO2. These conditions were maintained throughout the studies, unless otherwise stated. Testing for mycoplasma contamination was performed every month.
WNT6-silencing by shRNA in GBM cells
U373MG and SNB19 cell lines were plated at 70 000 cell/well (24-well plate) and 100 000 cells/well (12-well plate), respectively. Cells were transfected with WNT6 gene-specific shRNA expression vector inserted in a pRS plasmid (TR308360, clones TI333434 and TI333435 from Origene; named U373-shWNT6 or SNB19-shWNT6, respectively) or with a scrambled negative control non-effective shRNA in a pRS plasmid (TR30012, Origene; named U373-shCtrl or SNB19-shCtrl). Lipofectamine 3000 (Invitrogen) transfection reagent was used according to the manufacturer's recommendations (ratio plasmid/lipofectamine, 1:2.5). Stable transfection was achieved by selecting transfected clones with puromycin (1 µg/mL).
WNT6 overexpression in GBM cells
U87MG cells were plated at 200 000 cell/well (6-well plate). Cells were transfected with the pcDNA-Wnt6 vector (gift from Dr. Marian Waterman; Addgene plasmid #35913) [67] or with the respective empty vector (pcDNA3.2 GW delCMV; gift from Dr. Edward Hsiao; Addgene plasmid #29496) [68]. Lipofectamine 3000 (Invitrogen) transfection reagent was used according to the manufacturer's recommendations (4 µL of Lipofectamine 3000 per 1 µg of DNA). Stable transfection was achieved by selecting transfected clones with geneticin (800 µg/mL).
qRT-PCR
Total RNA was extracted from GBM patients' tissues and cell lines using the TRIzol method (Invitrogen) and cDNA from 1 µg of the total RNA was then synthesized (RT-Phusion Kit, Thermo Scientific). The levels of WNT6 and TBP (reference gene) were assessed by quantitative reverse transcription-PCR (qRT-PCR; KAPA SYBR® FAST qPCR Kit, KAPA BIOSYSTEMS or PowerUp™ SYBR™ Green Master Mix, ThermoFisher Scientific, for cell lines and GBM patient's samples, respectively) with the following sets of primers: WNT6 Fwd 5'-GACGAGAAGTCGAGGCTCTTT-3' and Rev 5'-CGAAATGGAGGCAGCTTCT-3'; TBP Fwd 5'-GAGCTGTGATGTGAAGTTTCC-3' and Rev 5'-TCTGGGTTTGATCATTCTGTAG-3'. The annealing temperature was 60 °C for both. The levels of WNT1 and WNT3a were assessed using Taqman gene expression assays (Hs00180529_m1 and Hs00263977_m1, respectively) and normalized against TBP (Hs00427620_m1), following the manufacturer's instructions. Levels were determined based on the 2-∆∆Ct method, as previously described [69].
Immunofluorescence (IF)
U373 (shCtrl/shWNT6) and SNB19 (shCtrl/shWNT6) cells were plated on coverslips in DMEM supplemented with 10% FBS. Cells were fixed with paraformaldehyde 4% and then incubated in 1% BSA in PBS/0.1% Tween for 1 h. Afterwards, cells were incubated overnight at 4 °C with the primary antibody against WNT6 or SOX2. Alexa fluor® 594 goat anti-rabbit IgG (H+L; A-11012, ThermoFisher Scientific) secondary antibody was used. Additionally, SOX2-coverslips were incubated with anti-NESTIN primary antibody. Next, Alexa Fluor® 488 goat anti-mouse IgG (H+L; A-11001, ThermoFisher Scientific) secondary antibody was used. DAPI (VECTASHIELD® Mounting Medium with DAPI, Vector Laboratories) was used to stain the cell nucleus (blue) at a concentration of 1.5 µg/mL. Further details about the antibodies used are provided in Table S1.
Cell viability assays
Cell viability was determined 6 days after plating by both trypan blue and MTT (U373 and SNB19 cells) or MTS (U87 cells) assays. For trypan blue assay, cells were plated, in triplicate, at an initial density of 20 000 cells/well in 6-well plates. For MTT/MTS assay, transfected cells were plated in 12-well plates, in triplicate, at an initial density of 6 000 (for U373 and U87 cells) or 10 000 cells/well (SNB19).
For the MTT assay, cells were incubated with 0.5 mg of MTT (ThermoFisher Scientific) per mL of PBS 1x, for up to 2 h in a humidified atmosphere at 37 °C and 5% CO2. Subsequently, the formed crystals were dissolved using an acidified isopropanol solution (0.04 M HCl in isopropanol), as described in [70], and the absorbance was read at 570 nm. For the MTS assay, cells were incubated with 10% of the MTS solution (CellTiter 96® AQueous One Solution Cell Proliferation Assay; Promega) in DMEM supplemented with 10% FBS, for up to 1 h in a humidified atmosphere at 37 °C and 5% CO2. Absorbance was recorded at 490 nm.
Cell proliferation
Cell proliferation was evaluated based on the measurement of BrdU incorporation during DNA synthesis (Cell Proliferation ELISA, BrdU colorimetric assay, Roche), as recommended by the manufacturer. Briefly, cells were cultured in DMEM (Gibco®) supplemented with 10% FBS (Biochrom) in 96-well plates (cell density: 2 000 cells/well) for 4 days. After that, BrdU was added to the cells and they were re-incubated for 4 h.
Cell migration
Ibidi 2-well inserts (Ibidi) with a cell-free gap were used in 12-well plates to evaluate cell migration by wound healing assay. U373 and SNB19 transfected cells were plated in triplicate, at an initial density of 70 000 and 60 000 cells in each side of the insert, respectively, and left to adhere overnight. After that, inserts were removed (0 h time-point) and wells were washed with PBS to remove dead cells and debris. The migration of the cells into the gap was imaged (2 images/well) over hours until wound closure was achieved (images were captured at the same locations over time). The gap size (pixels) was measured using an automated software (beWound - Cell Migration Tool, v1.7, BESURG, Portugal; www.besurg.com) and manually verified and corrected when deemed necessary. At least 15 lines equally spaced across the image and perpendicular to the gap main axis were used for increased measurement representativeness.
Cell invasion
Cell invasion was assessed using the BD BioCoat™ Matrigel™ Invasion Chambers (Corning®) as recommended by the manufacturer. Briefly, cells were seeded into the top (insert) at the initial density of 50 000 cells/well (U373 and SNB19) or 25 000 cells/well (U87; 24-well chambers) in DMEM (Gibco®) supplemented with 1% FBS. EGF was added to the medium of the lower chamber (DMEM supplemented with 10% FBS) at a concentration of 20 ng/mL, as chemoattractant. Cells were incubated for 22 h. Next, cells that invaded through the membrane were stained using VECTASHIELD Mounting Medium with DAPI (Vector Laboratories) and a picture of the entire membrane was obtained using an Olympus Upright BX61 microscope. The total cell number was counted with the help of ImageJ software (version 1.49).
Cell death
Cell death was evaluated after 6 days of treatment with TMZ (400 µM and 800 µM, for U373 and SNB19 transfected cells, respectively) or DMSO (Dimethyl sulfoxide; Vehicle). TMZ treatment was applied 24 h after plating and was renewed 2 days after. Cells were stained with Annexin V-FITC (BD Bioscience) and propidium iodide (PI; TermoFisher Scientific), according to the manufacturer's protocol, followed by flow cytometry analysis. At least 10 000 events were acquired. Results were analyzed using FlowJo software (version 10).
Colony formation assay
For clonogenic cell survival assay, cells were seeded at a density of 1 000 to 2 000 per 25-cm2 flask, in triplicates. Twenty-four hours after seeding, irradiation was performed at RT in single exposure doses, delivered by a Novalis TX® linear accelerator, with a nominal energy of 6 MV at a dose rate of about 400 cGy/min. Doses of 2 and 4 Gy were calculated using a dedicated treatment planning system to a depth of water of 1.5 cm. The plating efficiency (PE) represents the percentage of seeded cells that grew into colonies. Colonies with more than 50 cells were counted by microscopic inspection and PE, as well as the radiation-surviving fraction (PE of experimental group/PE of control group), were determined. Survival data were obtained with data from 3 independent experiments.
Cell viability assay (MTT) under stem cell conditions
Culture vessels were coated with 10 µg/mL natural mouse laminin (Invitrogen) for 3 h at 37 °C or overnight at 4 °C, as previously described [29]. U373 and SNB19 transfected cells were plated in 12-well laminin-coated plates, in triplicate, at an initial density of 6 000 and 10 000 cells per well, respectively. Cells were cultured in serum-free stem cell medium composed by DMEM-F12 (Gibco) supplemented with 1x B27 (Invitrogen), 20 ng/mL of EGF (Invitrogen), and 20 ng/mL of basic fibroblast growth factor (b-FGF, Invitrogen). After 4 days in culture, cells were incubated with MTT as detailed above (section “Cell viability assays”).
Neurosphere formation assay
U373, SNB19 and U87 transfected cells were plated at the maximum density of 4 000 cells/mL in low-attachment 24-well plates (Corning). Cells were cultured in serum-free stem cell medium, as detailed above. Neurospheres were supplemented with fresh media every 4-5 days (250 µL/well). The number of neurospheres was counted after 10 days for U373 and U87 cells and 15 days for SNB19.
Limiting dilution assay
Cell numbers of U373 and U87 transfected cells were adjusted to a starting concentration of 40 000 cells/mL and 160 000 cells/mL, respectively, from which multiple serial dilutions were performed and plated in low-attachment 96-well plates (Corning). At the end, cell densities ranged from 1 000 to 1 cells per well in a final volume of 100 µL for U373 cells and from 4 000 to 8 cells per well for U87 cells. Cells were cultured in serum-free stem cell medium, as detailed above. Cultures were disturbed only for media supplementation every 5 days. After 15 days, the fraction of wells not containing neurospheres was determined for each condition and plotted against the initial plated cell density. Stem cell frequencies and statistical significance were calculated using the Extreme Limiting Dilution Assay (ELDA) software available at http://bioinf.wehi.edu.au/software/elda/ [71].
Stereotactic orthotopic xenografts
NSG (NOD.Cg-Prkdcscid Il2rgtm1Wjl/SzJ) mice aged 4 months were anesthetized with a mixture of ketamine (75 mg/kg) and medetomidine (1 mg/kg) supplemented with butorphanol (5 mg/kg) for its analgesic properties and placed into the digital 3-axis stereotaxic apparatus (Stoelting). A total of 5×10⁵ U373 or 2×10⁵ U87 transfected cells (resuspended in 5 µL PBS 1x) were injected into the brain striatum using a 10 µL Hamilton syringe with a point style 4 beveled 26s-gauge needle, as previously described [72]. A total of 8 male and 6 female mice per group were used for U373 and U87 transfected cells, respectively. U373 and U87 cells were used as no reports were found for SNB19 tumorigenic capacity when orthotopically injected in immunocompromised mice. Mice were maintained under standard laboratory conditions, which included an artificial 12 h light/dark cycle, controlled ambient temperature (21 ± 1 °C) and a relative humidity of 50-60%. The confirmation of specified pathogen-free health status of sentinel mice maintained within the same animal room was performed according to FELASA guidelines. Experimental mice were always manipulated in a flow hood chamber, except during the surgery. Mice's body weight was evaluated 3 times per week, while general behavior and symptomatology were registered daily. Sacrifice at the pre-established humane endpoint was performed when mice presented severe weight loss (> 30% from maximum weight). Death was used for Kaplan-Meyer representation.
Human phospho-kinase antibody array
Human phospho-kinase antibody arrays (ARY003B; R&D systems) were used to simultaneously detect the relative levels of phosphorylation of 43 kinase phosphorylation sites and 2 related total proteins. Capture and control antibodies were spotted in duplicate on nitrocellulose membranes. The protocol was done following the manufacturer's recommendations. In this case, 400 µg of total protein from all cell lines (U373 shCtrl/shWNT6 and SNB19 shCtrl/shWNT6) was used. The obtained chemiluminescence was measured using the ChemiDoc imaging system (Biorad). Adjusted volume per spot (i.e., average pixel intensity of the spot times its area, corrected for the background) was measured using the Quantity One image analysis software. Background was eliminated using the local option. The average of each duplicated spot was calculated, normalized to HSP60 (reference protein) and used to determine the relative change in phosphorylated kinase proteins between shCtrl and shWNT6 conditions. Two sets of arrays were performed for U373 shCtrl/shWNT6, while only 1 was used for SNB19 shCtrl/shWNT6.
Western blot analysis
Cells were washed with PBS 1x and removed by scratch in a lysis buffer containing 50 mM Tris pH 8, 2 mM EDTA pH 7.4, 0.1% SDS, 1% NP-40 and 150 mM NaCl, inhibitors of proteases 1x (B14001, Biotool) and phosphatases 1x (B15001, Biotool). After a 15 -min incubation on ice, whole cell lysate was centrifuged at 13 000 × g for 15 min at 4 °C. The total protein concentration was determined from the obtained supernatant using the PierceTM BCA protein assay kit (ThermoFisher Scientific), according to the manufacturer's protocol. Protein extracts (denatured and reduced; 20 µg/lane) were separated in a 10% SDS-polyacrylamide gel by electrophoresis and transferred to nitrocellulose membranes (Hybond-C Extra, GE Healthcare Life Sciences), using the Trans-blot turbo transferring system (Bio-rad), following the manufacturer's instructions. A protein ladder (Page ruler prestained protein ladder; Fermentas) was used to determine the approximate protein size and to monitor the progress of the electrophoretic run and the success of the transfer. Before starting the immunodetection, membranes were blocked with BSA (5% in TBS 1x), for 1 h at RT. The immunodetection was achieved using antibodies against p-STAT3 Y705, STAT3, non-p-β-catenin S33/S37/T41, β-catenin, p-AKT S473, AKT, and α-tubulin (see Table S1 for details). Blots were revealed with peroxidase-conjugated secondary anti-mouse and anti-rabbit IgG antibodies (see Table S1 for details), followed by enhanced chemiluminescence (ECL) solution (SuperSignal West Femto Chemiluminescent Substrate; Thermo Scientific). The obtained chemiluminescence was measured using the ChemiDoc imaging system (Biorad). If necessary, membranes were stripped using the Restore™ PLUS Western Blot Stripping Buffer (Thermo Fisher Scientific), following the manufacturer's recommendations. As for the phospho-kinase arrays, adjusted volume per band was measured using the Quantity One image analysis software. Phosphorylated protein values were normalized to α-tubulin (reference protein).
TCF/LEF reporter assay
The Cignal TCF/LEF Reporter Assay Kit (GFP; Qiagen) was used to quantify the specific activation of β-catenin-dependent WNT signaling (canonical pathway). The protocol was done following the manufacturer's recommendations. Briefly, U373-shCtrl, U373-shWNT6, U87-Ctrl and U87-WNT6 cells were reverse transfected with i) a TCF/LEF reporter vector, which encodes a monster GFP under the control of a TATA box (basal promoter) joined to TCF/LEF responsive elements; ii) a negative control vector, which encodes GFP under the control of a TATA box; or iii) a positive control vector, which constitutively expresses the monster GFP for visual confirmation of the transfection efficiency. For this, cells were plated in triplicate at an initial density of 20 000 cells/well in 96-well plates with black walls and clear bottoms (Glass SPL Black plate). Lipofectamine 3000 (Invitrogen) transfection reagent was used according to the manufacturer's recommendations (0.25 µL of Lipofectamine 3000 per 100 ng of DNA). After 16 h of transfection, the medium was renewed and 24 h post-transfection, cells were treated with 50 mM of LiCl. GFP expression was verified 24 h after treatment under the microscope and quantified using a Varioskan Flash (Thermo Fisher Scientific) plate reader (excitation at 488 nm and emission at 515 nm). GFP expression in the reporter assay condition was normalized against the negative controls (as blank) and the respective positive controls (to control for transfection efficiency).
Gene Set Enrichment Analysis (GSEA)
The raw expression data profile (Agilent G4502A 244K) of all GBM patients from TCGA (n = 573) was extracted as detailed above. GSEA (www.broad.mit.edu/gsea/) software was then used [73]. In this work, a continuous phenotype profile was employed to find gene sets that correlate with WNT6 (gene neighbors). Accordingly, Pearson's correlation was used to score and rank the genes. Gene sets from the Molecular Signature Database (MSigDb) C6 collection were used. Default options were used, unless otherwise stated. Significant enrichments were considered when false discovery rate (FDR) < 0.30.
Statistical analyses
Homoscedasticity was verified with Levene's test and differences between groups were assessed by a two-sided unpaired t-test, with Welch's correction applied accordingly. For the wound healing assay and radiation treatment sensitivity assay, a two-way ANOVA followed by the post-hoc Sidak's test for multiple comparison testing was used. For the TMZ treatment cell death assay, a two-way ANOVA followed by the post-hoc Tukey's test for multiple comparison testing was used. The correlation between the expressions of WNT6 and stem-related genes (from the gene ontology gene-set GO_Positive_regulation_of_stem_cell_proliferation) was calculated using Pearson's correlation coefficient (r). The effects of WNT6 on mouse OS was assessed by log-rank test. These analyses were performed with GraphPad Prism 6.01 software (GraphPad software, Inc.).
The Chi-square test was used to assess the difference between the distributions of tumors with high and low WNT6 expression stratified for LGGs and GBMs. To evaluate the prognostic value of WNT6 expression, univariate or multivariate analyses of survival were performed using, respectively, the log-rank test or the Cox proportional hazard model, where the potential confounding effect of some variables is considered. These analyses were made with SPSS 22.0 software (SPSS, Inc.). A meta-analysis including all datasets was performed with the Comprehensive Meta Analysis (CMA) v3 software (Biostat, Inc.). Hazard ratios and 95% confidence intervals from the Cox univariate or, when possible, multivariate analyses were used. A random effects statistical model was applied.
For all statistical tests, significance was considered when p < 0.05.
Abbreviations
CSC: cancer stem cells; DMSO: dimethyl sulfoxide; DGAV: direcção geral de alimentação e veterinária; ES: enrichment scores; FBS: fetal bovine serum; FDR: false discovery rates; GBM: glioblastoma; GO: gene ontology; GSC: GBM stem cells; GSEA: gene set enrichment analysis; H&E: hematoxylin & eosin; HSA: hospital santo antónio; HB: hospital braga; HR: hazard ratio; HSM: hospital santa maria; HSP: heat shock protein; IHC: immunohistochemistry; KPS: karnofsky performance status; LGG: lower-grade gliomas; MSigDb: molecular signature database; NSG: NOD.Cg-Prkdcscid Il2rgtm1Wjl/SzJ; OS: overall survival; qRT-PCR: quantitative reverse transcription-PCR; SFK: src family kinases; TMAs: tissue microarrays; TMZ: temozolomide; WB: western blot.
Supplementary Material
Supplementary figures and table.
Acknowledgements
The authors extend their acknowledgments to the families who contributed to this study. Financial support was provided by grants from the FCT - Foundation for Science and Technology (PTDC/SAU-GMG/113795/2009 and IF/00601/2012 to B.M.C.; SFRH/BD/92786/2013 to C.S.G.; SFRH/BD/88121/2012 to J.V.C.; SFRH/BD/81042/2011 to M.P.; SFRH/BD/93443/2013 to S.Q.) and Fundação Calouste Gulbenkian (B.M.C.), by FEDER funds through the Operational Programme Competitiveness Factors - COMPETE and National Funds through FCT under the project POCI-01-0145-FEDER-007038; by the project NORTE-01-0145-FEDER-000013 and NORTE-01-0246-FEDER-000012, supported by Norte Portugal Regional Operational Programme (NORTE 2020), under the PORTUGAL 2020 Partnership Agreement, through the European Regional Development Fund (ERDF); and by the project NORTE-01-0145-FEDER-000023, supported by the Northern Portugal Regional Operational Programme (NORTE 2020), under the Portugal 2020 Partnership Agreement, through the European Regional Development Fund (FEDER).
Author contributions
CSG, NS and BMC designed research studies. CSG, JVC, MP, EPM, SQ, and EC conducted experiments. CSG, JVC, MP, EPM, SQ, EC, RT, CC (C. Clara), NS, and BMC analyzed data. RT, MMP, AAP, FP, CC (C. Custódia), CCF, and RMR provided patient samples. CSG and BMC wrote the manuscript. All authors reviewed and approved the manuscript.
Study approval
Written informed consent for investigation purposes was obtained from all patients. All procedures were in accordance with institutional ethics standards. Clinical samples in which patient information was collected were obtained from the Hospital Braga and Hospital Santa Maria, Portugal, and Hospital de Barretos, Brazil, with their respective ethical approvals (SECVS 150/2014 and CNPD 7435/2011). All animal procedures were conducted in accordance with the guidelines for the care and use of laboratory animals (European Directive 2010/63/EU) and approved by the Direcção Geral de Alimentação e Veterinária (DGAV, reference 017761), the competent national authority for animal protection.
Competing Interests
The authors have declared that no competing interest exists.
References
1. Louis DN. Molecular pathology of malignant gliomas. Annu Rev Pathol. 2006;1:97-117
2. Stupp R, Mason WP, van den Bent MJ, Weller M, Fisher B, Taphoorn MJ. et al. Radiotherapy plus concomitant and adjuvant temozolomide for glioblastoma. N Engl J Med. 2005;352:987-96
3. Buckner JC, Brown PD, O'Neill BP, Meyer FB, Wetmore CJ, Uhm JH. Central nervous system tumors. Mayo Clin Proc. 2007;82:1271-86
4. Louis DN, Perry A, Reifenberger G, von Deimling A, Figarella-Branger D, Cavenee WK. et al. The 2016 world health organization classification of tumors of the central nervous system: a summary. Acta Neuropathol. 2016;131:803-20
5. Kamino M, Kishida M, Kibe T, Ikoma K, Iijima M, Hirano H. et al. WNT-5a signaling is correlated with infiltrative activity in human glioma by inducing cellular migration and MMP-2. Cancer Sci. 2011;102:540-8
6. Kaur N, Chettiar S, Rathod S, Rath P, Muzumdar D, Shaikh ML. et al. WNT3a mediated activation of WNT/beta-catenin signaling promotes tumor progression in glioblastoma. Mol Cell Neurosci. 2013;54:44-57
7. Nager M, Bhardwaj D, Canti C, Medina L, Nogues P, Herreros J. Beta-catenin signalling in glioblastoma multiforme and glioma-initiating cells. Chemother Res Pract. 2012;2012:192362
8. Nusse R, Clevers H. WNT/beta-catenin signaling, disease, and emerging therapeutic modalities. Cell. 2017;169:985-99
9. Cheng L, Bao S, Rich JN. Potential therapeutic implications of cancer stem cells in glioblastoma. Biochem Pharmacol. 2010;80:654-65
10. Ohka F, Natsume A, Wakabayashi T. Current trends in targeted therapies for glioblastoma multiforme. Neurol Res Int. 2012;2012:878425
11. Kim Y, Kim KH, Lee J, Lee YA, Kim M, Lee SJ. et al. WNT activation is implicated in glioblastoma radioresistance. Laboratory investigation; a journal of technical methods and pathology. 2012;92:466-73
12. Takahashi-Yanaga F, Kahn M. Targeting WNT signaling: can we safely eradicate cancer stem cells? Clin Cancer Res. 2010;16:3153-62
13. Yuan G, Regel I, Lian F, Friedrich T, Hitkova I, Hofheinz RD. et al. WNT6 is a novel target gene of caveolin-1 promoting chemoresistance to epirubicin in human gastric cancer cells. Oncogene. 2013;32:375-87
14. Fan Y, Shen B, Tan M, Mu X, Qin Y, Zhang F. et al. Long non-coding RNA UCA1 increases chemoresistance of bladder cancer cells by regulating WNT signaling. FEBS J. 2014;281:1750-8
15. Zhang L, Yuan G, Fang Y, Qiu M, Lin J, Sun J. et al. Increased WNT6 expression in tumor cells predicts unfavorable survival in esophageal squamous cell carcinoma patients. Int J Clin Exp Pathol. 2015;8:11421-7
16. Galbraith RL, Poole EM, Duggan D, Muehling J, Hsu L, Makar K. et al. Polymorphisms in WNT6 and WNT10A and colorectal adenoma risk. Nutr Cancer. 2011;63:558-64
17. Kirikoshi H, Sekihara H, Katoh M. WNT10A and WNT6, clustered in human chromosome 2q35 region with head-to-tail manner, are strongly coexpressed in SW480 cells. Biochem Biophys Res Commun. 2001;283:798-805
18. Zheng H, Ying H, Wiedemeyer R, Yan H, Quayle SN, Ivanova EV. et al. PLAGL2 regulates WNT signaling to impede differentiation in neural stem cells and gliomas. Cancer Cell. 2010;17:497-509
19. TCGA. Comprehensive genomic characterization defines human glioblastoma genes and core pathways. Nature. 2008;455:1061-8
20. Murat A, Migliavacca E, Gorlia T, Lambiv WL, Shay T, Hamou MF. et al. Stem cell-related "self-renewal" signature and high epidermal growth factor receptor expression associated with resistance to concomitant chemoradiotherapy in glioblastoma. J Clin Oncol. 2008;26:3015-24
21. Liang Y, Diehn M, Watson N, Bollen AW, Aldape KD, Nicholas MK. et al. Gene expression profiling reveals molecularly and clinically distinct subtypes of glioblastoma multiforme. Proc Natl Acad Sci U S A. 2005;102:5814-9
22. Mischel PS, Shai R, Shi T, Horvath S, Lu KV, Choe G. et al. Identification of molecular subtypes of glioblastoma by gene expression profiling. Oncogene. 2003;22:2361-73
23. Shai R, Shi T, Kremen TJ, Horvath S, Liau LM, Cloughesy TF. et al. Gene expression profiling identifies molecular subtypes of gliomas. Oncogene. 2003;22:4918-23
24. Freije WA, Castro-Vargas FE, Fang Z, Horvath S, Cloughesy T, Liau LM. et al. Gene expression profiling of gliomas strongly predicts survival. Cancer Res. 2004;64:6503-10
25. Nutt CL, Mani DR, Betensky RA, Tamayo P, Cairncross JG, Ladd C. et al. Gene expression-based classification of malignant gliomas correlates better with survival than histological classification. Cancer Res. 2003;63:1602-7
26. Phillips HS, Kharbanda S, Chen R, Forrest WF, Soriano RH, Wu TD. et al. Molecular subclasses of high-grade glioma predict prognosis, delineate a pattern of disease progression, and resemble stages in neurogenesis. Cancer Cell. 2006;9:157-73
27. Tso CL, Freije WA, Day A, Chen Z, Merriman B, Perlina A. et al. Distinct transcription profiles of primary and secondary glioblastoma subgroups. Cancer Res. 2006;66:159-67
28. Verhaak RG, Hoadley KA, Purdom E, Wang V, Qi Y, Wilkerson MD. et al. Integrated genomic analysis identifies clinically relevant subtypes of glioblastoma characterized by abnormalities in PDGFRA, IDH1, EGFR, and NF1. Cancer Cell. 2010;17:98-110
29. Pollard SM, Yoshikawa K, Clarke ID, Danovi D, Stricker S, Russell R. et al. Glioma stem cell lines expanded in adherent culture have tumor-specific phenotypes and are suitable for chemical and genetic screens. Cell stem cell. 2009;4:568-80
30. Woolard K, Fine HA. Glioma stem cells: better flat than round. Cell stem cell. 2009;4:466-7
31. Mandal T, Bhowmik A, Chatterjee A, Chatterjee U, Chatterjee S, Ghosh MK. Reduced phosphorylation of STAT3 at Ser-727 mediated by casein kinase 2 - protein phosphatase 2A enhances STAT3 Tyr-705 induced tumorigenic potential of glioma cells. Cell Signal. 2014;26:1725-34
32. Gravendeel LA, Kouwenhoven MC, Gevaert O, de Rooi JJ, Stubbs AP, Duijm JE. et al. Intrinsic gene expression profiles of gliomas are a better predictor of survival than histology. Cancer Res. 2009;69:9065-72
33. Vital AL, Tabernero MD, Castrillo A, Rebelo O, Tao H, Gomes F. et al. Gene expression profiles of human glioblastomas are associated with both tumor cytogenetics and histopathology. Neuro Oncol. 2010;12:991-1003
34. Reya T, Clevers H. WNT signalling in stem cells and cancer. Nature. 2005;434:843-50
35. Voeller HJ, Truica CI, Gelmann EP. Beta-catenin mutations in human prostate cancer. Cancer Res. 1998;58:2520-3
36. Baeza N, Masuoka J, Kleihues P, Ohgaki H. AXIN1 mutations but not deletions in cerebellar medulloblastomas. Oncogene. 2003;22:632-6
37. Schmidt C, Stoeckelhuber M, McKinnell I, Putz R, Christ B, Patel K. WNT6 regulates the epithelialisation process of the segmental plate mesoderm leading to somite formation. Dev Biol. 2004;271:198-209
38. Schmidt C, McGonnell IM, Allen S, Otto A, Patel K. WNT6 controls amniote neural crest induction through the non-canonical signaling pathway. Dev Dyn. 2007;236:2502-11
39. Lavery DL, Martin J, Turnbull YD, Hoppler S. WNT6 signaling regulates heart muscle development during organogenesis. Dev Biol. 2008;323:177-88
40. Lavery DL, Davenport IR, Turnbull YD, Wheeler GN, Hoppler S. WNT6 expression in epidermis and epithelial tissues during xenopus organogenesis. Dev Dyn. 2008;237:768-79
41. Krawetz R, Kelly GM. WNT6 induces the specification and epithelialization of F9 embryonal carcinoma cells to primitive endoderm. Cell Signal. 2008;20:506-17
42. Croce J, Range R, Wu SY, Miranda E, Lhomond G, Peng JC. et al. WNT6 activates endoderm in the sea urchin gene regulatory network. Development. 2011;138:3297-306
43. Habu M, Koyama H, Kishida M, Kamino M, Iijima M, Fuchigami T. et al. Ryk is essential for WNT-5a-dependent invasiveness in human glioma. J Biochem. 2014;156:29-38
44. Yu JM, Jun ES, Jung JS, Suh SY, Han JY, Kim JY. et al. Role of WNT5a in the proliferation of human glioblastoma cells. Cancer Lett. 2007;257:172-81
45. Dijksterhuis JP, Arthofer E, Marinescu VD, Nelander S, Uhlen M, Ponten F. et al. High levels of WNT-5A in human glioma correlate with increased presence of tumor-associated microglia/monocytes. Exp Cell Res. 2015;339:280-8
46. Pu P, Zhang Z, Kang C, Jiang R, Jia Z, Wang G. et al. Downregulation of WNT2 and beta-catenin by siRNA suppresses malignant glioma cell growth. Cancer Gene Ther. 2009;16:351-61
47. Binda E, Visioli A, Giani F, Trivieri N, Palumbo O, Restelli S. et al. WNT5a drives an invasive phenotype in human glioblastoma stem-like cells. Cancer Res. 2017;77:996-1007
48. Lathia JD, Mack SC, Mulkearns-Hubert EE, Valentim CL, Rich JN. Cancer stem cells in glioblastoma. Genes Dev. 2015;29:1203-17
49. Lewis-Tuffin LJ, Feathers R, Hari P, Durand N, Li Z, Rodriguez FJ. et al. Src family kinases differentially influence glioma growth and motility. Mol Oncol. 2015;9:1783-98
50. Lu KV, Zhu S, Cvrljevic A, Huang TT, Sarkaria S, Ahkavan D. et al. Fyn and SRC are effectors of oncogenic epidermal growth factor receptor signaling in glioblastoma patients. Cancer Res. 2009;69:6889-98
51. Xavier-Magalhaes A, Nandhabalan M, Jones C, Costa BM. Molecular prognostic factors in glioblastoma: state of the art and future challenges. CNS oncology. 2013;2:495-510
52. Guttmann DM, Koumenis C. The heat shock proteins as targets for radiosensitization and chemosensitization in cancer. Cancer Biol Ther. 2011;12:1023-31
53. Voll EA, Ogden IM, Pavese JM, Huang X, Xu L, Jovanovic BD. et al. Heat shock protein 27 regulates human prostate cancer cell motility and metastatic progression. Oncotarget. 2014;5:2648-63
54. Qi Z, Shen L, Zhou H, Jiang Y, Lan L, Luo L. et al. Phosphorylation of heat shock protein 27 antagonizes TNF-alpha induced HeLa cell apoptosis via regulating TAK1 ubiquitination and activation of p38 and ERK signaling. Cell Signal. 2014;26:1616-25
55. Gonçalves CS, Lourenço T, Xavier-Magalhães A, Pojo M, Costa BM. Mechanisms of aggressiveness in glioblastoma: prognostic and potential therapeutic insights. Lichtor T, editor. Evolution of the Molecular Biology of Brain Tumors and the Therapeutic Implications: InTech. 2013
56. Guardavaccaro D, Clevers H. WNT/beta-catenin and MAPK signaling: allies and enemies in different battlefields. Sci Signal. 2012;5:pe15
57. Fragoso MA, Patel AK, Nakamura RE, Yi H, Surapaneni K, Hackam AS. The WNT/beta-catenin pathway cross-talks with STAT3 signaling to regulate survival of retinal pigment epithelium cells. PLoS One. 2012;7:e46892
58. Shi L, Fei X, Wang Z, You Y. PI3K inhibitor combined with miR-125b inhibitor sensitize TMZ-induced anti-glioma stem cancer effects through inactivation of WNT/beta-catenin signaling pathway. In Vitro Cell Dev Biol Anim. 2015;51:1047-55
59. Chen L, Huang K, Han L, Shi Z, Zhang K, Pu P. et al. Beta-catenin/TCF-4 complex transcriptionally regulates AKT1 in glioma. Int J Oncol. 2011;39:883-90
60. Inoki K, Ouyang H, Zhu T, Lindvall C, Wang Y, Zhang X. et al. TSC2 integrates WNT and energy signals via a coordinated phosphorylation by AMPK and GSK3 to regulate cell growth. Cell. 2006;126:955-68
61. Paul I, Bhattacharya S, Chatterjee A, Ghosh MK. Current understanding on EGFR and WNT/beta-catenin signaling in glioma and their possible crosstalk. Genes Cancer. 2013;4:427-46
62. Ji H, Wang J, Nika H, Hawke D, Keezer S, Ge Q. et al. EGF-induced ERK activation promotes CK2-mediated disassociation of alpha-catenin from beta-catenin and transactivation of beta-catenin. Mol Cell. 2009;36:547-59
63. Anne SL, Govek EE, Ayrault O, Kim JH, Zhu X, Murphy DA. et al. WNT3 inhibits cerebellar granule neuron progenitor proliferation and medulloblastoma formation via MAPK activation. PLoS One. 2013;8:e81769
64. Bowman RL, Wang Q, Carro A, Verhaak RG, Squatrito M. GlioVis data portal for visualization and analysis of brain tumor expression datasets. Neuro Oncol. 2017;19:139-41
65. Clara CA, Marie SK, de Almeida JR, Wakamatsu A, Oba-Shinjo SM, Uno M. et al. Angiogenesis and expression of PDGF-C, VEGF, CD105 and HIF-1alpha in human glioblastoma. Neuropathology. 2014;34:343-52
66. Louis DN, Ohgaki H, Wiestler OD, Cavenee WK, Burger PC, Jouvet A. et al. The 2007 WHO classification of tumours of the central nervous system. Acta Neuropathol. 2007;114:97-109
67. Najdi R, Proffitt K, Sprowl S, Kaur S, Yu J, Covey TM. et al. A uniform human WNT expression library reveals a shared secretory pathway and unique signaling activities. Differentiation. 2012;84:203-13
68. Hsiao EC, Nguyen TD, Ng JK, Scott MJ, Chang WC, Zahed H. et al. Constitutive Gs activation using a single-construct tetracycline-inducible expression system in embryonic stem cells and mice. Stem Cell Res Ther. 2011;2:11
69. Livak KJ, Schmittgen TD. Analysis of relative gene expression data using real-time quantitative PCR and the 2(-delta delta C(T)) method. Methods. 2001;25:402-8
70. Mosmann T. Rapid colorimetric assay for cellular growth and survival: application to proliferation and cytotoxicity assays. J Immunol Methods. 1983;65:55-63
71. Hu Y, Smyth GK. ELDA: extreme limiting dilution analysis for comparing depleted and enriched populations in stem cell and other assays. J Immunol Methods. 2009;347:70-8
72. Pojo M, Goncalves CS, Xavier-Magalhaes A, Oliveira AI, Goncalves T, Correia S. et al. A transcriptomic signature mediated by HOXA9 promotes human glioblastoma initiation, aggressiveness and resistance to temozolomide. Oncotarget. 2015;6:7657-74
73. Subramanian A, Tamayo P, Mootha VK, Mukherjee S, Ebert BL, Gillette MA. et al. Gene set enrichment analysis: a knowledge-based approach for interpreting genome-wide expression profiles. Proc Natl Acad Sci U S A. 2005;102:15545-50
Author contact
![]() Corresponding author: Bruno M. Costa, Life and Health Sciences Research Institute (ICVS), School of Medicine, University of Minho, Campus de Gualtar, 4710-057 Braga, Portugal. Email: bfmcostauminho.pt; Phone: (+351)253604837; Fax: (+351)253604831
Corresponding author: Bruno M. Costa, Life and Health Sciences Research Institute (ICVS), School of Medicine, University of Minho, Campus de Gualtar, 4710-057 Braga, Portugal. Email: bfmcostauminho.pt; Phone: (+351)253604837; Fax: (+351)253604831