Theranostics
13.3
Impact Factor
- Current Issue
- Advance Articles
- Volume 16; 2026
- Volume 15; 2025
- Volume 14; 2024
- Volume 13; 2023
- Volume 12; 2022
- Archive
- Cover Images
- Cover Suggestion
- Special Issues
Top
Introduction
Methods
Results
Discussion
Abbreviations
Supplementary Material
Acknowledgements
References
Introduction
Methods
Results
Discussion
Abbreviations
Supplementary Material
Acknowledgements
References
International Journal of Biological Sciences
International Journal of Medical Sciences
 Global reach, higher impact

Theranostics 2018; 8(16):4359-4371. doi:10.7150/thno.26900 This issue Cite
Research Paper
Inactivation of PBX3 and HOXA9 by down-regulating H3K79 methylation represses NPM1-mutated leukemic cell survival
Wu Zhang1#, Chen Zhao2#, Junmei Zhao1,4#, Yongmei Zhu1, Xiangqin Weng1, Qiusheng Chen1, Huiping Sun1, Jian-Qing Mi1, Junmin Li1, Jiang Zhu1, Zhu Chen1, Pier Paolo Pandolfi3, Saijuan Chen1 ![]() , Xiaojing Yan2
, Xiaojing Yan2 ![]() , Jie Xu1
, Jie Xu1 ![]()
1. State Key Laboratory for Medical Genomics, Shanghai Institute of Hematology, Rui-Jin Hospital affiliated to Shanghai Jiao-Tong University School of Medicine, Shanghai, China
2. Department of Hematology, the First Hospital of China Medical University, Shenyang, China
3. Division of Genetics, Department of Medicine, Beth Israel Deaconess Medical Center, Harvard Medical School, Boston, MA, USA
4. Department of Hematology, Renmin Hospital of Wuhan University, Wuhan, Hubei, China
# W.Z., C.Z. and J.M.Z. made equal contribution.
Received 2018-4-25; Accepted 2018-6-24; Published 2018-7-30
Citation:
Zhang W, Zhao C, Zhao J, Zhu Y, Weng X, Chen Q, Sun H, Mi JQ, Li J, Zhu J, Chen Z, Pandolfi PP, Chen S, Yan X, Xu J. Inactivation of PBX3 and HOXA9 by down-regulating H3K79 methylation represses NPM1-mutated leukemic cell survival. Theranostics 2018; 8(16):4359-4371. doi:10.7150/thno.26900. https://www.thno.org/v08p4359.htm
Other stylesAbstract

Acute myeloid leukemia (AML) with an NPM1 mutation (NPMc+) has a distinct gene expression signature and displays molecular abnormalities similar to mixed lineage leukemia (MLL), including aberrant expression of the PBX3 and HOXA gene cluster. However, it is unclear if the aberrant expression of PBX3 and HOXA is essential for the survival of NPM1-mutated leukemic cells.
Methods: Using the gene expression profiling of TCGA and E-MTAB-3444 datasets, we screened for high co-expression of PBX3 and HOXA9 in NPMc+ leukemia patients. We performed NPMc+ depletion and overexpression experiments to examine aberrant H3K79 methylation through epigenetic regulation. Through RNA interference technology and small-molecule inhibitor treatment, we evaluated the effect of methyl-modified H3K79 on cell survival and explored the possible underlying mechanism.
Results: We showed that NPMc+ increased the expression of PBX3 and HOXA9, which are both poor prognosis indicators in AML. High PBX3 and HOXA9 expression was accompanied by increased dimethylated and trimethylated H3K79 in transgenic murine Lin-Sca-1+c-Kit+ cells and human NPMc+ leukemia cells. Using chromatin immunoprecipitation sequencing (ChIP-seq) assays of NPMc+ cells, we determined that hypermethylated H3K79 was present at the expressed HOXA9 gene but not the PBX3 gene. PBX3 expression was positively regulated by HOXA9, and a reduction in either PBX3 or HOXA9 resulted in NPMc+ cell apoptosis. Importantly, an inhibitor of DOT1L, EPZ5676, effectively and selectively promoted NPMc+ human leukemic cell apoptosis by reducing HOXA9 and PBX3 expression.
Conclusion: Our data indicate that NPMc+ leukemic cell survival requires upregulation of PBX3 and HOXA9, and this action can be largely attenuated by a DOT1L inhibitor.
Keywords: NPM1 mutation, H3K79 hypermethylation, PBX3, HOXA9, DOT1L inhibitor
Introduction
Mutation of NPM1 (NPMc+) is one of the most common genetic lesions in adult acute myeloid leukemia (AML) patients and is found in approximately 30% of AML cases, while approximately 40-60% of AML cases carry the normal karyotype [1]. NPMc+ is a relatively favorable prognostic factor in young patients but is an indicator of poor survival in patients older than 65 [2]. Much evidence points to NPMc+ as an early initiating event in AML and indicates that it is often accompanied by disease progression [3-5]. Minimal residual detection (MRD) of NPMc+ copies of >1% by RT-PCR indicates a poorer outcome in AML cases treated with chemotherapy [6]. More recently, NPMc+ was considered a high-risk factor associated with an increase in secondary AML progression in myelodysplastic syndrome (MDS) [7] and high NPM1 mutant allele burden at diagnosis predicted for poor clinical outcome [8].
Wild-type (WT) NPM1 is an important chaperone in the nucleus and is involved in maintenance of chromatin remodeling and genomic stability [9, 10]. NPMc+ induces a reading-frame shift that results in loss of the nucleolar localization signal and gain of an additional nuclear export signal, which leads to cytoplasmic dislocation [11]. In leukemogenesis, NPMc+ is mutually exclusive with certain recurrent genetic abnormalities. Remarkably, although the NPM1 variation and MLL rearrangement present a mutually exclusive pattern, a cluster of HOXA genes, which are downstream regulators of MLL fusion oncoproteins, are aberrantly expressed in NPMc+ AML specimens and mouse models [12-14]. As a transcriptional regulator for downstream targets, HOXA proteins requires interaction with the members of the three-amino acid loop extension (TALE) family proteins, such as PBX3 and MEIS1 [15]. In particular, PBX3 serves a critical role in the development of MLL-rearranged AML. The cooperation of HOXA9 with PBX3 is needed for cell transformation and leukemogenesis [16, 17]. However, whether HOXA and PBX3 are essential for NPMc+ leukemic cell survival is unknown.
To the best of our knowledge, the activation of MLL rearrangement-driven HOXA is dependent on aberrant H3K79 methylation [18]. In addition, a recent study noted that simultaneous inhibition of MLL1 and DOT1L exhibits activity against NPMc+-driven AML [19], which suggests that histone modifications influence NPMc+ leukemia. Whether epigenetic dysregulation is pivotal to NPMc+ cell survival and what role it plays in NPM1-mutated leukemia is not well defined.
In this study, NPMc+ induced high expression of PBX3 and HOXA9, as well as hypermethylation of H3K79 loci. Aberrant H3K79 methylation was present at the expressed HOXA9 gene; HOXA9 expression is a positive regulator of PBX3. We also showed that a small molecule inhibitor of the H3K79 methyltransferase DOT1L, specifically EPZ5676, selectively and significantly promoted apoptosis in both NPMc+ leukemia cell lines and primary blasts from AML patients with a high expression level of PBX3 and HOXA9.
Methods
Cell lines and chemicals
Leukemic cell lines (OCI-AML3, OCI-AML2, K562, NB4, HL-60, THP-1, U937 and KG-1) were cultured in RPMI-1640 medium (Invitrogen, Grand Island, USA) supplemented with 10% FBS (Invitrogen, Grand Island, USA), and 293T cells were grown in DMEM (Invitrogen, Grand Island, USA) supplemented with 10% FBS. MEF cells were cultured in DMEM/F12 (Invitrogen, Grand Island, USA) supplemented with 20% FBS. All cell lines were obtained from the Shanghai Institute of Hematology. EPZ004777 and EPZ5676 were purchased from Selleck Chemicals (Houston, TX, USA).
Patient samples
Primary AML samples were obtained from the bone marrow of diagnosed AML patients. Leukemic blasts were purified and harvested in the mononuclear layer via density gradient centrifugation. Human primary AML samples were obtained in accordance with the ethical guidelines established by the Shanghai Institute of Hematology.
Mice
A transgenic NPMc+ mouse model was kindly provided by Prof. Pandolfi from Beth Israel Deaconess Medical Center [20]. hMRP8-NPMc+ transgenic mice carried heterozygous NPMc+ oncoproteins and the ageing NPMc+ mice could present the phenotypes of intra- and extramedullary myeloproliferation [20]. NOD/SCID mice were purchased from Shanghai SLAC Laboratory Animal Co., Ltd. All mice used in this study were housed in the research center of experimental medicine at Rui-Jin Hospital. OCI-AML3 control or drug-treated cells were injected into sub-lethally irradiated eight-week-old NOD/SCID mice through tail veins as previously described [21]. All animal experiments were conducted in accordance with the approved guidelines provided by the Laboratory Animal Resource Center of Shanghai Jiao-Tong University School of Medicine.
Antibodies
The following primary antibodies were used in western blotting assays: NPM1 mutant (NB110-61646, Novus, Littleton, USA), NPM1 WT (Thermo scientific, Rockford, USA), NPM1 (Sigma-Aldrich, St. Louis, USA), PBX3 (Abcam, Cambridge, USA), HOXA9 (Abcam, Cambridge, USA), Cleaved caspase 3, Cleaved PARP (Cell Signaling, Danvers, USA), Flag, H3K4me2, H3K9me2, H3K27me2, H3K36me2, H3K79me1, H3K79me2, H3K79me3, H3, DOT1L (Cell Signaling, Danvers, USA), and β-Actin (Sigma, St. Louis, MO, USA).
All antibodies and the following kits applied in flow cytometry analyses were purchased from BD Biosciences (BD Pharmingen™, New Jersey, USA): CD45.1, CD45.2, Mac-1, Gr-1, Sca-1, c-Kit, Mouse Lineage Panel, AnnexinV Apoptosis Detection kit, and BrdU Flow kit.
Immunofluorescence staining was performed with Flag (Cell Signaling, Danvers, USA), H3K79me2 (Cell Signaling, Danvers, USA and PMT-bio, Hangzhou, China), PBX3 (Santa Cruz, California, USA), HOXA9 (Abcam, Cambridge, USA) and NPM1 antibodies as following: NPM1 mutant (Novus, Littleton, USA), NPM1 WT (Thermo scientific, Rockford, USA), NPM1 (Cell Signaling, Danvers, USA).
RNA interference
The sequences of siRNA oligomers and shRNA primers for the PBX3 (AACGAATCAGGTACAAGAA) and HOXA9 (CCTCGTGGAACCCAGTGCA) were designed, and for the NPM1 (GAAGCAGAGGCAATGAATTACGA) were obtained from previous study [22]. To generate cells stably expressing NPM1-shRNA, PBX3-shRNA, HOXA9-shRNA and the negative control-shRNA, the expression cassettes were transduced into leukemic cells with lentiviral vectors. siRNA oligonucleotides against NPM1 were transfected using Lipofectamine 2000 (Invitrogen, Grand Island, USA). Leukemic cell lines that expressed NPM1 shRNA, PBX3 shRNA, and HOXA9 shRNA or control sequence were sorted by FACS for GFP positive (GFP+) cells.
Lentivirus transduction
To generate the cells stably expressing NPM1-WT, NPMc+ and the vector control, the expression cassettes were cloned into the lenti-Easy expression vectors using standard molecular cloning. The lentiviral particles were generated in HEK293T cells, which were transfected by VSVG/Gag-Pol lentiviral packaging system. Supernatant containing viruses was collected 48-72 h after transfection. Cell lines were infected with the lentiviral supernatant adding polybrene 1:1000. After 16 h, cells were cultured in Puromycin at a concentration of 1 μg/mL for 5 days or selected by cell sorting.
Western blotting, flow cytometry and immunofluorescence
Cells were washed twice in ice-cold PBS and lysed in whole-cell lysis buffer containing 10% SDS. SDS-PAGE gels were prepared based on the protein size. Electrophoresis and transmembrane electrophoresis were conducted on a protein electrophoresis and blotting system (Bio-Rad, Hercules, CA, USA). Membranes were sequentially probed with the primary antibodies. The signals were generated using an Immobilon Western kit (Millipore, Billerica, USA) and visualized using a chemiluminescence detection system (LAS-4000, FUJIFILM).
Cells were suspended in FACS buffer (PBS containing 1% FBS, with or without 0.1% Na3N) and subsequently stained with fluorochrome-conjugated antibodies. All antibodies and the following kits and stains were purchased from BD Biosciences (BD Pharmingen™, New Jersey, USA): CD45.1, CD45.2, Mac-1, Gr-1, Sca-1, c-Kit, Mouse Lineage Panel, AnnexinV Apoptosis Detection kit, and BrdU Flow kit. Flow cytometric data were collected using an LSRII flow cytometer (Becton Dickinson, Franklin Lakes, NJ, USA) or a MoFlo flow sorter (Beckman Coulter, Fullerton, CA, USA), and they were analyzed with either FlowJo software (TreeStar, Ashland, OR, USA) or Summit software (Beckman Coulter).
Immunofluorescence staining was performed on either the cytospins of single-cell suspensions or adherent cultures of 293T cells. Cells were fixed in 4% PFA and then permeabilized in 0.2% Triton X-100. The fixed cells were incubated with Flag, H3K79me2 and NPM1 primary antibodies or isotype control antibodies containing 5% normal donkey serum overnight. The slides of mounting cells were subsequently incubated with the Alexa Fluor 488 or Cy3-conjugated secondary antibodies (Jackson ImmunoResearch) at room temperature. Optical sections of the cells were observed under a Leica TCS SP8 confocal microscope (Leica Microsystems, Wetzlar, Germany).
CRISPR/Cas9-mediated gene targeting
Leukemic cells were transduced with lentivirus containing Cas9 and 1 μg/mL puromycin as a selection reagent. The remaining cells were produced by infection with sgRNA lentivirus and followed by GFP+ sorting. Then, the stable GFP+ NPM1-edited cells were expanded from single cell-derived clones. The entire DNA of leukemic cells was split to PCR reactions. PCR products were used to amplify the region and sequenced to determine the frame-shift mutations or hetero/homozygosity. Three sgRNA sequences that specifically targeted the sequence of NPM1 were prepared (sg1: ATTTACAGGTTGTGAACTAA, sg2: ACAAGAATCCTTCAAGAAAC, sg3: GGAACCTTGCTACCACCTCC), of which, sg1 conferred the strongest and largest reduction in NPM1 expression and was therefore chosen for use in further experiments.
Gene expression profiling
Total RNA was extracted from the sorted murine LSK cells using Trizol (Invitrogen). Gene expression profiling was conducted by Shanghai Biotechnology Corporation using Affymetrix mouse 430 2.0 arrays (Affymetrix, Santa Clara, CA). All data were analyzed according to the manufacturer's protocol. Raw data generated from Affymetrix CEL files were normalized by RMA background correction, and the values were log2 transformed. For the enrichment of P values of each GO term, we used Fisher's exact test to calculate P values and R package stats to calculate FDR (q value) by BH method (www.r-project.org).
Chromatin immunoprecipitation sequencing
Cells with NPM1 WT or NPMc+ were grown in complete media. The media was then removed and the cells were cross-linked with 1% formaldehyde for 10 min. The reaction was neutralized with 0.125 M glycine and the fixed cells were washed twice with ice cold PBS and suspended in SDS lysis buffer for 30 min on ice. The lysate was sonicated, diluted with ChIP buffer and immunoprecipitated using anti-di-methyl-histone H3 (Lys 79) (CST 5427). Then, the ChIP-DNA complex was extracted by ethanol precipitation after it was reverse cross-linked. The ChIP-DNA fragments were used directly for qPCR with gene promoter-specific primers and the data were normalized to input DNA. Furthermore, the ChIP-DNA fragments were amplified and ligated to specific adaptors by deep sequencing of Illumina HiSeq 2500 machine (Illumina, San Diego, USA). ChIP-seq data was aligned to the human genome (hg19) or the mouse genome (mm9) and the reads were filtered for duplicates. Visualization of the mapped reads and peak calling was performed by converting the raw bam files to bigwig files using IGV software.
Bioluminescence imaging (BLI) in vivo
Human AML cells carrying a luciferase reporter were transplanted into NOD/SCID mice as previously described [21]. The luciferase substrate was injected into living animals before imaging. The mice were subjected to BLI according to the manufacturers' protocols (Xenogen IVIS Spectrum, PerkinElmer).
Statistical analyses
Data are presented as the arithmetic mean ± SEM. A Kaplan-Meier survival analysis, Student's t-test or χ2 test was used to calculate the P values where appropriate. A P<0.05 was considered significant.
Results
NPMc+ induced high expression of PBX3 and HOXA9
RNA sequencing information for a cohort of AML samples obtained from the TCGA database showed that high transcriptional levels of PBX3 or HOXA9 were associated with a poor prognosis in AML (p=0.0176 and p=0.0131, respectively), but other HOXA family genes (HOXA3, HOXA5, and HOXA7) and MEIS1 did not have a significant correlation with overall outcome (Figure 1A-B and Figure S1A-D). In the subset of AML samples with high PBX3 transcription, more than half of the samples carried NPMc+, and all the samples with NPMc+ had high PBX3 expression (Figure S1E). Similarly, high HOXA9 expression was also common in cases with NPMc+ (Figure S1F). Analysis of the TCGA data set and the E-MTAB-3444 database on the cBioPortal [23, 24] showed that PBX3 and HOXA9 were highly co-expressed in samples with NPMc+ compared with their levels in the NPM1 WT group (Figure 1C and Figure S1G-I). This result suggests that PBX3 and HOXA9, indicators of poor prognosis, might play important roles in the progression of NPMc+ leukemia.
In our collected specimens, compared with the NPM1 WT group, the NPMc+ group had higher levels of PBX3 and HOXA9 proteins (Figure 1D). In a series of AML cell lines (K562, NB4, U937, HL60, OCI-AML2 and OCI-AML3 cells), the PBX3 and HOXA9 co-expression level was highest in OCI-AML3 cells, the only cell line with NPMc+ (Figure 1E). Furthermore, Flag-tagged plasmids carrying WT or mutated NPM1 were transfected into KG-1 cells, which are chromosome 5 monosomic and have relatively low expression of NPM1 (Figure S1J). The forced expression of NPMc+, but not WT NPM1 in KG-1 cells, caused PBX3 and HOXA9 expression to dramatically increase (Figure 1F-G). These observations were confirmed in 293T cells (Figure S1K-L). Through CRISPR-Cas9-mediated genome editing, NPM1 was deleted in OCI-AML2 and OCI-AML3 cells, and the PBX3 or HOXA9 protein level significantly decreased in OCI-AML3 but not OCI-AML2 cells (Figure 1H). These data indicate that NPMc+ can induce high expression of PBX3 and HOXA9.
NPMc+ induced H3K79 hypermethylation
We used hMRP8-NPMc+ transgenic mice to find the possible regulators affecting PBX3 and/or HOXA9 expression in NPM1-mutated hematopoietic cells. Western blotting showed that NPM1 was highly expressed in Lin-Sca-1+c-Kit+ cells (LSKs) in both NPMc+ and WT mice but exhibited much lower expression in the total bone marrow (BM), Lin+ and Lin- cell populations (Figure S2A). We assumed that NPMc+ exerts its function mainly in hematopoietic stem/progenitor cells (HSPCs). To confirm this hypothesis, LSKs obtained from either CD45.2 NPMc+ or CD45.2 WT mice were transplanted into lethally irradiated CD45.1 WT mice. The data showed that the percentage of BM myeloid cells (Mac-1+/Gr-1+) in NPMc+ mice was obviously higher than that in the WT mice (Figure S2B). In addition, a greater degree of splenomegaly was observed in NPMc+ mice relative to the controls (Figure S2C). Both of these data showed a myeloid proliferation phenotype in NPMc+ mice. These findings also indicated that LSKs were more appropriate cells for further study.
Figure 1
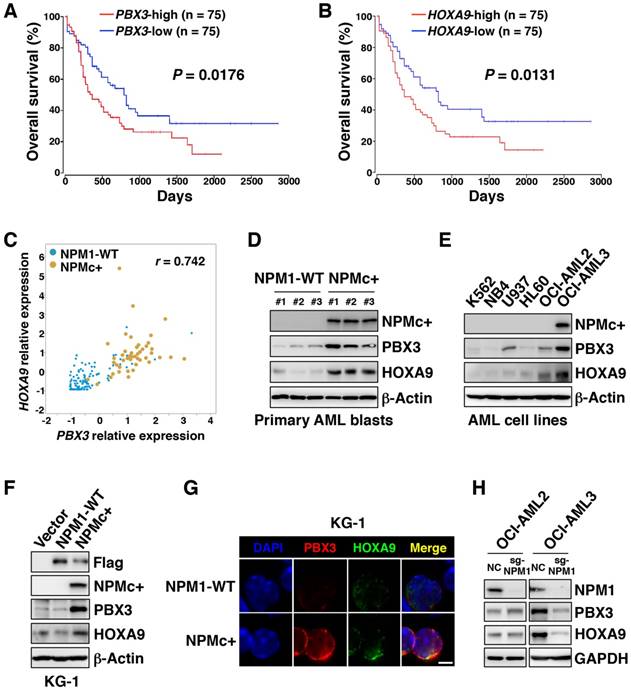
NPMc+ induces high expression of PBX3 and HOXA9. (A) A Kaplan-Meier analysis of the overall survival rates of AML patients with high (n=75) or low (n=75) PBX3 mRNA expression. The definitions of high and low were based on the median transcriptional level of the PBX3 gene in the TCGA database. The RNA-sequencing data was from 150 AML patients whose survival information was included in this dataset. (B) The overall survival analysis of AML patients with high (n=75) or low (n=75) HOXA9 mRNA expression. The definitions of high and low were based on the median transcriptional level of the HOXA9 gene in the TCGA database. (C) A Pearson correlation analysis of the relative PBX3 and HOXA9 mRNA expression in TCGA AML patients with either WT NPM1 or NPMc+. (D) Western blot data showing NPMc+, PBX3 and HOXA9 protein levels in BM cells from patients diagnosed with primary AML. (E) NPMc+, PBX3 and HOXA9 expression in a series of AML cell lines. The measurement of protein level was from three independent western blotting replicates. (F) KG-1 cells stably transfected with a Flag-tagged vector, WT NPM1 or NPMc+. Western blot data show Flag-tagged NPM1, NPMc+, PBX3 and HOXA9 expression in these transfected cells. Three independent western blotting replicates were performed. (G) Immunofluorescence staining of PBX3 and HOXA9 in KG-1 cells transfected with lentivirus carrying WT NPM1 or NPMc+. The scale bar represents 5 μm. Images are representative of three independent experiments each from at least six random fields. (H) NPM1, PBX3 and HOXA9 protein expression in OCI-AML2 and OCI-AML3 cells with or without NPM1 depletion via CRISPR-Cas9-mediated genome editing. Three independent western blotting replicates were performed.
Therefore, BM LSKs from 12-week-old NPMc+ mice and age-matched controls were collected for a gene expression assay. A gene ontology analysis of the mRNA profile found that a chromatin modification gene cluster showed significantly higher expression in the NPMc+ group (Figure S2D). Since histone methylation is an important form of chromatin modification, we measured the methylation levels at histone 3 lysine (H3K) loci. Our results showed that the expression levels of methylated H3K4, H3K9, H3K27 and H3K36 in NPMc+ LSKs were not remarkably different from those in WT LSKs (Figure 2A). However, the H3K79 methylation levels, especially those of dimethylated and trimethylated H3K79 (H3K79me2/3), were obviously higher in NPMc+ LSKs than in the control cells (Figure 2A). We also detected the methylation level of H3K loci in murine BM cells in which NPM1 was expressed at low levels. As expected, differences in the methylation level of all the above sites, including H3K79, were not observed between the NPMc+ and WT groups (Figure S2E), which suggested that H3K79 hypermethylation might be associated with NPMc+ in murine LSKs.
Figure 2
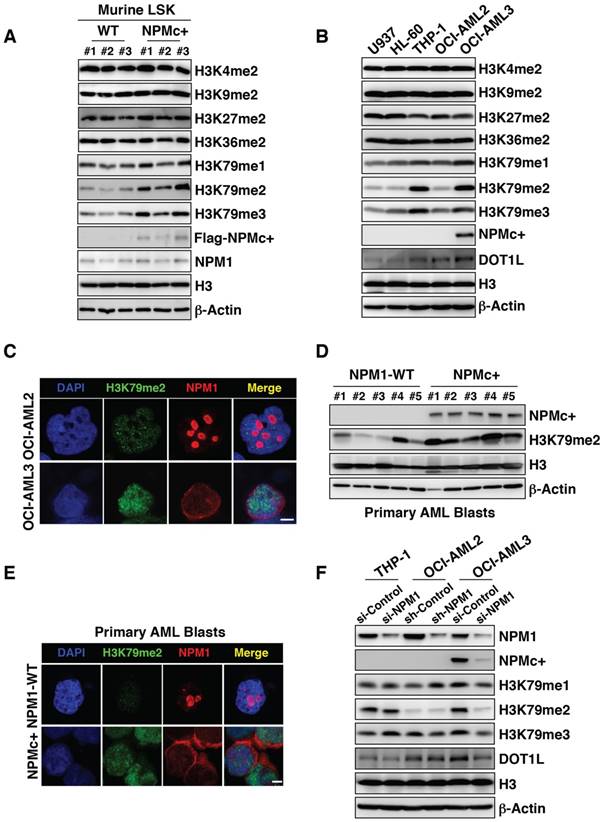
NPMc+ induces H3K79 hypermethylation. (A) Murine BM LSKs were sorted from NPM1 WT mice or NPMc+ mice (hMRP8-NPMc+ transgenic mice, C57BL/6J background). Methylated H3K4, H3K9, H3K27, H3K36 and H3K79 expression levels, Flag-tagged NPM1 mutant and NPM1 in murine BM LSKs as detected by western blot. (B) Western blot detection of methylated lysine loci on histone 3 (H3K4, H3K9, H3K27, H3K36, and H3K79), DOT1L, and NPMc+ in human leukemic cells. Three independent western blotting replicates were performed. (C) Immunofluorescence staining of dimethylated H3K79 and NPM1 in OCI-AML2 cells (harboring WT NPM1) or dimethylated H3K79 and NPMc+ in OCI-AML3 cells (bearing mutated NPM1). The scale bar represents 5 μm. Images are representative of three independent experiments each from at least six random fields. (D) The expression levels of dimethylated H3K79, NPMc+ and H3 in BM leukemia blasts from patients diagnosed with primary AML. (E) Immunofluorescence analysis of dimethylated H3K79 and NPM1 in primary BM cells carrying WT NPM1 or dimethylated H3K79 and NPMc+ in AML specimens with mutated NPM1. The scale bar represents 5 μm. Images are representative of 5 NPM1-WT and 5 NPMc+ AML patient samples, respectively. (F) Western blot detection of NPM1, NPMc+, methylated H3K79 and DOT1L expression in THP-1, OCI-AML2 and OCI-AML3 cells with or without NPM1 knocked down. The measurement of protein level was from three independent western blotting replicates.
Among a series of human leukemia cell lines, namely, U937, HL-60, THP-1, OCI-AML2 and OCI-AML3 cells, the H3K79 methylation levels in the OCI-AML3 cell line, particularly H3K79me2/3, were similar to those in THP-1 cells but were much higher than those in the other cells lines. THP-1 carries the MLL-AF9 fusion protein, which has been recognized as an inducer of H3K79 hypermethylation in leukemia cells [25]. The methylation levels at other H3K loci were not obviously different among the cell lines (Figure 2B). Accordingly, DOT1L levels were increased in OCI-AML3 cells (Figure 2B). However, the transcription level of DOT1L did not change (Figure S2F). An immunofluorescence assay showed that with the NPM1 mutant abnormally positioned, H3K79me2 was highly expressed in OCI-AML3 cells compared with its level in OCI-AML2 cells (Figure 2C). As OCI-AML3 cells harbored NPM1 and DNMT3A mutation concurrently, we compared the methylation capacity of the mutant NPM1 and DNMT3A with a hotspot mutation in 293T cells and found that mutant NPM1 had a much greater ability to methylate H3K79 (Figure S2G). In addition, primary AML BM blasts with NPMc+ generally displayed higher H3K79me2 levels than samples from the WT group (Figure 2D-E). To further investigate, NPM1 transcription was knocked down in leukemia cell lines using RNA interference technology. A decrease in the protein level of NPM1 resulted in decreased expression of methylated H3K79 in OCI-AML3 cells but not in THP-1 and OCI-AML2 cells (Figure 2F). In an overexpression assay, KG-1 cells with NPMc+ had higher levels of H3K79me2 relative to those with the vector or WT NPM1 (Figure S2H-I). These data suggest that NPMc+ can induce H3K79 hypermethylation.
H3K79 hypermethylation was present at expressed HOXA9 but not PBX3
Methyl-modifications at H3K79 loci positively regulate target gene expression [26]. To determine whether PBX3 and/or HOXA9 were epigenetically regulated by H3K79 hypermethylation in NPMc+ cells, we used chromatin immunoprecipitation sequencing (ChIP-seq). To obtain enough pure mutant cells, we collected murine embryonic fibroblasts (MEFs) from hMRP8-NPMc+ transgenic mice. Western blotting and immunofluorescence assays showed that the protein levels of PBX3, HOXA9 and H3K79me2 in NPMc+ MEFs were higher than those in the WT controls (Figure 3A and Figure S3A-C). These results demonstrated that the MEFs had a PBX3, HOXA9 and methyl-modified H3K79 expression pattern similar to that of the hematopoietic cells from the hMRP8-NPMc+ transgenic mice. ChIP-seq using an anti-H3K79me2 antibody in NPMc+ and WT MEFs showed that there was more H3K79me2 at the Hoxa9 locus in NPM1c+ vs. WT MEFs, but not at the Pbx3 gene and other Hoxa cluster genes (Figure 3B and Figure S3D-F). We further performed ChIP-seq for H3K79me2 in OCI-AML2 and OCI-AML3 cells to confirm these data. Compared with OCI-AML2 cells, the H3K79me2 level at the HOXA9 gene locus was higher, and the H3K79me2 level at the PBX3 gene locus was lower in OCI-AML3 cells (Figure 3C-D and Figure S3E-F). Thus, in the cells with NPMc+, the high expression of HOXA9 was regulated by H3K79 hypermethylation while PBX3 expression was not directly related to H3K79 methylation.
PBX3 was positively regulated by HOXA9 and both were important for NPMc+ cell survival
Since PBX3 is a cofactor for members of the HOXA protein family, whether PBX3 expression is affected by HOXA9 in NPMc+ cells needed to be determined. We knocked down HOXA9 expression by stably transducing OCI-AML3 cells with two kinds of shRNA (sh-HOXA9-1 and sh-HOXA9-2). The results showed that as HOXA9 expression decreased, PBX3 expression significantly decreased (Figure 4A). The PBX3 mRNA transcription level was not significantly changed after HOXA9 knockdown (data not shown). The phenomenon was observed only in OCI-AML3 cells with NPMc+ but not in OCI-AML2 cells with WT NPM1 (Figure 4B). The results were confirmed by immunofluorescence (Figure S4A). However, in both the OCI-AML3 and OCI-AML2 cells, HOXA9 knockdown did not affect the level of H3K79m2 (Figure 4B). In addition, PBX3 knockdown (sh-PBX3-1 and sh-PBX3-2) did not change HOXA9 expression (Figure S4B). We further performed a rescue assay, in which HOXA9 was stably overexpressed in OCI-AML3 cells after PBX3 was knocked down. The overexpression of HOXA9 caused a remarkable increase in PBX3 expression (Figure 4C).
It is worth noting that the down-regulation of HOXA9 or PBX3 induced the expression of cleaved caspase 3 and PARP expression in OCI-AML3 cells but not in OCI-AML2 cells (Figure 4B, D). Flow cytometry showed an increased number of apoptotic cells (Annexin V+) in the OCI-AML3 cells with HOXA9 or PBX3 knockdown (Figure 4E-F). A previous study reported that NOD/SCID mice developed leukemia after intravenous transplantation of OCI-AML3 cells [21]. Thus, OCI-AML3 cells were transduced with a luciferase reporter lentivirus vector, and then, HOXA9 mRNA was stably knocked down. One month after transplant into semi-lethally irradiated NOD/SCID mice, the tumorigenic capacity of NPMc+ leukemia cells with low HOXA9 and PBX3 expression was remarkably reduced (Figure 4G). Moreover, in the rescue assay, on the precondition of PBX3 knockdown, the forced expression of HOXA9 led to decreased cleaved caspase 3 and PARP levels and fewer apoptotic cells (Annexin V+) (Figure 4C, H).
Figure 3
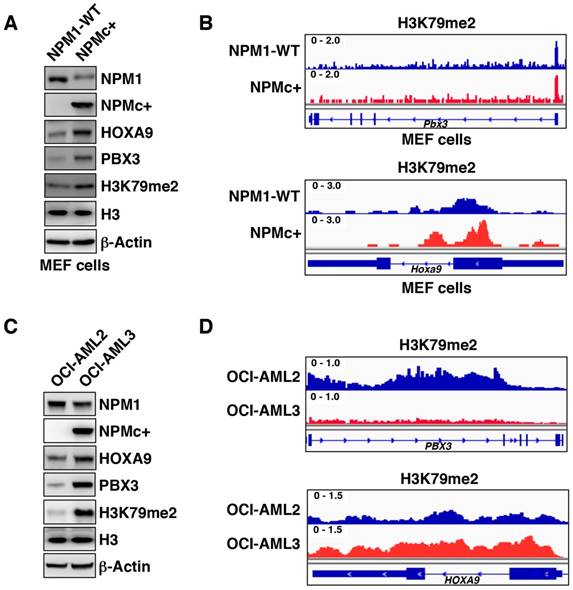
H3K79 hypermethylation is present at expressed HOXA9 but not PBX3. (A) Western blot data showing NPM1, NPMc+, PBX3, HOXA9 and dimethylated H3K79 expression in MEF cells obtained from NPM1 WT or NPMc+ mice (hMRP8-NPMc+ transgenic mice, C57BL/6J background). The measurement of protein level was from three independent western blotting replicates. (B) A screen shot of the ChIP-seq profile of H3K79me2 at the PBX3 and HOXA9 gene loci in WT and NPMc+ MEF cells. (C) NPM1, NPMc+, PBX3, HOXA9 and dimethylated H3K79 expression in OCI-AML2 and OCI-AML3 cells detected by western blot. Three independent western blotting replicates were performed. (D) ChIP-seq results for H3K79me2 modifications at the PBX3 and HOXA9 gene loci in OCI-AML2 and OCI-AML3 cells.
These data demonstrated that PBX3 expression is positively regulated by HOXA9 in the presence of NPMc+, and a decrease in either PBX3 or HOXA9 expression induces NPMc+ leukemia cell apoptosis.
EPZ5676 decreased PBX3 and HOXA9 expression and induced apoptosis in NPMc+ primary AML cells
Since there was more H3K79me2 at the HOXA9 locus in NPMc+ leukemic cells, we tested whether reduced H3K79 methylation would disturb the biological activity of NPMc+ leukemia cells. EPZ5676, a DOT1L inhibitor approved for use in clinical trials, is less toxic and more effective than EPZ004777 [27]. Here, we found that EPZ5676 was more efficient than EPZ004777 in down-regulating HOXA9, PBX3 and H3K79m2 expression in human NPMc+ cells (Figure S5A), and in promoting cell apoptosis (Figure S5B). EPZ5676 gradually reduced HOXA9 and PBX3 expression in OCI-AML3 cells as the treatment time increased. The levels of cleaved caspase 3 and PARP were also increased by EPZ5676 treatment in a time-dependent manner (Figure 5A). These changes were not observed in OCI-AML2 cells (Figure 5A). The two cell lines were treated with EPZ5676 for 3 days or 7 days and then were stained with Annexin V/PI for apoptosis detection. EPZ5676 induced a higher percentage of apoptotic cells in the OCI-AML3 line than in the OCI-AML2 line on both day 3 and day 7 (Figure 5B). Additionally, a decrease in HOXA9 and PBX3 expression and an increase in the expression of apoptosis-related proteins and the number of apoptotic cells were detected only in KG-1 cells stably transduced with mutant NPM1 but not in those transduced with the vector or WT NPM1 after 7 days of treatment with EPZ5676 (Figure 5C-D).
Figure 4
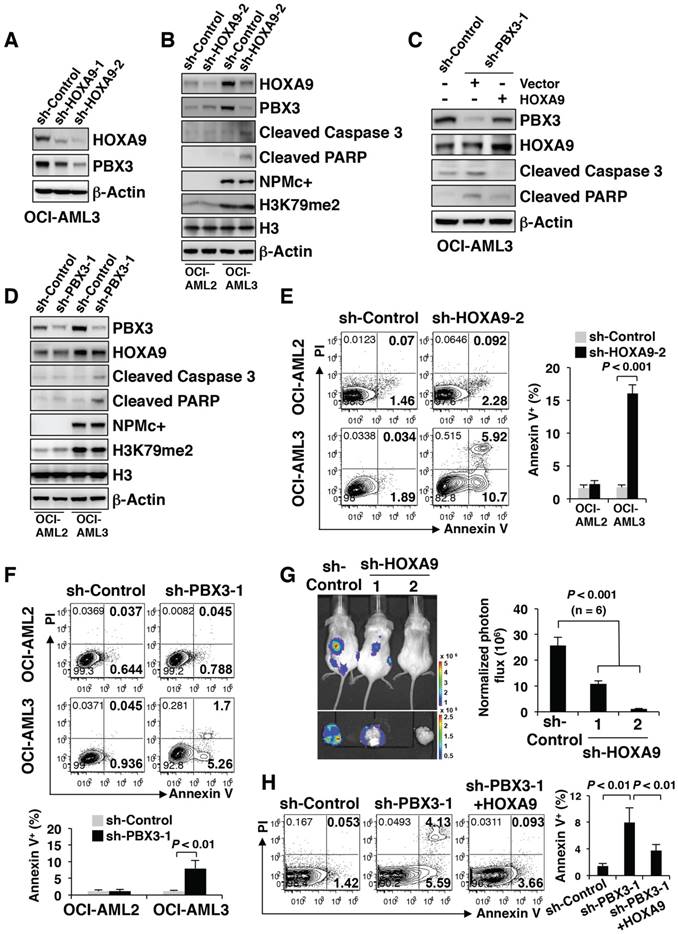
PBX3 is positively regulated by HOXA9 and both were important for NPMc+ cell survival. (A) Western blot of HOXA9 and PBX3 in OCI-AML3 cells stably transduced with scramble shRNA (sh-Control) or shRNAs targeting HOXA9 mRNA (sh-HOXA9-1 and sh-HOXA9-2). The measurement of protein level was from three independent western blotting replicates. (B) Lentiviruses carrying sh-Control or sh-HOXA9-2 were used to transduce OCI-AML2 and OCI-AML3 cells. Western blot shows the protein levels of HOXA9, PBX3, cleaved caspase 3, cleaved PARP, NPMc+ and H3K79me2 in the transduced cells. Three independent western blotting replicates were performed. (C) OCI-AML3 cells were stably transduced with sh-Control or shRNA targeting PBX3 mRNA (sh-PBX3-1), followed by lentivirus transduced with carrying vector or HOXA9. In these constructed cells, the expression levels of HOXA9, PBX3, cleaved caspase 3 and cleaved PARP were detected by western blot. Three independent western blotting replicates were performed. (D) sh-Control or sh-PBX3-1 was used to transduce OCI-AML2 and OCI-AML3 cells by lentiviruses. Western blot presenting the protein levels of PBX3, HOXA9, cleaved caspase 3, cleaved PARP, NPMc+ and H3K79me2 in the stably transduced cells. The measurement of protein level was from three independent western blotting replicates. (E) Scatter plots present the apoptotic cells (Annexin V+) in OCI-AML2 and OCI-AML3 strains with or without HOXA9 mRNA knockdown. Column diagram showing the percentage of Annexin V+ cells in transduced OCI-AML2 and OCI-AML3 strains. The values are presented as the mean ± SEM (n=6 per group). (F) Representative FACS plots of the number of apoptotic cells (Annexin V+) in OCI-AML2 and OCI-AML3 cells with or without PBX3 mRNA knockdown. Column graphs show the mean ± SEM of 6 independent experiments for each group. (G) A representative bioluminescence image of mice transplanted with OCI-AML3 cells stably expressing sh-Control, sh-HOXA9-1 or sh-HOXA9-2. Quantitative luciferase bioluminescence was monitored at day 30 post-xenografting. The values are presented as the mean ± SEM (n=6 per group). (H) Representative flow cytometry plots displaying the number of apoptotic cells (Annexin V+) in OCI-AML3 cells stably transduced with HOXA9 after knockdown of PBX3 mRNA. A column diagram shows the percentage of Annexin V+ cells in the transduced cells. The values are presented as the mean ± SEM (n=6 per group).
Figure 5
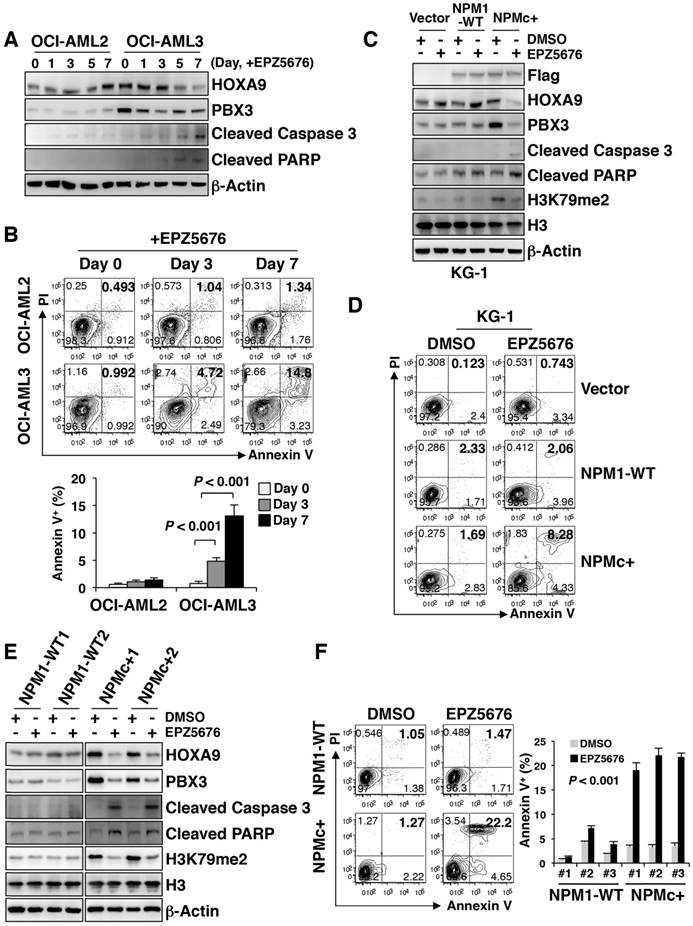
EPZ5676 decreased PBX3 and HOXA9 expression and induced apoptosis in NPMc+ primary AML cells. (A) HOXA9, PBX3, cleaved caspase 3 and cleaved PARP expression levels in OCI-AML2 and OCI-AML3 cells treated with EPZ5676 (10 µM) and harvested on the indicated day. Three independent western blotting replicates were performed. (B) After a 3-day or 7-day incubation with EPZ5676 (10 µM), the OCI-AML2 and OCI-AML3 cells were stained with Annexin V/PI and detected by flow cytometry. The column diagram represents the percentage of apoptotic cells (Annexin V+) in the drug-treated cell lines. The data are expressed as the mean ± SEM (n=6 per group). (C) Flag-tagged NPM1, HOXA9, PBX3, cleaved caspase 3, cleaved PARP and dimethylated H3K79 protein expression in transfected KG-1 cells after treatment with DMSO or EPZ5676 (10 µM) for 7 days. Vector, WT or NPMc+ are the KG-1 cells stably transfected with the Flag-tagged vector, WT NPM1 or mutated NPM1, respectively. The measurement of protein level was from three independent western blotting replicates. (D) Representative FACS plots of the apoptotic cells (Annexin V+) in KG-1 cells transfected with the Flag-tagged vector, WT NPM1 or mutant NPM1, and treated with DMSO or EPZ5676 (10 µM) for 7 days. Three independent flow cytometric assays were performed for each group. (E) HOXA9, PBX3, cleaved caspase 3, cleaved PARP and dimethylated H3K79 expression in primary AML blasts treated with DMSO or EPZ5676 (10 µM) for 48 h in vitro. WT samples carry WT NPM1; NPMc+ specimens carry mutated NPM1. Three independent western blotting replicates were performed. (F) Representative scatter plots of apoptotic cells (Annexin V+) in AML blasts treated with DMSO or EPZ5676 (10 µM) for 48 h. WT or NPMc+ represent the samples carrying WT or mutated NPM1, respectively. The column diagram presents the percentages of Annexin V+ cells in drug-treated AML blasts. Three independent assays were performed for each group. The data are expressed as the mean ± SEM.
EPZ5676 was subsequently used to treat BM blasts from AML patients with WT NPM1 or NPMc+ for 48 h in vitro. HOXA9, PBX3 and H3K79me2 levels decreased in NPMc+ cells but did not remarkably change in the WT NPM1 cells (Figure 5E). An immunofluorescence assay confirmed the decrease in HOXA9, PBX3 and H3K79me2 expression after NPMc+ cells were treated with EPZ5676 (Figure S5C-D). Increased levels of cleaved caspase 3 and PARP were observed in the NPMc+ group after the application of EPZ5676 treatment (Figure 5E), and an apoptosis assay showed a greater increase in the number of apoptotic cells (Annexin V+) in NPMc+ AML blasts than in the NPM1 WT group after 48 h of EPZ5676 treatment (Figure 5F). Thus, EPZ5676 was effective in decreasing HOXA9 and PBX3 expression, eventually leading to cell apoptosis in NPMc+ human primary leukemic cells.
Discussion
In this study, we found that H3K79 dimethylation, induced by NPMc+, upregulated HOXA9 expression, which enhanced the expression of PBX3 and supported survival of leukemic cells. A DOT1L inhibitor, EPZ5676, decreased HOXA9 and PBX3 expression, by demethylating H3K79 and thereby promoting NPMc+ cell apoptosis (Figure 6).
Figure 6
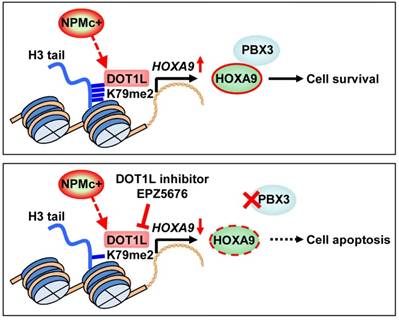
An illustration of PBX3 and HOXA9 inactivation by a DOT1L inhibitor in NPMc+ leukemic cells. NPMc+ induces H3K79 dimethylation, which causes upregulation of its target gene, HOXA9. HOXA9 cooperates with PBX3 to support leukemic cell survival (upper panel). Our findings strongly suggest that a DOT1L inhibitor, EPZ5676, can reduce the H3K79 methylation level, leading to down-regulation of HOXA9 transcription. PBX3 expression decreases as HOXA9 expression decreases. With low PBX3 and HOXA9 expression, NPMc+ cells enter apoptosis (bottom panel).
Dimethylation is recruited to the targeted genes of MLL fusions [28]. Through modification of H3K79 methylation, key target genes, such as the HOXA family, are activated, leading to leukemogenesis [29]. Similar to the expression signature of leukemia cells with MLL abnormalities, NPMc+ blasts also harbor high transcriptional levels of the HOXA genes [12, 30], which implies a similar pathogenic mechanism in both NPM1-mutated and MLL-rearranged leukemia. Here, dimethylation is the common outcome of NPMc+ and MLL fusion, whereas in AML, NPM1 variations and MLL fusions present mutually exclusive patterns. The phenomenon not only illustrates that NPM1-mutated leukemia might have a similarity with the MLL-rearranged subtype in leukemic pathogenesis but also demonstrates that epigenetic modification is a significant mediator of malignant transformation.
The elevated H3K79 methylation may be caused by an increase in just the protein levels of DOT1L in NPMc+ cells because the transcription levels of DOT1L were not significantly different between the cells with mutant NPM1 and those with WT NPM1. Thus, a specific mechanism is likely to be responsible for the translational upregulation of DOT1L in the mutant cells. Moreover, Park G et al. revealed that DOT1L interacts with and depends on NPM1 to act as a histone chaperone [31]. Thus, whether NPM1 mutants are capable of enhancing DOT1L modifications requires further study.
In human AML, NPMc+ is considered to be an early event involving HSPCs. Haploinsufficiency or mutagenesis of the Npm1 gene in mice leads to hematologic dysregulation characterized by increased definitive progenitors, proliferative myeloid lineages and dysplastic megakaryocytes [32, 33]. Notably, heterozygous Npm1 mutant mice develop hematologic malignancies after a two-year observation period [34]. These reproducible aging-related phenotypes mimic human MDS and its tendency to lead to leukemia. In our study, the expression of NPM1 was extraordinarily high in both WT and mutant murine LSKs and decreased with the differentiation of the hematopoietic cells. Murine LSKs in transgenic mice were driven by NPMc+ to develop myeloproliferative disease. This evidence explains the significance of the NPM1 gene in maintaining the cellular homeostasis of HSPCs and the underlying mechanisms of NPM1-driven hematological disorders.
NPM1 variations often co-occur with mutations in other genes, primarily in DNMT3A, and are found in 50% of the cases with NPMc+ [35]. Hypermethylation has been detected in a DNMT3A knockout or mutated mouse model and in human cells [36]. So it is a question that whether NPMc+ dominates H3K79 methyl-modification in the cells with the concurrence of NPM1 and DNMT3A mutations. In our analysis, mutant NPM1 had a much stronger H3K79 di-methylation capacity than DNMT3A mutation. Meanwhile, both transgenic mice and primary human specimens in this study did not carry DNMT3A mutation or MLL translocations. This indicated that NPMc+ itself is enough to methylate H3K79. However, regardless of the ability to alter histone methylation, hypermethylated H3K79 represents an ideal target for therapy in patients presenting the NPM1 and DNMT3A variations concurrently.
Overexpression of PBX3 and HOXA9 indicates a poor outcome in AML. PBX3 and HOXA9 are required for disease development in some types of cytogenetically abnormal AMLs, which usually have an unfavorable prognosis [37, 38]. Interestingly, a recent study reported that high NPM1 mutant allele burden at diagnosis predicted poor clinical outcome [8]. In fact, almost all of NPMc+ AMLs associated with an unfavorable outcome harbor high co-expression of PBX3 and HOXA9. We also find that in the TCGA database, NPMc+ is always present concurrently with other genetic lesions, such as FLT3 mutation, DNMT3A variation, and activating RAS mutation. Patients who carry these partner abnormalities are often categorized into a poor prognosis group. Notably, a high expression level of PBX3 and HOXA9 is a common characteristic in NPMc+ cases and co-occurring, no matter the partner mutation. This observation is confirmed in our collected specimens and implies that PBX3 and HOXA9 play a critical role in NPMc+ AML initiation and progression.
PBX3 and HOXA9 exhibit a synergistic effect in hematopoietic cell transformation. An in vitro assay demonstrated that PBX3 interacts with HOXA9 in human cell lines, and PBX3/HOXA9 contacts in the complex contribute to the stability of PBX3/HOXA9 assembly [39]. In AML with MLL rearrangements, PBX3 is a critical co-factor of HOXA9 [16]. However, there was no evidence of this relationship in NPMc+ AML until now. Our study shows that PBX3 is regulated by HOXA9 in NPMc+ AML: specifically, as HOXA9 is upregulated or downregulated, PBX3 expression is increased or reduced. Although the expression of HOXA9 is not restricted by PBX3, loss of either PBX3 or HOXA9 causes cell apoptosis, indicating that PBX3 and HOXA9 are critical for the survival of NPM1-mutated cells.
Based on the mechanism discussed in this study, many approaches can be tested for their ability to kill NPMc+ cells. The Armstrong research group found that the combination of a menin-MLL1 inhibitor and a DOT1L inhibitor has anti-leukemic activity in NPM1-mutated AML [19]. Our data showed that a DOT1L inhibitor alone can suppress NPMc+ leukemia. ATRA has an inhibitory effect on NPMc+ leukemia cells because it is able to degrade mutant NPM1 [40, 41]. However, in clinical applications, the efficacy of ATRA in patients with NPMc+ is controversial [42, 43]. Thus, whether DOT1L inhibitors and ATRA could have a synergistic effect in killing NPM1-mutated cells is worth evaluating. Moreover, HRX9, a small peptide that disrupts the interaction between PBX3 and HOXA9 [16], and the miR-181 family, a class of small noncoding RNAs that target PBX3 and HOXA9 mRNA [44], are effective in suppressing the development of MLL-rearranged leukemia and could be studied in NPMc+ cells. The clinical effectiveness of these targeted strategies to combat NPM1-mutated leukemia deserves further evaluation and study.
Abbreviations
AML: acute myeloid leukemia; BM: bone marrow; ChIP-seq: chromatin immunoprecipitation sequencing; H3K: histone 3 lysine; HSPCs: hematopoietic stem/progenitor cells; MDS: myelodysplastic syndrome; MEFs: murine embryonic fibroblasts; MLL: mixed lineage leukemia; MRD: minimal residual detection; NPMc+: NPM1 mutation; WT: wild type.
Supplementary Material
Supplementary figures.
Acknowledgements
This work was supported by the Shanghai Rising-Star Program (17QA1402200), National Natural Science Foundation of China (81400106), Shanghai Young Doctor Training Program, National Youth Top-notch Talent of Ten Thousand Talent Program, and Program for New Century Excellent Talents in University (NCET-13-1037).
Competing Interests
The authors have declared that no competing interest exists.
References
1. Falini B, Mecucci C, Tiacci E. et al. Cytoplasmic nucleophosmin in acute myelogenous leukemia with a normal karyotype. N Engl J Med. 2005;352:254-66
2. Ostronoff F, Othus M, Lazenby M. et al. Prognostic significance of NPM1 mutations in the absence of FLT3-internal tandem duplication in older patients with acute myeloid leukemia: a SWOG and UK National Cancer Research Institute/Medical Research Council report. J Clin Oncol. 2015;33:1157-64
3. Martelli MP, Pettirossi V, Thiede C. et al. CD34+ cells from AML with mutated NPM1 harbor cytoplasmic mutated nucleophosmin and generate leukemia in immunocompromised mice. Blood. 2010;116:3907-22
4. Welch JS, Ley TJ, Link DC. et al. The origin and evolution of mutations in acute myeloid leukemia. Cell. 2012;150:264-78
5. Kronke J, Bullinger L, Teleanu V. et al. Clonal evolution in relapsed NPM1-mutated acute myeloid leukemia. Blood. 2013;122:100-8
6. Shayegi N, Kramer M, Bornhauser M. et al. The level of residual disease based on mutant NPM1 is an independent prognostic factor for relapse and survival in AML. Blood. 2013;122:83-92
7. Makishima H, Yoshizato T, Yoshida K. et al. Dynamics of clonal evolution in myelodysplastic syndromes. Nat Genet. 2017;49:204-12
8. Patel SS, Kuo FC, Gibson CJ. et al. High NPM1 mutant allele burden at diagnosis predicts unfavorable outcomes in de novo AML. Blood. 2018 [Epub ahead of print]
9. Lindstrom MS. NPM1/B23: A Multifunctional Chaperone in Ribosome Biogenesis and Chromatin Remodeling. Biochem Res Int. 2011;2011:195209
10. Koike A, Nishikawa H, Wu W. et al. Recruitment of phosphorylated NPM1 to sites of DNA damage through RNF8-dependent ubiquitin conjugates. Cancer Res. 2010;70:6746-56
11. Falini B, Bolli N, Shan J. et al. Both carboxy-terminus NES motif and mutated tryptophan(s) are crucial for aberrant nuclear export of nucleophosmin leukemic mutants in NPMc+ AML. Blood. 2006;107:4514-23
12. Alcalay M, Tiacci E, Bergomas R. et al. Acute myeloid leukemia bearing cytoplasmic nucleophosmin (NPMc+ AML) shows a distinct gene expression profile characterized by up-regulation of genes involved in stem-cell maintenance. Blood. 2005;106:899-902
13. Verhaak RG, Goudswaard CS, van Putten W. et al. Mutations in nucleophosmin (NPM1) in acute myeloid leukemia (AML): association with other gene abnormalities and previously established gene expression signatures and their favorable prognostic significance. Blood. 2005;106:3747-54
14. Wilson CS, Davidson GS, Martin SB. et al. Gene expression profiling of adult acute myeloid leukemia identifies novel biologic clusters for risk classification and outcome prediction. Blood. 2006;108:685-96
15. Shah N, Sukumar S. The Hox genes and their roles in oncogenesis. Nat Rev Cancer. 2010;10:361-71
16. Li Z, Zhang Z, Li Y. et al. PBX3 is an important cofactor of HOXA9 in leukemogenesis. Blood. 2013;121:1422-31
17. Guo H, Chu Y, Wang L. et al. PBX3 is essential for leukemia stem cell maintenance in MLL-rearranged leukemia. Int J Cancer. 2017;141:324-35
18. Deshpande AJ, Deshpande A, Sinha AU. et al. AF10 regulates progressive H3K79 methylation and HOX gene expression in diverse AML subtypes. Cancer Cell. 2014;26:896-908
19. Kuhn MW, Song E, Feng Z. et al. Targeting Chromatin Regulators Inhibits Leukemogenic Gene Expression in NPM1 Mutant Leukemia. Cancer Discov. 2016;6:1166-81
20. Cheng K, Sportoletti P, Ito K. et al. The cytoplasmic NPM mutant induces myeloproliferation in a transgenic mouse model. Blood. 2010;115:3341-5
21. Xu J, Zhang W, Yan XJ. et al. DNMT3A mutation leads to leukemic extramedullary infiltration mediated by TWIST1. J Hematol Oncol. 2016;9:106
22. Balusu R, Fiskus W, Rao R. et al. Targeting levels or oligomerization of nucleophosmin 1 induces differentiation and loss of survival of human AML cells with mutant NPM1. Blood. 2011;118:3096-106
23. Cerami E, Gao J, Dogrusoz U. et al. The cBio cancer genomics portal: an open platform for exploring multidimensional cancer genomics data. Cancer Discov. 2012;2:401-4
24. Gao J, Aksoy BA, Dogrusoz U. et al. Integrative analysis of complex cancer genomics and clinical profiles using the cBioPortal. Sci Signal. 2013;6:pl1
25. Daigle SR, Olhava EJ, Therkelsen CA. et al. Selective killing of mixed lineage leukemia cells by a potent small-molecule DOT1L inhibitor. Cancer Cell. 2011;20:53-65
26. Martin C, Zhang Y. The diverse functions of histone lysine methylation. Nat Rev Mol Cell Biol. 2005;6:838-49
27. Daigle SR, Olhava EJ, Therkelsen CA. et al. Potent inhibition of DOT1L as treatment of MLL-fusion leukemia. Blood. 2013;122:1017-25
28. Bernt KM, Zhu N, Sinha AU. et al. MLL-rearranged leukemia is dependent on aberrant H3K79 methylation by DOT1L. Cancer Cell. 2011;20:66-78
29. Nguyen AT, Taranova O, He J. et al. DOT1L, the H3K79 methyltransferase, is required for MLL-AF9-mediated leukemogenesis. Blood. 2011;117:6912-22
30. Collins CT, Hess JL. Deregulation of the HOXA9/MEIS1 axis in acute leukemia. Curr Opin Hematol. 2016;23:354-61
31. Park G, Gong Z, Chen J. et al. Characterization of the DOT1L network: implications of diverse roles for DOT1L. Protein J. 2010;29:213-23
32. Grisendi S, Bernardi R, Rossi M. et al. Role of nucleophosmin in embryonic development and tumorigenesis. Nature. 2005;437:147-53
33. Sportoletti P, Varasano E, Rossi R. et al. The human NPM1 mutation A perturbs megakaryopoiesis in a conditional mouse model. Blood. 2013;121:3447-58
34. Sportoletti P, Grisendi S, Majid SM. et al. Npm1 is a haploinsufficient suppressor of myeloid and lymphoid malignancies in the mouse. Blood. 2008;111:3859-62
35. Cancer Genome Atlas Research N. Genomic and epigenomic landscapes of adult de novo acute myeloid leukemia. N Engl J Med. 2013;368:2059-74
36. Rau RE, Rodriguez BA, Luo M. et al. DOT1L as a therapeutic target for the treatment of DNMT3A-mutant acute myeloid leukemia. Blood. 2016;128:971-81
37. So CW, Lin M, Ayton PM. et al. Dimerization contributes to oncogenic activation of MLL chimeras in acute leukemias. Cancer Cell. 2003;4:99-110
38. Faber J, Krivtsov AV, Stubbs MC. et al. HOXA9 is required for survival in human MLL-rearranged acute leukemias. Blood. 2009;113:2375-85
39. Garcia-Cuellar MP, Steger J, Fuller E. et al. Pbx3 and Meis1 cooperate through multiple mechanisms to support Hox-induced murine leukemia. Haematologica. 2015;100:905-13
40. Martelli MP, Gionfriddo I, Mezzasoma F. et al. Arsenic trioxide and all-trans retinoic acid target NPM1 mutant oncoprotein levels and induce apoptosis in NPM1-mutated AML cells. Blood. 2015;125:3455-65
41. El Hajj H, Dassouki Z, Berthier C. et al. Retinoic acid and arsenic trioxide trigger degradation of mutated NPM1, resulting in apoptosis of AML cells. Blood. 2015;125:3447-54
42. Nazha A, Bueso-Ramos C, Estey E. et al. The Addition of All-Trans Retinoic Acid to Chemotherapy May Not Improve the Outcome of Patient with NPM1 Mutated Acute Myeloid Leukemia. Front Oncol. 2013;3:218
43. Forghieri F, Bigliardi S, Quadrelli C. et al. All-trans retinoic acid (ATRA) in non-promyelocytic acute myeloid leukemia (AML): results of combination of ATRA with low-dose Ara-C in three elderly patients with NPM1-mutated AML unfit for intensive chemotherapy and review of the literature. Clin Case Rep. 2016;4:1138-46
44. Li Z, Huang H, Li Y. et al. Up-regulation of a HOXA-PBX3 homeobox-gene signature following down-regulation of miR-181 is associated with adverse prognosis in patients with cytogenetically abnormal AML. Blood. 2012;119:2314-24
Author contact
![]() Corresponding authors: Jie Xu, Shanghai Institute of Hematology, Rui-Jin Hospital, No.197 Ruijin Er Road, Huangpu District, Shanghai, China, 200025; e-mail: nbxujie1011com; Xiaojing Yan, Department of Hematology, the First Hospital of China Medical University, No.155 Nanjing Road, Heping District, Shenyang, China, 110001; e-mail: yanxiaojing_ppcom; and Saijuan Chen, Shanghai Institute of Hematology, Rui-Jin Hospital, No.197 Ruijin Er Road, Huangpu District, Shanghai, China, 200025; e-mail: sjchensh.cn.
Corresponding authors: Jie Xu, Shanghai Institute of Hematology, Rui-Jin Hospital, No.197 Ruijin Er Road, Huangpu District, Shanghai, China, 200025; e-mail: nbxujie1011com; Xiaojing Yan, Department of Hematology, the First Hospital of China Medical University, No.155 Nanjing Road, Heping District, Shenyang, China, 110001; e-mail: yanxiaojing_ppcom; and Saijuan Chen, Shanghai Institute of Hematology, Rui-Jin Hospital, No.197 Ruijin Er Road, Huangpu District, Shanghai, China, 200025; e-mail: sjchensh.cn.
Citation styles
APA
Zhang, W., Zhao, C., Zhao, J., Zhu, Y., Weng, X., Chen, Q., Sun, H., Mi, J.Q., Li, J., Zhu, J., Chen, Z., Pandolfi, P.P., Chen, S., Yan, X., Xu, J. (2018). Inactivation of PBX3 and HOXA9 by down-regulating H3K79 methylation represses NPM1-mutated leukemic cell survival. Theranostics, 8(16), 4359-4371. https://doi.org/10.7150/thno.26900.
ACS
Zhang, W.; Zhao, C.; Zhao, J.; Zhu, Y.; Weng, X.; Chen, Q.; Sun, H.; Mi, J.Q.; Li, J.; Zhu, J.; Chen, Z.; Pandolfi, P.P.; Chen, S.; Yan, X.; Xu, J. Inactivation of PBX3 and HOXA9 by down-regulating H3K79 methylation represses NPM1-mutated leukemic cell survival. Theranostics 2018, 8 (16), 4359-4371. DOI: 10.7150/thno.26900.
NLM
Zhang W, Zhao C, Zhao J, Zhu Y, Weng X, Chen Q, Sun H, Mi JQ, Li J, Zhu J, Chen Z, Pandolfi PP, Chen S, Yan X, Xu J. Inactivation of PBX3 and HOXA9 by down-regulating H3K79 methylation represses NPM1-mutated leukemic cell survival. Theranostics 2018; 8(16):4359-4371. doi:10.7150/thno.26900. https://www.thno.org/v08p4359.htm
CSE
Zhang W, Zhao C, Zhao J, Zhu Y, Weng X, Chen Q, Sun H, Mi JQ, Li J, Zhu J, Chen Z, Pandolfi PP, Chen S, Yan X, Xu J. 2018. Inactivation of PBX3 and HOXA9 by down-regulating H3K79 methylation represses NPM1-mutated leukemic cell survival. Theranostics. 8(16):4359-4371.
This is an open access article distributed under the terms of the Creative Commons Attribution (CC BY-NC) license (https://creativecommons.org/licenses/by-nc/4.0/). See http://ivyspring.com/terms for full terms and conditions.