Theranostics
13.3
Impact Factor
- Issue 9; 2026
- Issue 8; 2026
- Issue 7; 2026
- Issue 6; 2026
- Issue 5; 2026
- Volume 16; 2026
- Advance Articles
- Past Issues
- Cover Images
- Cover Suggestion
- Special Issues
Top
Introduction
Materials and Methods
Results
Discussion
Abbreviations
Supplementary Material
Acknowledgements
References
Introduction
Materials and Methods
Results
Discussion
Abbreviations
Supplementary Material
Acknowledgements
References
International Journal of Biological Sciences
International Journal of Medical Sciences
 Global reach, higher impact

Theranostics 2018; 8(7):1956-1965. doi:10.7150/thno.23767 This issue Cite
Research Paper
Integrative analysis of imaging and transcriptomic data of the immune landscape associated with tumor metabolism in lung adenocarcinoma: Clinical and prognostic implications
Hongyoon Choi1,2* ![]() , Kwon Joong Na3,4*
, Kwon Joong Na3,4* ![]()
1. Department of Nuclear Medicine, Seoul National University Hospital, Seoul, Republic of Korea.
2. Cheonan Public Health Center, Chungnam, Republic of Korea.
3. Department of Community Health, Korea Health Promotion Institute, Seoul, Republic of Korea.
4. Department of Clinical Medical Sciences, Seoul National University, College of Medicine, Seoul, Republic of Korea.
*These authors contributed equally to this work
Received 2017-11-9; Accepted 2018-1-11; Published 2018-2-15
Citation:
Choi H, Na KJ. Integrative analysis of imaging and transcriptomic data of the immune landscape associated with tumor metabolism in lung adenocarcinoma: Clinical and prognostic implications. Theranostics 2018; 8(7):1956-1965. doi:10.7150/thno.23767. https://www.thno.org/v08p1956.htm
Other stylesAbstract

Although metabolic modulation in the tumor microenvironment (TME) is one of the key mechanisms of cancer immune escape, there is a lack of understanding of the comprehensive immune landscape of the TME and its association with tumor metabolism based on clinical evidence. We aimed to investigate the relationship between the immune landscape in the TME and tumor glucose metabolism in lung adenocarcinoma.
Methods: Using RNA sequencing and image data, we developed a transcriptome-based tumor metabolism estimation model. The comprehensive TME cell types enrichment scores and overall immune cell enrichment (ImmuneScore) were estimated. Subjects were clustered by cellular heterogeneity in the TME and the clusters were characterized by tumor glucose metabolism and immune cell composition. Moreover, the prognostic value of ImmuneScore, tumor metabolism and the cell type-based clusters was also evaluated.
Results: Four clusters were identified based on the cellular heterogeneity in the TME. They showed distinct immune cell composition, different tumor metabolism, and close relationship with overall survival. A cluster with high regulatory T cells showed relative hypermetabolism and poor prognosis. Another cluster with high mast cells and CD4+ central memory T cells showed relative hypometabolism and favorable prognosis. A cluster with high ImmuneScore showed favorable prognosis. Multivariate Cox analysis demonstrated that ImmuneScore was a predictive prognostic factor independent of other clinical features.
Conclusions: Our results showed the association between predicted tumor metabolism and immune cell composition in the TME. Our studies also suggest that tumor glucose metabolism and immune cell infiltration in the TME can be clinically applicable for developing a prognostic stratification model.
Keywords: tumor microenvironment, cancer immunoediting, tumor metabolism, next generation sequencing, lung adenocarcinoma
Introduction
Cancer cells generate an immunosuppressive tumor microenvironment (TME), which suppresses T cell infiltration and activation through recruitment of the immunosuppressive cellular populations as well as T cell anergy, exhaustion, and senescence [1, 2]. Accumulation of regulatory T cells (Treg) and myeloid-derived suppressor cells in the TME is well-demonstrated in immunosuppressive populations, which eventually impacts patients' prognosis [3, 4]. Tumor-associated macrophages also interfere with induction of anti-tumor responses by changing their subpopulation [5]. Recent studies suggest that one of the key factors leading to these immunosuppressive TMEs is abnormal metabolic milieu caused by cancer cells. Aerobic glycolysis of cancer cells restricts glucose consumption by T cells, which dampens their functions as glucose is essential for the differentiation and effector function of T cells [6-8]. Lactic acid derived by aerobic glycolysis of cancer cells changes the normal immune reactions by polarizing tumor-associated macrophages [9]. In spite of the recent cell-level evidence that cancer cell metabolism affects immune cells, how the metabolic milieu systematically impacts heterogeneous immune cells of the TME has not been fully understood. So far, no comprehensive analysis dealing with the association of the immune landscape of the TME, tumor metabolism and the clinical course has been conducted based on clinical data.
To this end, we conducted studies with clinical data of lung adenocarcinoma (LUAD) from The Cancer Genome Atlas (TCGA) projects [10], hypothesizing that the immune landscape of the TME is closely associated with tumor metabolism and also affects patients' prognosis. Using transcriptome data, we estimated the immune cell composition of the TME and built a model for predicting tumor metabolism. The model was based on gene networks related to glucose uptake measured by 18F-Fluorodeoxyglucose (FDG) positron emission tomography (PET) data [11-13]. We clustered subjects according to the cellular components of their TME and characterized each cluster in terms of tumor metabolism, prognosis, and the immune cell composition. Moreover, the prognostic predictive value of overall immune cell enrichment score and tumor metabolism was investigated. Here, we present the association of the immune landscape of the TME and tumor metabolism, which can be a clue for cancer immunoediting mechanisms as well as a clinically feasible prognostic biomarker.
Materials and Methods
Study design
This study was an observational study using transcriptome and FDG PET image data. We developed a model for estimating the tumor metabolism index (TMI) of all LUAD samples (n = 490; Table S1) of TCGA projects, and the comprehensive immune landscape was evaluated by calculating immune cell enrichment scores. The subjects were divided into four distinct clusters based on cell composition of the TME, and the characteristics of each cluster, including the differences in TMI and each immune cell type enrichment, were investigated. The prognostic value of the immune landscape, TME-based clusters and tumor metabolism was also evaluated.
Coexpression gene networks correlated with tumor metabolism
The preprocessing of both transcriptome and FDG PET data is described in Supplementary Material. To generate the model for estimating tumor metabolism, a microarray dataset with a matched image dataset (GSE28827, n = 20) [13, 14] was combined with a large microarray dataset composed of 226 LUAD samples (GSE31210) [15, 16] as the training set. We used Weighted Gene Coexpression Network Analysis package (WGCNA) [17] to identify gene network modules from the training set. We created a correlation matrix on the basis of the Pearson's correlation coefficient for all pair-wise genes across all samples. The power—the key parameter for the weighted network—was selected to optimize both scale-free topology and sufficient node connectivity and we chose a threshold of 6 in this study. The correlation matrix was transformed into an adjacency matrix (matrix of connection strength) using the power function, and pair-wise topological overlap between genes was calculated. We identified network modules using a hierarchical clustering method with topological overlap dissimilarity as the distance measure [17]. The modules were detected by the dynamic tree cut algorithm in WGCNA package, defining a height cutoff value of 0.99, deep split as 2, and minimum module size cutoff value of 50. Genes that were not assigned to any module were classified to color gray.
The expression matrix of the twenty samples with FDG PET data from the training set was extracted to conduct a correlation test. To summarize the module expression profile, we calculated the module eigengene, the first principal component of the expression matrix of the corresponding module. The Pearson's correlation analysis was performed between the module eigengene and the maximum standardized uptake value (SUV) measured by FDG PET. The modules with p-value corrected by false discovery rate < 0.05 were regarded as significant tumor metabolism-associated modules.
The tumor metabolism-associated modules were independently validated for TCGA data by a subset of LUAD samples including corresponding FDG PET data (n = 17 of 490). The preprocessed mRNA transcriptome data of TCGA was transformed into log2 scale after adding value one. The gene network of TCGA data was constructed using the same 4010 genes of the training set by imputing missing genes with k-nearest neighbors algorithm (k = 10) [18]. The Pearson's correlation between the module eigengene of tumor metabolism-associated modules and maximum SUV was tested to see whether the modules identified from the training set were also significantly correlated with maximum SUV in TCGA data.
Tumor metabolism estimation model
The model based on neural networks was trained to predict maximum SUV from transcriptome data. The inputs of the model were gene expression values of the tumor metabolism-associated modules, which included 480 and 146 genes. Training data consisted of 20 subjects who have FDG PET image data and 226 subjects without image data. For the semi-supervised training, we used a simplified ladder network model for this task [19]. To use unlabeled data, denoising autoencoder was used [20]. It could be used for dimension reduction as well as feature extraction from high-dimensional data. The encoder of the denoising autoencoder extracts 64 features from gene expression data, and then another neural network layer that connects the features to one-dimensional output, maximum SUV, was added. This network was used for the supervised learning. The decoding of autoencoder was performed as an auxiliary task. Sixty-four features extracted by the encoder were decoded by a neural network layer connected to the original data dimension and the denoising autoencoder was trained to reconstruct the original expression data. These supervised learning and auxiliary unsupervised training, denoising autoencoder, were combined for predicting maximum SUV (Figure S1A). The output of the estimation model was defined as TMI. The encoder and decoder simply consisted of one layer, respectively. For optimizing the neural networks, Adam optimizer was used [21]. Neural networks were constructed by a deep learning library, Keras (version 1.2.2, https://keras.io).
After the training, the model was tested for 17 TCGA data that have corresponding FDG PET images (Figure S1B). The output of the model was defined as TMI. TMI of all LUAD samples was obtained for further analyses (Figure S1C).
Cell types enrichment analysis
To evaluate the heterogeneous cellular landscape of TME, cell types enrichment scores were evaluated. A gene signature-based method for inferring cell types from tissue transcriptome profiles, the xCell tool (http://xcell.ucsf.edu/), was used [22]. It infers 64 immune and stroma cell types of the TME. The composite score of immune cells, ImmuneScore, was also obtained.
Two-dimensional TME landscape mapping and clustering
Sixty-four cell types enrichment scores were assigned to each tumor sample via the xCell analysis. To visualize cellular heterogeneity in TME, a dimension reduction method, t-distributed stochastic neighbor embedding (t-SNE), was employed [23]. Cell types enrichment scores were normalized by mean and standard deviation across the samples and they were projected onto 2D axes, defined as the 2D TME landscape map.
Using the values of two axes of the TME landscape map, a dendrogram representing a pairwise similarity was constructed. The similarity was determined by the average distance between elements of each hierarchical cluster. Cutting the dendrogram at a given height provides a number of clusters.
Statistical analysis
The comparison of TMI between groups (LUAD subtypes or cell type-based clusters) was conducted by one-way ANOVA, followed by the post hoc Tukey's test. The survival rate of the groups was depicted with the Kaplan-Meier's method and compared with the log-rank test. The prognostic properties of TMI, cell types-based clusters and ImmuneScore were evaluated by univariate and multivariate Cox regression analysis. To define the risk groups, continuous variables including TMI were dichotomized using the median value of each variable in TCGA data.
Results
Transcriptome-based tumor metabolism estimation
The tumor metabolism-associated modules were selected and then a neural network model for estimating FDG uptake was trained. Two modules among ten gene network modules were significantly correlated with tumor metabolism (magenta module: r = 0.60, p < 0.05; brown module: r = -0.567, p < 0.05; p-values corrected for false-discovery rate). These modules were also significantly correlated with tumor metabolism for TCGA samples including FDG PET (r = 0.54, p = 0.02 and r = -0.58, p = 0.01 for magenta and brown modules, respectively; Figure S2). Both modules were associated with extracellular matrix organization processes (Table S2). A tumor metabolism estimation model was built by genes of the two modules. The mean absolute error of the predicted maximum SUV was 1.52 for the training set and 2.79 for TCGA data. TMIs were estimated for all samples of TCGA data (n = 490) using the model.
TMIs were compared between molecular subtypes of LUAD (subtyping is described in Supplementary Material). The TMI of the bronchioid subtype was significantly lower and that of the squamoid subtype was significantly higher than the other subtypes (F = 211.7, p < 1×10-15; 3.87±1.09 vs. 4.60±1.11 vs. 6.45±0.96 for TMI of bronchioid, magnoid and squamoid subtypes, respectively; Figure 1A). The patients were divided into two groups according to TMI, and the group with high TMI showed significantly worse survival (p = 0.0019, Figure 1B). We compared TMI with two other metabolic signatures representing glucose metabolic activity (detailed methods are described in Supplementary Material). The glycolysis and gluconeogenesis pathway score based on mean expression of selected genes [24] was positively correlated with TMI (r = 0.26, p < 1×10⁻⁸; Figure 1C). We also obtained enrichment scores of the glycolysis pathway using Reactome [25]. A significant positive correlation between glycolysis enrichment score and TMI was also found (r = 0.32, p < 1×10-12; Figure 1D).
Figure 1
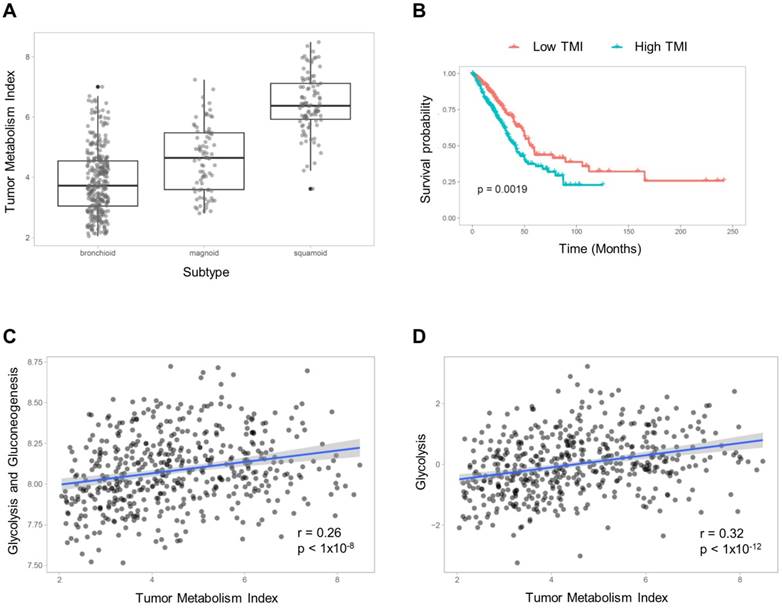
Tumor metabolism index (TMI) estimation model. (A) The subjects were classified into three LUAD subtypes, and TMI was compared between subtypes. There was a significant effect of the subtypes on TMI (F = 211.7, p < 1×10-15; 3.87±1.09 vs. 4.60±1.11 vs. 6.45±0.96 for TMI of bronchioid, magnoid and squamoid subtypes, respectively). (B) The subjects were divided into two groups based on the median value of TMI, and the group with high TMI showed significantly worse prognosis (p = 0.0019). TMI was compared with gene signatures representing glucose metabolism. (C) The mean gene expression values of selected genes related to glycolysis and gluconeogenesis showed a positive correlation with TMI. (D) The glycolysis enrichment score calculated by gene sets of Reactome was also positively correlated with TMI.
Clusters based on tumor microenvironment cell types and tumor metabolism
Sixty-four different cell types enrichment scores and ImmuneScore were computed for TCGA data. Using these scores, a 2D TME landscape map based on t-SNE was drawn with TMI (Figure 2A). A trend that relatively hypometabolic tumors were predominantly located towards low values on both axes was identified (Figure 2B). Subjects were divided into four clusters (C1-C4) according to their similarity in TME cell composition (Figures 2C, D). There was a significant effect of the cell types-based clusters on TMI (F = 29.4, p < 1×10-15; Figure 2E). Post-hoc analyses revealed that the TMI of C2 was significantly lower than those of the other clusters. In contrast, the TMI of C3 was significantly higher than those of the other clusters (Table S3).
Immune landscape of cell type-based clusters
Immune cell-type enrichment scores were compared between clusters. Tumors with high ImmuneScore tended to locate on the left portion of the 2D TME landscape map (Figure 3A), and ImmuneScore was significantly different between clusters (F = 43.84, p < 1×10-15; Figure 3B). Post-hoc analysis demonstrated that the C4 showed significantly higher ImmuneScore than the other clusters (Table S4). The 2D TME landscape map with each cell type enrichment score (Figure S3) and distribution of scores of clusters (Figure S4) are presented. Additionally, a heatmap of immune cell type enrichment scores is illustrated to identify the comprehensive immune landscape (Figure 3C). These illustrations reveal that immune cell enrichment scores of most immune cells including CD4+, CD8+ T cells, macrophages, and B cells were relatively higher in C4 than the other clusters. A cluster with high TMI, C3, showed a significantly higher score of Tregs. Another cluster with low TMI, C2, showed relatively higher scores of mast cells and CD4+ central memory T cells. Most of the immune cell enrichment scores were low in C1; however, basophils and Th1, Th2 cells were relatively enriched in C1.
Figure 2
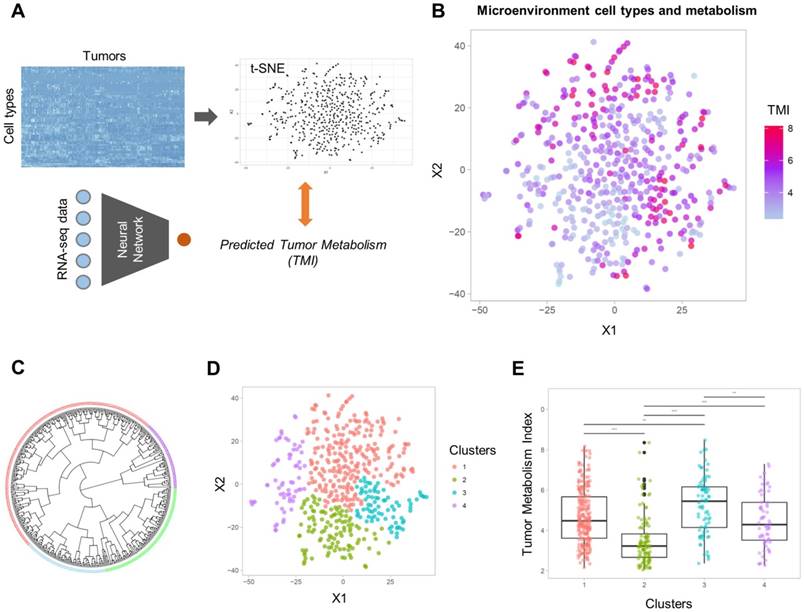
Two-dimensional projection of cellular landscape of TME. (A) All samples of TCGA data were mapped to a two-dimensional TME landscape map using t-distributed stochastic neighborhood embedding based on cell types enrichment scores. (B) The color scale indicates TMI of each sample, and it shows a trend that hypometabolic samples are located within populations with low values on both axes. (C, D) The samples were divided into four clusters by hierarchical clustering. Circular dendrogram (C) and the 2D TME landscape map (D) are presented to show the similarity between samples and to locate the clusters within the map, respectively. (E) Four clusters demonstrated significantly different TMI (F = 29.4, p < 1×10-15).
Figure 3
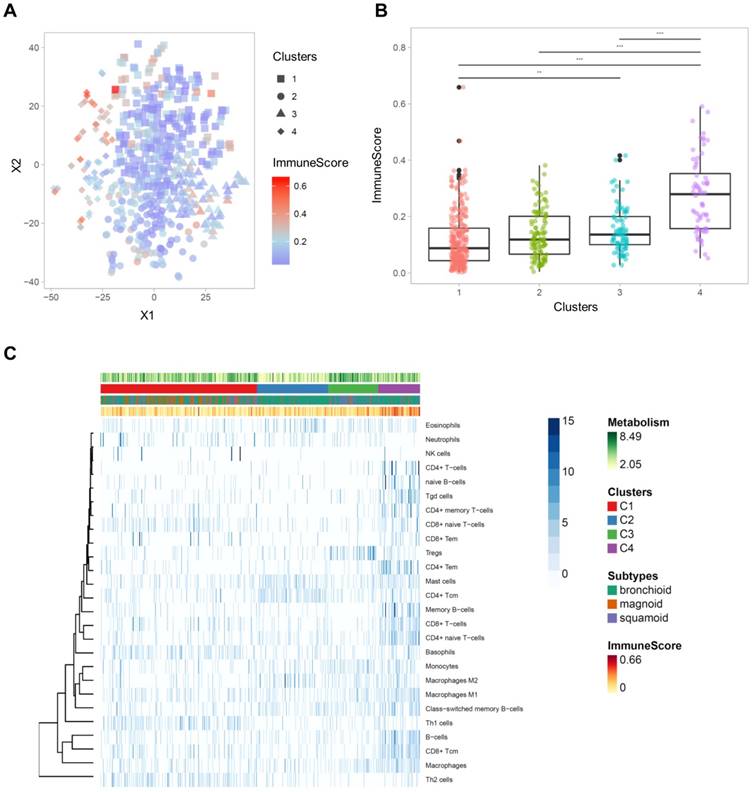
The comprehensive illustration showing the relationship between immune landscape and tumor metabolism index. (A) A two-dimensional TME landscape map with ImmuneScore is shown. Each point, either being square (cluster 1), circle (cluster 2), triangle (cluster 3), or diamond (cluster 4), is a sample, with the color scale indicating the ImmuneScore. (B) The ImmuneScores were significantly different between the clusters, and the cluster 4 showed significantly higher ImmuneScores than the other clusters. (C) A heatmap depicting the immune cell types enrichment scores of all samples. The heatmap represents cell types enrichment scores of each immune cell type. TMI, clusters based on immune cellular heterogeneity, lung adenocarcinoma subtypes, and ImmuneScore are shown for each sample (above the heatmap).
Survival analysis
Overall survival was associated with the cell type-based clusters (p = 0.029; Figure 4A). C2 was associated with good prognosis compared with C1 (HR = 0.58, 95% C.I. 0.38-0.89; p = 0.01). C4 also showed a trend of favorable prognosis (HR = 0.60, 95% C.I. 0.38-1.01; p = 0.05) (Table 1). The high ImmuneScore group showed significantly better prognosis (HR = 0.65, 95% C.I. 0.48-0.88; p = 0.005; Figure 4B). LUAD subtypes were also associated with overall survival (p < 1×10⁻⁴; Figure 4C). Magnoid and squamoid subtypes showed significantly poorer prognosis compared to bronchioid subtypes (HR = 1.99, 95% C.I. 1.35-2.92 and HR = 1.84, 95% C.I. 1.29-2.62; p = 0.0005 and 0.0008 for magnoid and squamoid subtypes, respectively). TMI and tumor stage also showed significant association with overall survival (HR = 2.62, 95% C.I. 1.91-3.60; p < 0.0001 for stage III or IV tumors; HR = 1.61, 95% C.I. 1.19-2.19; p = 0.002 for high TMI group). Multivariate Cox analysis demonstrated that tumor stage and ImmuneScore were significant independent predictors for overall survival (HR = 2.31, 95% C.I. 1.67-3.20, p < 0.0001 for tumor stage; HR = 0.69, 95% C.I. 0.48-0.98, p = 0.04 for ImmuneScore; Table 1). In addition, C2 was also associated with favorable prognosis with marginal significance (HR = 0.63, 95% C.I. 0.40-1.01; p = 0.05). All samples were plotted according to their ImmnueScore and TMI, and prognostic and metabolic features are summarized (Figure 5).
Figure 4
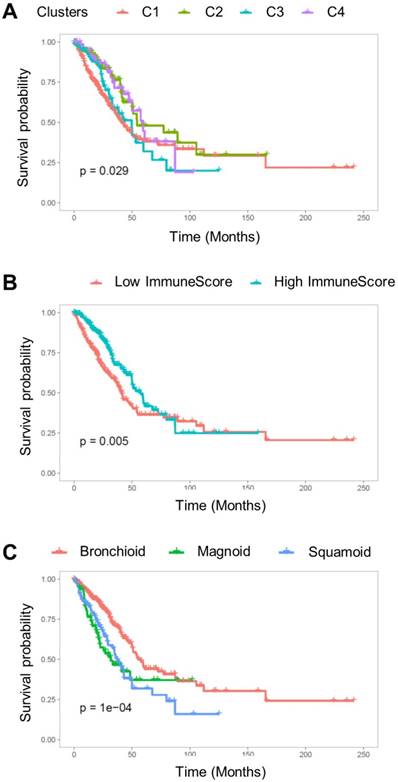
The Kaplan-Meier survival curve for overall survival. (A) Overall survival was significantly associated with TME cell types clusters (p = 0.029). (B) The subjects were divided into two groups based on ImmuneScore, and the group with high ImmuneScores demonstrated better overall survival (p = 0.005). (C) The subtypes of lung adenocarcinoma were significantly associated with overall survival (p < 1×10⁻⁴).
To verify the study results, we validated the association between TMI and immune landscape as well as the prognostic prediction with another publicly available independent gene expression dataset including 183 lung adenocarcinoma samples (see additional methods in Supplementary Material) [26]. There was significant effect of cell type-based clusters on TMI (F = 10.7, p = 1.67 x 10⁻⁶; Figure S5A). Additionally, ImmuneScore was significantly different between cell type-based clusters (F = 72.6, p < 1 x 10-15; Figure S5B). From the TCGA data, C2 showed the lowest TMI and C3 showed the highest TMI. The ImmuneScore of C1 was lower and that of C4 was higher than those of the other clusters. The results of survival analysis were also consistent with the results from the TCGA data. C2 and C4 were associated with favorable prognosis (HR = 0.39, 95% C.I. 0.18-0.85 for C2 and HR = 0.56, 95% C.I. 0.31-1.00 for C4). High ImmuneScore demonstrated significantly favorable overall survival (HR = 0.60, 95% C.I. 0.38-0.98). High TMI was associated with a trend of poor overall survival though it did not reach statistical significance (HR = 1.42, 95% C.I. 0.88 - 2.28) (Figure S5C-E).
Discussion
As the TME and metabolic milieu serve critical roles in cancer immune escape leading to tumor growth and aggressiveness [8, 27], we sought to demonstrate the association between immune cell type composition in the TME and tumor metabolism. The key feature of the altered metabolism within cancer tissue is increased aerobic glycolysis, so-called 'Warburg Effect' [28], and it changes the TME to favor cancer cell growth. An important mechanism of cancer immune escape is glucose competition between the cancer cells and tumor-infiltrating lymphocytes [6, 7]. As T cell activation requires upregulated glucose metabolism similar to cancer cells to permit proliferation and differentiation into effector T cells [29], the glucose competition between cancer cells and tumor-infiltrating lymphocytes can influence immune cell differentiation and composition in the TME. Our study demonstrated that a cluster with higher Treg cell scores (C3) showed tumor hypermetabolism, while a cluster with higher mast cell and CD4+ central memory T cell scores (C2) showed relative hypometabolism. Immune tolerance stimuli mediated by Treg cells drives metabolic reprogramming of immune systems to fatty acid oxidation instead of glycolysis [30]. Thus, enriched Treg cells in the TME could result from relatively poor nutrient conditions due to elevated glycolysis by cancer cells. The previous study also reported that inhibition of glycolysis promoted Treg cell differentiation [31]. This cluster with high Treg cell scores also showed relatively poor prognosis, which corresponded with the previous studies reporting its association with higher risk of recurrence [32, 33]. On the other hand, the association of mast cell infiltration with favorable prognosis in various cancer types has been reported [34-36]. Our study also showed relatively low glucose metabolism and favorable prognosis in the mast cell-enriched cluster, which corresponds with these previous clinical studies. Another cluster with a favorable prognosis (C4) demonstrated overall high immune cell enrichment scores including CD8+ T cells and macrophages. This result corresponded with the recent meta-analysis result that CD8+ T cell infiltration is associated with favorable prognosis in various cancer types [37]. Of note, recent studies based on histopathologic and FDG PET data reported an inverse correlation between tumor-infiltrating lymphocytes and cancer glucose metabolism, which supports a close interconnection between the TME and cancer cells [38, 39]. According to the systematic analyses of all immune cell types, the elevated glucose metabolism in tumor samples is not solely correlated with immune cell depletion in the TME. Instead, the association between immune cell composition and tumor metabolism suggested that the metabolic milieu leads to a broad spectrum of immune landscape dynamics. We suggest glucose deprivation in the TME may cause a compositional change of immune cells as well as cellular exhaustion and dysfunction so that it eventually creates an immunosuppressive microenvironment and could be closely related to patients' prognosis.
Table 1
Multivariate Cox regression analysis for overall survival
| Univariate analysis | Multivariate analysis | |||||
|---|---|---|---|---|---|---|
| Variables | Hazard Ratio (95% CI) | p-value | Hazard Ratio (95% CI) | p-value | ||
| Age | Older than 65 | 1.13 (0.83 - 1.53) | 0.45 | |||
| Stage | ≥III | 2.62 (1.91 - 3.60) | <0.0001 | 2.31 (1.67 - 3.20) | <0.0001 | |
| TMI | Hypermetabolic tumor | 1.61 (1.19 - 2.19) | 0.002 | 1.23 (0.85 - 1.77) | 0.27 | |
| Microenvironment cell type clusters | C2 | 0.58 (0.38 - 0.89) | 0.01 | 0.63 (0.40 - 1.01) | 0.05 | |
| C3 | 0.90 (0.59 - 1.37) | 0.61 | 0.83 (0.53 - 1.29) | 0.41 | ||
| C4 | 0.62 (0.38 - 1.01) | 0.05 | 0.82 (0.48 - 1.38) | 0.45 | ||
| ImmuneScore | High ImmuneScore | 0.65 (0.48 - 0.88) | 0.005 | 0.69 (0.48 - 0.98) | 0.04 | |
| Molecular Subtypes | Magnoid | 1.99 (1.35 - 2.92) | 0.0005 | 1.42 (0.93 - 2.18) | 0.11 | |
| Squamoid | 1.84 (1.29 - 2.62) | 0.0008 | 1.46 (0.96 - 2.22) | 0.08 | ||
CI: confidence interval
Figure 5
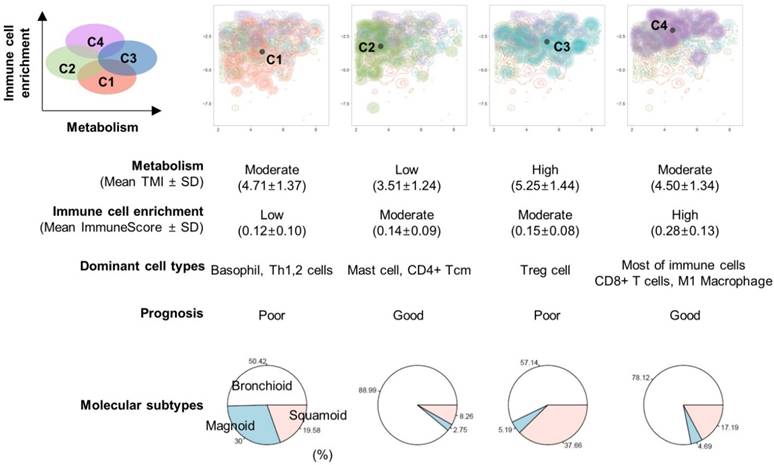
Overview of the association of prognosis with immune landscape and metabolism. An illustration showing the relationship between TMI (x-axis) and ImmuneScore (y-axis). The microenvironment immune clusters are presented as different colors. The table summarizes results from our study.
The tumor metabolism prediction model we developed in this study used the transcriptome data of the genes from two SUV-related modules as inputs (see additional data in Supplementary Material). Functional enrichment analysis demonstrated that both modules were functionally associated with extracellular matrix organization (Table S2). It is now well known that the extracellular matrix plays a very important role in tumor initiation and progression; moreover, it also regulates cancer metabolism in many complicated ways [40]. Focal adhesion signaling mediates the transmission of extracellular matrix signals into the tumor cells, which promotes the activation of certain pathways that increase glycolysis. Therefore, we think that the genes included in two modules are closely associated with the regulation of tumor metabolism, which could make our model estimate tumor metabolism with decent performance.
Our results could be applied to developing an integrative biomarker based on tumor metabolism and immune microenvironment. ImmuneScore was a predictive prognostic factor independent of other clinical features. TMI was also associated with prognosis though it did not reach statistical significance in the multivariate analysis. Nonetheless, maximum SUV in lung cancer has been regarded as an important prognostic imaging parameter [41, 42]. These two axes, ImmuneScore and TMI, could divide LUAD according to immune landscape to some degree as shown in Figure 5. C1 and C4 could be clustered by low and high immune cell enrichment, respectively. Though C2 and C3 showed similar ImmuneScores, they could be divided by different metabolisms. A new pathologic classification system based on immune cell distribution and density was recently suggested as a potential predictive marker for cancer immunotherapy as well as a prognostic marker [43, 44]. Moreover, the role of tumor metabolism in immunotherapy response evaluation and prediction has been increasingly emphasized [45, 46]. As a future research, it needs to be investigated whether ImmuneScore, TMI, and the immune cell type clusters have predictive values for evaluating immunotherapy response. Monitoring dynamics of tumor metabolism and immune landscape along with immunotherapy will provide a clue for understanding immunotherapy response and resistance.
There are some limitations to our study. First, the design of this study was retrospective; thus, datasets that contain both matched transcriptome and FDG PET image data were limited. To overcome these data issues, we combined large transcriptome data without image data for developing the tumor metabolism estimation model. To clarify our results, further study with a well-controlled prospective design is warranted. Second, an additional analysis using FDG PET images and histopathologic data will make our results more solid and reliable. The key variables analyzed in this study were immune cell enrichment scores and TMI, and they were estimated based on mRNA transcriptome data. Even though our tumor metabolism prediction model showed robust performance and TMI demonstrated prognostic and clinical characteristics similar to FDG uptake reported in previous literature, comprehensive multimodal analysis including transcriptome, imaging, and histopathologic data can support our results. We developed TMI, which predicts tumor SUV; however, TMI can have different scales than real SUV according to independent external gene expression data. As shown in Figure S1B, the model relatively underestimates SUV, though the output showed significant positive correlation. Thus, our TMI prediction model should be analyzed cautiously in other gene expression data and should be used for comparison between subjects from the same experimental batch.
In this study, we found the association between the immune landscape of the TME and tumor metabolism. The immune cell composition in the TME was heterogeneous across LUAD samples. It was closely associated with tumor metabolism and also patient prognosis. As tumor metabolism was elevated, immune cell subpopulations were prone to enrichment of immunosuppressive cellular subtypes. ImmuneScore and TMI were associated with patient prognosis. Additionally, the comprehensive analysis of the immune landscape of the TME and tumor metabolism may support development of an integrated biomarker for immunotherapy responses as well as prognosis.
Abbreviations
FDG: 18F-Fluorodeoxyglucose; LUAD: lung adenocarcinoma; PET: positron emission tomography; SUV: standardized uptake value; TCGA: the cancer genome atlas; TME: tumor microenvironment; TMI: tumor metabolic index; t-SNE: t-distributed stochastic neighbor embedding; WGCNA: weighted gene coexpresssion network analysis.
Supplementary Material
Supplementary figures and tables.
Acknowledgements
The results here are in whole based upon data generated by the TCGA Research Network: “http://cancergenome.nih.gov/”.
Funding
This research received no specific grant from any funding agency in the public, commercial, or not-for-profit sectors.
Competing Interests
The authors declare no competing financial interests.
References
1. Crespo J, Sun H, Welling TH, Tian Z, Zou W. T cell anergy, exhaustion, senescence, and stemness in the tumor microenvironment. Curr Opin Immunol. 2013;25:214-21
2. Wherry EJ. T cell exhaustion. Nat immunology. 2011;12:492-9
3. Galon J, Costes A, Sanchez-Cabo F, Kirilovsky A, Mlecnik B, Lagorce-Pagès C. et al. Type, density, and location of immune cells within human colorectal tumors predict clinical outcome. Science. 2006;313:1960-4
4. Zhang L, Conejo-Garcia JR, Katsaros D, Gimotty PA, Massobrio M, Regnani G. et al. Intratumoral T cells, recurrence, and survival in epithelial ovarian cancer. N Engl J Med. 2003;348:203-13
5. Qian B-Z, Pollard JW. Macrophage diversity enhances tumor progression and metastasis. Cell. 2010;141:39-51
6. Chang C-H, Qiu J, O'Sullivan D, Buck MD, Noguchi T, Curtis JD. et al. Metabolic competition in the tumor microenvironment is a driver of cancer progression. Cell. 2015;162:1229-41
7. Ronneberger O, Fischer P, Brox T. U-net: Convolutional networks for biomedical image segmentation. International Conference on Medical Image Computing and Computer-Assisted Intervention: Springer. 2015:234-41
8. Chang C-H, Pearce EL. Emerging concepts of T cell metabolism as a target of immunotherapy. Nat immunology. 2016;17:364-8
9. Colegio OR, Chu NQ, Szabo AL, Chu T, Rhebergen AM, Jairam V. et al. Functional polarization of tumour-associated macrophages by tumour-derived lactic acid. Nature. 2014;513:559-63
10. Cancer Genome Atlas Research Network. Comprehensive molecular profiling of lung adenocarcinoma. Nature. 2014;511:543-50
11. Albertina B, Watson M, Holback C, Jarosz R, Kirk S, Lee Y. et al. Radiology Data from The Cancer Genome Atlas Lung Adenocarcinoma [TCGA-LUAD] collection. The Cancer Imaging Archive. 2016
12. Clark K, Vendt B, Smith K, Freymann J, Kirby J, Koppel P. et al. The Cancer Imaging Archive (TCIA): maintaining and operating a public information repository. J Digit Imaging. 2013;26:1045-57
13. Gevaert O, Xu J, Hoang CD, Leung AN, Xu Y, Quon A. et al. Non-small cell lung cancer: identifying prognostic imaging biomarkers by leveraging public gene expression microarray data—methods and preliminary results. Radiology. 2012;264:387-96
14. Nair VS, Gevaert O, Davidzon G, Napel S, Graves EE, Hoang CD. et al. Prognostic PET 18F-FDG uptake imaging features are associated with major oncogenomic alterations in patients with resected non-small cell lung cancer. Cancer Res. 2012;72:3725-34
15. Okayama H, Kohno T, Ishii Y, Shimada Y, Shiraishi K, Iwakawa R. et al. Identification of genes upregulated in ALK-positive and EGFR/KRAS/ALK-negative lung adenocarcinomas. Cancer Res. 2012;72:100-11
16. Yamauchi M, Yamaguchi R, Nakata A, Kohno T, Nagasaki M, Shimamura T. et al. Epidermal growth factor receptor tyrosine kinase defines critical prognostic genes of stage I lung adenocarcinoma. PloS one. 2012;7:e43923
17. Langfelder P, Horvath S. WGCNA: an R package for weighted correlation network analysis. BMC bioinformatics. 2008;9:559
18. Hastie T, Tibshirani R, Narasimhan B, Chu G. impute: Imputation for microarray data. Bioinformatics. 2001;17:520-5
19. Rasmus A, Berglund M, Honkala M, Valpola H, Raiko T. Semi-supervised learning with ladder networks. Adv Neural Inf Process Syst. 2015:3546-54
20. Vincent P, Larochelle H, Bengio Y, Manzagol P-A. Extracting and composing robust features with denoising autoencoders. Proceedings of the 25th international conference on Machine learning: ACM. 2008:1096-103
21. Kingma D, Ba J. Adam: A method for stochastic optimization. arXiv preprint arXiv: 14126980. 2014
22. Aran D, Hu Z, Butte AJ. xCell: Digitally portraying the tissue cellular heterogeneity landscape. Genome Biol. 2017;18:220
23. Maaten Lvd, Hinton G. Visualizing data using t-SNE. J Mach Learn Res. 2008;9:2579-605
24. Gaude E, Frezza C. Tissue-specific and convergent metabolic transformation of cancer correlates with metastatic potential and patient survival. Nat Commun. 2016;7:13041
25. Joshi-Tope G, Gillespie M, Vastrik I, D'Eustachio P, Schmidt E, de Bono B. et al. Reactome: a knowledgebase of biological pathways. Nucleic Acids Res. 2005;33:D428-32
26. Sato M, Larsen JE, Lee W, Sun H, Shames DS, Dalvi MP. et al. Human lung epithelial cells progressed to malignancy through specific oncogenic manipulations. Mol Cancer Res. 2013;11:638-50
27. McAllister SS, Weinberg RA. The tumour-induced systemic environment as a critical regulator of cancer progression and metastasis. Nat Cell Biol. 2014;16:717-27
28. Vander Heiden MG, Cantley LC, Thompson CB. Understanding the Warburg effect: the metabolic requirements of cell proliferation. Science. 2009;324:1029-33
29. Michalek RD, Gerriets VA, Jacobs SR, Macintyre AN, MacIver NJ, Mason EF. et al. Cutting edge: distinct glycolytic and lipid oxidative metabolic programs are essential for effector and regulatory CD4+ T cell subsets. J Immunol. 2011;186:3299-303
30. O'Neill LA, Kishton RJ, Rathmell J. A guide to immunometabolism for immunologists. Nat Rev Immunol. 2016;16:553-65
31. Shi LZ, Wang R, Huang G, Vogel P, Neale G, Green DR. et al. HIF1α-dependent glycolytic pathway orchestrates a metabolic checkpoint for the differentiation of TH17 and Treg cells. J Exp Med. 2011;208:1367-76
32. Shimizu K, Nakata M, Hirami Y, Yukawa T, Maeda A, Tanemoto K. Tumor-infiltrating Foxp3+ regulatory T cells are correlated with cyclooxygenase-2 expression and are associated with recurrence in resected non-small cell lung cancer. J Thorac Oncol. 2010;5:585-90
33. Petersen RP, Campa MJ, Sperlazza J, Conlon D, Joshi MB, Harpole DH. et al. Tumor infiltrating Foxp3+ regulatory T-cells are associated with recurrence in pathologic stage I NSCLC patients. Cancer. 2006;107:2866-72
34. Welsh TJ, Green RH, Richardson D, Waller DA, O'byrne KJ, Bradding P. Macrophage and mast-cell invasion of tumor cell islets confers a marked survival advantage in non-small-cell lung cancer. J Clin Oncol. 2005;23:8959-67
35. Dabiri S, Huntsman D, Makretsov N, Cheang M, Gilks B, Badjik C. et al. The presence of stromal mast cells identifies a subset of invasive breast cancers with a favorable prognosis. Mod Pathol. 2004;17:690-5
36. Carlini MJ, Dalurzo MCL, Lastiri JM, Smith DE, Vasallo BC, Puricelli LI. et al. Mast cell phenotypes and microvessels in non-small cell lung cancer and its prognostic significance. Hum Pathol. 2010;41:697-705
37. Gooden MJ, de Bock GH, Leffers N, Daemen T, Nijman HW. The prognostic influence of tumour-infiltrating lymphocytes in cancer: a systematic review with meta-analysis. Br J Cancer. 2011;105:93-103
38. Ottensmeier CH, Perry KL, Harden EL, Stasakova J, Jenei V, Fleming J. et al. Upregulated glucose metabolism correlates inversely with cd8+ t-cell infiltration and survival in squamous cell carcinoma. Cancer Res. 2016;76:4136-48
39. Na KJ, Choi H. Tumor metabolic features identified by FDG PET correlates with gene networks of immune cell microenvironment in head and neck cancer. J Nucl Med. 2018;59:31-7
40. Pickup MW, Mouw JK, Weaver VM. The extracellular matrix modulates the hallmarks of cancer. EMBO Rep. 2014;15:1243-53
41. Vansteenkiste JF, Stroobants SG, Dupont PJ, De Leyn PR, Verbeken EK, Deneffe GJ. et al. Prognostic importance of the standardized uptake value on 18F-fluoro-2-deoxy-glucose-positron emission tomography scan in non-small-cell lung cancer: an analysis of 125 cases. J Clin Oncol. 1999;17:3201-6
42. Paesmans M, Berghmans T, Dusart M, Garcia C, Hossein-Foucher C, Lafitte J-J. et al. Primary tumor standardized uptake value measured on fluorodeoxyglucose positron emission tomography is of prognostic value for survival in non-small cell lung cancer: update of a systematic review and meta-analysis by the European Lung Cancer Working Party for the International Association for the Study of Lung Cancer Staging Project. J Thorac Oncol. 2010;5:612-9
43. Galon J, Mlecnik B, Bindea G, Angell HK, Berger A, Lagorce C. et al. Towards the introduction of the 'Immunoscore'in the classification of malignant tumours. J Pathol. 2014;232:199-209
44. Galon J, Angell HK, Bedognetti D, Marincola FM. The continuum of cancer immunosurveillance: prognostic, predictive, and mechanistic signatures. Immunity. 2013;39:11-26
45. Wong AN, McArthur GA, Hofman MS, Hicks RJ. The advantages and challenges of using FDG PET/CT for response assessment in melanoma in the era of targeted agents and immunotherapy. Eur J Nucl Med Mol Imaging. 2017;44:67-77
46. Sachpekidis C, Larribere L, Pan L, Haberkorn U, Dimitrakopoulou-Strauss A, Hassel JC. Predictive value of early 18F-FDG PET/CT studies for treatment response evaluation to ipilimumab in metastatic melanoma: preliminary results of an ongoing study. Eur J Nucl Med Mol Imaging. 2015;42:386-96
Author contact
![]() Corresponding author: Hongyoon Choi, MD., Ph.D., Department of Nuclear Medicine, Seoul National University Hospital, 28 Yongon-Dong, Jongno-Gu, Seoul, 110-744, Korea. Tel: +82-2-2072-2802, Fax: +82-2-745-0345, E-mail: chy1000com and Kwon Joong Na, MD., Department of Community Health, Korea Health Promotion Institute, Namsan Square Building 24th Floor, 173 Toegye-ro, Jung-gu, Seoul, Republic of Korea. Tel: 82-2-3781-3544, Fax: 82-2-3781-3581, E-mail: kjna85com
Corresponding author: Hongyoon Choi, MD., Ph.D., Department of Nuclear Medicine, Seoul National University Hospital, 28 Yongon-Dong, Jongno-Gu, Seoul, 110-744, Korea. Tel: +82-2-2072-2802, Fax: +82-2-745-0345, E-mail: chy1000com and Kwon Joong Na, MD., Department of Community Health, Korea Health Promotion Institute, Namsan Square Building 24th Floor, 173 Toegye-ro, Jung-gu, Seoul, Republic of Korea. Tel: 82-2-3781-3544, Fax: 82-2-3781-3581, E-mail: kjna85com
Citation styles
APA
Choi, H., Na, K.J. (2018). Integrative analysis of imaging and transcriptomic data of the immune landscape associated with tumor metabolism in lung adenocarcinoma: Clinical and prognostic implications. Theranostics, 8(7), 1956-1965. https://doi.org/10.7150/thno.23767.
ACS
Choi, H.; Na, K.J. Integrative analysis of imaging and transcriptomic data of the immune landscape associated with tumor metabolism in lung adenocarcinoma: Clinical and prognostic implications. Theranostics 2018, 8 (7), 1956-1965. DOI: 10.7150/thno.23767.
NLM
Choi H, Na KJ. Integrative analysis of imaging and transcriptomic data of the immune landscape associated with tumor metabolism in lung adenocarcinoma: Clinical and prognostic implications. Theranostics 2018; 8(7):1956-1965. doi:10.7150/thno.23767. https://www.thno.org/v08p1956.htm
CSE
Choi H, Na KJ. 2018. Integrative analysis of imaging and transcriptomic data of the immune landscape associated with tumor metabolism in lung adenocarcinoma: Clinical and prognostic implications. Theranostics. 8(7):1956-1965.
This is an open access article distributed under the terms of the Creative Commons Attribution (CC BY-NC) license (https://creativecommons.org/licenses/by-nc/4.0/). See http://ivyspring.com/terms for full terms and conditions.