Impact Factor
- Issue 12; 2026
- Issue 11; 2026
- Issue 10; 2026
- Issue 9; 2026
- Issue 8; 2026
- Volume 16; 2026
- Advance Articles
- Past Issues
- Cover Images
- Cover Suggestion
- Index & Coverage
- Special Issues
Introduction
Materials and Methods
Results
Discussion
Abbreviations
Supplementary Material
Acknowledgements
References
International Journal of Biological Sciences
International Journal of Medical Sciences
 Global reach, higher impact

Theranostics 2017; 7(17):4118-4134. doi:10.7150/thno.20112 This issue Cite
Research Paper
DNA Methylation of miR-7 is a Mechanism Involved in Platinum Response through MAFG Overexpression in Cancer Cells
Olga Vera1, 2*, Julia Jimenez1, 2*, Olga Pernia1, 2, Carlos Rodriguez-Antolin1, 2, Carmen Rodriguez1, Fatima Sanchez Cabo3, Javier Soto1, 2, Rocio Rosas1, 2, Sara Lopez-Magallon4, Isabel Esteban Rodriguez2, 5, Ana Dopazo6, Federico Rojo7, Cristobal Belda8, Rafael Alvarez8, Jaime Valentin9, Javier Benitez10, 11, Rosario Perona2, 11, 12, Javier De Castro2 ![]() , Inmaculada Ibanez de Caceres1, 2
, Inmaculada Ibanez de Caceres1, 2 ![]()
1. Cancer Epigenetics Laboratory, INGEMM, La Paz University Hospital, Madrid, Spain;
2. Biomarkers and Experimental Therapeutics in Cancer, IdiPAZ, Madrid, Spain;
3. Bioinformatics Unit, Centro Nacional de Investigaciones Cardiovasculares Madrid, Spain;
4. Department of Obstetrics and Gynecology, La Paz University Hospital, Madrid, Spain;
5. Department of Pathology, La Paz University Hospital, Madrid, Spain;
6. Genomics Unit, Centro Nacional de Investigaciones Cardiovasculares, Madrid, Spain;
7. Department of Pathology, University Hospital Fundación Jiménez Díaz, Madrid, Spain;
8. Department of Oncology, HM Hospitales, Madrid, Spain;
9. Translational Research in pediatric oncology Hematopoietic transplantation and cell Therapy, IdiPAZ, Madrid, Spain;
10. Human Genetics Group, Spanish National Cancer Research Center (CNIO);
11. Spanish Network on Rare Diseases (CIBERER), Madrid, Spain;
12. Department of Animal Models for Human Diseases, Institute for Biomedical Research CSIC/UAM, CIBER for Rare Diseases, Madrid, Spain.
* Both authors are first authors.
Received 2017-3-16; Accepted 2017-7-4; Published 2017-9-22
Abstract

One of the major limitations associated with platinum use is the resistance that almost invariably develops in different tumor types. In the current study, we sought to identify epigenetically regulated microRNAs as novel biomarkers of platinum resistance in lung and ovarian cancers, the ones with highest ratios of associated chemo-resistance.
Methods: We combined transcriptomic data from microRNA and mRNA under the influence of an epigenetic reactivation treatment in a panel of four paired cisplatin -sensitive and -resistant cell lines, followed by real-time expression and epigenetic validations for accurate candidate selection in 19 human cancer cell lines. To identify specific candidate genes under miRNA regulation, we assembled “in silico” miRNAs and mRNAs sequences by using ten different algorithms followed by qRT-PCR validation. Functional assays of site-directed mutagenesis and luciferase activity, miRNAs precursor overexpression, silencing by antago-miR and cell viability were performed to confirm their specificity in gene regulation. Results were further explored in 187 primary samples obtained from ovarian tumors and controls.
Results: We identified 4 candidates, miR-7, miR-132, miR-335 and miR-148a, which deregulation seems to be a common event in the development of resistance to cisplatin in both tumor types. miR-7 presented specific methylation in resistant cell lines, and was associated with poorer prognosis in ovarian cancer patients. Our experimental results strongly support the direct regulation of MAFG through miR-7 and their involvement in the development of CDDP resistance in human tumor cells.
Conclusion: The basal methylation status of miR-7 before treatment may be a potential clinical epigenetic biomarker, predictor of the chemotherapy outcome to CDDP in ovarian cancer patients. To the best of our knowledge, this is the first report linking the regulation of MAFG by miRNA-7 and its role in chemotherapy response to CDDP. Furthermore, this data highlights the possible role of MAFG as a novel therapeutic target for platinum resistant tumors.
Keywords: miR-7, MAFG, DNA methylation, Cisplatin-resistance, cancer.
Introduction
Platinum-based chemotherapy, in combination with other anticancer drugs, is one of the most potent and widely used chemotherapeutic treatments. Platinum analogues display clinical activity against a broad spectrum of malignancies, including testis, ovary, head, neck and lung cancers. However, one of the major limitations of the use of platinum-based chemotherapy is that the disease almost invariably progresses to a platinum-resistant state, primarily in lung and ovarian cancers [1, 2]. In fact, it is common to find many studies enclosing both pathologies from researchers working in the field of drug-resistance [3-6]. A number of events have been proposed to explain the phenomenon of cisplatin resistance in cancer, including alterations in the epigenetic regulatory machinery, such as the silencing of gene expression through promoter methylation [7, 8]. This process has been also reported in the silencing of regulatory regions of tumor suppressor microRNAs (miRNAs), thereby increasing the expression of their target genes in cancer [9]. In fact, miRNAs are the most recently discovered mechanism of epigenetic inheritance that acting with messenger RNA can alter gene expression status [10]. miRNAs were first related to cancer in 2002; those that were downregulated were defined as tumor suppressor miRNAs, such as the miR-15a/16-1 cluster in chronic lymphocytic leukemia [11]. The gain or loss of these miRNAs can increase or decrease the activity of several signaling pathways in cancer cells [12]. For instance, a number of miRNAs are regulated by c-MYC, an oncogene that codes for a transcription factor involved in cancer and regulates processes such as cell cycle progression (miR-17, let-7), inhibition of apoptosis (miR-19a, miR-26a) and metastasis (miR-9) [13]. Moreover, miRNAs can regulate the action of DNA-methyltransferases, which has been associated with tumorigenesis in mice injected with lung cancer cell lines [14]. DNA methylation is one of the epigenetic regulators of miRNA expression and therefore, might be also responsible for the development of resistance to chemotherapy. The silencing though DNA methylation can be reverted by combination of demethylating drugs and histone deacetylase (HDAC) inhibitors such as 5 Aza-2deoxycytidine (5Aza-dC) and Trichostatine A (TSA). Both drugs act in synergy by depleting methyltransferase activity [15] and reversing the formation of transcriptionally repressive chromatin structure [16], Strategy previously described in many tumor types [17, 18]. However, our understanding of the regulation of miRNA expression and their role in chemoresistance is still poor [19]. In this study, we aimed to gain insight into the role of miRNA epigenetic regulation by DNA methylation over the response to cisplatin in cancer. We compared the global miRNA and mRNA expression profiles between sensitive/resistant-paired cancer cell lines under reactivation treatment and we analyzed whether those changes were due to DNA hypermethylation by further functional validation in different cell lines and cohorts of ovarian cancer patients.
Materials and Methods
Cell culture, treatments and viability to CDDP
Fifteen human cancer cell lines were purchased from ATCC (Manassas, VA) or ECACC (Sigma-Aldrich, Spain) and cultured as recommended. The CDDP-resistant variants A2780R and OVCAR3R were selected after a final exposure to 0.5 and 0.05 μg/ml cisplatin, respectively (Farma Ferrer, Spain), as previously described for H23R and H460R variants [20]. The additional 11 human cell lines, PC-3, LNCAP, H727, HT29, A549, BT474, LoVo, IMIM-PC-2, SKOV3, SW780 and IMR90, were used for further validations. For viability assays cells were treated with increasing doses of CDDP as described [21]. The epigenetic reactivation drugs 5Aza-2deoxycytidine (5Aza-dC) and trichostatin A (TSA) (Sigma-Aldrich, Spain) were used at 5µM and at 300nM respectively as described [22]. Cell authentication and treatments are described in Supplementary Material and Methods and Supplementary Table 1.
Clinical sample and data collection
Formalin-Fixed Paraffin embedded (FFPE) and fresh-frozen ovarian cancer samples were collected from untreated patients and associated clinical data were obtained from Hospital Parc de Salut Mar (83 patients) and Biobank of IDIS-CHUS-HULP (55 patients) representing the most frequent ovarian cancer subtypes; all the patients underwent chemotherapy treatment after sample collection. Seven patients were also selected from stage III/IV patients from Hospital Madrid Clara Campal with a platinum treatment response classified as refractory or resistant. In addition, 22 high-grade serous carcinoma (HGSOC), were obtained from the National Cancer Research Centre (CNIO) biobank in collaboration with Dr. J. Benitez, from a previously reported cohort of patients [23]. We also collected 10 normal ovarian samples from patients who had undergone a sex reassignment surgery or tubal ligation and 10 peripheral blood mononuclear cells (PBMCs) to discard genomic imprinting. Follow-up was conducted according to the criteria of the medical oncology divisions from each institution. All the samples were processed following the standard operating procedures with the appropriate approval of the Human Research Ethics Committees at each contributing center, including informed consent within the context of research. Clinical, pathological and therapeutic data were recorded by an independent observer, and a blind statistical analysis was performed on these data.
RNA extraction and miRNA/mRNA array preprocessing
RNA extraction, assessment of quality and hybridization into Agilent platforms for microRNA and mRNA microarrays and data normalization is deeply described in Supplementary Materials and Methods. The criteria used for filtering the miRNA/mRNA data were according to the packages recommended by Agilent, and were analyzed by two independent bioinformaticians. miRNA/mRNA experiments had an average expression over the 20th percentile of all average expressions and changed across the different conditions (i.e. with a coefficient of variation [CV] >5% across all samples). Global data were combined to identify those miRNAs, with inhibited expression after cisplatin treatment that were re-expressed after epigenetic reactivation, together with those genes that have in silico mRNA complementary sequences and opposite expression. Genes were considered as targets if selected with at least one of the 10 methods described by Alexiou et al [24]. For the inverse expression profiles, only those pairs (miRNA, gene) with a negative Spearman correlation coefficient and a p-value for this correlation <0.1 were considered as potential targets. The databases GeneCard (http://www.genecards.org) miRBase (www.mirbase.org), mirwalk (www.umm.uni-heidelberg.de/apps/zmf/mirwalk) and Web gestalt (www.bioinfo.vanderbilt.edu/webgestalt) were used for bioinformatics analysis [25-27]. (GEO reference: GSE84201).
RNA isolation and quantitative RT-PCR
Total RNA was retrotranscribed and quantitative RT-PCR analysis were performed as previously described [20, 22]. Samples were analyzed in triplicate using the HT7900Real-Time PCR system (Applied Biosystems, USA), and relative expression levels were calculated according to the comparative threshold cycle method (2-ΔΔCt) using RNU48 or RNU6B as an endogenous control miRNAs and GADPH or β-actin as an endogenous control genes. Primers and probes for expression analysis were purchased from Applied Biosystems. miRNAs probes are detailed in Supplementary Table 2. Probes for gene expression are as follows: MAFG: Hs 01034678_g1; ELK1: Hs 00901847_m1; MAPKAP1: Hs 01118091_m1; ABCA1: Hs 01059118_m1; GADPH: Hs03929097_g1; β-actin: Hs99999903_m1. Data are presented as the “change of expression in number of times” (Log10-RQ) and the error bars are expressed as the maximum estimate (RQmax) and the minimum estimate (RQmin) expression levels, representing the standard deviation of the average expression level RQ. miRNAs from human HEK-293T cell line were isolated using the miRNeasy kit (Quiagen, USA) and miR-7 expression analysis was carried out as described before, using RNU48 as endogenous control and the experimental groups transfected with 3'-UTR plasmid control and miR-NC as calibrators.
Site-directed mutagenesis assay
The full length MAFG-3'-UTR sequence (NM_002359.3 OriGene, USA) was used as a template to generate the mutants MAFG 3´UTR. Two different regions were identified by more than six bioinformatical algorithms as seed region of miR-7 binding site. Seven nucleotides within each seed region were mutated. Site-directed mutagenesis was carried out with QuikChange lightning site-directed mutagenesis kit (Stratagene, USA) according to the manufacturer's instructions. The presence of both mutated seed regions and the integrity of the remaining MAFG 3ÚTR sequence of all constructs were validated by Sanger sequencing. The primers designed to introduce mutations were for Region2: Fw-5'-caagtaaaccatgatatatagtgctacttccaccttaactttgcc-3'; Rv-5'-ggcaaagttaaggtggaagtagcactatatatcatggtttacttg-3'; and for Region8: Fw-5'-ggccaagcgttccctggccagtgctatctggcctcagctttgttc-3', Rv-5'-gaacaaagctgaggccagatagcactggccagggaacgcttggcc-3'.
Cell Transfection and lentiviral transduction
miR-7 overexpression and silencing: Cell lines were seeded at 500,000 cells/p60 plate, then transfected with 40 or 50 nM of miR-7 precursor, anti-miR-7 or negative controls (AM17100, AM 17110, AM10047 and AM17010 Ambion, USA) and using Lipofectamine 2000 (Invitrogen, USA) according to the manufacturer's protocol.
Luciferase assay
HEK-293T cells were transfected with MAFG-3'-UTR, MAFG-3'-mutated-UTR, ABCA1-3'-UTR or ELK-1-3'-UTR plasmids (OriGene, USA), and PremiR-hsa-miR-7 or Negative Control as described above. Luminiscence was assayed 24 hours later using the Kit Renilla Luciferase Assay System (Promega, USA), according to the manufacturer's instructions. Results were normalized to the Renilla luminescence from the same vector and shown as the ratio between the various treatments and cells transfected with control vector.
cDNA plasmids transfection
A Myc-DDK-tagged ORF clone of MAFG, ELK-1 or ABCA1 and the negative control pCMV6 were used for in transient transfection (OriGene, USA). H23 and A2780 cells were plated onto 60-mm dishes at 6x10⁵ cells/dish and transfected with a negative control, MAFG, ELK-1 or ABCA1 vectors (IDs: RC221486; RC208921 and RC221861) using jet-PEI DNA Transfection Reagent (PolyPlus Transfection, USA). For stable overexpression, lentiviruses carrying ELK-1 cDNA (Applied Biological Materials, Canada) were obtained by cotransfecting 15 μg of the specific lentiviral vector (pGIPZ-nonsilencing or pLenti-GIII-CMV-hELK-1-GFP-2A-Puro) and 5 μg of each packaging vector (pCD-NL-BH and pMD2-VSV-G) in 10 million HEK 293T cells using Lipofectamine 2000 (Invitrogen, USA). Supernatants were taken at 48 hours posttransfection. A2780S cells were plated onto 60-mm dishes at 1x10⁵ cells/dish and transduced with supernatant carrying nonsilencing or ELK-1 lentivirus, and polybrene was added (5 μg/ml).
Transfection efficacy was measured by qRT-PCR, using the sensitive cell line transfected with the negative control as a calibrator. Two independent experiments were performed in quadruplicate.
Epigenetic validation: CpG island identification, DNA extraction, bisulfite modification, bisulfite sequencing and methylation-specific PCR
The occurrence of CpG islands (CGIs) encompassing microRNA genes or being located nearby as well as the identification of repetitive elements were assessed using various programs for CGI-revealing, listed and described in Supplementary Material and Methods. The possible gene in which the miRNA was encoded was also analyzed, searching for the presence of 5´ CGIs located in the transcriptional site. The DNA from a total of 151 samples, including tumors, controls and cultured cell was isolated, bisulfite modified and used for BS, as previously described [22]. Primers design, PCR and electrophoresis conditions are detailed in Supplementary Material and Methods. Primers are listed in Supplementary Table 3. For BS, we prefer direct sequencing, to subcloning of a mixed population of alleles to avoid potential cloning efficiency bias [28] and artifact [29].
Western blot analysis
Cell lines were cultured at a density of 600,000 cells per 60-mm plate, shifted into medium containing 10% fetal bovine serum for 24 h and 72 h. Twenty micrograms (20 μg) of whole-cell extracts were subjected to Western blot, performed as previously described [30]. The primary antibodies employed were the c-Myc-A14 (Santa Cruz, USA) and β-tubulin (Sigma, Spain) antibodies.
Statistical analysis
For the identification of differentially expressed miRNAs and genes from the microarray data, we used linear models [31] as implemented in the Limma Bioconductor package. The fixed effects were the origin of the tissue (lung/ovarian), the cell line (H460, H23, OVCAR3, A2780) and the condition (sensitive, resistant, resistant treated). The replicate is the random effect. To identify the downregulated miRNAs in resistant cells and their opposite expressed target genes, we performed the following contrasts for all the tissues (lung and ovarian) or for each tissue origin (lung or ovarian): resistant vs. sensitive and resistant-treated vs. resistant.
We then selected the candidates that fulfill the following conditions in at least 2 of the 4 cell lines interrogated: Log2(R/S) <0 AND Log2 (RT/R) >0; RvsS or RTvsR statistically different p<0.05. As a statistical method we used the unpaired T-test algorithm with Benjamini Hochberg (BH) as the FDR correction method for multiple testing corrections with statistical significance of p<0.1 in the miRNA approach and p<0.05 in the gene approach as an adjusted p-value.
Patient's clinical characteristics were described for the complete series with mean and standard deviation values or relative frequencies. The data were stratified for patients carrying methylated or unmethylated DNA, and their distributions compared with the chi-squared test or Fisher's exact test for qualitative variables, and Student's t test or the Wilcoxon-Mann-Whitney test (non-normal distribution) for quantitative variables. Overall survival and Progression free survival (PFS) were estimated according to the Kaplan-Meier method and compared between groups by means of the log-rank test. All the p-values were two-sided, and the type I error was set at 5 percent. Statistical analyses were performed using Stata 10 software.
Results
Establishment of ovarian human cancer cell lines resistant to CDDP
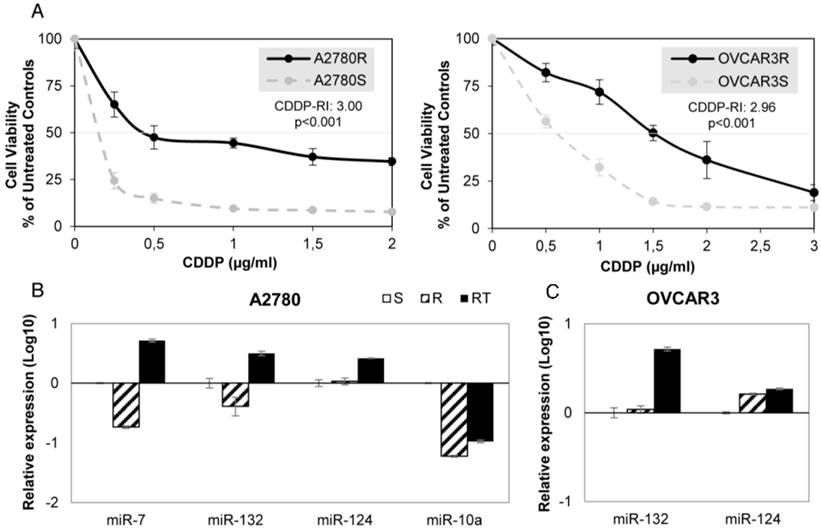
We have established 2 ovarian cancer cell lines resistant to CDDP, A2780-R and OVCAR3-R, that showed approximately three times more drug resistance than the paired parental cell line A2780 and OVCAR3 (3.00 and 2.96 Resistant-Index (RI); p<0.001) and a similar CDDP RI to H23R and H460R NSCLC cancer cells, that we established previously [20], (3.35 and 2.50 respectively; p<0.001) (Figure 2A and Supplementary Figure 1A).
miRNA relative expression on CDDP-sensitive and -resistant ovarian cancer cell lines. (A) Viability curves showing the acquired resistance of A2780 and OVCAR3 cell lines; Cells were exposed for 72 h to each drug concentration. Data were normalized to the untreated control, which was set at 100% and represent the mean + SD of at least 3 independent experiments performed in quadruplicate at each drug concentration tested for every one cell analyzed. IC50, is the inhibitory concentration that kills 50% of the cell population. Resistant index (RI) calculated as IC50 resistant / IC50 sensitive cell line. p<0.001 was considered as a significant change in drug sensitivity (Student's t-test). (B-C) Relative expression levels of the selected miRNAs measured by qRT-PCR. Data are represented in log10 scale and are expressed using the corresponding sensitive (S) line as a calibrator. Each miRNA level was normalized to RNU48 as an endogenous control. Assays were made in the ovarian cancer cell lines A2780 (B) and OVCAR3 (C) in all experimental conditions: S, R and RT. S: sensitive; R: resistant; RT: resistant treated with epigenetic reactivation drugs (5-Aza and TSA). The expression number assays for each miRNA are indicated in Supplementary Table 2.
Identification of candidate miRNAs
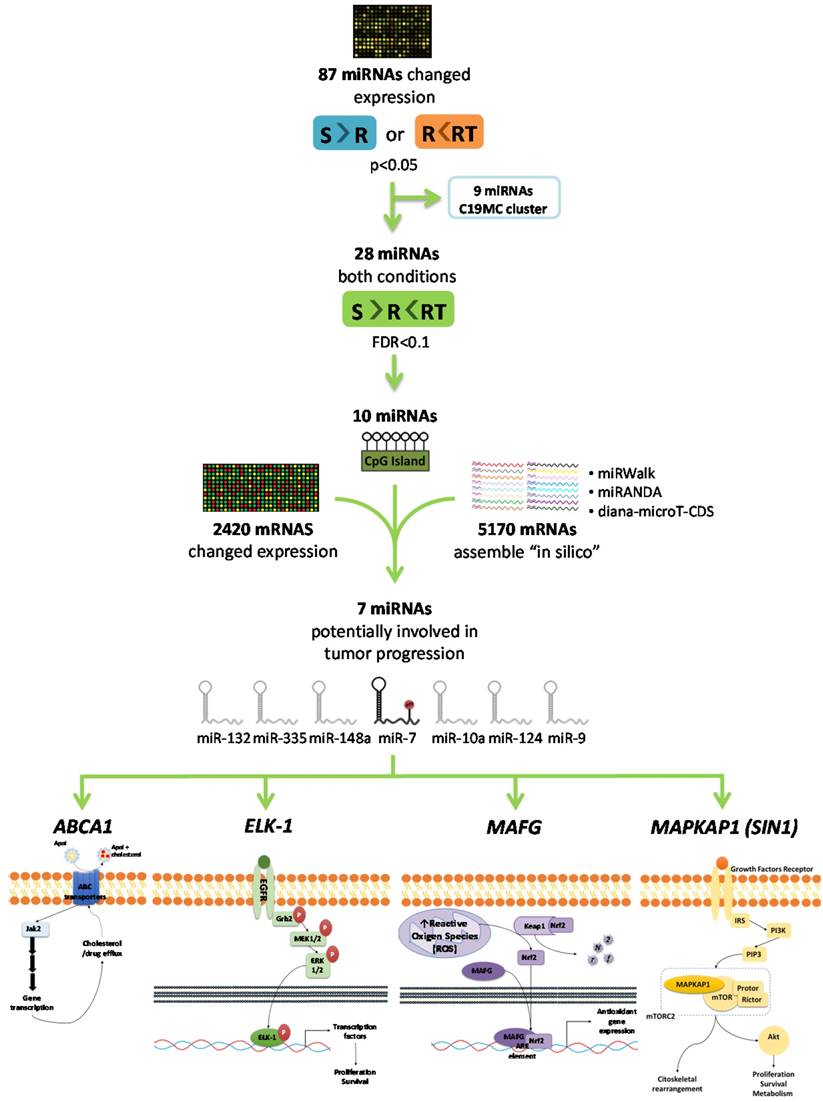
As a first step to identify candidate miRNAs under epigenetic regulation and involved in the CDDP response, we searched for miRNAs showing a decrease of the expression in R versus S cells and a recovered expression after epigenetic reactivation-treated (RT) versus R cells. First, 87 miRNAs identified on the expression arrays showed a significant expression change (p<0.05) in at least one of the following conditions: R < S or RT > R; while 28 changed their expression with a p-value adj<0.1 simultaneously in both situations. By analyzing the concurrence of CGIs with the characteristics described by Takai and Jones [32], candidates were reduced to 10 encompassing microRNA genes or being located nearby (less than 2000 bp 5´-upstream), together with the analysis of the presence of CGIs in the gene promoter region in which the miRNA is encoded. After a pair-base-complementarity analysis in silico between miRNA and the candidate target genes that showed an opposite expression profiles (Supplementary Database Information); we made a functional web-based enrichment analysis with the selected genes by GOTM. This approach identified 7 miRNAs which potential target genes were involved in tumor progression: miR-7, miR-132, miR-335, miR-148a, miR-10a, miR-124 and miR-9 (Figure 1 and Supplementary Table 4). Mature miR-7 is generated from three different miRNA precursors in the human genome, miR-7-1, miR-7-2, and miR-7-3; we assumed expression changes were tightly associated to miR-7-3 (hereafter called miR-7) as no changes were identified on miR-7-1 and miR-7-2 probes represented in the array and it is the only precursor that presents two CGIs surrounding its genome location. We also found that some of the miRNAs showing the strongest upregulation were located at the C19MC cluster, previously linked with carcinogenesis [33]. It presents a CGI located about 17kb from the first miRNA [34] that was included to analyze its potential epigenetic regulation in drug resistance.
Selection of candidate miRNAs under epigenetic regulation and candidate target genes. The flowchart indicates the steps and criteria used for the selection of the final 7 candidate miRNAs under epigenetic regulation and the final 4 candidate genes under possible regulation of miR-7.
miRNA-7 as potential chemoresistance candidate under epigenetic regulation
Firstly, we validated the expression profile of the 3 experimental conditions (S, R and RT) by qRT-PCR assay confirming the results from the microarray analysis for all 7 miRNAs in at least one of the four cell lines analyzed. Three of the seven miRNAs showed changes in their expression according to the microarray data in A2780 cells: miR-7, miR-132 and miR-10a, whereas no significant changes in expression between S and R cells were found for miR-124 (Figure 2B). The cell line OVCAR3 showed changes in miR-132 and -124, according to the array data. Although both increased expression in RT, no differences between S and R were reported (Figure 2C). For the lung cancer model, 6 miRNAs in H23 cells and 2 miRNAs in H460 cells miRNAs were fully validated (Supplementary figure 1B-C).
miR-132, miR-148a miR-335, and miR-7, were validated in at least 2 cell lines and further selected for epigenetic validation by bisulfite sequencing (BS), together with the C19MC cluster's CGI. This cluster is on the long arm of chromosome 19 and has a CGI of 2255 bp from which we analyzed 394 bp that comprises the area with the highest density of CG positions in H23, H460, A2780 and OVCAR3 cell lines. We also tested DNA from normal tissues from lung (LC), ovary (OC) and PMBCs to discard imprinting. All analyzed CpG positions were densely methylated (Supplementary Figure 2A), confirming a possible role in embryonic development as described [35, 36], but excluding a relation between acquisition of DNA hypermethylation and drug-response. Referred to miR-132, the area analyzed was 866 bp in length, at a CGI comprising -1847/+667bp at the short arm of chromosome 17. miR-148a is located on the short arm of chromosome 7, with a nearby CGI of 1663, located 137 bp upstream from the miRNA. A 560 bp area of the CGI was analyzed. No methylation was found for both miRNAs either on the tumor cell lines or controls samples analyzed (Supplementary Figure 2B and 2C). miR-335 is located on the long arm of chromosome 7, on the second intron of the MEST002 gene transcript. A 1123 bp CGI is located in the promoter region of this transcript. We analyzed a fragment of 528 bp initially in the H23S/R, H460S/R cells and LC. The results showed methylation only in H460S/R subtypes. We extended the analysis to the additional cell lines LoVo, OVCAR3 and PC-3, and control samples, and no methylation was found in any of them (Supplementary Figure 2D). Pairs of primers are listed in Supplementary Table 3.
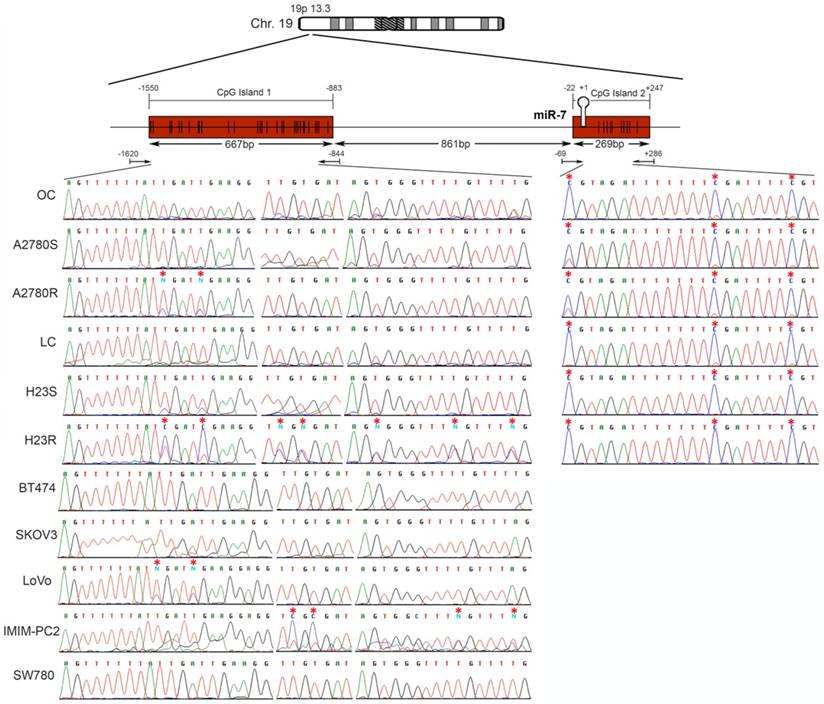
miR-7 is located on the short arm of chromosome 19, with 2 potential regulatory CGIs: one located 861 bp before the first nucleotide of the miRNA sequence with a length of 667 bp; the second has an extension of 269 bp and comprises the miRNA sequence (Figure 3). Two overlapping pairs of primers were used to analyze the first CGI, covering 776 bp, which included the entire CGI and adjacent areas (Supplementary Table 3). The analysis was performed on the ovarian cancer cells A2780S and A2780R. We found the presence of methylation specifically in the resistant cells. The specific aberrant methylation of miR-7 in resistance was confirmed in H23R cells as well as in the cisplatin resistant cell lines IMIM-PC2 and LoVo, which present an IC50 over 2µg/ml CDDP (Supplementary Figure 3). OC and LC were used as controls as well as nine additional tumor cell lines. In fact, the sensitive subtypes and controls presented an absence of methylation. A selection of these results is shown in Figure 3, left. This methylation pattern was used to design the MSP primers for the analysis of FFPE primary tumors. The second CGI, was fully methylated for all the samples tested (Figure 3, right). Therefore, the upstream CpG island of miRNA-7 was selected for our translational approach as it was the candidate downregulated through DNA methylation in CDDP-resistant cells.
Bisulfite sequencing of miRNA-7 regulatory CGIs. Chromosomal location of miR-7 and their nearby CGIs, as well as representative images of corresponding bisulfite sequences (BS). CGIs are represented in red boxes; each CpG position is characterized by vertical black lines inside the boxes. The first nucleotide of each miRNA is indicated by +1. Facing arrows mark the primer positions used for BS. It is shown the methylation analysis of the two CGIs closely related to the encoded miR-7 region. For the first CGI, the 3 different fragments (left half of the Figure) corresponding to the most frequently methylated positions are shown. A representation of 5 of the 11 additional tumor cell lines interrogated, BT474, SKOV3, LoVo, IMIMPC2 and SW780, is also shown. All CpG positions interrogated at the second CGI were fully methylated in all the samples analyzed (right half of the Figure), as indicated by the presence of C preceding a G in the sites indicated by the asterisks. OC: ovary control; LC: lung control. Asterisks indicate methylated positions.
miR-7 methylation is a potential predictive biomarker for recurrence and overall survival in patients with ovarian cancer treated with platinum
Response rates, overall survival or progression free survival are recommended by ASCO and ESMO Clinical Practice Guidelines Committees to assess the clinical benefit of chemotherapy treatment [37] [38]. Ovarian Cancer Consensus Meeting, defines 'platinum-refractory' as patients progressing during therapy or within 4 weeks after the last dose; 'platinum-resistant' patients progressing within 6 months of platinum-based therapy; 'partially platinum-sensitive, patients progressing between 6 and 12 months; and 'platinum-sensitive' patients progressing with an interval of more than 12 months (GCIG Consensus) [39]. Following the international guidelines, we compared the miR-7 methylation levels with OS and PFS clinical parameters on two cohorts of 83 and 55 ovarian cancer patients all of them treated with platinum. We studied the OS for all patients and the PFS in those patients that had recurred at the end of the study to analyze the relationship between platinum response and miR-7 methylation.
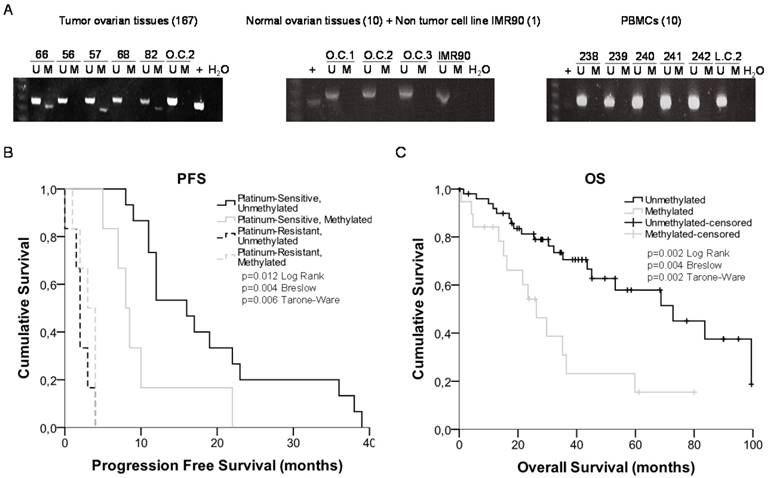
We observed a 29% of methylation (24 out of 83 samples) in the cohort from Hospital del Mar (Table 1), which increased to 36% (20 out of 55) in the CHUS-HULP biobank samples, a cohort enriched in serous resistant tumors (Supplementary Table 5). We also observed a higher percentage of methylation in HGSOC samples from and additional cohort of patients from the CNIO (50% methylated samples) (Supplementary Table 6) and in a small group of the resistant/refractory samples from H. Madrid (57%). We also tested 10 ovarian control samples a non-tumor cell line (IMR90) and 10 PBMCs to discard imprinting and none of them were methylated (100% specificity) (Figure 4A). When correlating our results with the patient's clinical histories we obtained significant data correlating methylation and cisplatin response in the group of 33 patients that recurred. Kaplan-Meier curves show that patients relapsing before 10 months, carried preferentially methylated miR-7 tumors (80% methylated versus 14% unmethylated) (Figure 4B) (p=0.004). No differences were found in CDDP-refractory and resistant patients. Moreover, after 3 years of follow up over the 83 patients cohort, the overall survival was significantly higher in the group of patients with an unmethylated tumor in comparison with those with a methylated one (67% vs 35%, p=0.004) (Figure 4C). Similar results showing a tendency in terms of PFS and OS were also observed in the CHUS-HULP biobank cohort, although these last results were not statically significant mainly because of a size-limitation (Supplementary Figure 5). Finally, we observed a decrease in the number of patients with higher ECOG status when the promoter region of miR-7 was unmethylated in the higher cohort of patients (p=0.025). Accordingly, 62.5% of the patients who harbored the methylated promoter presented ascites compared with 80% of the patients who did not develop ascites harboring an unmethylated promoter region (p=0.025) (Table 1). Those results indicate that patients carrying an unmethylated sample tended to have less aggressive tumors, with better progression free survival after platinum treatment and overall survival rates than those who carried the methylated DNA.
Demographic table with the clinicopathological characteristics of a cohort of 83 samples from Hospital del Mar.
| Characteristics | Complete series (n=83) | Unmethylated (n=59) | Methylated (n=24) | |||||
|---|---|---|---|---|---|---|---|---|
| No. of patients | % | No. of patients | % | No. of patients | % | p | ||
| Age (median, range) | 55 (17-84) | 59 (17-80) | 55 (18-84) | 0.880 | ||||
| Menopausal status | 0.565 | |||||||
| Premenopausal | 34 | 41.0 | 23 | 39.0 | 11 | 45.8 | ||
| Postmenopausal | 49 | 59.0 | 36 | 61.0 | 13 | 54.2 | ||
| Parity | 0.974 | |||||||
| No | 24 | 28.9 | 17 | 28.8 | 7 | 29.2 | ||
| Yes | 59 | 71.1 | 42 | 71.2 | 17 | 70.8 | ||
| Familiar history | 0.684 | |||||||
| No | 58 | 69.9 | 42 | 71.2 | 16 | 66.7 | ||
| Yes | 25 | 30.1 | 17 | 28.8 | 8 | 33.3 | ||
| ECOG | 0.025 | |||||||
| 0 | 21 | 25.3 | 20 | 33.9 | 1 | 4.2 | ||
| 1 | 36 | 43.4 | 22 | 37.3 | 14 | 58.3 | ||
| 2 | 20 | 24.1 | 12 | 20.3 | 8 | 33.3 | ||
| 3 | 6 | 7.2 | 5 | 8.5 | 1 | 4.2 | ||
| Ascites | 0.025 | |||||||
| No | 47 | 56.6 | 38 | 64.4 | 9 | 37.5 | ||
| Yes | 36 | 43.4 | 21 | 35.6 | 15 | 62.5 | ||
| Tumor Grade | 0.35 | |||||||
| I | 34 | 41 | 27 | 45.8 | 7 | 29.2 | ||
| II | 24 | 28.9 | 15 | 25.4 | 9 | 37.5 | ||
| III | 25 | 30.1 | 17 | 28.8 | 8 | 33.3 | ||
| Histology | 0.883 | |||||||
| Serous | 40 | 48.2 | 27 | 45.8 | 13 | 54.2 | ||
| Mucinous | 9 | 10.8 | 7 | 11.9 | 2 | 8.3 | ||
| Clear cell | 8 | 9.6 | 5 | 8.5 | 3 | 12.5 | ||
| Endometroid | 4 | 4.8 | 3 | 5.1 | 1 | 4.8 | ||
| Others | 22 | 26.5 | 17 | 28.8 | 5 | 20.8 | ||
| Chemotherapy | 0.956 | |||||||
| Adjuvant | 59 | 71.1 | 43 | 72.9 | 16 | 66.7 | ||
| Neoadjuvant | 6 | 7.2 | 3 | 5.1 | 3 | 12.5 | ||
| Metastatic | 18 | 21.7 | 13 | 22.0 | 5 | 20.8 | ||
| Platinum sensitivity | 0.196 | |||||||
| Sensitive | 21 | 63.6 | 15 | 71.4 | 6 | 50.0 | ||
| Resistant | 12 | 36.4 | 6 | 28.6 | 6 | 50.0 | ||
| Relapse | 0.286 | |||||||
| No | 49 | 59.0 | 37 | 62.7 | 12 | 50.0 | ||
| Yes | 34 | 41.0 | 22 | 37.3 | 12 | 50.0 | ||
| Death | 0.119 | |||||||
| No | 49 | 59 | 38 | 64.4 | 11 | 45.8 | ||
| Yes | 34 | 41 | 21 | 35.6 | 13 | 54.2 | ||
miRNA-7 methylation analysis in primary tumors and survival analysis. (A) Representative MSPs of miR-7 nearby CGI in DNA obtained from ovarian tumor tissues, normal ovarian tissues, non-tumor cell line and PBMCs from healthy donors. For each sample, the PCR product in the M lane was considered as the presence of methylated DNA, whereas the amplification product in the U lane was considered as the presence of unmethylated DNA. In vitro methylated DNA was used as a positive control (+). Uncropped gels of Figure 4a are included in Supplementary Figures (Supplementary Figure 4). (B) and (C) Kaplan-Meier comparison between cisplatin treatment and miR-7 proximal island methylation in ovarian cancer patients treated with platinum in terms of progression free survival (B) and overall survival in months (C). LogRank, Breslow and Tarone-Ware tests were used for comparisons and p<0.05 was considered as a significant change in OS or PFS. p values in (B) represent the significant difference between sensitive-unmethylated and sensitive-methylated patients
MAFG is a direct target gene of miRNA-7
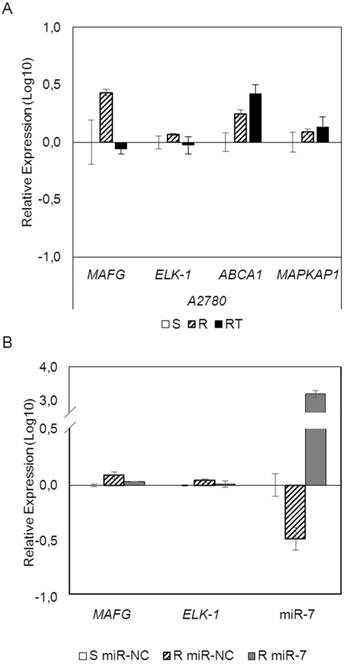
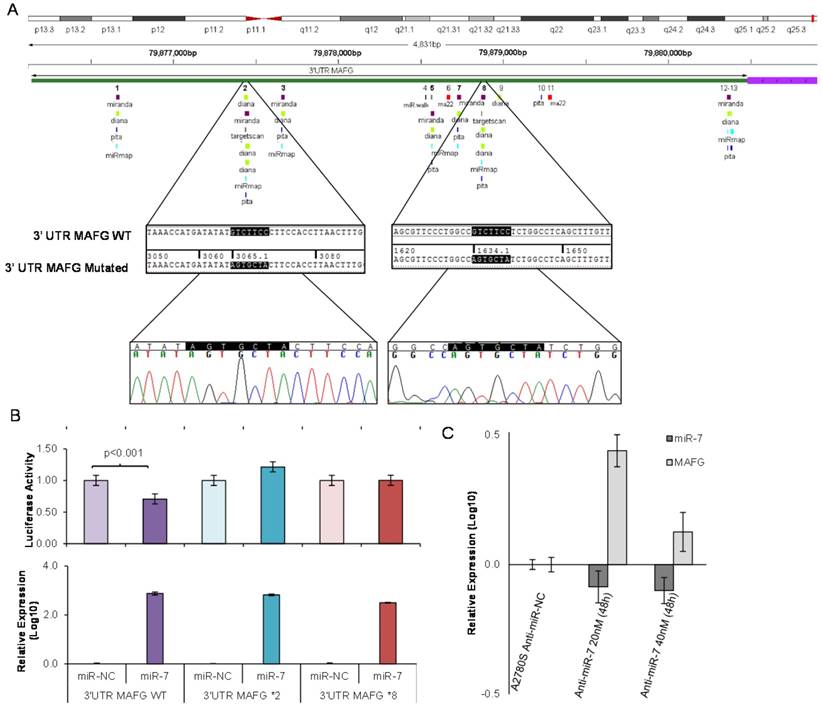
To analyze if the methylation of miR-7 is affecting the cisplatin-cell viability through the silencing of its expression, we overexpressed miR-7 in the resistant subtypes at a final concentration of 40nM (Supplementary Figure 6A). No effect on drug sensitivity was observed although efficiency of the transfection was validated by qRT-PCR, confirming the miR-7 overexpression after 72h in both cell lines (Supplementary Figure 6B). The overexpression of higher concentration of pre-miR-7 (50nM) resulted in a decrease in cell viability, reaching levels of 63% and 52%, respectively, compared with their parental sensitive and resistant cell lines, transfected with the mimic negative control (Supplementary Figure 6C), making unfeasible to evaluate the response to CDDP, given no representative cell population was left from the cell culture after the miR-7 precursor overexpression. Thus, to fully understand the implication of miR-7 in the development of resistance, we investigated the role of the target candidate genes that showed a significant opposite expression to miR-7 and in silico complementarity (Figure 1). Out of the 1021 genes that accomplished both conditions we selected only those that were present in A2780 and H23 cell lines and which expression increased in R compared to S and RT subtypes, with a p-value<0.05 adjusted by FDR correction. Further functional web-based annotation using the Gene Ontology Tree Machine (GOTM) tool, grouped 149 genes in 20 significant functional groups, from which we selected MAFG, MAPKAP1, ELK-1 and ABCA1 genes because of their implication in biological functions related to tumor progression (Figure 1, Supplementary Database information). The changes on the expression were confirmed by qRT-PCR in A2780 cells for MAFG and slighter but following the expected expression pattern for ELK-1 (Figure 5A) and in H23 cells for MAFG and ABCA1 (Supplementary Figure 7A). To probe whether MAFG, ELK-1 and/or ABCA1 are target genes of miR-7, we overexpressed a precursor of miR-7 in the resistant subtypes to assess the changes in expression of the candidate target genes by qRT-PCR. As expected, the overexpression of miR-7 in A2780R resulted in a decrease of the expression of MAFG and ELK-1, compared with the resistant cell line transfected with the negative control (Figure 5B). MAFG regulation was also confirmed in H23R cells, in which the miR-7 precursor lead also to the decrease of the potential candidate gene ABCA1 (Supplementary Figure 7B). Efficiency of the miR-7 overexpresion was validated by qRT-PCR (Figure 5B and Supplementary Figure 7B). A summary of this selection in shown in Supplementary Table 7. Next, we cotransfected in HEK-293T cells the pre-miRNA-7 together with a luciferase reporter vector that carries the 3'-UTR region of each candidate gene. The cotransfection with the 3'-UTR region of MAFG, induced a reduction of the luciferase activity at both concentrations, 15 and 30nM of the precursor, effect that was not observed when cotransfecting 3'-UTR regions of ELK-1 and ABCA1 (Supplementary Figure 8A, upper panel). Simultaneously, we confirmed through qRT-PCR that the pre-miR-7 was successfully transfected in the 293T cell line, for every experimental group (Supplementary Figure 8A, lower panel). To fully confirm that MAFG is a target gene of miR-7, we performed directed-site mutagenesis at the predicted binding sites of miR-7 in the 3' UTR of MAFG, at two different regions (Figure 6A), followed by luciferase reporter assays. The significant decrease of luciferase activity observed when using the WT 3'UTR of MAFG, disappeared when we cotransfected pre-miR-7 with both constructs containing the mutated regions (Figure 6B). Moreover, to ultimately confirm this regulation, we silenced the expression of miR-7 in A2780S that resulted in increased levels of MAFG (Figure 6C). A2780 cells express miR-7 at a low level, as we can observe in Supplementary Figure 8B compared with the control cell line HEK-293T, which explains the low efficiency decreasing the miR-7 levels at 48h, although it was sufficient enough to observe a strong change over MAFG expression.
mRNAarrays data validation and effect of miRNA-7 over-expression on candidate target genes in the ovarian cancer cell line A2780. (A) Relative expression levels of the selected genes measured by qRT-PCR. Assays were made in all experimental conditions: S, R and RT. S: sensitive; R: resistant; RT: resistant treated with epigenetic reactivation drugs (5-Aza and TSA). Sensitive cells were used as calibrator. (B) Relative expression levels of MAFG, ELK-1 and miR-7 measured by quantitative RT-PCR after miR-7 overexpression. The sensitive cell line transfected with the mimic negative control was used as a calibrator (S miR-NC, white). A2780R cells were transfected with same negative control (R miR-NC, stripped) or with miR-7 precursor (R miR-7, grey). For both (A) and (B), data are represented in Log10 scale obtained from the combined relative expression of 2 independent experiments measured in triplicate. Each gene expression level was normalized to GAPDH or B-actin as an endogenous control.
Site-directed mutagenesis for luciferase activity assay and effect of miR-7 silencing over MAFG expression. (A) Chromosomal localization of miR-7 predicted binding sites at 3'UTR of MAFG. Regions 2 and 8 were identified by six or more bioinformatical algorithms. Sanger sequencing showed that the seed sequence of miR-7 was fully mutated at regions 2 and 8 of the 3' UTR of MAFG. (B) Co-transfection of mimic miR-7 (miR-7) or mimic control (miR-NC) with the 3' UTR of MAFG WT, mutated on region 2 (MAFG 2*) and mutated on region 8 (MAFG 8*). Experiments were performed at 15nM and data was analyzed after 24h of co-transfection. (Upper panel) Relative luciferase activity. The figures represent the mean ± SD of at least 3 independent experiments after data normalization with Renilla and the data from the negative control 3'-UTR; p<0.01 was considered as significant change in Luciferase activity (Student's t-test). (Lower panel) Relative miR-7 expression levels measured by qRT-PCR after co-transfection, as an internal control for the mimic transfection. Each bar represents the combined relative expression of 2 independent experiments measured in triplicate. The miR-NC co-transfected with the 3'-UTR of each tested group was used as calibrator. (C) Relative miR-7 and MAFG expression levels measured by qRT-PCR after silencing of miR-7 with antago-miR in A2780S cells. Two different concentrations of Anti-miR-7 were tested, 20nM and 40 nM. Data was analyzed at 48h after transfection. Each bar represents the combined relative expression of 2 independent experiments measured in triplicate. A2780S cells transfected with the Anti-miR Negative Control was used as calibrator.
The response to cisplatin is mediated by MAFG expression in human cancer cell lines
To determine if the expression of the miR-7 candidate target genes was linked to CDDP response, we conducted their in transient overexpression in the sensitive cells comparing their response to CDDP with their parental resistant and sensitive cell lines, both transfected with an empty vector.
MAFG overexpression resulted in an increase in the resistance to CDDP in A2780S cells compared with the sensitive cell line transfected with the empty vector, showing a resistance index of 1.6 (p<0.001) (Figure 7A). The same effect was also confirmed in the sensitive cell line H23S reaching a similar CDDP-RI of 1.7 (p=0.01) (Supplementary Figure 9A). The overexpression of ABCA1 in H23S led to a RI of 1.5 compared with the sensitive cell line transfected with the empty vector, although it was not statistically significant (p=0.796) (Supplementary Figure 9B). ELK-1 overexpression in A2780S did not change the response to CDDP after 48 h of exposure to the drug (Figure 7B).
Effect of overexpression of MAFG and ELK-1 on cell sensitivity to CDDP in A2780 cell lines. (A-B) Viability curves of A2780 cell lines transfected with pCMV6 (S-Ø and R-Ø) and with the overexpression vectors (S-MAFG and S-ELK-1). Each experimental group was exposed for 48 h to 6 different CDDP concentrations, and data were normalized to each untreated control, set to 100%. The data represent the mean ± SD of at least 3 independent experiments performed in quadruplicate at each drug concentration for each cell line analyzed. The CDDP-RI (Resistant Index to CDDP) was calculated as “IC50 from the R-Ø / IC50 from the S-Ø" and “IC50 from the S-transfected with the gene / IC50 from the S-Ø” ± SD. p<0.01 was considered as significant change in drug sensitivity (Student's t-test). (C) Validation of the transfection efficacy at mRNA and protein levels. Top, Relative expression levels of MAFG and ELK-1 measured by quantitative RT-PCR, in the cell line A2780, represented in Log10 scale; In each experimental group, the sensitive cell line transfected with pCMV6 plasmid was used as a calibrator. Each bar represents the combined relative expression of 2 independent experiments measured in triplicate. Bottom, total cell protein (20µg) at 24 and 72 hours was subjected to WB, membranes were hybridized with antibodies against c-Myc and β-tubulin as loading control. S: Sensitive; S-G: Sensitive transfected with the gene; R: Resistant; β-tub: β-tubulin. (D) Stable overexpression of ELK-1 in A2780S cell line. Top, Viability assay after the nonsilencing (NS) plasmid transductions (S-NS white; R-NS stripped) and overexpressing ELK-1 plasmid (S-ELK-1 grey). Each experimental group was exposed for 72 h to 6 different CDDP concentrations, and data were normalized to each sensitive subtype. Data represents the mean ± SD of at least 3 independent experiments performed with 4 wells at each drug concentration for each cell line analyzed. Bottom, relative ELK-1 expression levels measured by qRT-PCR and represented in Log10 scale. The sensitive cell line with nonsilencing vector was used as a calibrator. Each bar represents the combined relative expression of 2 independent experiments measured in triplicate.
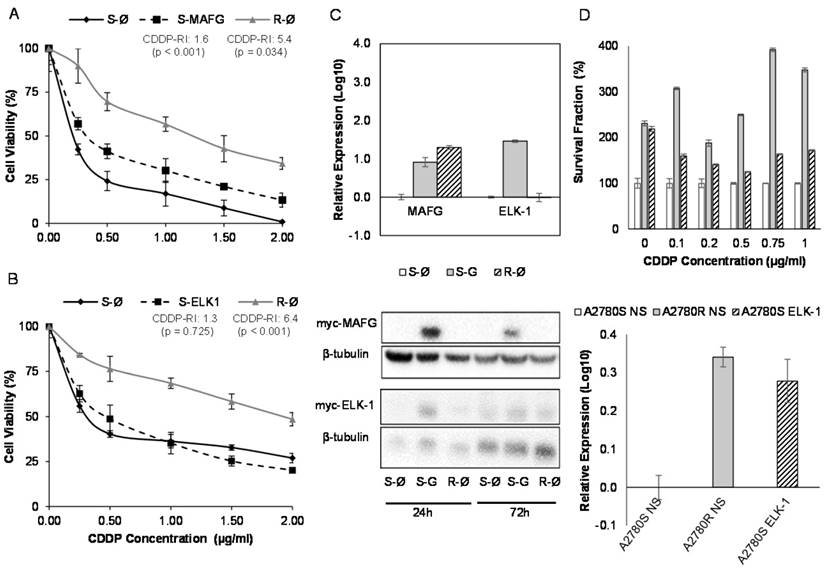
In order to confirm the efficiency of the transfection, we analyzed the mRNA and protein levels by qRT-PCR and western blot of the overexpressed genes. Results confirmed ectopic overexpression of MAFG, ELK-1 and ABCA1 at 72 h in both cell lines (H23S-MAFG, A2780S-MAFG, H23S-ABCA1 and A2780S-ELK-1) with an increase of 0.2, 7, 6416 and 28-folds respectively, compared with the sensitive cell lines transfected with the control vector. No changes at protein level were found between 24 and 72 hours when analyzing MAFG and ABCA1 overexpression (Figure 7C and Supplementary Figure 9C). However, we observed a slightly protein levels of ELK1 at 24h that was not maintained at 72 h (Figure 7C). Therefore, we performed the stable overexpression of ELK-1 by transduction assays with a lentiviral vector and compare the response to CDDP with the parental-sensitive and resistant subtypes harboring a nonsilencing vector (A2780S/R -NS). As previously observed in the “in transient” experimental assays, ELK-1 overexpression did not change the sensitivity to CDDP; however, it induced an strongly increase in the number of cells at 0 µg/ml dose, that allowed to maintain higher ratios of survival fraction when treated with CDDP, compared with the control sensitive cell line. We also confirmed the success of the overexpression by qRT-PCR (Figure 7D).
Discussion
Epigenetic alterations by DNA methylation can reduce the expression of a number of miRNAs, altering the therapeutic response in tumor cells and contributing to the onset of more aggressive phenotypes. We intended to deepen our understanding of this aspect, identifying new miRNA-targets of promoter hypermethylation involved in the response to cisplatin, by using an experimental model of paired sensitive and CDDP-resistant tumor cell lines. We established the ovarian cancer cells A2780R and OVCAR3R, with a CDDP-RI in accordance with the previously established H23R and H460R cell lines, assuming that similar resistant events could follow [20]. Then, we combined an epigenetic reactivation therapy with a global transcriptomic-based strategy. The epigenetic therapy induced an expected reactivation percentage of 12% (87 of the 723 miRNAs), in accordance with published data, using the same technology and pharmacologic unmasking strategy [40]. The differential miRNA expression profile from sensitive, CDDP-resistant and resistant cells under epigenetic reactivation treatment was correlated with the expression of those genes from the same experimental groups that showed complementary sequences. This screening, included an ontological study of routes and processes related to tumor biology for all candidate target genes. We identified a set of 7 miRNAs containing a surrounding CGI that were complementary to target genes involved in cell growth, proliferation, cell migration, drug efflux, angiogenesis or apoptosis inhibition such MAFG, ELK-1, RAB6B,CAMK2G, MAPKAP1, ABCA1, ABL1 or STAT3 [41, 42]. All these processes might influence the acquisition of drug-resistance in the CDDP treated cells through the potential miRNA silencing.
Changes in expression were validated for all 7 candidates, but not in all the expected paired cell lines, indicating that qRT-PCR is a valuable and necessary validation method more restrictive than microarray, that still keeps providing a powerful tool to study the involvement of a large number of miRNAs simultaneously [43, 44]. The expression changes were more significant after unmasking treatment, probably because the pharmacologic combination exerts a synergistic and specific influence in mRNA and miRNA global re-expression, as described in different tumor types [45]. This effect can be stronger than the silencing observed as a secondary effect of CDDP on DNA methylation.
The expression of miR-7, miR-132, miR-335 and miR-148a was validated in at least two paired cell lines. Epigenetic validation of those candidates revealed that only one miRNA from our panel, miR-7, had specific methylation in CDDP-resistance. miR-148a and miR-132 expression might be regulated by an upstream epigenetic mechanism or transcription factor reactivated by demethylation, as has been reported for other candidates [20, 22]. miR-335 epigenetic reactivation has been reported in breast cancer cells, confirming the relevance of our approach to identifying miRNAs under epigenetic regulation, although the response after platinum treatment was not studied [46]. We found specific methylation in both, H460S/R cells, but not in the controls and additional cell lines analyzed, suggesting that the downregulation in the resistant phenotypes is probably independent of the methylation profile. We cannot conclude that the downregulation of miR-335 is affecting the response to platinum, but the sensitivity to the drug seems not to be mediated by DNA methylation.
We focused on the epigenetic regulation of miR-7 at the upstream CpG island analyzed, as the one encompassing miR-7 showed constitutive methylation, suggesting the absence of a regulatory role, as reported for other potential regulatory CGIs [47]. The same methylation profile was found in ovarian, lung, colon and pancreatic cisplatin-resistant cell lines. These data suggest a potential epigenetic regulation of miR-7 at DNA methylation level for this second CGI, a relatively common event in various tumor types, which can present intrinsic resistance to CDDP by epigenetic regulation. We therefore tested the specificity of aberrant miR-7 hypermethylation as a potential epigenetic biomarker to detect the response to chemotherapy on 167 ovarian cancer patients, all of them treated with platinum-based therapy. An extensive clinical follow-up of 83 of those patients showed that those considered platinum-sensitive, harboring an unmethylated miR-7 had a better progression free survival rates than those patients with a methylated marker. These differences were not observed in platinum-resistant patients, probably because in these patients the recurrence develop in short-time periods and in a small number of cases. We confirmed the same tendency in an additional smaller cohort of 55 patients. Furthermore, our analysis indicated that those patients carrying an unmethylated marker tended to have less aggressive tumors, with three times more overall survival after platinum treatment than those who carried the methylated DNA. In addition, the methylation percentage increased in tumor grades III/IV and when analyzing high-serous samples and Platinum-refractory/resistant tumors. Thus, miR-7 methylation could play a role as a clinical tool predicting the aggressive behavior of this malignancy and the poorer response to platinum-based treatment.
We sought then to confirm the role of miR-7 in the response to CDDP, in order to explore the potential therapeutic effect of miR-7 overexpression, as it has been developed for miR-34, the first microRNA mimic to be used in clinical testing as a theranostic marker (http://mirnatherapeutics.com). However, the ectopically overexpression of miRNA-7 in resistant cells did not change their sensitivity to CDDP, although it induced an increase in cell mortality; probably, due to the multifactorial effect that overexpression of miRNAs may cause on the cellular processes by regulating a high number of potential candidates genes. These results validate previous studies, which have shown its possible tumor suppressor role in cancer [48]. Its expression has been also linked with sensitization to paclitaxel [49], although its regulation in this process has not being defined. miR-7 might be involved in these processes through the regulation of its target genes, whose overexpression has been found in our experimental approach. Using a transcriptomic profile together with the in silico assembling of sequences, we identified a group of genes candidate to be targets of miR-7 that could provide cells with the oncogenic capabilities described by Hanahan and Weinberg [50]. Further analysis of molecular pathways and cellular functions, led us to the selection of MAFG, ELK-1, ABCA1 and MAPKAP1 genes. Validation by alternative techniques and overexpression of miR-7 in the resistant cell lines, revealed that MAFG, ABCA1 and ELK-1 recovered their levels of expression after epigenetic treatment and overexpression of miR-7, thus indicating a possible regulation of these genes by the methylation of this miRNA. However, our functional studies performed with luciferase vectors carrying a mutation in the conserved miR-7 binding site, revealed that only MAFG seems to be a direct candidate target gene under miR-7 regulation. Moreover, the silencing of miR-7 expression resulted in increased levels of MAFG and its overexpression is able to strongly increase the resistance to CDDP in sensitive cells. miR-7 may be an indirect regulator of ABCA1 and ELK-1, in fact, it has been reported that miR-7 could act as modulator of chemoresistance by targeting the MRP1/ABCC1, a member of the ABC family proteins, and being involved in lung tumorogenesis by directly regulating the EGFR expression [51-53]. Moreover, ABCA1 upregulation has been related to the decrease in chemotherapy response in breast cancer. However, we could not find a significant increase of resistance to CDDP after ABCA1 overexpression, possibly because of the different schema of treatment used in this study, based on sequential paclitaxel/neoadjuvant chemotherapy [54]. The inhibition of ELK-1 through the drug silodosin has been reported to increase the response to cisplatin in bladder cancer cells [55]. Its overexpression in ovarian cancer cells did not change the sensitivity to CDDP; nevertheless, we observed an increase in the cell survival fraction. As ELK-1 is a nuclear target of the MAP-kinases cascade and the EGFR-signaling pathway, and miR-7 is a direct regulator of EGFR gene, we believe that our results are a consequence of the highly implication of ELK-1 in cell proliferation and apoptosis though these signaling routes [56].
MAFG is associated with detoxification in oxidative stress situations. This leads us to believe that its involvement in the acquired resistance to platinum resides in the protection it confers against free radicals generated in the cell after the administration of this drug [57-61]. Despite the fact that sMafs family, to which MAFG belongs, have been associated with cellular response, little is known about their involvement in human diseases. A number of studies have however linked these proteins with cancer, such as the study by Schembri et al. on MAFG regulation by miR-218 as an indicator of smoking-induced disease processes in the lungs [62] and the study by Yang et al. on the relationship between increased MAFG and growth in colon cancer cell lines through the insulin-like growth factor-I actions [63]. Taken together, our experimental results strongly support the direct regulation of MAFG through miR-7 and their involvement in the development of CDDP resistance in human tumor cells.
In the present manuscript, we introduce the epigenetic regulation of miR-7 as a mechanism involved in platinum-resistance in cancer cell lines directly regulating the action of MAFG, which is overexpressed in resistant phenotypes. To the best of our knowledge, this is the first report linking the regulation of MAFG by miRNA-7 and its role in chemotherapy response to CDDP. Moreover, miR-7 methylation arises as a potential predictive biomarker for the identification of ovarian cancer patients that may present worst response to platinum-derived treatment in terms of OS and PFS. Furthermore, this data captures the interest of researchers due to the possible role MAFG plays as a novel therapeutic target for platinum resistant tumors.
Abbreviations
miRNAs: microRNAs; RI: Resistance Index; CGI: CpG island; CDDP: cisplatin; qRT-PCR: quantitative Real Time-PCR; BS: bisulfite sequencing; NSCLC: non-small cell lung cancer; PBMCs: peripheral blood mononuclear cells; mSP: Methylation Specific PCR.
Supplementary Material
Additional File 1Supplementary figures and tables.
Supplementary database information.
Acknowledgements
The authors thank ServingMed.com for the English language correction and D L for the biostatistical analysis. The authors also acknowledge Biobank from HULP for sample processing.
Financial support
FIS (ISCIII) and FEDER/FSE funds (PI12/00386, PI12/01463, PI14/01495, PI15/00186, and FEDER/FSE, Una manera de hacer Europa support the study and contracts of I.I.C. and O.V. PTA2012/7141-I funds support OP contract and I.I.C. was financed by the ''Miguel Servet'' program (CP 14/00008). The authors gratefully acknowledge the Colombian Department for Science, Technology and Innovation (COLCIENCIAS), Cod.568-2012, for partially funding this work to J.S.
Author Contributions
IIC Conception and design.
OV, JJ, OP, CRA, CR, JS and IIC Development of methodology.
OV, JJ, OP, JS, RR, AD, IER and IIC acquisition of data.
OV, JJ, CRA, CR, JV, FR, RP, JDC analysis and interpretation of data.
SLM, RA, FR, CB, JB, IER and JDC provided clinical samples and histories.
All the authors Write, review and/or revised the manuscript.
Competing Interests
The authors have declared that no competing interest exists. Current state of intellectual property: Spanish patent P201530997, PCT/ES2016/070516 (November 2016).
References
1. Kartalou M, Essigmann JM. Mechanisms of resistance to cisplatin. Mutat Res. 2001;478:23-43
2. Ho GY, Woodward N, Coward JI. Cisplatin versus carboplatin: comparative review of therapeutic management in solid malignancies. Crit Rev Oncol Hematol. 2016
3. Nogales V, Reinhold WC, Varma S, Martinez-Cardus A, Moutinho C, Moran S. et al. Epigenetic inactivation of the putative DNA/RNA helicase SLFN11 in human cancer confers resistance to platinum drugs. Oncotarget. 2016;7:3084-97
4. Murphy M, Stordal B. Erlotinib or gefitinib for the treatment of relapsed platinum pretreated non-small cell lung cancer and ovarian cancer: a systematic review. Drug Resist Updat. 2011;14:177-90
5. van Moorsel CJ, Pinedo HM, Veerman G, Bergman AM, Kuiper CM, Vermorken JB. et al. Mechanisms of synergism between cisplatin and gemcitabine in ovarian and non-small-cell lung cancer cell lines. Br J Cancer. 1999;80:981-90
6. Woo EY, Chu CS, Goletz TJ, Schlienger K, Yeh H, Coukos G. et al. Regulatory CD4(+)CD25(+) T cells in tumors from patients with early-stage non-small cell lung cancer and late-stage ovarian cancer. Cancer Res. 2001;61:4766-72
7. Heyn H, Esteller M. DNA methylation profiling in the clinic: applications and challenges. Nat Rev Genet. 2012;13:679-92
8. Cortes-Sempere M, de Miguel MP, Pernia O, Rodriguez C, de Castro Carpeno J, Nistal M. et al. IGFBP-3 methylation-derived deficiency mediates the resistance to cisplatin through the activation of the IGFIR/Akt pathway in non-small cell lung cancer. Oncogene. 2013;32:1274-83
9. Cao J, Song Y, Bi N, Shen J, Liu W, Fan J. et al. DNA methylation-mediated repression of miR-886-3p predicts poor outcome of human small cell lung cancer. Cancer Res. 2013;73:3326-35
10. Weichenhan D, Plass C. The evolving epigenome. Hum Mol Genet. 2013;22:R1-6
11. Calin GA, Dumitru CD, Shimizu M, Bichi R, Zupo S, Noch E. et al. Frequent deletions and down-regulation of micro- RNA genes miR15 and miR16 at 13q14 in chronic lymphocytic leukemia. Proc Natl Acad Sci U S A. 2002;99:15524-9
12. Mendell JT, Olson EN. MicroRNAs in stress signaling and human disease. Cell. 2012;148:1172-87
13. Bui TV, Mendell JT. Myc: Maestro of MicroRNAs. Genes Cancer. 2010;1:568-75
14. Fabbri M, Garzon R, Cimmino A, Liu Z, Zanesi N, Callegari E. et al. MicroRNA-29 family reverts aberrant methylation in lung cancer by targeting DNA methyltransferases 3A and 3B. Proc Natl Acad Sci U S A. 2007;104:15805-10
15. Baylin SB, Herman JG, Graff JR, Vertino PM, Issa JP. Alterations in DNA methylation: a fundamental aspect of neoplasia. Advances in cancer research. 1998;72:141-96
16. Marks PA, Richon VM, Miller T, Kelly WK. Histone deacetylase inhibitors. Advances in cancer research. 2004;91:137-68
17. Xu S, Ren J, Chen HB, Wang Y, Liu Q, Zhang R. et al. Cytostatic and apoptotic effects of DNMT and HDAC inhibitors in endometrial cancer cells. Curr Pharm Des. 2014;20:1881-7
18. Ibragimova I, Ibanez de Caceres I, Hoffman AM, Potapova A, Dulaimi E, Al-Saleem T. et al. Global reactivation of epigenetically silenced genes in prostate cancer. Cancer Prev Res (Phila). 2010;3:1084-92
19. Chen DQ, Pan BZ, Huang JY, Zhang K, Cui SY, De W. et al. HDAC 1/4-mediated silencing of microRNA-200b promotes chemoresistance in human lung adenocarcinoma cells. Oncotarget. 2014;5:3333-49
20. Ibanez de Caceres I, Cortes-Sempere M, Moratilla C, Machado-Pinilla R, Rodriguez-Fanjul V, Manguan-Garcia C. et al. IGFBP-3 hypermethylation-derived deficiency mediates cisplatin resistance in non-small-cell lung cancer. Oncogene. 2010;29:1681-90
21. Chattopadhyay S, Machado-Pinilla R, Manguan-Garcia C, Belda-Iniesta C, Moratilla C, Cejas P. et al. MKP1/CL100 controls tumor growth and sensitivity to cisplatin in non-small-cell lung cancer. Oncogene. 2006;25:3335-45
22. Ibanez de Caceres I, Dulaimi E, Hoffman AM, Al-Saleem T, Uzzo RG, Cairns P. Identification of novel target genes by an epigenetic reactivation screen of renal cancer. Cancer Res. 2006;66:5021-8
23. Gayarre J, Kamieniak MM, Cazorla-Jimenez A, Munoz-Repeto I, Borrego S, Garcia-Donas J. et al. The NER-related gene GTF2H5 predicts survival in high-grade serous ovarian cancer patients. J Gynecol Oncol. 2016;27:e7
24. Alexiou P, Maragkakis M, Papadopoulos GL, Reczko M, Hatzigeorgiou AG. Lost in translation: an assessment and perspective for computational microRNA target identification. Bioinformatics. 2009;25:3049-55
25. Wang J, Duncan D, Shi Z, Zhang B. WEB-based GEne SeT AnaLysis Toolkit (WebGestalt): update 2013. Nucleic Acids Res. 2013;41:W77-83
26. Dweep H, Gretz N. miRWalk2.0: a comprehensive atlas of microRNA-target interactions. Nat Methods. 2015;12:697
27. Kozomara A, Griffiths-Jones S. miRBase: annotating high confidence microRNAs using deep sequencing data. Nucleic Acids Res. 2014;42:D68-73
28. Grunau C, Clark SJ, Rosenthal A. Bisulfite genomic sequencing: systematic investigation of critical experimental parameters. Nucleic Acids Res. 2001;29:E65-5
29. Sandovici I, Leppert M, Hawk PR, Suarez A, Linares Y, Sapienza C. Familial aggregation of abnormal methylation of parental alleles at the IGF2/H19 and IGF2R differentially methylated regions. Hum Mol Genet. 2003;12:1569-78
30. Sanchez-Perez I, Murguia JR, Perona R. Cisplatin induces a persistent activation of JNK that is related to cell death. Oncogene. 1998;16:533-40
31. Smyth GK. Linear models and empirical bayes methods for assessing differential expression in microarray experiments. Stat Appl Genet Mol Biol. 2004;3:Article3
32. Takai D, Jones PA. The CpG island searcher: a new WWW resource. In Silico Biol. 2003;3:235-40
33. Augello C, Vaira V, Caruso L, Destro A, Maggioni M, Park YN. et al. MicroRNA profiling of hepatocarcinogenesis identifies C19MC cluster as a novel prognostic biomarker in hepatocellular carcinoma. Liver Int. 2012;32:772-82
34. Tsai KW, Kao HW, Chen HC, Chen SJ, Lin WC. Epigenetic control of the expression of a primate-specific microRNA cluster in human cancer cells. Epigenetics. 2009;4:587-92
35. Court F, Tayama C, Romanelli V, Martin-Trujillo A, Iglesias-Platas I, Okamura K. et al. Genome-wide parent-of-origin DNA methylation analysis reveals the intricacies of human imprinting and suggests a germline methylation-independent mechanism of establishment. Genome Res. 2014;24:554-69
36. Noguer-Dance M, Abu-Amero S, Al-Khtib M, Lefevre A, Coullin P, Moore GE. et al. The primate-specific microRNA gene cluster (C19MC) is imprinted in the placenta. Hum Mol Genet. 2010;19:3566-82
37. Wright AA, Bohlke K, Armstrong DK, Bookman MA, Cliby WA, Coleman RL. et al. Neoadjuvant Chemotherapy for Newly Diagnosed, Advanced Ovarian Cancer: Society of Gynecologic Oncology and American Society of Clinical Oncology Clinical Practice Guideline. J Clin Oncol. 2016;34:3460-73
38. Ledermann JA, Raja FA, Fotopoulou C, Gonzalez-Martin A, Colombo N, Sessa C. et al. Newly diagnosed and relapsed epithelial ovarian carcinoma: ESMO Clinical Practice Guidelines for diagnosis, treatment and follow-up. Ann Oncol. 2013;24(Suppl 6):vi24-32
39. Friedlander M, Trimble E, Tinker A, Alberts D, Avall-Lundqvist E, Brady M. et al. Clinical trials in recurrent ovarian cancer. Int J Gynecol Cancer. 2011;21:771-5
40. Lujambio A, Calin GA, Villanueva A, Ropero S, Sanchez-Cespedes M, Blanco D. et al. A microRNA DNA methylation signature for human cancer metastasis. Proc Natl Acad Sci U S A. 2008;105:13556-61
41. Hanrahan V, Currie MJ, Gunningham SP, Morrin HR, Scott PA, Robinson BA. et al. The angiogenic switch for vascular endothelial growth factor (VEGF)-A, VEGF-B, VEGF-C, and VEGF-D in the adenoma-carcinoma sequence during colorectal cancer progression. J Pathol. 2003;200:183-94
42. Iwasaki H, Okabe T, Takara K, Yoshida Y, Hanashiro K, Oku H. Down-regulation of lipids transporter ABCA1 increases the cytotoxicity of nitidine. Cancer Chemother Pharmacol. 2010;66:953-9
43. Calura E, Fruscio R, Paracchini L, Bignotti E, Ravaggi A, Martini P. et al. MiRNA landscape in stage I epithelial ovarian cancer defines the histotype specificities. Clin Cancer Res. 2013;19:4114-23
44. Wang G, Wang R, Strulovici-Barel Y, Salit J, Staudt MR, Ahmed J. et al. Persistence of smoking-induced dysregulation of miRNA expression in the small airway epithelium despite smoking cessation. PLoS One. 2015;10:e0120824
45. Adi Harel S, Bossel Ben-Moshe N, Aylon Y, Bublik DR, Moskovits N, Toperoff G. et al. Reactivation of epigenetically silenced miR-512 and miR-373 sensitizes lung cancer cells to cisplatin and restricts tumor growth. Cell Death Differ. 2015;22:1328-40
46. Png KJ, Yoshida M, Zhang XH, Shu W, Lee H, Rimner A. et al. MicroRNA-335 inhibits tumor reinitiation and is silenced through genetic and epigenetic mechanisms in human breast cancer. Genes Dev. 2011;25:226-31
47. Lopez-Lera A, Pernia O, Lopez-Trascasa M, Ibanez de Caceres I. Expression of the SERPING1 gene is not regulated by promoter hypermethylation in peripheral blood mononuclear cells from patients with hereditary angioedema due to C1-inhibitor deficiency. Orphanet J Rare Dis. 2014;9:103
48. Ma J, Fang B, Zeng F, Pang H, Zhang J, Shi Y. et al. Curcumin inhibits cell growth and invasion through up-regulation of miR-7 in pancreatic cancer cells. Toxicol Lett. 2014;231:82-91
49. Liu R, Liu X, Zheng Y, Gu J, Xiong S, Jiang P. et al. MicroRNA-7 sensitizes non-small cell lung cancer cells to paclitaxel. Oncol Lett. 2014;8:2193-200
50. Hanahan D, Weinberg RA. Hallmarks of cancer: the next generation. Cell. 2011;144:646-74
51. Liu H, Wu X, Huang J, Peng J, Guo L. miR-7 modulates chemoresistance of small cell lung cancer by repressing MRP1/ABCC1. Int J Exp Pathol. 2015;96:240-7
52. Chou YT, Lin HH, Lien YC, Wang YH, Hong CF, Kao YR. et al. EGFR promotes lung tumorigenesis by activating miR-7 through a Ras/ERK/Myc pathway that targets the Ets2 transcriptional repressor ERF. Cancer Res. 2010;70:8822-31
53. Webster RJ, Giles KM, Price KJ, Zhang PM, Mattick JS, Leedman PJ. Regulation of epidermal growth factor receptor signaling in human cancer cells by microRNA-7. J Biol Chem. 2009;284:5731-41
54. Park S, Shimizu C, Shimoyama T, Takeda M, Ando M, Kohno T. et al. Gene expression profiling of ATP-binding cassette (ABC) transporters as a predictor of the pathologic response to neoadjuvant chemotherapy in breast cancer patients. Breast Cancer Res Treat. 2006;99:9-17
55. Kawahara T, Ide H, Kashiwagi E, Patterson JD, Inoue S, Shareef HK. et al. Silodosin inhibits the growth of bladder cancer cells and enhances the cytotoxic activity of cisplatin via ELK1 inactivation. Am J Cancer Res. 2015;5:2959-68
56. Smedberg JL, Smith ER, Capo-Chichi CD, Frolov A, Yang DH, Godwin AK. et al. Ras/MAPK pathway confers basement membrane dependence upon endoderm differentiation of embryonic carcinoma cells. J Biol Chem. 2002;277:40911-8
57. Katsuoka F, Motohashi H, Engel JD, Yamamoto M. Nrf2 transcriptionally activates the mafG gene through an antioxidant response element. J Biol Chem. 2005;280:4483-90
58. Katsuoka F, Yamamoto M. Small Maf proteins (MafF, MafG, MafK): History, structure and function. Gene. 2016;586:197-205
59. Kilic U, Kilic E, Tuzcu Z, Tuzcu M, Ozercan IH, Yilmaz O. et al. Melatonin suppresses cisplatin-induced nephrotoxicity via activation of Nrf-2/HO-1 pathway. Nutr Metab (Lond). 2013;10:7
60. Li W, Yu S, Liu T, Kim JH, Blank V, Li H. et al. Heterodimerization with small Maf proteins enhances nuclear retention of Nrf2 via masking the NESzip motif. Biochim Biophys Acta. 2008;1783:1847-56
61. Motohashi H, Katsuoka F, Miyoshi C, Uchimura Y, Saitoh H, Francastel C. et al. MafG sumoylation is required for active transcriptional repression. Mol Cell Biol. 2006;26:4652-63
62. Schembri F, Sridhar S, Perdomo C, Gustafson AM, Zhang X, Ergun A. et al. MicroRNAs as modulators of smoking-induced gene expression changes in human airway epithelium. Proc Natl Acad Sci U S A. 2009;106:2319-24
63. Yang H, Li TW, Peng J, Mato JM, Lu SC. Insulin-like growth factor 1 activates methionine adenosyltransferase 2A transcription by multiple pathways in human colon cancer cells. Biochem J. 2011;436:507-16
Author contact
![]() Corresponding authors: Inmaculada Ibanez de Caceres and Javier de Castro, Cancer Epigenetics Laboratory, INGEMM, Biomarkers and Experimental Therapeutics in Cancer, IdiPAZ, Paseo de la Castellana 261, Madrid, 28046, Spain Phone 34-91-5854404 Fax 34-91-5854401 E-mail: inma.ibanezcamadrid.org
Corresponding authors: Inmaculada Ibanez de Caceres and Javier de Castro, Cancer Epigenetics Laboratory, INGEMM, Biomarkers and Experimental Therapeutics in Cancer, IdiPAZ, Paseo de la Castellana 261, Madrid, 28046, Spain Phone 34-91-5854404 Fax 34-91-5854401 E-mail: inma.ibanezcamadrid.org