Impact Factor
- Issue 12; 2026
- Issue 11; 2026
- Issue 10; 2026
- Issue 9; 2026
- Issue 8; 2026
- Volume 16; 2026
- Advance Articles
- Past Issues
- Cover Images
- Cover Suggestion
- Index & Coverage
- Special Issues
Introduction
Results
Discussion
Methods
Supplementary Material
Acknowledgements
Abbreviations
References
International Journal of Biological Sciences
International Journal of Medical Sciences
 Global reach, higher impact

Theranostics 2017; 7(9):2417-2430. doi:10.7150/thno.19172 This issue Cite
Research Paper
Vibrational Profiling of Brain Tumors and Cells
Sultan L Nelson2*, Dustin T Proctor1*, Ahmad Ghasemloonia1*, Sanju Lama1, Kourosh Zareinia1, Younghee Ahn3, Mustafa R Al-Saiedy2, Francis HY Green4, Matthias W Amrein2 ![]() , Garnette R Sutherland1
, Garnette R Sutherland1 ![]()
1. Project neuroArm, Department of Clinical Neuroscience and the Hotchkiss Brain Institute, University of Calgary, 3280 Hospital Dr. NW, Calgary, AB, T2N 4Z6, Canada.
2. Department of Cell Biology and Anatomy, University of Calgary, 3280 Hospital Dr. NW, Calgary, AB, T2N 4Z6, Canada.
3. Department of Pediatrics, Alberta Children's Hospital Research Institute, University of Calgary, Calgary, AB, T2N 4N1, Canada.
4. Department of Pathology and Laboratory Medicine, University of Calgary, 3280 Hospital Dr. NW, Calgary, AB, T2N 4Z6, Canada.
* S.L.N., D.T.P., and A.G. contributed equally to this work.
Received 2017-1-13; Accepted 2017-3-31; Published 2017-6-22
Abstract

This study reports vibration profiles of neuronal cells and tissues as well as brain tumor and neocortical specimens. A contact-free method and analysis protocol was designed to convert an atomic force microscope into an ultra-sensitive microphone with capacity to record and listen to live biological samples. A frequency of 3.4 Hz was observed for both cultured rat hippocampal neurons and tissues and vibration could be modulated pharmacologically. Malignant astrocytoma tissue samples obtained from operating room, transported in artificial cerebrospinal fluid, and tested within an hour, vibrated with a much different frequency profile and amplitude, compared to meningioma or lateral temporal cortex providing a quantifiable measurement to accurately distinguish the three tissues in real-time. Vibration signals were converted to audible sound waves by frequency modulation, thus demonstrating, acoustic patterns unique to meningioma, malignant astrocytoma and neocortex.
Keywords: brain tumor, vibration, Atomic Force Microscope, metabolism, tumor margin, nanomotion detector.
Introduction
Maximizing resection of brain tumor to prevent recurrence while preserving function is a key goal for neurosurgeons, which requires high-precision mapping of the tumor-brain interface. However, optimal surgical resection may be limited by the challenge of differentiating normal healthy brain tissue from that infiltrated by tumor cells (1, 2). As a result, resection is invariably incomplete and for glioma, tumor recurrence inevitable. This is further complicated by location of the tumor and its proximity to eloquent structures (3). While techniques of tissue interrogation for resolving the brain-tumor interface are evolving, e.g. Raman spectroscopy (4), positron emission tomography (PET) (5), MR spectroscopy (6) and 5-Ala fluorescence guided surgery (7), they are not without significant challenges or limitations (e.g. local properties or low sensitivity). Furthermore, no existing technology or those under development can definitively characterize tumor type or its malignancy grade. A precise diagnosis still relies on a qualitative post-surgical histopathological and genetic characterization. This precludes any immediate action that may have been beneficial during surgery, and also delays the use of other adjuvant treatments where indicated.
The atomic force microscope (AFM) is an important device for studying the mechanical and structural properties of cells that include Young's modulus (8, 9), high-resolution surface imaging (10, 11), molecular adhesion forces of cellular components (12) and even molecular-scale pharmacological interactions (13). Contact-AFM methods have also been described for recording membrane fluctuations of single cells. The first example reported by Pelling et al. 2004, described dominant frequency peaks at 1-1.6 kHz for Saccharomyces cerevisiae (14). On the contrary, capturing nanoscopic oscillations from mammalian cells likely at least an order of magnitude lower both in amplitude and power than for yeast has remained a significant challenge to the field. However, recent improvement to manufacturing more sensitive cantilevers has now made it possible to measure fluctuation of soft biological samples. Consequently, fluctuations have now been stated for cultured mammalian cells adherent to a cantilever (15, 16), and although not tested in these recent studies, confirm vibrational profiling of soft mammalian cells would be possible using existing AFM technology.
Despite capacity to detect nanoscale oscillations from mammalian cells, contact-AFM remains limited to recording fluctuations from a small region of interest (direct interface point between the cantilever tip and sample). This is of particular concern as local mechanical properties vary considerably from point to point across the surface of a cell. Hence fluctuations recorded for classical contact-AFM techniques cannot be representative of properties for the whole cell. Conversely, a contact-free AFM system could examine the complete profile of vibration resonating from a cell and would give a more accurate measure of cell fluctuations. It would also permit the study of nanoscale fluctuations for more complex systems that include tissues and circumvent problems of probing regions of cellular heterogeneity when assessing tumorous tissue. A contact-free AFM technique in liquid media would require the cantilever at a distance to detect sound or oscillatory flow produced from the nanomotion of the biological source in fluid. Importantly, a series of studies have experimentally validated this concept, demonstrating optically trapped nanoparticles are capable of detecting nanoscale vibrations as sound or fluid flows when placed in close proximity to a vibrating particle source or flagellated bacteria (17-19). Although a more sensitive technique than AFM, accommodating large tissues that would be necessary for clinical interrogation of tumors would be a challenge to currently available optical trapping systems and this was the key deciding factor for pursuing an AFM based approach to interrogating tissues.
The final improvements made to the AFM system detailed in this report were incorporating cantilevers with higher sensitivity and reduced stiffness to published work on mammalian cells to enhance signal-to-noise in our system and improve overall performance. Furthermore, the setup was improved with the inclusion of a spectrum analyzer that allowed the user to assess the whole range of the frequency spectrum being recorded and to direct attention to frequency bands of interest for post-processing analysis. A spectrum analyzer also provides real-time feedback of signals, which is important for rapid characterization of the sample. Using this system we showed that cells and tissue of mammalian origin vibrate with reproducible and distinct frequencies. We have described an example by distinguishing between two anatomically distinct regions of newborn rat brain by both magnitude of fluctuations and vibration spectral patterns. Furthermore, using cultured cancerous cells as an example, we show root mean square (RMS) of oscillations resemble trends of overall mitochondrial respiration activity. Demonstrating application of mitochondrial inhibitors to neuronal cultures leads to a reduction in RMS back to background noise levels supported this relationship.
The clinical potential of this system may be the ability to differentiate various brain tumors (malignant astrocytoma, meningioma) from normal brain (lateral temporal cortex (LTC)) on the basis of their vibration profile. We have also described a method to convert oscillation signals into sound within the frequency range of human hearing. This study presents data and novel concepts that could potentially translate into intelligent interrogation devices for rapid discrimination of tissues and tumors in the operating room
Results
Contact-free AFM spectral analysis of cultured rat brain cells
A main objective of this study was to set up an AFM system capable in recording the nanoscale force fluctuations excited due to vibrations from tissues and cells. To achieve this, we used an AFM setup in the contact-free mode. The complete AFM setup used in our study is detailed in (Fig. 1A). A JPK NanoWizard® II AFM (JPK Instruments AG, Germany) was housed in a custom assembled isolation chamber maintaining constant temperature and 5% CO2/ 95% atmospheric air levels. Barriers were used to minimize and account for external acoustic and vibrational noise. Post-processing analysis of vibration data was conducted offline. However, the AFM was connected to a spectrum analyzer providing intuitive real-time access to identify samples with vibration patterns to accelerate time required to carry out experimental protocols. For consistency, the system was calibrated before each experiment day. Before each experiment the stiffness of cantilevers (BL-RC-150VB) was confirmed to be comparable to the 0.005 ± 0.0005 N/m stiffness stated by the manufacture (Olympus) (see Methods). Internal baseline vibration in the system was logged as signal recorded from extracellular bath solution (EBS) containing no sample. Fast Fourier Transform (FFT) of the cantilever deflections in the frequency domain revealed some expected mains power interference at 120 Hz and higher harmonics thereof (Fig. S1A). These harmonics were filtered out with band-stop filtering (S1B) of the signal and the RMS was compared between filtered (2.88±.16 nm) and unfiltered (2.60±.28 nm), which demonstrated contribution of this interference to RMS in subsequent test was negligible (Fig. S1C). Similarly, the effect of modest temperature changes on baseline RMS was examined. A comparison of baseline RMS values recorded at 21ºC (1.25 ± 0.12 nm) and at 37 ºC (1.32 ± 0.04 nm) confirmed small temperature variation has no effect on cantilever probes used (Fig. S1D). This was in agreement with Smith et al. 1995 (20).
AFM contact-free detection system to measure cell culture and tissue vibration. (A) Schematic of contact-free AFM detection system to measure tissue vibration and example light microscope images of cantilever approaching single hippocampal neurons in culture and hippocampal tissue pieces in recording solution. The probe is placed ~15 µm from the bottom surface of the dish. A planar wave propagation emanating from the sample is depicted as lines. Note: the cantilever, sample and waves are not drawn to scale. Laser deflecting off the cantilever tip is detected by a photodiode sensor and analyzed with the JPK AFM system and real-time spectrum analyzer to produce force deflection curve and frequency power spectrum plots respectively. (B) Representative time-domain deflection plots for empty dish containing no cells, a single hippocampal pyramidal neuron grown in culture for 1 week at resting state, and a hippocampal neuron treated with NaN3. The deflection RMS for each condition is quantified in the bar graph in B. (C) Sample Fast Fourier Transform (FFT) plots for each corresponding condition is shown. (D) An increase in cell vibration for neurons cultured from one to two weeks is evident in the quantified RMS bar graph (lower panel) and a major frequency peak at ~3.4 Hz was present in hippocampal neurons in two week cultures (top panel). FFT powers are represented as arbitrary units (A.U.). Bars in deflection plots represent mean RMS values ± SEM. *** represents p < 0.001 Tamhane post hoc test. Scale bar = 30 μm.
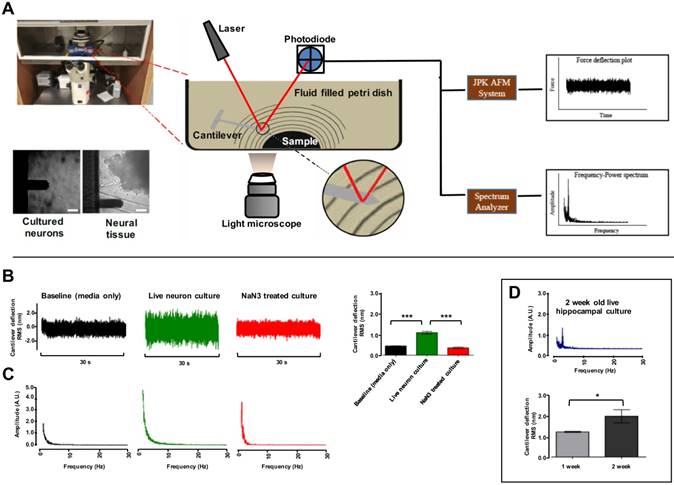
The utility of the system was first tested by examining fluctuation of P0 rat hippocampal pyramidal neurons cultured for one or two weeks. Representative images of hippocampal cultures at one and two week in culture are included in Figure S2. For each cell culture experiment, the cantilever tip was positioned at ~15 μm from the bottom surface of dishes cell (Fig. 1A). Force fluctuations were logged for cells under resting conditions and compared to cells treated with 1 mM cytochrome oxidase inhibitor NaN3 to block mitochondrial activity. This experimental paradigm was chosen as that the magnitude of cell oscillations is thought associated to metabolic activity (14, 15, 21). Representative cantilever deflection traces are depicted in (Fig. 1B). Live untreated hippocampal neurons showed an average RMS value of 1.09 ± 0.062 nm (n = 27 neurons) compared to NaN3 treated [0.36 ± 0.038nm (n = 12)] and empty dish (containing EBS only) [0.44 ± 0.007 nm (n = 9)] (Fig. 1B-Bar graph). Granular neurons in cerebellar cultures had a similar result (n = 3) (Fig. S3). FFTs were performed on each of the recorded signals to identify patterns in the mechanical oscillation. Representative frequency spectrums are shown in (Fig. 1C). No dominant peaks were apparent in the frequency range observed for neurons cultured for 1 week (Fig 1C), but ~10 % of neurons cultured for 2 weeks demonstrated a ~3.4 Hz major frequency peak (Fig. 1D). Interestingly, this result followed the observation that some neurons in cultured networks at resting state spontaneously fire with synchronicity after 2 weeks in vitro (22, 23), and we would expect this frequency to continue to change if cultures were left to grow for longer and allowed to mature (24). Similarly, RMS of cantilever deflections was higher for neurons grown for 2 weeks (n = 3) compared to one-week-old cultures (n = 3) (Fig. 1D-Bar graph). These data describe an ultra-sensitive, label- and contact-free method to monitor cellular oscillations in neurons, and demonstrate for the first time neurons in culture vibrate with highly specific frequency.
Region specific vibration analysis of the newborn rat brain
Building on the promising results in neuronal cultures, we next examined force vibrations resonating from tissues that were used for corresponding cell culture preparations. For each experiment approximately 8×106 μm3 pieces (W, L, H ~ 200 μm each) were excised from hippocampus or cerebellum of newborn rat brains, taking care to maintain consistent tissue dimensions. However, we observed no effect on frequency spectra with modest changes in the tissue volume (Fig. S4).
For each tissue vibration experiment, the cantilever tip was positioned at a distance of ~ 15 µm from the bottom surface of the dish and ~ 5 µm laterally displaced from tissue samples at a distance of 15 μm from the tissue (Fig. 1A). A sensitivity study implementing the Stokes law of sound attenuation conducted on a range of cantilever-tissue gap distances from contact to 5, 10, and 15 μm with the assumption of Newtonian medium and planar wave propagation occurring from the tissue to the cantilever. Given  ,
,  and
and  , constant sound's frequency and substituting the Stokes rate (
 in
in  negligible Stokes rate causes the exponential coefficient to be very close to 1 and therefore no attenuation of the amplitude recorded over the distance. Importantly, experimental tests using the AFM setup for the distances evaluated above (0-15 μm) demonstrated no attenuation to the RMS of the time domain values or a change to frequency patterns for any of the non-contact gap distances when compared to the classical cantilever-sample contact approach (Fig. S5). Indeed, confirmation that the experimental setup was detecting planar wave propagation was expected given the ratio of tissue dimensions to the distance between the tissue and cantilever is considerably high. We could confidently rule out spherical wave propagation and dissipation of intensity over the distances and cantilever positioning with respect to sample that is used in this setup.
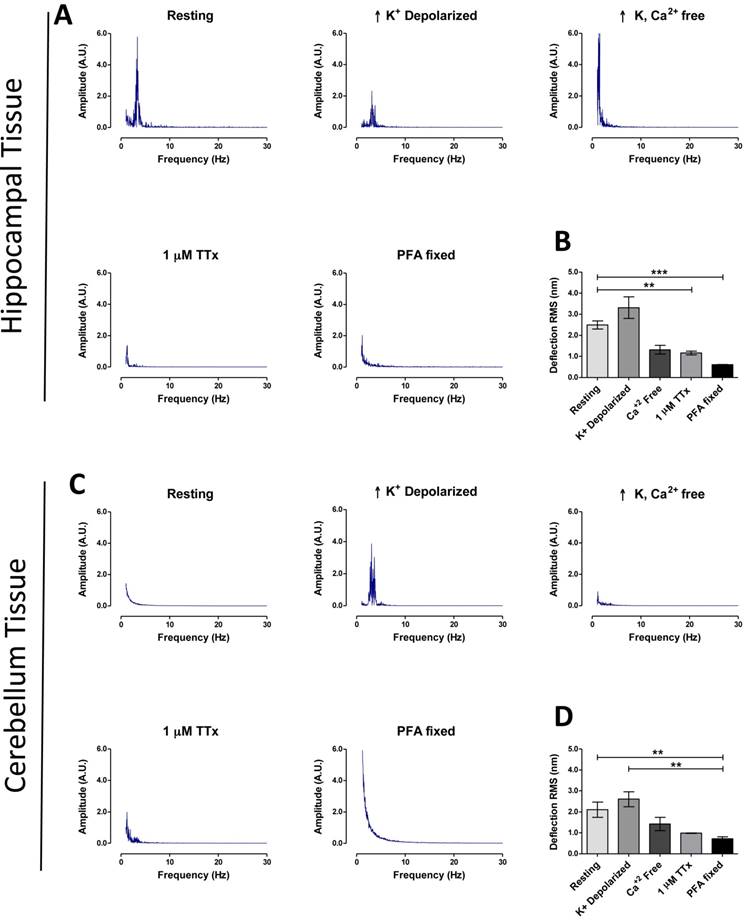
Using the above parameters for measurement, hippocampal tissue showed a higher basal activity RMS (2.49 ± 0.19 nm, n = 43) of fluctuations (Fig. 2B), compared to cerebellum tissue (2.10 ± 0.37 nm, n = 14) (Fig. 2D), plus FFT revealed a major peak at ~3.4 Hz in hippocampal tissue, but not in cerebellum (Fig. 2A&C). As predicted RMS values for tissues were higher (+ 228 % for hippocampus, + 233 % cerebellum) when compared to cultured neuron deflection RMS data at resting state (P < 0.001, Tamhane test). No ~3.4 Hz peak was detected in hippocampal tissue fixed with 4% PFA or for a non-biological compound of comparable stiffness to brain tissue (1% agarose gel), nor were RMS values comparable to live tissue in these two cases (Fig. S6).
Brain region specific tissue vibration patterns. Representative frequency spectrums for hippocampal tissues (A) and cerebellum tissues (C), according to treatment condition as labeled (resting, high K+ depolarization, high K+ buffer without Ca2+, 30 min 1 μM TTx treatment and 4% PFA fixation). (B and D) Representative time-domain deflection plots for each condition are quantified in the bar graph B - hippocampus and D - cerebellum. Power of frequency spectrums is represented as arbitrary units (A.U.). Bars in deflection plots represent mean RMS values ± SEM. *** and ** represents p < 0.001 and p < 0.01 respectively, Tamhane post hoc test.
These results confirm that this system is capable of recording vibration force patterns in live ex-vivo neural tissue according to brain region with high reproducibility. This method can also identify specific frequency peaks in live tissue that are associated with biological activity which was demonstrated by the ~3.4 Hz major peak observed in rat hippocampus.
Deciphering biological properties of vibration spectral peaks with pharmacology
The next set of experiments explored the potential of our system for studying mechanisms of biological function using pharmacological agents. In the first experiment rapid neuron firing was triggered by transfer of tissues at resting state (EBS only) into a high-K+ buffer. High-K+ depolarization of hippocampal and cerebellum tissue increased the mean RMS to 3.31 ± 0.503 nm (n = 22) and 2.61 ± 0.289 nm (n = 7) respectively (Fig. 2A and 2C). The ~3.4 Hz major frequency peak remained present in the FFT of depolarized hippocampus, but more interestingly a ~3.4 Hz major frequency peak was now present for depolarized cerebellum that was absent in the resting state (Fig. 2C). We next blocked neuronal activity using two pharmacological methods (removal of extracellular Ca2+ or incubating tissue with 1μM Tetrodotoxin (TTx)) and studied the effect on tissue vibration. In both conditions the ~3.4 Hz major peak present in the depolarized tissue frequency spectrum disappeared (Fig. 2A and 2C). Similarly, RMS values decreased [hippocampus; Ca2+-free: 1.32 ± 0.21 (n = 8), TTx: 0.97 ± 0.362 nm (n = 22), cerebellum; Ca2+-free: 1.42 ± 0.32, TTx: 0.99 ± 0.013 nm (n = 6)] (Fig. 2B and 2D). These experiments show a possible connection between the ~3.4 Hz peak and neuronal firing in tissue, and although this result will require further justification using another technique such as electrophysiology, it demonstrates the potential of the system to investigate cellular mechanisms and further clinical importance of the system as a real-time drug testing platform.
Cultured brain tumor cell vibration and mitochondrial respiration
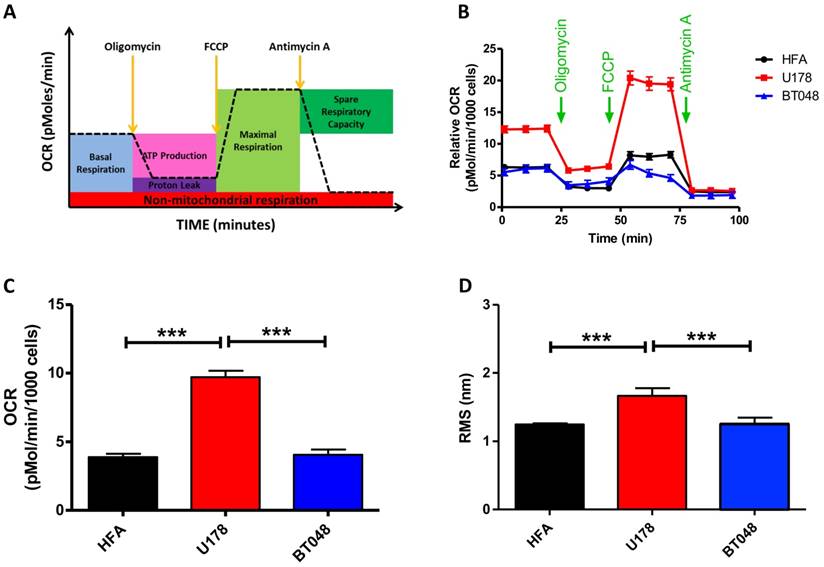
We next explored the clinical potential of AFM's contact-free mode vibration detection by first testing its effectiveness in distinguishing between cancer cell lines. A fast growing glioma cell line (U178, n = 16), slow growing brain tumor initiating cells (BT048, n = 18) and human fetal astrocytes (HFA, n = 18) that is a common control cell line for brain tumor research, were analyzed. FFTs did not reveal any major frequency peaks for any cell type. However, fast growing U178 cells exhibited significantly higher RMS compared to slow growing BT048 and HFA cells (Fig. 3D). Accumulating evidence suggests the magnitude of cell fluctuations reflect overall cellular metabolic activity (21). Indeed, we observed significantly reduced RMS values in cultured neurons treated with a mitochondrial inhibitor (Fig. 1B). However, a direct correlation between metabolic activity and cellular oscillation in untreated cells has not been confirmed. Therefore, we next performed bioenergetics experiments on each cell line using an FXe24 analyzer (Seahorse Biosciences). An example of the experimental workflow and oxidative respiration data that can be acquired is illustrated in Fig. 3A. Application of agents targeting the mitochondrial electron transport chain demonstrated U178 cells to be in a higher metabolic state and of have a higher metabolic capacity then BT048 and HFA cells (Fig. 3B). However, in this study we were interested in comparing RMS to untreated basal mitochondrial respiration. Untreated U178 cells showed basal metabolic activity, as indicated by oxygen consumption rate of ~200% above other untreated cell lines. No differences were observed in oxygen consumption rates between BT048 and HFA cells (Fig. 3C). Importantly, this was in agreement with RMS data (Fig. 3D). A direct correlation between cell metabolism and vibration will require testing additional cell-lines and actions of additional metabolic inhibitors on RMS, outside the scope of this preliminary report. We speculate on the potential of contact-free AFM in probing mitochondrial respiration of cancer cells in culture with different growth rates. Future investigations in this area will be of interest in evaluating the utility of this technology in evaluation of cancer aggressiveness or monitoring response of patient cancers to therapy.
Brain tumor cell-line oxygen consumption rates and RMS. RMS values resemble oxygen consumption rates for brain tumor cell-lines at resting basal conditions (A) Schematic representation of the bioenergetic experimental workflow and mitochondrial respiration data that is obtained. (B) Oxygen consumption rate (OCR) profiles are shown for each cell-line (fast growing glioma cell line (U178), slow growing cell line BT048 and human fetal astrocytes (HFA)). Green arrows indicate the time of addition of oligomycin (1 μg/ml), FCCP (0.5 μM), and antimycin A (1 μM) to evaluate different states of mitochondrial respiration. Graph shows average of 2 plates and each plate has 6-8 replicates. (C) The bar graph shows quantified OCRs (basal mitochondrial respiration) of each untreated cell line (before application of oligomycin. At basal conditions (resting state), OCR data follow a similar trend observed for deflection RMS plots of untreated cells. Data are expressed as mean ± S.E.M. (D) Bar graph depicting mean deflection RMS of untreated cultured cancer cell lines. Fast growing U178 cells have a higher RMS of vibration compared to a slow growing BT048 cells and HFA cells.
Vibration recording from brain tumors and neocortex
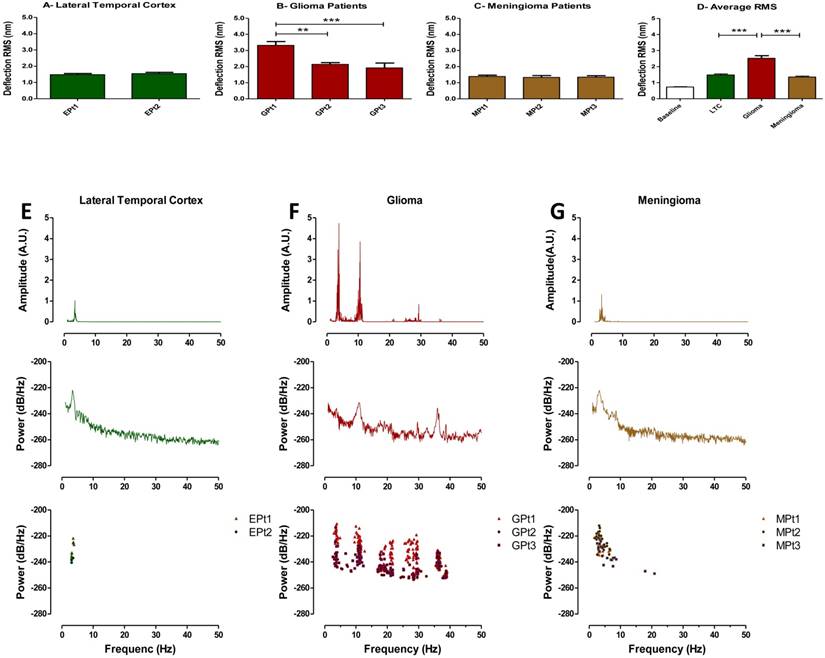
Metabolic characterization of brain tumors may reflect tumor aggressiveness and is important in making effective treatment decisions (25, 26). Therefore, tissue vibration analysis may have important diagnostic value as it provides an assessment of metabolic activity in real time. Following our result that indicating a relationship to exist between basal RMS and mitochondrial respiration in untreated tumor cell cultures, we next obtained fresh brain tumor samples from surgical resections and recorded their vibration profile. To evaluate the method, we compared force vibration signals between specimens from three patients with malignant astrocytoma and three with meningioma. Tissue from lateral temporal neocortex taken during the removal of medial temporal lobe epileptic foci, from two patients was used as control. Patient information is detailed in Table 1. As expected, RMS of fluctuations was significantly greater for the malignant astrocytoma specimens, which are known to be highly metabolically active (Fig. 4D). Interestingly, RMS values were consistent between patient tissues for meningiomas and controls, but variance in RMS was observed between malignant astrocytoma tissues (Fig. 4A-C). Perhaps, these results are reflective of the heterogenic nature of malignant astrocytoma, often characterized by presence of necrotic foci, and may have been in the samples we have recorded from. Furthermore, given the small sample size in the study, differences in patient age, genetic characterization may also be important factors in the observed RMS variability in astrocytoma samples. While we acknowledge a more direct method to measure the metabolic state of each tissues is necessary to validate these assumptions, it is exciting to speculate that RMS might be useful to indicate brain tumor metabolism in real-time.
Patient characteristics and pathology:
| Case# | Age/Sex | Description-Pathology |
|---|---|---|
| GPt1 | 44y/M | Astrocytoma WHO Gr 3 |
| MPt1 | 52y/M | Atypical meningioma WHO Gr 2 |
| GPt2 | 69y/F | Astrocytoma WHO Gr 4 |
| MPt2 | 58y/F | Meningioma WHO Gr 2 |
| GPt3 | 36y/M | Astrocytoma WHO Gr 4 |
| MPt3 | 47y/F | Meningioma WHO Gr 1 |
| EPt1 | 40y/F | Mesial temporal epilepsy, specimen - Right lateral temporal cortex |
| EPt2 | 28y/M | Mesial temporal epilepsy, specimen - Left lateral temporal cortex |
Time domain RMS and Welch spectral analysis of brain tumor patients. Quantified RMS values according to patient (Pt) and brain types are depicted in (A) LTC (Lateral temporal cortex), (B) glioma (malignant astrocytoma) and (C) meningioma for each patient studied. (D) Average deflection RMS for all human LTC, malignant astrocytoma and meningioma tissues obtained from the operating room is compared to baseline RMS recording. (E-G) Top panels: Representative FFT plots of force vibrations of LTC, malignant astrocytoma and meningioma. Middle panels: Representative Welch's power spectral density of LTC, malignant astrocytoma and meningioma. Lower panels: Scatter plots of dominant frequency peaks from all patient samples of LTC, malignant astrocytoma and meningioma demonstrating consistent spectral results between patients. FFT powers are represented as arbitrary units (A.U.). Bars in deflection plots represent mean RMS values ± SEM.
Vibrational spectral characterization of brain tumors and neocortex
We next performed spectral analyses of the brain tumor and cortex tissue vibrations. Meningioma spectra showed a narrow cluster of peaks at 4.23±1.65 Hz (n = 3 patients), whilst malignant astrocytoma showed a group of peaks at (3.65±0.29, 11.01±0.51, 18.48±0.76, 28.29±1.38 & 36.30±0.28 Hz), (n=3 patients) and a distinct cluster of peaks at 3.38±0.29 Hz (n=2 patients) was ascribed to lateral temporal cortex (Fig. 4E-G top panels). The frequency peak ranges for meningioma and lateral temporal cortex overlapped. However, meningioma demonstrated a much broader peak cluster compared to the lateral temporal cortex allowing differentiation between these two signals. The frequency bands of these frequency clusters are depicted in normal probability plots (Fig. S6). To detect dominant frequency peaks and reduce the background noise, Welch's Power Spectral Density function of each force signal was calculated (Fig 4E-G middle panels). Welch's PSD had the advantage of averaging the signal which enabled us to reduce the effect of noise in power spectrum plots. The Welch parameters were trace mode set to “mean” with a Hamming window. Scatter plots of dominant frequency peaks extracted from Welch's plots for each of the tissue specimens are depicted in (Figure 4E-G bottom panels). Most importantly, each spectrum profile was consistent between patients with the same class of tumor, confirming tumors demonstrate a unique signature frequency pattern that discriminates brain tumors by type and from lateral temporal cortex tissue by a quantitative measurement.
Acoustic profiling of brain tumors and neocortex
Characterizing cancers by their individual vibration pattern could prove to be an important tool in cancer diagnostics. However, simplifying steps to interpret vibrational spectra results would be necessary for clinical translation of this observation. Therefore we next applied demodulation techniques to convert recorded tissue vibration signals into audible sound (Supplementary Information; Wave Files: 1-Malignant Glioma, 2-Meningioma and 3-Lateral Temporal Cortex). Since the distinguishing frequency clusters for each of the tumor and cortical tissues were below the audible range, the signals were modulated with an audio frequency-shift keying method (shifting the pitch) at baseband frequencies within the hearing range (27). This technique alters the pitch of an audio digital signal, so the listener can easily distinguish unique cancer sounds without requiring a high-quality speaker. To avoid clipping, signals were first normalized prior to the modulations. This work describes one plausible way complex vibrational spectral analysis of tumors can be translated into a medium that medical specialists including surgeons, pathologist or technicians could use to interpret and differentiate tumors from healthy brain tissues without extensive training.
Discussion
Surgical resection remains the primary modality of treatment for brain tumors. For many brain tumors, in particular glioma, the differentiation of normal tissue from that infiltrated by tumor remains problematic (28, 29). This usually results in incomplete tumor removal, which adversely impacts clinical outcome, as tumor recurrence is inevitable (28-30). Therefore, tools that enable surgeons to differentiate normal from tumor tissue during surgery, would have considerable clinical relevance. In this study we applied AFM technology in a contact-free mode to measure nanoscale biological vibration from cells and tissues. The results showed a capacity to differentiate malignant astrocytoma from meningioma or lateral temporal cortex based on the vibration pattern (frequency domain behavior). Furthermore, we have converted vibration patterns to sound files to allow for a novel acoustic awareness of abnormal tissue, that if translated to the operating room, could provide a third dimension of sound, in addition to vision and touch during the process of differentiating abnormal from normal tissue in surgery. While this technique was developed for brain tumors, it can be speculated the technique might be used for tumor margins for other systemic cancers.
Research on differentiating cancer tissue from healthy tissue and methods to implement these techniques in the operating room are evolving (7, 31). Magnetic resonance elastography studies have shown that local stiffness of cancerous tissue compared to surrounding healthy brain tissue is different and the magnitude of this difference may be an indicator of cancer progression (32, 33). At the cellular level, magnetic bead twisting (34, 35) and optical tweezers (36, 37) have been implemented to evaluate differences between healthy and cancerous cells (38). Cell stiffness has also been used as a measure for distinguishing metastatic cancer cells ex-vivo by contact-mode AFM (39, 40). While each of these techniques have shown promise in differentiating tumor and brain cells, the utility of these techniques are greatly limited because they require cells to be probed individually, an impractical proposition during surgery. Moreover, local stiffness values can vary considerably across the surface of cells and tissues (41-43). However, with the contact-free vibration detection technique, a signal intrinsic to the whole tissue is measured. A more global assessment of the surgical site is therefore possible, as well as the possibility to hone in on cancerous regions of the surgical site. Limitations related to non-uniform biological surfaces are also avoided and profiling highly heterogeneous tumors e.g., malignant astrocytoma (44-46), would be achievable with more broad signal evaluation. Indeed we found variance in biological motion between malignant astrocytoma specimens with contact-free AFM that highlights the potential of the system to evaluate potential tissue heterogeneity. Avoiding problems associated with variable local surface stiffness played a significant role in this accomplishment.
Importantly, it was the additional frequency spectra analysis conducted on recorded fluctuations that separated this technique from predecessor technologies used to probe biophysical properties of cancerous cells and tissues, which allowed us to discriminate tumors and tissues with high reproducibility and accuracy even in the presence of highly heterogeneous tissue regions. The distinctive feature of vibrational analysis makes possible to isolate specific frequency patterns from overall fluctuation recordings that are unique to specific biological processes or tissue types. This turned out to be particularly important for identifying meningioma from healthy tissue, which could not be distinguished by amplitude of fluctuations (RMS). Irrespective of RMS readings, each brain tumor and cortical specimen displayed a remarkably consistent frequency peak signature. Given we have shown a method to convert these vibration signatures into sound, if this technology where translated to the operating room perhaps a surgeon could use this feature in the form of a scanning probe, allowing the removal of tumor tissue until the sound profile of cancerous tissue was no longer apparent. While clinical translation of this concept may not be feasible using the current AFM setup, for a surgeon to interrogate tissue during surgery, devising a self-sensing piezoresistive cantilever assembled on a chip holder at the end effector of a medical robot could be a possibility. Such a device would not only record nanoscale tissue vibration but also resolve problems associated with a bulky AFM setup and potential laser hazards. However, the AFM system in its current form would require setup in a space adjacent to the operating room would provide the surgeon with diagnostic information on the tissue within ~10 minutes. This could be a major improvement to current neurosurgical intraoperative consultation turnaround times for histopathology, which currently range from 30-60 minutes. Furthermore, preliminary histology reports conducted in this timeframe for brain tumors are often inconclusive and provide only a qualitative assessment, whereas vibration profiling is a quantitative measurement that can effectively identify tissue type.
The few reports that have used contact-AFM to measure membrane fluctuations in single cultured cells have implied that amplitude of fluctuations might correlate to cellular metabolism (15, 21). Studying metabolism is greatly important in cancer research as cancerous cells maintain a state of high metabolic output in order to sustain uncontrollable cell proliferation and understanding the mechanisms affected might offer ways of treating cancers (47). Accordingly, drugs that target metabolic pathways stopping energy synthesis are known to be very effective chemotherapeutic agents. Tumor metabolic activity is often a reflection of a tumors' aggressiveness and can be used as a prognostic predictor. Furthermore, measuring metabolism is important for identifying tumors in the body by imaging methods that include fluorodeoxyglucose positron emission tomography (FDG-PET) (48-50).
In this study we evaluated RMS of fluctuations as a possible indicator of cellular metabolism. In agreement with previous AFM studies (15, 21), RMS was significantly reduced for cells in culture after treatment with the mitochondrial inhibitor, sodium azide. However, similar to previous reports, this method is unable to determine whether fluctuations changes were a reflection of overall metabolism changes or solely the result of inhibiting specific cellular components targeted by the drug. This prompted us to perform bioenergetic experiments on cancerous cell-lines in culture to obtain a quantifiable measurement of overall cell metabolism and reveal whether oxygen consumption rates of untreated cells at basal resting conditions, resembled RMS levels in untreated cells. Indeed this was the case, RMS values for cell-lines resembled the pattern of basal oxygen consumption rate. Importantly, little variance in RMS was observed between samples of the same cell-type, demonstrating high reproducibility of the technique across multiple preparations of cell cultures. We propose cellular vibration could be an important tool for studying metabolism in cancer cell culture models, e.g. monitoring RMS changes of cells in response to drug treatment.
Our preliminary RMS data from tumor and cortical tissue specimens certainly points towards RMS as being a reliable measure of tumor metabolism as results followed the metabolism trends of tumor types tested (51, 52). Although we do acknowledge future work must be done to confirm RMS is indicative of metabolism at the tissue level, it is exciting to envision use of this technology not only can provide information on tumor type by unique vibration frequency pattern but might also indicate the metabolic state of a tumor.
Vibrational recording might also prove a useful technique in studying healthy brain function and neural networks. In the rat brain, neuronal firing rates differ substantially between brain regions and development. In newborn rats, the hippocampus is intrinsically more active than the cerebellum as a function of limited neuronal architecture at this time point in the cerebellum whereas some of the pyramidal cell circuitry in the hippocampus is established (53-56). Therefore, we hypothesized if this system was capable of detecting neuronal activity derived patterns in vibration then these two brain regions would be ideal for identifying differences. Indeed this is what we observed, in both hippocampal cultures and tissue a major frequency peak was present but no major frequency peak was identified in cerebellar sample unless chemically depolarized.
A ~3.4 Hz peak was observed in the hippocampal samples. Interestingly, this correlates with reported high amplitude theta oscillations in the hippocampus of neonatal rat pups (57-60) which have been detected even as early as 2-days old (61). Similarly, synchronous bursting rates (1-10 Hz) have been reported in hippocampal cultures by our collaborators and other groups (62-64). Conversely, very little is reported on spontaneous synchronized cell firing within the cerebellum of newborn rat pups. Synchronous firing in the cerebellum requires Purkinje cell innervation by climbing fibers and inferior olivary cells (65, 66) and at P0 these connections have not formed and development of Purkinje cells does not really begin to accelerate until P12 (56). This might offer an explanation for no peak in the frequency spectrum. El Hardy et al. 2015, presented an experimental and theoretical model demonstrating the electrical component of an action potential in a single neuron is accompanied with a mechanical membrane surface wave driven by travelling axoplasmic fluid propagation (67). Such mechanical waves could be responsible for displacement measured by the cantilever in these brain regions and in neuron cultures. However, it should be noted that the contribution of other cells, such as astrocytes, or additional mechanisms present in cultures and tissues that include astrocytic calcium wave propagation in observed vibration has not been investigated and might also explain differences observed between brain regions.
On-the-other-hand, RMS might be a more effective measure of overall neuronal activity with a capacity to detect non-synchronous neuronal firing as well. Interestingly, when activity was blocked by treating tissues with TTx, a decrease in RMS of 80 % from resting state was observed for both brain regions. Importantly, this is the same percent contribution reported for total brain metabolism attributed to neural activity and further supports the idea that RMS levels are correlated to metabolism, and in the brain this is primarily a result of neural activity. It will be important to confirm these theories by adjuvant techniques such as electrophysiology and metabolic characterization.
It should be noted that each tissue and cell vary significantly from one another and one should not compare vibration profiles between each group. Accordingly, whether vibrational analysis will be useful in cell-line studies, remains to be determined. Although no major frequency peaks were present for cell-lines tested, examination of additional cancer cell-lines might lead to the detection of important frequency signatures. However, the observation that brain tumor specimen vibration spectra were not replicated in tumor derived cell-lines, illustrates a general problem of studying cell-line models, that they often do not accurately reflect the primary tumor. This is especially true of malignant astrocytoma tumors, where brain tumor cells in culture are often genetically different from those in the brain as cells respond to different environmental cues. We speculate that vibrational profiling could play a role in rapidly screening cell-lines to detect those that more closely resemble a human brain tumor. Similarly, screening for vibrational profiles could be important in the study of other models that more accurately reflect tumors such as in-vivo tumor models.
In conclusion, utilizing sensitive vibration detection technology, we have obtained unique vibrational and metabolic signatures of brain tumor from cultured cells to tissues, and into the clinical setting. Across multiple levels of testing and validation of the set-up, we have for the first time, provided an acoustic character to glioma, meningioma and neocortex.
Methods
AFM setup and data acquisition
We used a customized JPK NanoWizard® II AFM linked to a spectrum analyzer (RSA3300A, Tectronix) to record tissue vibration. The whole system is schematically described in Figure 1. The setup is comprised of three parts: An inverted light microscope which is used for a visual inspection of the tissue sample, a force measurement probe (cantilever) which is used to detect vibration, and a spectrum analyzer for real-time spectral analysis. In this case, the spectrum analyzer served to monitor the stability of the vibrational signal prior to recording, and to set an appropriate sampling frequency (2500 Hz). The AFM system and materials were housed in a custom-built incubation chamber that maintained a consistent temperature of 37°C with one exception, for supplemental experiments conducted at 21°C. Likewise, a pump, designed in-house, maintained a 5% CO2 environment. The pump was turned off during recording as it introduced an external source of vibration. The feedback loop was turned off after setting the distance to avoid low-frequency signal leakage into the recordings. For further offline analysis, 30 seconds of force fluctuations were logged from single neurons and brain tumor cells in culture, excised rat brain tissues and malignant astrocytoma, meningioma and neocortex tissue specimens. For each given cell culture and tissue experiments three 30 seconds segments of vibration signals were recorded. For all protocols independent experiments were performed on at least 3 separate biological preparations.
Calibration of the AFM system
System calibrations were carried out as per manufacturing guidelines (JPK user's manual). Briefly, the cantilever's spring constant and resonance frequencies were determined prior to conducting the experiments. The nominal spring stiffness for cantilevers (BL-RC-150VB) of 0.005 N/m provided by the manufacturer (Olympus) was used to compare our experimentally derived spring constants that were determine for each experimental run. We experimentally determined the spring constant for each cantilever used using analysis of thermal noise during AFM system calibration. Soft cantilevers such as the ones used here are susceptible to thermal fluctuations. JPK's AFM software enables the user to calculate resonance frequency of each cantilever in EBS from the thermal noise spectrum recorded. The thermal resonance curve (dominant peak) can be fitted to Lorentz function, which allows calculation of the spring constant. The spring stiffness was experimentally calculated as 0.0049 ± 0.0005 N/m. The nominal resonance frequency of the cantilever was well above the frequency range of interest in this study.
Hippocampal and cerebellar primary cultures and tissue preparation and vibration recording
Dissociated hippocampal and cerebellar neuron and glia co-cultures were prepared from P0 Sprague-Dawley rat pups (Charles River, Wilmington). All experimental protocols were approved by and followed guidelines and standard operating procedures with ethics approval for all cell cultures and animal experiments and protocols obtained from the Health Science Animal Care Committee, University of Calgary. Culture dishes were treated with poly-d-lysine (Sigma-Aldrich, St. Louis) (50 μg/ml working dilution) overnight. Dishes were then washed trice with PBS and incubated for 3 h with mouse laminin (Sigma-Aldrich) at a final concentration of 10 μg/ml. Animals were anesthetized on ice and sacrificed by decapitation. Brains were then removed and placed into ice-cold dissection media (Hank's balanced salt solution supplemented with 8.4 mM HEPES pH 7.2, adjusted to 310-320 mOsm with sorbitol). Selected brain regions, hippocampi and cerebellum, were dissected out and meninges removed. For tissue vibration experiments, approximately 8×106 μm3 pieces from each of these dissected regions were used. For culture preparation, hippocampi and cerebellar were incubated in enzymatic solution with 20 μl/ml of papain for cell dissociation. After 30 min, cells were washed three times growth medium (BME (Invitrogen), supplemented with B27, penicillin, streptomycin and l-glutamine). Cells were triturated using three decreasing calibers of trituration pipettes and plated at 0.25×10⁶ (1 week cultures) 1×10⁶ cells (2 week cultures) per dish in growth medium + 4% fetal bovine serum (Invitrogen). Cultures were maintained with 4% Fetal Bovine Serum (FBS) for the first week to aid in establishment of the cultures; FBS is subsequently reduced to 1 % to restrict growth of the astrocytes.
For tissues and cell vibration recordings the cantilever was positioned at a distance of ~ 15 µm from the bottom surface of the dish and ~ 5 µm laterally displaced from tissue samples. Vibrations were recorded from tissue bathed in the following solutions: Resting state extracellular bath solution (EBS): (in mM) 135 NaCl, 3 CaCl2, 5 KCl, 2 MgCl2, 10 glucose and 5 HEPES, pH 7.4, 315 mOsm. High-K+ depolarization buffer: (in mM) 115 NaCl, 3 CaCl2, 30 KCl, 2 MgCl2, 10 glucose and 5 HEPES, pH 7.4, 315 mOsm. Ca2+-free High-K+ buffer: (in mM) 115 NaCl, 0 CaCl2, 30 KCl, 2 MgCl2, 10 glucose and 5 HEPES, 10 EGTA, pH 7.4, 315 mOsm. Tetrodotoxin (TTx) buffer: EBS + 1 μM TTx and sodium azide buffer: EBS + 1 mM NaN3. After recordings were made on neural tissues, each tissue was fixed for 48 hours in PBS containing 4% paraformaldehyde (PFA) at 4°C then transferred into EBS at 37°C and rerecorded.
Vibration of neurons in hippocampal and cerebellar cultures was recorded for cultures in EBS and in sodium azide buffer. Prior to each tissue or neuron in culture recording, solutions were equilibrated to 37°C in an environment of 5% CO2 and 95% of atmospheric air.
Brain tumor cell line preparation and vibration recording
U178 cells were prepared and maintained in MEM supplemented with 10% fetal bovine serum (FBS) as per (68, 69). HFA cultures were prepared and cultured as per Lawrence et al. (70). BT048s, a BTIC line, were cultured from a resected specimen of a patient's malignant glioma according to Sarkar et al. (71). For, vibration recordings we seeded 50 000 cells/well of the recording petri dish and allowed cells to attach and grow for 24 h. Vibration recordings were taken for each cell line following replacement of growth media with EBS recording solution.
Tumor cell oxygen consumption rate analysis
Oxygen consumption rates (OCR) of the above prepared tumor cells in culture were measured using the Seahorse XF24 Extracellular Flux Analyzer (Seahorse Bioscience, Billerica, MA) according to the manufacturer's instructions. Briefly, 50,000 (HFA, U178 or BT048) cells/well were grown on XF24 cell culture microplates, were switched to assay medium (unbuffered DMEM supplemented with 25 mM glucose, 4 mM glutamine, and 2 mM sodium pyruvate) and incubated without CO2 at 37ºC for 45 min. Next the mitochondrial function assay was performed with sequential injection of oligomycin (1 μg/ml; Enzo, Life Sciences, Brockville, Canada), carbonyl cyanide-4-trifluoromethoxyphenylhydrazone (FCCP; 0.5 μM; Sigma-Aldrich), and antimycin A (1 μM; Sigma-Aldrich) at the indicated time intervals. The XF24 is a fully integrated 24-well instrument that measures in real time the uptake and excretion of metabolic end products. Each XF assay kit contains a disposable sensor cartridge, embedded with 24 pairs of fluorescent biosensors (oxygen and pH), which is coupled to a fiber-optic waveguide. The waveguide delivers light at various excitation wavelengths (oxygen _ 532 nm, pH _ 470 nm) and transmits a fluorescent signal, through optical filters (oxygen _650 nm, pH _ 530 nm) to a set of highly sensitive photodetectors. Each fluorophore is uniquely designed to measure a particular analyte. Optical sensors for oxygen and pH in solid phase on the probe are positioned within the extracellular medium, where they detect real-time changes in oxygen and proton analytes, continuously and reversibly, as cells consume oxygen and extrude protons. Following the experiment cells in each well were counted by staining nuclei with DAPI to obtain accurate OCR per 1000 cells ratios.
Brain tumor and cortex specimen collection and vibration recording
Brain tumor and cortical tissues specimens were collected from patients during surgical resections by neurosurgeons at the Foothills Hospital, Calgary. Approval for collection of human tissue for the study was obtained through the University of Calgary Conjoint Health Research Ethics Board and informed consent was obtained from all patients prior to inclusion in the study. The University of Calgary Conjoint Health Research Ethics Board also scrutinized each experimental protocol in the study to confirm it followed institutional set guidelines and regulations and approval was given before commencement of the study. Upon target identification and dissection to maintain an ideal tumor-brain tissue plane, specimens were obtained from the lesion and sent for histopathology analysis. Additional tumor samples were then obtained from tumor core or lateral temporal cortex during for epilepsy focus removal surgery and dropped on to EBS and vibration analysis was immediately conducted. Following vibration recordings the tissue was fixed in formalin and H&E staining and imaging was performed all tissues. For malignant astrocytoma samples GFAP imaging was also done.
Data analysis
All data analysis in this project was conducted with custom written Matlab codes. The code reads out three repeats of force deflections for each experiment conducted with corresponding segmental times from the recorded raw data. The extracted force deflection signals are then plotted to reveal the time domain vibration patterns. To adjust for cantilever tip drift during recordings we de-meaned the signals. By dividing the force deflection points by spring constants used, we were able to obtain the vertical deflection signals, which then were used to calculate Root Mean Square (RMS) amplitude in the time domain. The customized Matlab program also computes Fast Fourier Transform (FFT) that converts the force deflection signals in the time domain to frequency domain. For spectral analysis, a major frequency peak was defined as frequencies with amplitude 10 db/Hz above the amplitude of their adjacent frequencies in Welch's power spectral density plots. The RMS results and frequency domain spectrums are plotted to compare the different groups.
Converting force signals to audio waves
Since most of the frequency clusters are below 20 Hz for cancer tissues in this study, playing back the original force vibration signals will not provide a distinguishing sound for different cancer types. Therefore, a frequency modulation method (frequency-shift keying) was implemented to transfer the vibration signals (baseband signals) through a sinusoidal carrier to a frequency range above 100 Hz. This sound could then be played back through common low performance speakers. This approach changed the pitch (frequency) of the audio tones. The technique also provided a stronger signal than the amplitude modulation as the signal-to-noise ratio is higher in this method. To avoid clipping effect, the modulated signal was normalized prior to converting to the wave signals.
Statistical analysis
One-way ANOVA was used to compare mean RMS amplitudes in cases where more than two data groups were present. N-values represent biological replicates carried out for each cell-line, primary culture or tissue preparation. For each biological replicate 3 technical replicates were performed. Tamhane post hoc analysis was used to determine statistical significance. Independent t-test were used to compare mean RMS amplitudes were differences between two groups were analyzed. Normal probability plots were used to check the normal distribution of the frequency peak clusters for brain tumor and lateral temporal cortex specimens.
Supplementary Material
Additional File 1Supplementary figures.
Wave File 1-Malignant Astrocytoma.
Wave File 2-Meningioma.
Wave File 3-Lateral Temporal Cortex.
Acknowledgements
We would like to thank Dr. Michael Colicos Lab and in particular Dr. Stephanie Stotz for provided live hippocampal and cerebellar neuron-glia co-cultures, Dr. Tak Fung for statistical consultation, Dr Gregor Kuntze, Dr. Ephrem Zewdie, and for their input in Matlab data analysis. We thank Dr. Wee Yong and Sasobhan Sarkar for providing cancer cell lines and Walter Hader for LTC specimens. Drs. Gerald Zamponi, and Liu Shi Gan for constructive advice in the preparation of the manuscript.
Abbreviations
AFM: Atomic force microscope; RMS: root mean square; PET: positron emission tomography; FFT: Fast Fourier Transform; EBS: extracellular bath solution; TTX: Tetrodotoxin; HFA: human fetal astrocytes; LTC: Lateral temporal cortex.
Competing Interests
The authors have declared that no competing interest exists.
References
1. Sanai N, Berger MS. Glioma extent of resection and its impact on patient outcome. Neurosurgery. 2008;62(4):753-64
2. Wen PY, Kesari S. Malignant gliomas in adults. N Engl J Med. 2008;359(5):492-507
3. Sanai N, Mirzadeh Z, Berger MS. Functional outcome after language mapping for glioma resection. N Engl J Med. 2008;358(1):18-27
4. Jermyn M, Mok K, Mercier J. et al. Intraoperative brain cancer detection with Raman spectroscopy in humans. Sci Transl Med. 2015;7(274):274ra19
5. Roelcke U. PET: brain tumor biochemistry. J Neurooncol. 1994;22(3):275-9
6. Peeling J, Sutherland G. High-resolution 1H NMR spectroscopy studies of extracts of human cerebral neoplasms. Magn Reson Med. 1992;24(1):123-36
7. Stummer W, Pichlmeier U, Meinel T. et al. Fluorescence-guided surgery with 5-aminolevulinic acid for resection of malignant glioma: a randomised controlled multicentre phase III trial. Lancet Oncol. 2006;7(5):392-401
8. Radmacher M. Studying the mechanics of cellular processes by atomic force microscopy. Methods Cell Biol. 2007;83:347-72
9. Mahaffy RE, Park S, Gerde E. et al. Quantitative analysis of the viscoelastic properties of thin regions of fibroblasts using atomic force microscopy. Biophys J. 2004;86(3):1777-93
10. Müller DJ, Dufrêne YF. Atomic force microscopy: a nanoscopic window on the cell surface. Trends Cell Biol. 2011;21(8):461-9
11. Nievergelt AP, Erickson BW, Hosseini N. et al. Studying biological membranes with extended range high-speed atomic force microscopy. Sci Rep. 2015(5):11987
12. Puech P-H, Poole K, Knebel D. et al. A new technical approach to quantify cell-cell adhesion forces by AFM. Ultramicroscopy. 2006;106(8):637-44
13. Lal R, Ramachandran S, Arnsdorf MF. Multidimensional atomic force microscopy: a versatile novel technology for nanopharmacology research. AAPS J. 2010;12(4):716-28
14. Pelling AE, Sehati S, Gralla EB. et al. Local nanomechanical motion of the cell wall of Saccharomyces cerevisiae. Science. 2004;305(5687):1147-50
15. Kasas S, Ruggeri FS, Benadiba C. et al. Detecting nanoscale vibrations as signatures of life. Proc Natl Acad Sci U S A. 2015;112(2):378
16. Wu S, Liu X, Zhou X. et al. Quantification of cell viability and rapid screening anti-cancer drug utilizing nanomechanical fluctuation. Biosens Bioelectron. 2015;14(77):164-73
17. Kirchner SR, Nedev S, Carretero-Palacios S. et al. Direct optical monitoring of flow generated by bacterial flagellar rotation. Appl Phys Lett. 2014;104(9):093701
18. Nedev S, Carretero-Palacios S, Kirchner SR. et al. Microscale mapping of oscillatory flows. Appl Phys Lett. 2014;105(16):161113
19. Ohlinger A, Deak A, Lutich AA. et al. Optically trapped gold nanoparticle enables listening at the microscale. Phys Rev Lett. 2012;108(1):018101
20. Smith DP. Limits of force microscopy. Rev Sci Istrum. 1995;66(5):3191-5
21. Longo G, Alonso-Sarduy L, Rio LM. et al. Rapid detection of bacterial resistance to antibiotics using AFM cantilevers as nanomechanical sensors. Nat Nanotechnol. 2013;8(7):522-6
22. Ivenshitz M, Segal M. Neuronal density determines network connectivity and spontaneous activity in cultured hippocampus. J Neurophysiol. 2010;104(2):1052-60
23. Opitz T, De Lima AD, Voigt T. Spontaneous development of synchronous oscillatory activity during maturation of cortical networks in vitro. J Neurophysiol. 2002;88(5):2196-206
24. Wagenaar DA, Pine J, Potter SM. An extremely rich repertoire of bursting patterns during the development of cortical cultures. BMC Neurosci. 2006;7(1):11
25. Zhu A, Lee D, Fau-Shim H. et al. Metabolic positron emission tomography imaging in cancer detection and therapy response. Semin Oncol. 2011;38(1):55-69
26. Plathow C, Weber WA. Tumor cell metabolism imaging. J Nucl Med. 2008;49(Suppl 2):S43-S63
27. Ghovanloo M, Najafi K. A wideband frequency-shift keying wireless link for inductively powered biomedical implants. IEEE Trans Circuits Syst I Reg Papers. 2004;51(12):2374-83
28. Yordanova YN, Moritz-Gasser S, Duffau H. Awake surgery for WHO Grade II gliomas within “noneloquent” areas in the left dominant hemisphere: toward a “supratotal” resection: clinical article. J Neurosurg. 2011;115(2):232-9
29. Smith JS, Chang EF, Lamborn KR. et al. Role of extent of resection in the long-term outcome of low-grade hemispheric gliomas. J Clin Oncol. 2008;26(8):1338-45
30. Mirimanoff RO, Dosoretz DE, Linggood RM. et al. Meningioma: analysis of recurrence and progression following neurosurgical resection. J Neurosurg. 1985;62(1):18-24
31. Kaibara T, Saunders JK, Sutherland GR. Advances in mobile intraoperative magnetic resonance imaging. Neurosurgery. 2000;47(1):131-8
32. Clatz O, Bondiau P-Y, Delingette H. et al. In silico tumor growth: application to glioblastomas. MICCAI 2004, LNCS Springer-Heidelberg. 2004(3217):337-45
33. Xu L, Lin Y, Han J. et al. Magnetic resonance elastography of brain tumors: preliminary results. Acta Radiol. 2007;48(3):327-30
34. Coughlin MF, Bielenberg DR, Lenormand G. et al. Cytoskeletal stiffness, friction, and fluidity of cancer cell lines with different metastatic potential. Clin Exp Metastasis. 2013;30(3):237-50
35. Bausch AR, Ziemann F, Boulbitch AA. et al. Local measurements of viscoelastic parameters of adherent cell surfaces by magnetic bead microrheometry. Biophys J. 1998;75(4):2038-49
36. Guck J, Schinkinger S, Lincoln B. et al. Optical deformability as an inherent cell marker for testing malignant transformation and metastatic competence. Biophys J. 2005;88(5):3689-98
37. Guck J, Ananthakrishnan R, Cunningham CC. et al. Stretching biological cells with light. J Phys. 2002;14(19):4843
38. Suresh S. Biomechanics and biophysics of cancer cells. Acta Materialia. 2007;55(12):3989-4014
39. Cross S. Nanomechanical analysis of cells from cancer patients. Nat Nanatechnol. 2007;2:780-3
40. Cross SE, Jin Y-S, Tondre J. et al. AFM-based analysis of human metastatic cancer cells. Nanotechnology. 2008;19(38):384003
41. Pelling AE, Sehati S, Gralla EB. et al. Time dependence of the frequency and amplitude of the local nanomechanical motion of yeast. Nanomed. 2005;1(2):178-83
42. Kuznetsova TG, Starodubtseva MN, Yegorenkov NI. et al. Atomic force microscopy probing of cell elasticity. Micron. 2007;38(8):824-33
43. Bailey RG, Turner RD, Mullin N. et al. The interplay between cell wall mechanical properties and the cell cycle in Staphylococcus aureus. Biophys J. 2014;107(11):2538-45
44. Fisher R, Pusztai L, Swanton C. Cancer heterogeneity: implications for targeted therapeutics. Br J Cancer. 2013;108(3):479-85
45. Paulus W, Peiffer J. Intratumoral histologic heterogeneity of gliomas. A quantitative study. Cancer. 1989;64(2):442-7
46. Omuro A, DeAngelis LM. Glioblastoma and other malignant gliomas: a clinical review. JAMA. 2013;310(17):1842-50
47. Cairns RA, Harris IS, Mak TW. Regulation of cancer cell metabolism. Nat Rev Cancer. 2011;11(2):85-95
48. Gupta NC, Maloof J, Gunel E. Probability of malignancy in solitary pulmonary nodules using fluorine-18-FDG and PET. J Nuclear Med. 1996;37(6):943-8
49. Padma MV, Said S, Jacobs M. et al. Prediction of pathology and survival by FDG PET in gliomas. J Neurooncol. 2003;64(3):227-37
50. Adams S, Baum RP, Stuckensen T. et al. Prospective comparison of 18F-FDG PET with conventional imaging modalities (CT, MRI, US) in lymph node staging of head and neck cancer. Eur J Nucl Med. 1998;25(9):1255-60
51. Chen W. Clinical applications of PET in brain tumors. J Nuclear Med. 2007;48(9):1468-81
52. Lee JW, Kang KW, Park S-H. et al. 18F-FDG PET in the assessment of tumor grade and prediction of tumor recurrence in intracranial meningioma. Eur J Nucl Med Mol Imaging. 2009;36(10):1574-82
53. Altman J. Postnatal development of the cerebellar cortex in the rat. II. Phases in the maturation of Purkinje cells and of the molecular layer. J Comp Neurol. 1972;145(4):399-463
54. Altman J. Postnatal development of the cerebellar cortex in the rat. III. Maturation of the components of the granular layer. J Comp Neurol. 1972;145(4):465-513
55. Milner TA, Loy R, Amaral DG. An anatomical study of the development of the septo-hippocampal projection in the rat. Dev Brain Res. 1983;8(2):343-71
56. McKay BE, Turner RW. Physiological and morphological development of the rat cerebellar Purkinje cell. J Physiol. 2005;567(3):829-50
57. Leinekugel X, Medina I, Khalilov I. et al. Ca 2 oscillations mediated by the synergistic excitatory actions of GABA A and NMDA receptors in the neonatal hippocampus. Neuron. 1997;18(2):243-55
58. Garaschuk O, Linn J, Eilers J. et al. Large-scale oscillatory calcium waves in the immature cortex. Nat Neurosci. 2000;3(5):452-9
59. Crépel V, Aronov D, Jorquera I. et al. A parturition-associated nonsynaptic coherent activity pattern in the developing hippocampus. Neuron. 2007;54(1):105-20
60. Garaschuk O, Hanse E, Konnerth A. Developmental profile and synaptic origin of early network oscillations in the CA1 region of rat neonatal hippocampus. J Physiol. 1998;507(1):219-36
61. Karlsson KA, Blumberg MS. Hippocampal theta in the newborn rat is revealed under conditions that promote REM sleep. J Neurosci. 2003;23(4):1114-8
62. Gutierrez RC, Hung J, Zhang Y. et al. Altered synchrony and connectivity in neuronal networks expressing an autism-related mutation of neuroligin 3. Neuroscience. 2009;162(1):208-21
63. Liu Z, Geng L, Li R. et al. Frequency modulation of synchronized Ca2+ spikes in cultured hippocampal networks through G-protein-coupled receptors. J Neurosci. 2003;23(10):4156-63
64. Penn Y, Segal M, Moses E. Network synchronization in hippocampal neurons. Proc Natl Acad Sci U S A. 2016;113(12):3341-6
65. Blenkinsop TA, Lang EJ. Block of inferior olive gap junctional coupling decreases Purkinje cell complex spike synchrony and rhythmicity. J Neurosci. 2006;26(6):1739-48
66. Person AL, Raman IM. Synchrony and neural coding in cerebellar circuits. Front Neur Circuits. 2012(6):97
67. El Hady A, Machta BB. Mechanical surface waves accompany action potential propagation. Nat Commun. 2015(6):6697
68. Zhou Y, Larsen PH, Hao C. et al. CXCR4 is a major chemokine receptor on glioma cells and mediates their survival. J Biol Chem. 2002;277(51):49481-7
69. Sarkar S, Nuttall RK, Liu S. et al. Tenascin-C stimulates glioma cell invasion through matrix metalloproteinase-12. Cancer Res. 2006;66(24):11771-80
70. Lawrence DMP, Seth P, Durham L. et al. Astrocyte differentiation selectively upregulates CCL2/monocyte chemoattractant protein-1 in cultured human brain-derived progenitor cells. Glia. 2006;53(1):81-91
71. Sarkar S, Döring A, Zemp FJ. et al. Therapeutic activation of macrophages and microglia to suppress brain tumor-initiating cells. Nat Neurosci. 2014;17(1):46-55
Author contact
![]() Corresponding authors: Email: garnetteca or mamreinca
Corresponding authors: Email: garnetteca or mamreinca