Theranostics
13.3
Impact Factor
- Current Issue
- Advance Articles
- Volume 16; 2026
- Volume 15; 2025
- Volume 14; 2024
- Volume 13; 2023
- Volume 12; 2022
- Archive
- Cover Images
- Cover Suggestion
- Special Issues
Top
Introduction
Materials and Methods
Results
Discussion
Acknowledgements
Supplementary Material
References
Introduction
Materials and Methods
Results
Discussion
Acknowledgements
Supplementary Material
References
International Journal of Biological Sciences
International Journal of Medical Sciences
 Global reach, higher impact

Theranostics 2017; 7(9):2363-2376. doi:10.7150/thno.19898 This issue Cite
Research Paper
Quantification of Tumor Vascular Permeability and Blood Volume by Positron Emission Tomography
Haojun Chen1, 2*, Xiao Tong2*, Lixin Lang2, Orit Jacobson2, Bryant C. Yung2, Xiangyu Yang2, Ruiliang Bai3, Dale O. Kiesewetter2, Ying Ma2, Hua Wu1 ![]() , Gang Niu2
, Gang Niu2 ![]() , Xiaoyuan Chen2
, Xiaoyuan Chen2 ![]()
1. Department of Nuclear Medicine and Minnan PET Center, Xiamen Cancer Hospital, the First Affiliated Hospital of Xiamen University, Xiamen, China;
2. Laboratory of Molecular Imaging and Nanomedicine, National Institute of Biomedical Imaging and Bioengineering, National Institutes of Health, Bethesda, Maryland;
3. Section on Quantitative Imaging & Tissue Science, National Institute of Child Health and Human Development, National Institutes of Health, Bethesda, Maryland.
* These authors contributed equally.
Received 2017-3-2; Accepted 2017-5-3; Published 2017-6-14
Citation:
Chen H, Tong X, Lang L, Jacobson O, Yung BC, Yang X, Bai R, Kiesewetter DO, Ma Y, Wu H, Niu G, Chen X. Quantification of Tumor Vascular Permeability and Blood Volume by Positron Emission Tomography. Theranostics 2017; 7(9):2363-2376. doi:10.7150/thno.19898. https://www.thno.org/v07p2363.htm
Other stylesAbstract

Purpose: Evans Blue (EB) is an azo dye that binds quantitatively with serum albumin. With an albumin binding, NOTA conjugated truncated Evan's blue (NEB) dye derived PET tracer, we aimed to establish a strategy for evaluating vascular permeability in malignant tumors via non-invasive PET. Experimental design: Sixty-minute dynamic PET using [18F]FAl-NEB was performed in three xenograft tumor models including INS-1 rat insulinoma, UM-SCC-22B human head and neck carcinoma and U-87 MG human glioblastoma. Tumor vascular permeability was quantified by the difference of the slopes between tumor and blood time-activity curve (TACs, expressed as Ps). The method was further substantiated by EB extraction and colorimetric assay and correlates with that calculated from dynamic contrast enhanced magnetic resonance imaging (DCE-MRI). The changes in tumor vasculature at different time points were assessed with NEB PET in U-87 MG and UM-SCC-22B tumor models after treatment with bevacizumab or doxorubicin. Result: The Ps values calculated from tumor and blood TACs from multiple time-point static images are consistent with those from dynamic images. Moreover, the Ps showed a positive and significant correlation with extracted EB concentration and KPS-MRI generated from DCE-MRI, which further confirmed the soundness of this methodology. The antiangiogenic effect of bevacizumab could be revealed by NEB PET in U-87 MG tumors as early as 8 hrs after therapy, demonstrated by a substantial decrease of Ps. On the contrary, there was no significant change of Ps in bevacizumab treated UM-SCC-22B tumors, compared with control group. However, the significant changes of Ps were overestimated in doxorubicin treated UM-SCC-22B tumors. Conclusions: We successfully developed a relatively convenient and novel strategy to evaluate vascular permeability and blood volume using NEB PET. This method will be advantageous in evaluating vascular permeability, promoting drug delivery, and monitoring tumor response to therapeutics that affect tumor angiogenesis.
Keywords: Evans blue, positron emission tomography, tumor vasculature, therapy response, vascular permeability.
Introduction
Abnormal angiogenesis in malignant tumors usually results in structurally and functionally deficient new blood vessels [1]. These vessels are disorganized, tortuous, and rather leaky, leading to heterogeneous blood flow, hypoxia, acidosis, and elevated interstitial fluid pressure (IFP) [2]. The highly abnormal blood vessels in tumors lead to enhanced permeability and retention (EPR) [3], which is a well-established phenomenon in solid tumors and has been exploited to facilitate delivery of high-molecular-weight drugs or nano-formulations to the site of diseases [4]. Moreover, angiogenesis and vasculature vary in different tumor types and even in different stages of tumor development [5]. Therefore, the ability to evaluate vascular permeability would be of great value in predicting drug delivery efficiency, monitoring tumor vascular alteration early during antiangiogenic therapy, and shedding light on the initiation and progression of solid tumors [6].
In preclinical studies, the gold standard to evaluate vascular permeability is colorimetric spectrophotometry after intravenous injection and extraction of Evans Blue (EB), an azo dye that binds quantitatively with serum proteins, mainly albumin [7-10]. Following increased vascular permeability to large biomolecules, EB extravasates to the interstitial space along with albumin [11]. Organs with enhanced permeability show significantly increased blue coloration over organs with intact endothelium. The other techniques include cannulation of a single microvessel with a micropipette [12] or using multiphoton fluorescence intravital microscopy [13]. However, all these methods are either invasive or technically demanding and are subjected to sampling errors, and thus do not have much clinical significance.
Within the last decade, dynamic contrast-enhanced magnetic resonance imaging (DCE-MRI) combined with two-compartment kinetic modeling has shown potential in quantitatively assessing certain properties of tumor tissue, particularly vascular permeability and blood flow [14-17]. Consequently, DCE-MRI is currently in wide use as a means of assessing early response to antiangiogenic therapy in clinical trials [18]. However, the degree of signal enhancement with DCE-MRI depends on several physiological and physical characteristics, including contrast concentration, tissue perfusion, permeability, and volume of extracellular extravascular space. Therefore, there is controversy over the physiological meaning of parameters derived from DCE-MRI, as well as concerns over the reproducibility of such measurements [19]. Besides, implementation of DCE-MRI into clinical imaging protocols suffers from several challenges including the complexity in image acquisition and pharmacokinetic model post-processing, and the lack of widely available and easy-to-use post-processing software [20]. Moreover, DCE-MRI may not be feasible for some patient groups, especially individuals with renal failure due to the potential toxicity of the gadolinium-based contrast agents and those with implanted metallic devices.
Among all the imaging modalities used clinically, positron emission tomography (PET) is arguably the most sensitive and specific molecular imaging technique. The increasing availability of molecular probes enables PET to characterize multiple physiological and pathological aspects, such as metabolism [21], cellular proliferation [22], blood flow [17], angiogenesis [23], hypoxia [24], and so on. Recently, we developed a NOTA (1,4,7-triazacyclononane-N,N',N''-triacetic acid)-conjugated truncated EB (NEB), which can be labeled easily with 18F (t1/2 = 109.8 min) through the formation of 18F-aluminum fluoride complex or 68Ga (t1/2 = 68.3 min) and 64Cu (t1/2 = 12.6 h) through metal chelation [25, 26]. After intravenous (i.v.) injection, NEB complexes with serum albumin rapidly, and thus, most of the radioactivity is restrained to the blood circulation [25]. This tracer has been successfully translated into the clinic as a blood pool imaging agent [27] and a lymphatic mapping agent [28].
Since NEB shows similar in vivo behavior to its parental compound EB, we hypothesize here that dynamic NEB PET can be used to evaluate vascular permeability and blood volume in a non-invasive and quantitative manner. To facilitate clinical translation of this strategy, a simplified method was also established to replace dynamic acquisition and compartment modeling (Fig. 1). The feasibility and accuracy of this methodology was substantiated by comparison with traditional EB colorimetric assay and DCE-MRI. The changes in tumor vasculature upon treatment with bevacizumab (Avastin®), an antibody against vascular endothelial growth factor (VEGF), were successfully reflected using this technique in both drug sensitive and resistant tumor models.
Materials and Methods
Synthesis of [18F]FAl-NEB
[18F]Fluoride was obtained from the National Institutes of Health (NIH) Clinical Center's cyclotron facility by proton irradiation of 18O-enriched water. The synthesis of NEB and radiolabeling procedure have been published previously [25]. The total synthesis and work-up time was about 20-30 min with radiochemical purity > 95% as determined by HPLC.
Cell culture
The U-87 MG human glioblastoma cells and INS-1 rat insulinoma cells were purchased from the American Type Culture Collection (ATCC, Rockville MD). UM-SCC-22B human head and neck squamous carcinoma cells were purchased from EMD Millipore (Billerica, MA). The cells were grown in Minimum Essential Medium (MEM), RPMI-1640 medium, and Dulbecco's modified Eagle medium (DMEM) respectively, all of which were supplemented with 10% fetal bovine serum, penicillin (100 IU/mL), and streptomycin (100 mg/mL) (Invitrogen, Carlsbad, CA) and maintained in a humidified atmosphere containing 5% CO2 at 37 °C. Cells were passaged three times per week.
Animal models and treatment protocol
All animal studies were conducted in accordance with the principles and procedures outlined in the Guide for the Care and Use of Laboratory Animals [29] and were approved by the Institutional Animal Care and Use Committee of the Clinical Center, National Institutes of Health (NIH). Female BALB/c nude mice (age, 5-7 wk; weight, 18-20 g) were purchased from Harlan Laboratories. For tumor models, a total of 5×10⁶ cells were injected subcutaneously into either right shoulder (for PET only) or right hind limb (for DCE-MRI and PET) of the nude mice. Tumor sizes were measured using a digital caliper. Tumor volume (mm3) was determined using the formula 0.5×length×width2.
Figure 1
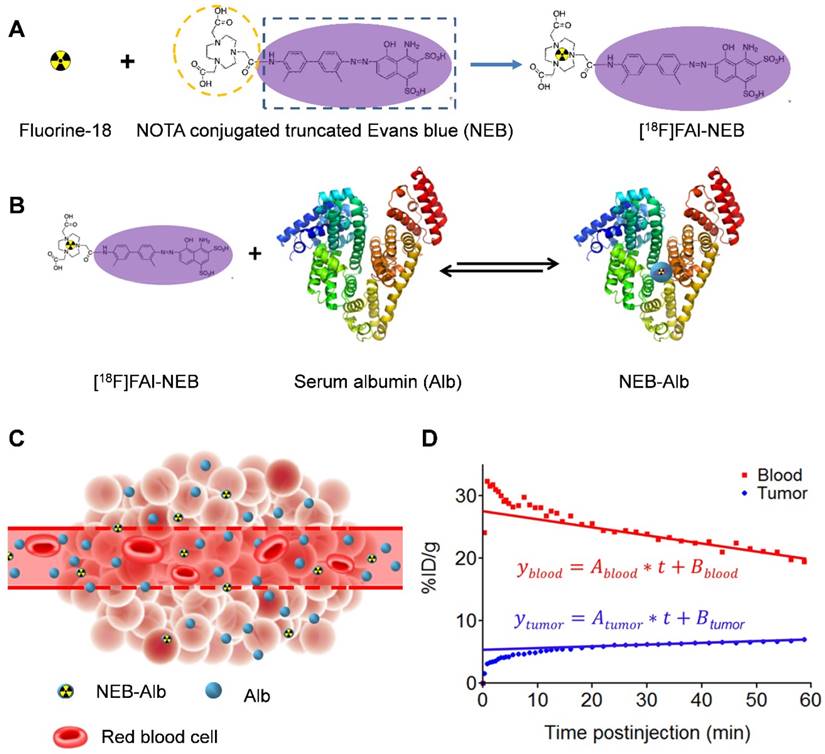
(A) Chemical structure of NOTA conjugated truncated Evan's Blue (NEB) and radiolabeling of NEB with 18F-aluminum ([18F]FAl). (B) The reversible complexation of [18F]FAl-NEB with serum albumin (Alb), forming the macromolecule NEB-Alb. (C) Schematic of enhanced permeability and retention (EPR) effect within the solid tumor as a result of fenestrated endothelial junctions allowing extravasation of NEB-Alb from plasma to interstitial fluid. (D) Representative time-activity curves (TACs) of tumor and blood derived from 60-min dynamic PET scans after administration of [18F]FAl-NEB. The radioactivity within the tumor region results from two components: the tracer within the blood vessels and that extravasated into tumor interstitium. With a simplified linear analysis method, the two components can be delineated based on the TACs of blood and tumor.
When the tumors reached a volume of approximately 150 mm3, U-87 MG and UM-SCC-22B tumor-bearing mice were randomized into two groups to receive two doses of bevacizumab (10 mg/kg) or saline intravenously on days 0 and 3. As for doxorubicin therapy response monitoring, another group of UM-SCC-22B tumor-bearing mice were randomized to receive two doses of doxorubicin (10 mg/kg, ALZA Corporation, USA) or saline intravenously on days 0 and 3. The detailed therapy protocols are shown in Table S1.
PET and data processing
PET scans were obtained using an Inveon small-animal PET scanner (Siemens Medical Solutions, USA). For dynamic acquisition, 60-min dynamic PET scans were acquired in Group A (INS-1, n = 5; UM-SCC-22B, n = 5; U-87 MG, n = 6). A catheter was placed in the tail vein before each scan for tracer administration and about 5.55-7.40 MBq of [18F]FAl-NEB was injected through the catheter immediately after the scan was started. Dynamic PET data were reconstructed into 39 time frames with frame rates of 10×30s, 10×60s, 10×120s, and 9×160s. For multi-time point static PET, the tumor-bearing mice were scanned at 10, 30, and 60 min after intravenous injection of 5.55-7.40 MBq of [18F]FAl-NEB.
The images were reconstructed using 3D ordered-subsets expectation maximum followed by maximum a posteriori algorithm with a smoothing parameter of 0.1 (OSEM-3D-MAP). No correction was applied for attenuation or scatter. For each scan, regions of interest (ROIs) were drawn using vendor software (ASI Pro 5.2.4.0; Siemens Medical Solutions) on decay-corrected whole-body coronal images. The radioactivity concentrations (accumulation) within the tumor and heart were obtained from mean pixel values within the multiple ROI volumes and then converted to megabecquerel per milliliter. These values were then divided by the administered activity (assuming a tissue density of 1 g/mL) to obtain an image-ROI-derived percentage injected dose per gram (%ID/g).
To extract the tumor time-activity curves (TAC) from the dynamic PET data, the last frame of the dynamic PET image was used to define the tumor ROI and extract the TAC. Each point of the tumor TAC was given by the mean tracer tumor uptake within the defined ROI. The blood TAC was generated from the ROI over left ventricles, which was defined on the frame at the first minute. The blood TAC and the tumor TAC were then post-processed as described in the following sections to determine the tumor vascular permeability and tumor blood volume using two different approaches.
Kinetics analysis and compartment modeling
The kinetics analysis of the NEB dynamic PET was conducted to assess tumor vascular permeability. The reversible two-compartment model [16, 30] was chosen as the mathematical model for the present study. The tumor vasculature permeability could be addressed by the transport kinetics of NEB from tumor blood vasculature to tumor interstitial space, which was expressed by the diffusion equation (Eq. 1)
(Eq.1)
Where Cp(t), Cd(t) were the activity concentrations, as a function of time, in compartments corresponding to blood vasculature and diffusive tumor area. Since the injected dose and in vivo tracer concentration showed an excellent linear correlation (R2 > 0.99, Fig. S1), the %ID/g was used as the unit here instead of Bq/mL to avoid the influence of injection dose on the quantification of permeability. The Cp(t) was given by the plasma input TAC generated from left ventricle ROI. KPS_PET (%ID/g/min) was the kinetic rate constant of tracer from plasma to tissue, Kout was the reflux rate (in min-1) from tumor back to plasma. The intensity measured in tumor ROI on PET images was a weighted sum of Cp(t) and Cd(t) expressed as:
(Eq.2)
Where wp and wd were the fractional volumes of the tumor vasculature and the diffusive compartment tumor interstitium, with wd = (1-wp). The activity concentration in each compartment was calculated by solving the above differential equations. Given the measured TAC of tumor ROI and blood input function, the KPS_PET and Kout were calculated by fitting the measured TAC with the analytical ROI function CT(t) (Eq. 4) using non-linear least-square regression. The goodness of fit was evaluated using residual analysis [31] and the error (between the data value and estimated function value) was limited to be less than 5%.
The compartmental modeling was conducted using a Matlab object-oriented toolbox. Input parameters included plasma input TAC data, tumor ROI TAC data, and initial guess of KPS_PET, Kout, and wp values. According to literature and preliminary fitting test, the KPS_PET and Kout were initialized to 0.01, and wp was initialized to 0.1.
Simplified quantification of tumor vascular permeability by NEB PET
After several minutes of tracer injection, both TACs of blood and tumor showed a linear pattern as a function of time. This phase was named as the stable state. The starting time of linearity (t = Ts) was determined by filtering the tumor TAC data y(t) by the Eq. 1, until the ∆ inferior to a certain tolerance ε (e.g. 10% of  ) (Fig. S2).
(Eq.3)
Where 
When the tumor and blood TAC became linear after reaching steady state at Ts, the radioactivity concentrations in tumor and in blood over time, namely Cp(t) and CT(t), could be expressed as a linear equation:
(Eq.4)
Where Ablood was the slope of linear blood TAC and Atumor was the linear tumor TAC. In other words, Ablood and Atumor were referred to as the rate of change of [18F]FAl-NEB concentration in blood and in tumor.
The [18F]FAl-NEB concentration in tumor Ct(t) was contributed by two parts: the concentration in blood vasculature compartment (Cp(t)) and the concentration in diffusive tumor compartment (Cd(t)). The Cd(t) started increasing from 0 as [18F]FAl-NEB permeated from vessel to tumor interstitial space. Therefore, the tumor vascular permeability could be equally represented by the change of [18F]FAl-NEB concentration in the diffusive compartment Cd(t) per unit time. In the stable state, the variation of concentration changes in each compartment became constant, thus the permeability expressed by the change in Cd(t) per unit time is a constant and expressed as Ps with a unit of %ID/g/min. According to Eq. 2, the change of [18F]FAl-NEB concentration in each compartment per unit time could be expressed as:
(Eq.5)
At the stable state, Eq. 5 could be integrated with the linear equation, Eq. 4, and expressed as:
(Eq.6)
Therefore, the tumor vascular permeability could be quantified by the expression (Eq.7).
(Eq.7)
The fractional volume of the tumor vasculature wp can be calculated by Eq. 8.
,
(Eq.8)
Therefore, the tumor vascular permeability can be determined by the parameters which could all be extracted from the linear fit equation of the blood and tumor TAC as known constants (Eq. 9). Tumor blood volume (TBV) can be calculated with Eq. 10.
(Eq.9)
(Eq.10)
To evaluate the reliability of this simplified quantification method, the Ps calculated from linear equation Eq. 7 was respectively correlated with the KPS-PET fitted from dynamic PET modeling and the KPS-MRI derived from the modeling of DCE-MRI.
DCE MRI and data analysis
All the MRI scans were performed on a 9.4 T Bruker Biospec horizontal-bore MRI scanner (Bruker BioSpin, Billerica, MA) at the Mouse Imaging Facility (MIF) of the National Institutes of Health (NIH). During MRI scans, U-87 MG tumor-bearing mice (Group B, n = 11) were anesthetized with 1% isoflurane/air mixture and body temperature was maintained at 37°C. Dynamic contrast-enhanced MRI was performed using the T1-weighted gradient-echo sequence with the following parameters: TR/TE = 62.5/2.3 ms, flip angle = 30°, FOV = 2.56 × 1.92 cm, matrix size = 64 × 48, slice thickness = 1 mm, and averages = 1. Single or double slices across the middle of the tumor were acquired over a 15-min period, with a time resolution of 3.0 s. Following 2 min of scanning, a bolus dose of Gd-DTPA (Magnevist, Bayer Healthcare Pharmaceuticals, Whippany, NJ), with a concentration of 0.05 mM (diluted from 0.5 mM with 0.9% saline), was administered via tail-vein catheter in around 4 s for a volume of 100 μL. Before DCE-MRI, T1 maps were acquired on half of the animals with a saturation-recovery fast spin-echo sequence (TR = 300, 600, 1200, 1800, 3200, 8000 ms; TE = 12.75 ms) with the same geometry as DCE-MRI.
The kinetic parametric maps were determined by non-linear least-squares fitting of the time-course data in each voxel with the generalized kinetic model (Eq. 11), also called the extended Tofts-Kety model[32-35]:
(Eq.11)
Where Ct and Cp were the tracer concentrations in the tissue and blood plasma, respectively, KPS_MRI was the volume transfer constant, and ve and vp were the extravascular extracellular volume fraction and blood plasma volume fraction in the tissue, respectively. The arterial input functions (AIF) were individually determined for each animal with an automated AIF extraction algorithm searching for the voxels containing arteries with minimal partial volume contamination in the DCE datasets [36]. Before the model fitting, the DCE-MRI data were visually examined and some poor-quality time points with strong subject motion were manually removed. All MRI image processing and data analyses were performed using in-house programs written in MATLAB (The Mathworks, Natick, MA, USA). On the same day, the mice from Group B also underwent dynamic [18F]FAl-NEB PET scans.
Therapy response monitoring with [18F]FAl-NEB PET
For bevacizumab therapy response monitoring, U-87 MG tumor-bearing mice (Group C) in both control and treatment groups underwent [18F]FAl-NEB PET at 8 h, day 1, day 4 and day 7 post-treatment (n = 4-6/group), and [18F]FDG PET on day 2 post-treatment (n = 4/group). For therapy response monitoring in UM-SCC-22B tumors (Group D), both control and treated mice received [18F]FAl-NEB PET on days 1, 4 and 7 post-treatment (n = 4/group). For doxorubicin therapy response monitoring, [18F]FAl-NEB PET scans were performed in UM-SCC-22B mice (Group E) on days 1 and 4 post-treatment, and [18F]FDG PET scans were also performed on day 4 post-treatment (n = 4/group). The 10-min static [18F]FAl-NEB PET scans were acquired at 10, 30, and 60 min p.i., respectively, with the injection dose ranging from 5.55-7.40 MBq. The 10-min static [18F]FDG PET scans were acquired at 60 min p.i. with an injected dose of 5.55 MBq. The detailed imaging protocol is shown in Table S1.
Autoradiography
For autoradiography, at 4 h after administration of [18F]FAl-NEB, U-87 MG tumor samples were collected and frozen with dry ice after being embedded in optimum cutting temperature (O.C.T) compound (Tissue-Tek). The samples were sectioned with a cryostat (Ultrapro5000, Vibratome, St. Louis, MO). The sections were then exposed to a phosphor imaging screen in an autoradiography cassette (Fisher Biotech). 20 h later, autoradiography was performed on a Cyclone Plus Storage Phosphor System (PerkinElmer, US) and analyzed with Optiquant Acquisition and Analysis Software V5.0 (Perkin Elmer).
Evans Blue extraction and colorimetric assay
A simplified Evans Blue extraction technique [7] was used to evaluate vascular permeability. At 8 h (only for the U-87 MG tumors), day 1, day 4, and day 7 post-treatment with bevacizumab, immediately after PET acquisition, Evans blue (Sigma-Aldrich) was administered intravenously at a dose of 30 mg/kg (n = 4/group). At 4 h after dye injection, the mice were perfused at an elevated perfusion pressure with physiological saline through the left ventricle immediately before tumor excision to remove Evans blue from blood circulation. The collected tumors were weighed and cut into pieces of approximately 50 mg/piece. Then formamide (10 μL/mg of tumor tissue) was added to extract EB from the tumor tissue for 72 h. After centrifugation, the supernatant of each tube was carefully collected, and the absorbance at 620 nm was measured with a NanoDrop 2000 spectrophotometer (Thermo Fisher Scientific Inc.). Note that EB extraction efficiency was measured for different tumor samples. The concentration of EB was calculated using a standard absorption curve of known concentrations of EB mixed with albumin.
CD31 staining and microvessel density
For CD31 staining, frozen slices (5 μm thick) of U-87 MG or UM-SCC-22B tumor were fixed with buffered zinc formalin fixatives (Z-fix, Anatech LTD) for 20 min and dried in the air for 30 min. The slices were rinsed with PBS for 5 min and blocked with PBS containing 1% BSA for 30 min at room temperature. The slices were then incubated with rat anti-mouse CD31 primary antibody (1:100, Abcam) for 1-h at room temperature, followed by incubation with Dylight 488-conjugated donkey anti-rat secondary antibody (1:200; Jackson Immuno-Research Laboratories, Inc.) for 40 min at room temperature. After each step, slices were washed gently with PBS containing 0.05% tween 20 (PBST) for three times, 5 min each time. All slices were mounted with mounting medium containing 4', 6-diamidino-2-phenylindole and then observed by an epifluorescence microscope (X81; Olympus). To determine microvessel density (MVD), the areas with highest vascular density were selected, and vessels were counted in 10 random views in both the center and periphery of the tumor slices. The vessels that contained branching points were counted as a single vessel. Number of vessels counted was divided by field of view to yield MVD, as number of vessels/mm2.
Statistical analysis
All data were presented as mean ± SD from at least four independent experiments. Statistical analyses were performed by SPSS software 13.0 (SPSS, Chicago, IL). An unpaired two-tailed Student's t-test was used to compare mean values including NEB tumor uptake (1 h p.i.), KPS_PET, and Evans blue contents between treated and control groups. Slope values for tumor (Atumor) and blood (Ablood) TACs were calculated from either dynamic or multi-point static PET scans using linear regression. Correlation between slope values calculated from dynamic and static scans, correlation of Ps values with EB content, KPS-PET, or KPS-MRI values, were all assessed using standard Pearson correlation. P values less than 0.05 were considered statistically significant.
Results
Non-invasive evaluation of tumor blood volume and vascular permeability
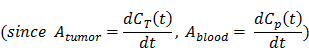
The chemical structure of NEB was shown in Figure 1A. The binding of NEB with albumin is a reversible process. Due to the high concentration of albumin in the blood circulation and administration of only trace amount of NEB, the reaction is pushed to the right side to facilitate NEB-albumin complex formation and equilibrate within a few minutes postinjection (p.i.) of NEB (Fig. 1B). Since malignant tumors often show increased uptake and retention of high-molecular-weight nontargeted compounds, PET imaging with radiolabeled NEB provides a digital approach for noninvasive evaluation of tumor vascular permeability (Fig. 1C-D). Radiolabeled NEB retains the ability to bind with serum albumin as shown by the residency of radioactive signal within the blood circulation (Fig. 2A). Consequently, heart and major vessels showed highest signal intensity. The organs with abundant blood supply such as liver, spleen, and kidneys were also visible [25]. As expected, different types of tumor xenografts showed different patterns and magnitude of tracer accumulation as reflected by the tumor TACs generated from 60-min dynamic PET scans. Variance was also observed in different xenografts grown with the same cell type (Fig. 2B).
Conventionally, tumor uptake of a PET tracer is quantified either by percent injected dose per gram tissue (%ID/g) or standard uptake value (SUV). As shown in Fig. 2C, both INS-1 and UM-SCC-22B tumors showed significantly higher tracer uptake than U-87 MG tumors (7.18 ± 0.50 and 7.03 ± 0.57 vs. 5.14 ± 0.74 %ID/g, P < 0.05) at 60 min p.i. At any given moment, the radioactivity within the tumor region would be a result of accumulation within the blood vessels and that extravasated into tumor interstitium. With a simplified linear analysis method, these two contributions can be delineated from blood and tumor TACs. INS-1 tumors showed high blood volume (18.28 ± 2.91 %), followed by UM-SCC-22B (13.98 ± 2.13 %) and U-87 MG (8.40 ± 2.26 %) (Fig. 2D). However, UM-SCC-22B tumor showed the highest vascular permeability Ps (0.082 ± 0.008 %ID/g/min) compared with the other two tumors (INS-1, 0.062 ± 0.003 %ID/g/min; U-87 MG, 0.064 ± 0.010 %ID/g/min) (Fig. 2e). We also performed immunostaining against CD31, an endothelial cell maker, to visualize the tumor vasculature (Fig. 2F). However, the microvascular density (MVD) reflected by CD31 staining showed no apparent correlation with either tumor blood volume or vascular permeability.
Method simplification and substantiation
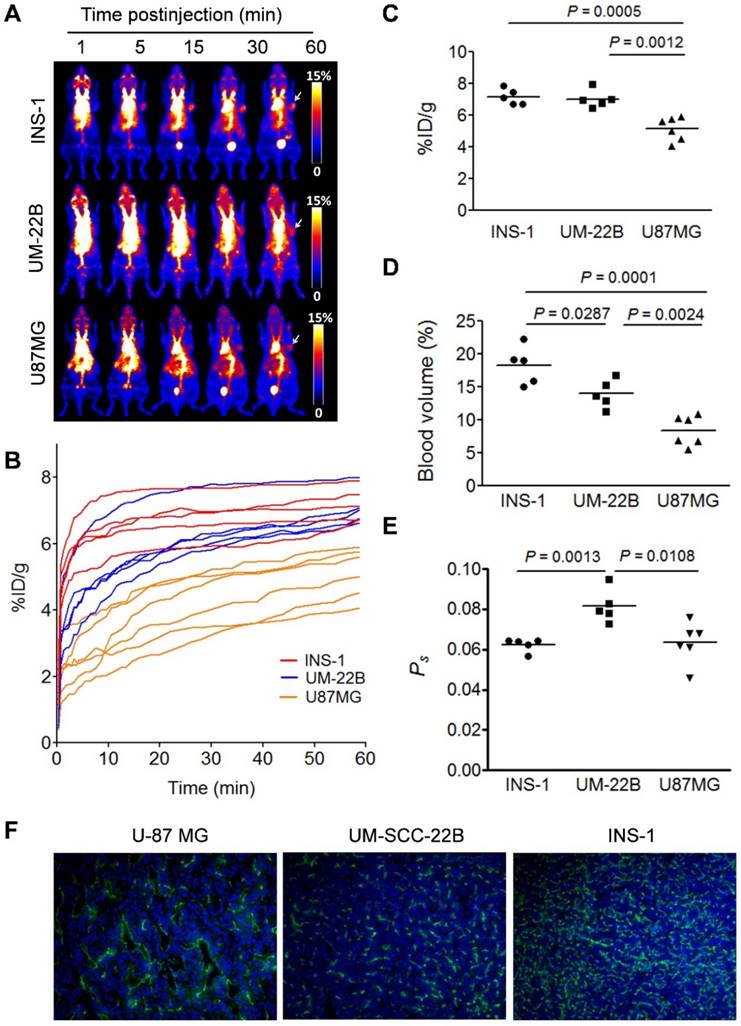
Based on the data acquired by dynamic PET, we also performed two-compartment modeling (Fig. 3A) and named the kinetic parameter as KPS-PET. With the same batch of mice, a significant correlation between Ps and KPS-PET was observed when KPS-PET values were generated from the truncated TAC (10-60 min p.i.) (R2 = 0.6375, P = 0.0004, Fig. 3B). No correlation was found when KPS-PET values were fit with the complete TAC (0-60 min p.i.) (P > 0.05, Fig. S2).
Due to the linearity of both blood and tumor TACs once stable kinetics is attained at around 10 min p.i. (Fig. S3), we conducted static PET at 10, 30 and 60 min p.i. using 16 tumor-bearing mice in order to simplify the data acquisition and image post-processing. With the same mice, 60 min dynamic PET scan was also performed. The slopes of the linear fit on tumor and blood TACs generated from either dynamic PET (Atumor-dyn and Ablood-dyn) or multiple time-point static PET (Atumor-sta and Ablood-sta) were calculated. Positive and excellent linear correlations between the slopes in tumor (R2 = 0.9612, P < 0.0001, Fig. 3C) and blood (R2 = 0.8778, P < 0.0001, Fig. 3D) were observed. As a result, Ps calculated from static PET correlated well with that from dynamic PET (R2 = 0.7691, P < 0.001, Fig. 3E).
We also tried to use a single time-point static scan instead of multiple time-point scans to evaluate tumor vascular permeability. The 10 min static scan at 60 min p.i. was reconstructed to 5 frames with 2 min per frame (Fig. S4). The slopes of the lines fitted from both tumor and heart TACs were calculated. For the correlation of the single-point scan (Ps_sin) with multi-point scans (Ps_mul), fifteen U-87 MG tumor-bearing mice were analyzed, and a moderate, but significant linear correlation was observed between Ps_sin and Ps_mul. The correlation coefficients, R2, for tumor and blood between these parameters were 0.8216 and 0.5809, respectively. Based on these linear fittings, the vascular permeability calculated from the single time-point scan showed significant correlation with that from the multiple time-point scans (R2 = 0.6468, P < 0.001, Fig. S4D).
Figure 2
(A) Series of maximum-intensity-projection (MIP) PET images of INS-1, UM-SCC-22B, and U-87 MG tumor-bearing mice after intravenous injection of [18F]FAl-NEB. Each mouse received around 5.55 MBq of radioactivity. Images were reconstructed from a 60-min dynamic scan. Tumors are indicated by the white arrows. (B) Tumor TACs derived from 60-min dynamic PET scans after administration of [18F]FAl-NEB. (C-E) PET quantification of tumor [18F]FAl-NEB uptake (%ID/g), tumor blood volume (%), and vascular permeability (Ps in %ID/g/min). Unpaired t test was used to evaluate differences. (F) CD31 staining of tumor sections. The tumor slices were incubated with rat anti-mouse CD31 primary antibody followed by incubation with Dylight 488-conjugated donkey anti-rat secondary antibody. All slices were mounted with mounting medium containing 4', 6-diamidino-2-phenylindole (DAPI).
Figure 3
(A) Two-compartment kinetic model describing the kinetics of [18F]FAl-NEB from plasma to interstitial fluid. (B) Correlation of Ps with PET-derived kinetic parameter KPS-PET. KPS-PET was calculated by the dynamic frames from 10 to 60 min. (C-D) Correlation between slope values from tumor (C) or blood (D) TAC measured by dynamic NEB PET (Ps_dyn) and those measured by multi-point static PET (Ps_mul). (E) Correlation of Ps values measured by dynamic NEB PET (Ps_dyn) with Ps measured by multi-point static PET (Ps_mul). Solid line denotes the best fit linear correlation line. Pearson correlation coefficient R2, and P value of linear regression are shown.
Comparison of PET with EB extraction and DCE-MRI
We evaluated vascular permeability using a traditional EB extraction procedure. Xenografted mice injected with EB (30 mg/kg) were sacrificed at 4 h p.i. and perfused to remove EB containing blood. The excised tumors were extracted to measure the concentration of EB in the tumor tissue. A good correlation between measured tumor uptake of EB and the Ps calculated from NEB PET was observed (n = 36, R2 = 0.7404, P < 0.001, Fig. 4A). The co-localization of NEB and EB within the tumors was also confirmed by autoradiography and bright field imaging after co-injection of 18F-NEB and EB (Fig. 4B). These data confirm that the Ps value from NEB PET could be used to evaluate the level of vascular permeability accurately.
DCE-MRI is a widely used method to evaluate vascular permeability. Thus, we further compared Ps calculated from NEB PET and KPS-MRI generated from DCE-MRI using Gd-DPTA as a contrast agent in U-87 MG tumor mice. NEB PET was performed within 24 h after DCE-MRI on the same U-87 MG mice. A moderate, but significant positive correlation was found between Ps and the MRI-derived parameter KPS-MRI (R2 = 0.533, P < 0.05, Fig. 4C). The T1-weighted MRI and KPS-MRI parametric map are presented in Fig. S5 and Fig. 4D.
Figure 4
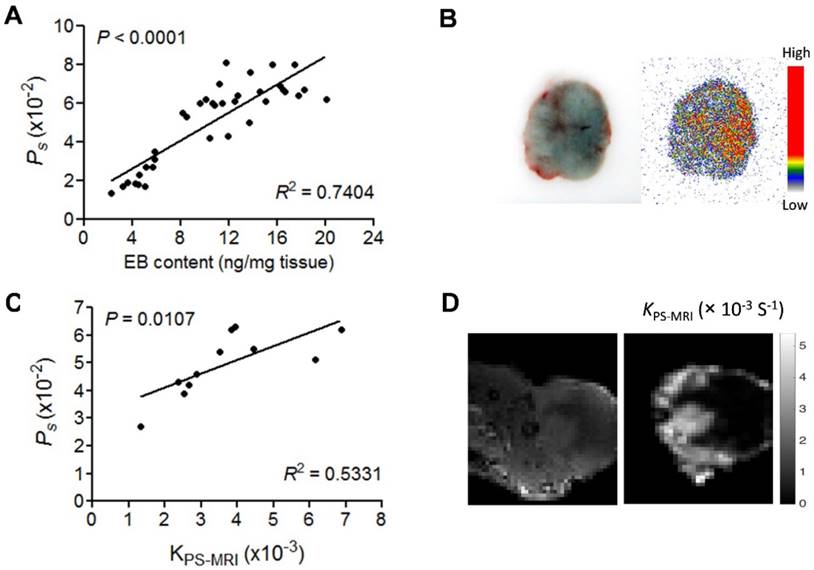
(A) Correlation of Ps measured by NEB PET with EB amount measured by EB extraction method. (B) EB extravasation shows the distribution pattern of blue coloration in U-87 MG tumor tissues (left), and autoradiography shows the distribution pattern of [18F]FAl-NEB radioactivity in corresponding tumor area (right). (C) Correlation of Ps with MRI-derived parameter KPS-MRI. (D) Small animal MRI and KPS-MRI parametric maps. Left image shows contrast-enhanced MRI in the U-87MG tumor region (10 min p.i.), and the right image shows the corresponding parametric maps of KPS-MRI in the tumor region.
NEB PET of vascular permeability change after treatment
Bevacizumab, a recombinant humanized monoclonal antibody that blocks angiogenesis by inhibiting vascular endothelial growth factor A (VEGF-A), was the first clinically available angiogenesis inhibitor in the United States [37]. After treatment with 2 doses of bevacizumab, the U-87 MG tumors showed a partial response, reflected by significant growth inhibition at day 4 after the treatment started (P < 0.05; Fig. 5A). Tumor accumulation of NEB at 60 min p.i. decreased significantly in the treatment group compared to the control group on days 1, 4 and 7 after treatment (2.88 ± 0.24 vs. 5.92 ± 0.62 %ID/g, P < 0.01; 2.10 ± 0.32 vs. 5.62 ± 0.42 %ID/g, P < 0.01; and 2.32 ± 0.15 vs. 6.03 ± 0.53 %ID/g, P < 0.01; respectively). However, at 8 h after treatment, no significant difference of tumor uptake was observed (4.20 ± 1.08 vs. 4.89 ± 0.81 %ID/g, P = 0.23) (Fig. 5B and 5C).
Based on the 10, 30, and 60 min NEB PET, the tumor blood volume and the vascular permeability parameter Ps values were calculated. As shown in Fig. 5D and 5E decreased tumor blood volume and tumor vascular permeability was observed on days 1, 4, and 7 after bevacizumab treatment. At early stage of the treatment (8 h) no apparent difference in tumor blood volume was observed, while Ps in the treatment group was significantly lower than that in the control group (0.046 ± 0.011 vs. 0.063 ± 0.0149 %ID/g/min, P = 0.04). The change of tumor vascular permeability induced by bevacizumab treatment was confirmed by EB extraction and colorimetric assay (Fig. 5F). Decreased CD31 staining and MVD was also observed in treated tumors (Fig. 5G and 5H). Interestingly, compared with the control group, no significant difference in [18F]FDG uptake, a measure of tumor glucose metabolism, was observed in bevacizumab treated tumors (5.97 ± 0.92 vs. 6.47 ± 1.12 %ID/g, P = 0.454) at 2 days after the first therapeutic dose (Fig. S6).
Different from U-87 MG, UM-SCC-22B tumors are not sensitive to bevacizumab treatment (Fig. S7A). Consequently, no apparent difference with respect to tumor uptake of [18F]FAl-NEB in the treatment vs. control group was observed. Both tumor blood volume and Ps were very similar between control and bevacizumab-treated groups (P > 0.05) at all time-points. The results from EB colorimetric assay and CD31 staining were also consistent with the results from NEB PET (Fig. S7F and Fig. S8).
We also applied NEB PET to assess the response of UM-SCC-22B tumors to an effective chemotherapeutic drug, doxorubicin (Fig. 6). Regarding PET-derived parameters, the differences between treated and control tumors were not found to be statistically significant: on day 1 (NEB uptake, 5.29 ± 0.29 vs. 5.85 ± 0.29 %ID/g; tumor blood volume, 11.78 ± 1.36 vs. 11.17 ± 1.10 %; Ps, 0.064 ± 0.009 vs. 0.074 ± 0.008 %ID/g/min), but on day 4 post-treatment (NEB uptake, 3.50 ± 0.42 vs. 5.64 ± 0.16 %ID/g, P < 0.05; tumor blood volume, 8.69 ± 0.67 vs. 12.16 ± 0.42, P < 0.05: Ps, 0.0328 ± 0.0027 %ID/g/min vs. 0.0605 ± 0.0058 %ID/g/min; P < 0.05). These results implied that NEB PET can identify the change in tumor vasculature after treatment by chemotherapeutics.
Figure 5
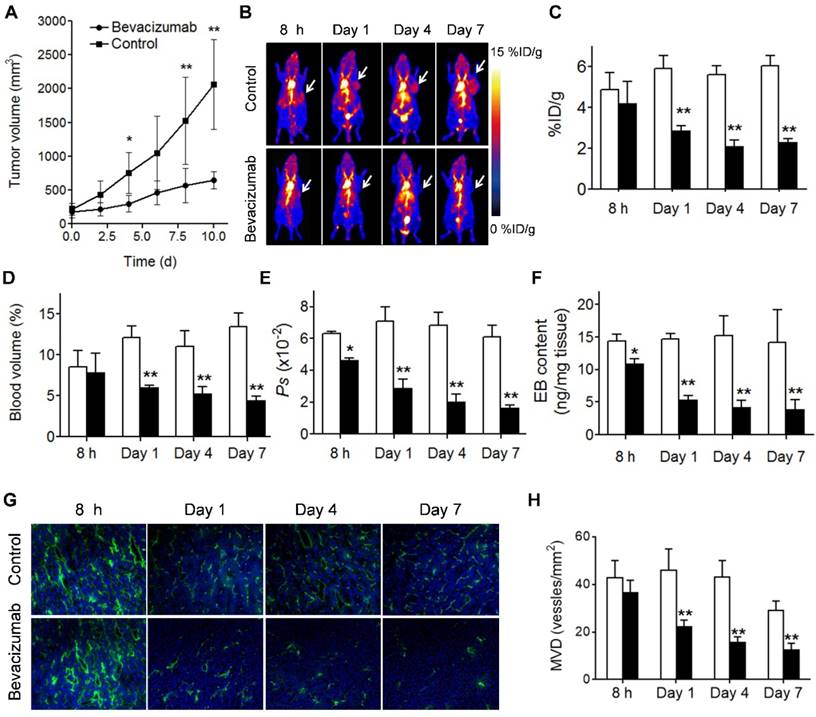
(A) U-87 MG tumor growths with and without bevacizumab treatment. (B) Representative maximum-intensity-projection (MIP) NEB PET images (1 h p.i.) acquired from control and bevacizumab-treated U-87 MG tumor xenografts at 8 h, day 1, day 4 and day 7 post-treatment. (C-F) PET Quantification of tumor [18F]FAl-NEB uptake (C), blood volume (D), Ps values (E), and Evans blue amount (F) in bevacizumab-treated and control U-87 MG tumors. Unpaired t test was used to evaluate differences. *P ≤ 0.05, **P ≤ 0.01. White column represents control group and black column represents bevacizumab-treated group. (G) Immunofluorescence staining of CD31 in ex vivo tumor tissue from bevacizumab-treated and control U-87 MG tumor bearing mice at 8 h, day 1, day 4 and day 7 post-treatment (magnification×100). (H) MVD measurement of control and bevacizumab-treated U-87 MG tumors. Number of vessels counted was divided by field of view to yield MVD, as number of vessels/mm2. Unpaired t test was used to evaluate differences. *P ≤ 0.05, **P ≤ 0.01. White column represents control group and black column represents bevacizumab-treated group.
Figure 6
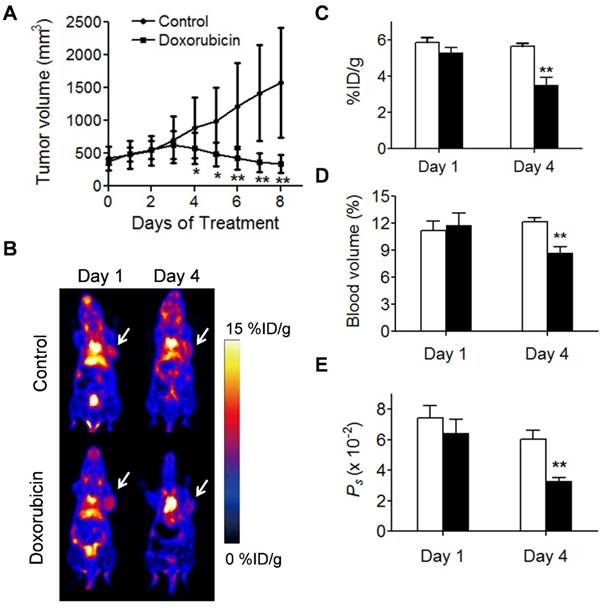
Evaluation of tumor response to doxorubicin therapy. (A) Tumor growth study of mice with UM-SCC-22B xenografts treated with doxorubicin. (B) Representative coronal NEB PET images acquired from control and doxorubicin-treated UM-SCC-22B tumor xenografts on days 1 and 4 post-treatment. Images shown here were acquired at 60 min p.i., Tumors are indicated by the white arrow. (C-D) PET quantification of tumor blood volume (C), [18F]FAl-NEB uptake (D), and Ps values (E) in doxorubicin-treated and control UM-SCC-22B tumors. Unpaired t test was used to evaluate differences. *P ≤ 0.05, **P ≤ 0.01. Black column = doxorubicin-treated, white column = control.
Discussion
Malignant tumors often show increased uptake and retention of high-molecular weight molecules or nanoparticles, which is known as the enhanced permeability and retention (EPR) effect. Furthermore, angiogenesis and vasculature vary in different types of tumors. Therefore, the ability to evaluate tumor vasculature and permeability would be helpful for patient preselection and response assessment. The azo-dye EB has been intensively and increasingly applied for several biological and physiological assays including blood permeability, blood-brain barrier (BBB) disruption, and epithelial disruption [38-41]. However, this method is limited to preclinical studies due to its invasiveness. In this study, by applying the same principle, we developed a new method to evaluate vascular permeability non-invasively by using NEB PET. For colorimetric assay using EB dyes, a thorough perfusion is needed to remove the EB dye in the blood circulation in order to quantify the amount of extravasated EB-albumin complex. With NEB PET, the signal from NEB-albumin complex within the tumor blood pool can be subtracted by kinetic modeling or simplified linear slope differentiation of TACs from blood and tumor. The positive and significant linear correlation between Ps calculated from NEB PET and tumor EB amount substantiated that Ps would be an effective parameter to noninvasively evaluate the level of tumor vascular permeability.
It is well known that the exact physiological meaning of parameters derived from kinetic modelling is complex and not related to a single process such as blood flow or blood volume only [32]. In most cases, the parameters frequently indicate a combination of flow and vascular permeability. In the cases of high blood perfusion, such as INS-1 tumor, the flux of contrast agent into the interstitial space is blood flow limited and KPS extracted from DCE-MRI kinetic modeling will approximate tissue perfusion. On the other hand, when blood perfusion is low and vascular permeability is high, such as in U-87 MG tumor, KPS is weighted more for vascular permeability. This may partially explain the fact that only a moderate correlation (R2 = 0.5331) was established between Ps values from NEB PET and KPS_MRI from DCE-MRI.
Although several parameters can be calculated after dynamic acquisition and compartment modeling, the highly demanding technique is a hurdle for both preclinical and clinical applications. The data analysis of NEB PET can be simplified due to the almost perfect linearity of both blood and tumor TACs once a steady state of NEB in blood is reached. Both the tumor blood volume fraction and vascular permeability can be quantified using the data from 10 to 60 min. This procedure would be appropriate for most clinical applications, but for some preclinical investigations where large number of animals need to be scanned, this acquisition procedure is relatively inefficient. Therefore, we adopted multiple time-point static scans instead of a single long dynamic scan. As expected, a decent correlation was identified between Ps, resulting from these different acquisition procedures.
Since anti-angiogenesis therapies rarely lead to regression of established tumors [42, 43], measurement of vascular permeability could provide alternative end-points to assess tumor vascular effects of antiangiogenic agents [44]. With NEB PET, we evaluated the change of vascular permeability and blood volume in tumor models after being treated with bevacizumab, or doxorubicin. It has been reported that anti-VEGF treatment could result in a decrease in microvascular density, vascular permeability, and interstitial fluid pressure [45, 46]. Consistently, both tumor blood volume and vascular permeability reflected by NEB PET decreased significantly upon bevacizumab treatment in U-87 MG tumors. Specifically, the decreases of Ps values in treated mice could be observed as early as 8 h after treatment, which is 3 days before the alteration in tumor volume becomes obvious. Our data also supported the notion that the alteration in tumor vascular permeability precedes the changes in tumor blood flow (perfusion) and glucose metabolism [45-46]. However, in bevacizumab-resistant UM-SCC-22B tumors, NEB uptake showed little change between control and treated groups, even following two doses of bevacizumab, neither did the Ps values or tumor blood volume change significantly. The PET results from this resistant tumor type were also consistent with the histological results and EB extraction data. These results demonstrated that monitoring tumor vascular permeability using NEB PET can be applied to early assessment of tumor responsiveness to antiangiogenic therapy. Besides anti-angiogenesis drugs, some chemotherapeutics may also induce changes in tumor vasculature, either directly or indirectly [47, 48]. Our results demonstrated that the vasculature changes induced by doxorubicin in UM-SCC-22B tumor could be identified by NEB PET.
Compared with other methods, NEB PET has several advantages to evaluate vascular permeability. Firstly, due to the high sensitivity of PET, only trace amount of radiolabeled NEB is needed, which avoids the potential toxicity of EB [49] and facilitates effective complexation of NEB to serum albumin. Secondly, the quantitative nature of PET guarantees the accuracy of evaluation. The PET signal was directly associated with serum albumin concentration. The unit of Ps is %ID/g/min and a typical tumor will give a value of 0.05 %ID/g/min. If we assume the initial blood distribution of NEB in blood is 30 %ID/g and serum albumin concentration is 30 mg/mL [50], the Ps would be 0.05 mg/g/min, which means that in one minute, 0.05 mg serum albumin will extravasate to interstitial space per gram tumor tissue. Thirdly, NEB can be easily labeled with various radioisotopes with a total synthesis time of less than 30 min, including purification and sterile reconstitution as an injectable. This would lower the barrier for both preclinical studies and clinical applications. Besides tumor vascular permeability we have investigated in this study, NEB PET has the potential to be applied to many cases in which Evans Blue has been used to evaluate vascular permeability, protein transfer across the endothelial barrier, and loss of integrity of the BBB [51]. If the targets of interest have low blood supply, the outlining of ROI may be challenging due to the non-ideal spatial resolution of PET. This problem can be solved by multiple-modality imaging such as PET/CT or PET/MRI, in which CT or MRI can provide excellent morphological resolution to define the lesion borders [52].
In summary, we have established an innovative strategy based on NEB PET to noninvasively evaluate vascular permeability. Tumor vascular permeability and blood volume fraction can be noninvasively quantified, which could provide functional vascular parameters for patient pre-selection, response monitoring following antiangiogenic therapy, and guiding drug delivery.
Acknowledgements
The authors gratefully acknowledge the National Natural Science Foundation of China (81471684 and 81371596) and the Intramural Research Program, National Institute of Biomedical Imaging and Bioengineering, National Institutes of Health. Haojun Chen was partially funded by the China Scholarship Council (CSC).
Supplementary Material
Supplementary figures.
Competing Interests
The authors have declared that no competing interest exists.
References
1. Folkman J. Angiogenesis in cancer, vascular, rheumatoid and other disease. Nat Med. 1995;1:27-31
2. Fukumura D, Jain RK. Tumor microvasculature and microenvironment: targets for anti-angiogenesis and normalization. Microvasc Res. 2007;74:72-84
3. Dvorak HF, Brown LF, Detmar M. et al. Vascular permeability factor/vascular endothelial growth factor, microvascular hyperpermeability, and angiogenesis. Am J Pathol. 1995;146:1029-39
4. Maeda H. Tumor-selective delivery of macromolecular drugs via the EPR effect: background and future prospects. Bioconjug Chem. 2010;21:797-802
5. Heneweer C, Holland JP, Divilov V. et al. Magnitude of enhanced permeability and retention effect in tumors with different phenotypes: 89Zr-albumin as a model system. J Nucl Med. 2011;52:625-33
6. Tozer GM, Kanthou C, Baguley BC. Disrupting tumour blood vessels. Nat Rev Cancer. 2005;5:423-35
7. Graff BA, Bjornaes I, Rofstad EK. Microvascular permeability of human melanoma xenografts to macromolecules: relationships to tumor volumetric growth rate, tumor angiogenesis, and VEGF expression. Microvasc Res. 2001;61:187-98
8. Radu M, Chernoff J. An in vivo assay to test blood vessel permeability. J Vis Exp. 2013:e50062
9. Saria A, Lundberg JM. Evans blue fluorescence: quantitative and morphological evaluation of vascular permeability in animal tissues. J Neurosci Methods. 1983;8:41-9
10. Le VH, Fishman WH. Combination of Evans blue with plasma protein; its significance in capillary permeability studies, blood dye disappearance curves, and its use as a protein tag. Am J Physiol. 1947;151:26-33
11. Gibson JG, Evans WA. Clinical Studies of the Blood Volume. I. Clinical Application of a Method Employing the Azo Dye "Evans Blue" and the Spectrophotometer. J Clin Invest. 1937;16:301-16
12. Michel CC, Mason JC, Curry FE. et al. A development of the Landis technique for measuring the filtration coefficient of individual capillaries in the frog mesentery. Q J Exp Physiol Cogn Med Sci. 1974;59:283-309
13. Reyes-Aldasoro CC, Wilson I, Prise VE. et al. Estimation of apparent tumor vascular permeability from multiphoton fluorescence microscopic images of P22 rat sarcomas in vivo. Microcirculation. 2008;15:65-79
14. Marzola P, Degrassi A, Calderan L. et al. Early antiangiogenic activity of SU11248 evaluated in vivo by dynamic contrast-enhanced magnetic resonance imaging in an experimental model of colon carcinoma. Clin Cancer Res. 2005;11:5827-32
15. Turetschek K, Preda A, Floyd E. et al. MRI monitoring of tumor response following angiogenesis inhibition in an experimental human breast cancer model. Eur J Nucl Med Mol Imaging. 2003;30:448-55
16. Cyran CC, Sennino B, Fu Y. et al. Permeability to macromolecular contrast media quantified by dynamic MRI correlates with tumor tissue assays of vascular endothelial growth factor (VEGF). Eur J Radiol. 2012;81:891-6
17. de Langen AJ, van den Boogaart VE, Marcus JT. et al. Use of H215O-PET and DCE-MRI to measure tumor blood flow. Oncologist. 2008;13:631-44
18. Choyke PL, Dwyer AJ, Knopp MV. Functional tumor imaging with dynamic contrast-enhanced magnetic resonance imaging. J Magn Reson Imaging. 2003;17:509-20
19. Ferrier MC, Sarin H, Fung SH. et al. Validation of dynamic contrast-enhanced magnetic resonance imaging-derived vascular permeability measurements using quantitative autoradiography in the RG2 rat brain tumor model. Neoplasia. 2007;9:546-55
20. Essig M, Shiroishi MS, Nguyen TB. et al. Perfusion MRI: the five most frequently asked technical questions. AJR Am J Roentgenol. 2013;200:24-34
21. Allen-Auerbach M, Weber WA. Measuring response with FDG-PET: methodological aspects. Oncologist. 2009;14:369-77
22. Chen H, Li Y, Wu H. et al. 3'-deoxy-3'-[18F]-fluorothymidine PET/CT in early determination of prognosis in patients with esophageal squamous cell cancer: comparison with [18F]-FDG PET/CT. Strahlenther Onkol. 2015;191:141-52
23. Wu H, Chen H, Pan D. et al. Imaging integrin αvβ3 and NRP-1 positive gliomas with a novel fluorine-18 labeled RGD-ATWLPPR heterodimeric peptide probe. Mol Imaging Biol. 2014;16:781-92
24. Piert M, Machulla HJ, Picchio M. et al. Hypoxia-specific tumor imaging with 18F-fluoroazomycin arabinoside. J Nucl Med. 2005;46:106-13
25. Niu G, Lang L, Kiesewetter DO. et al. In vivo Labeling of Serum Albumin for PET. J Nucl Med. 2014;55:1150-6
26. Wang Y, Lang L, Huang P. et al. In vivo albumin labeling and lymphatic imaging. Proc Natl Acad Sci U S A. 2015;112:208-13
27. Zhang J, Lang L, Li F. et al. Clinical Translation of a Novel Albumin-Binding PET Radiotracer 68Ga-NEB. J Nucl Med. 2015;56:1609-14
28. Zhang W, Wu P, Li F, et al.Potential Applications of Using 68Ga-Evans Blue PET/CT in the Evaluation of Lymphatic Disorder. Preliminary Observations. Clin Nucl Med. 2016;41:302-8
29. National Academy. Guide for the Care and Use of Laboratory Animals. Washington, DC: National Academy Press. 1996
30. Schmidt KC, Turkheimer FE. Kinetic modeling in positron emission tomography. Q J Nucl Med. 2002;46:70-85
31. Langohr K, Melis GG. Estimation and residual analysis with R for a linear regression model with an interval-censored covariate. Biometrical journal Biometrische Zeitschrift. 2014
32. Tofts PS, Brix G, Buckley DL. et al. Estimating kinetic parameters from dynamic contrast-enhanced T1-weighted MRI of a diffusable tracer: standardized quantities and symbols. J Magn Reson Imaging. 1999;10:223-32
33. Tofts PS, Kermode AG. Measurement of the blood-brain barrier permeability and leakage space using dynamic MR imaging. 1. Fundamental concepts. Magn Reson Med. 1991;17:357-67
34. Barnes SL, Whisenant JG, Loveless ME. et al. Practical dynamic contrast enhanced MRI in small animal models of cancer: data acquisition, data analysis, and interpretation. Pharmaceutics. 2012;4:442-78
35. McGrath DM, Bradley DP, Tessier JL. et al. Comparison of model-based arterial input functions for dynamic contrast-enhanced MRI in tumor bearing rats. Magn Reson Med. 2009;61:1173-84
36. Parker G, Jackson A, Waterton J. et al. Automated arterial input function extraction for T1-weighted DCE-MRI. Proceedings of the 11th Annual Meeting of ISMRM, Toronto, Canada. 2003:1264
37. Yang JC, Haworth L, Sherry RM. et al. A randomized trial of bevacizumab, an anti-vascular endothelial growth factor antibody, for metastatic renal cancer. N Engl J Med. 2003;349:427-34
38. Niu G, Li Z, Xie J. et al. PET of EGFR antibody distribution in head and neck squamous cell carcinoma models. J Nucl Med. 2009;50:1116-23
39. Persson CG. Plasma exudation and asthma. Lung. 1988;166:1-23
40. Saunders NR, Ek CJ, Habgood MD. et al. Barriers in the brain: a renaissance? Trends Neurosci. 2008;31:279-86
41. Saunders NR, Dziegielewska KM, Mollgard K. et al. Markers for blood-brain barrier integrity: how appropriate is Evans blue in the twenty-first century and what are the alternatives? Front Neurosci. 2015;9:385
42. Bruns CJ, Liu W, Davis DW. et al. Vascular endothelial growth factor is an in vivo survival factor for tumor endothelium in a murine model of colorectal carcinoma liver metastases. Cancer. 2000;89:488-99
43. Laird AD, Christensen JG, Li G. et al. SU6668 inhibits Flk-1/KDR and PDGFRbeta in vivo, resulting in rapid apoptosis of tumor vasculature and tumor regression in mice. FASEB J. 2002;16:681-90
44. Tozer GM. Measuring tumour vascular response to antivascular and antiangiogenic drugs. Br J Radiol. 2003;76:S23-35
45. Willett CG, Boucher Y, di Tomaso E. et al. Direct evidence that the VEGF-specific antibody bevacizumab has antivascular effects in human rectal cancer. Nat Med. 2004;10:145-7
46. Jain RK. Normalization of tumor vasculature: an emerging concept in antiangiogenic therapy. Science. 2005;307:58-62
47. Hu S, Kiesewetter DO, Zhu L. et al. Longitudinal PET imaging of doxorubicin-induced cell death with 18F-Annexin V. Mol Imaging Biol. 2012;14:762-70
48. Niu G, Zhu L, Ho DN. et al. Longitudinal bioluminescence imaging of the dynamics of Doxorubicin induced apoptosis. Theranostics. 2013;3:190-200
49. Giger M, Baumgartner HR, Zbinden G. Toxicological effects of Evans blue and Congo red on blood platelets. Agents Actions. 1974;4:173-80
50. Farrugia A. Albumin usage in clinical medicine: tradition or therapeutic? Transfus Med Rev. 2010;24:53-63
51. Gibson JG, Evans WA. Clinical Studies of the Blood Volume. I. Clinical Application of a Method Employing the Azo Dye "Evans Blue" and the Spectrophotometer. J Clin Invest. 1937;16:301-16
52. Sauter AW, Wehrl HF, Kolb A. et al. Combined PET/MRI: one step further in multimodality imaging. Trends Mol Med. 2010;16:508-15
Author contact
![]() Corresponding authors: Hua Wu, Department of Nuclear Medicine and Minnan PET Center, Xiamen Cancer Hospital, the First Affiliated Hospital of Xiamen University, Xiamen, China, E-mail: wuhua1025com; Gang Niu, 35A Convent Drive Rm GD959, Bethesda, MD 20892, E-mail: niugnih.gov; Xiaoyuan Chen, 35A Convent Drive Rm GD937, Bethesda, MD 20892, E-mail: shawn.chengov
Corresponding authors: Hua Wu, Department of Nuclear Medicine and Minnan PET Center, Xiamen Cancer Hospital, the First Affiliated Hospital of Xiamen University, Xiamen, China, E-mail: wuhua1025com; Gang Niu, 35A Convent Drive Rm GD959, Bethesda, MD 20892, E-mail: niugnih.gov; Xiaoyuan Chen, 35A Convent Drive Rm GD937, Bethesda, MD 20892, E-mail: shawn.chengov
Citation styles
APA
Chen, H., Tong, X., Lang, L., Jacobson, O., Yung, B.C., Yang, X., Bai, R., Kiesewetter, D.O., Ma, Y., Wu, H., Niu, G., Chen, X. (2017). Quantification of Tumor Vascular Permeability and Blood Volume by Positron Emission Tomography. Theranostics, 7(9), 2363-2376. https://doi.org/10.7150/thno.19898.
ACS
Chen, H.; Tong, X.; Lang, L.; Jacobson, O.; Yung, B.C.; Yang, X.; Bai, R.; Kiesewetter, D.O.; Ma, Y.; Wu, H.; Niu, G.; Chen, X. Quantification of Tumor Vascular Permeability and Blood Volume by Positron Emission Tomography. Theranostics 2017, 7 (9), 2363-2376. DOI: 10.7150/thno.19898.
NLM
Chen H, Tong X, Lang L, Jacobson O, Yung BC, Yang X, Bai R, Kiesewetter DO, Ma Y, Wu H, Niu G, Chen X. Quantification of Tumor Vascular Permeability and Blood Volume by Positron Emission Tomography. Theranostics 2017; 7(9):2363-2376. doi:10.7150/thno.19898. https://www.thno.org/v07p2363.htm
CSE
Chen H, Tong X, Lang L, Jacobson O, Yung BC, Yang X, Bai R, Kiesewetter DO, Ma Y, Wu H, Niu G, Chen X. 2017. Quantification of Tumor Vascular Permeability and Blood Volume by Positron Emission Tomography. Theranostics. 7(9):2363-2376.
This is an open access article distributed under the terms of the Creative Commons Attribution (CC BY-NC) license (https://creativecommons.org/licenses/by-nc/4.0/). See http://ivyspring.com/terms for full terms and conditions.