Impact Factor
- Issue 12; 2026
- Issue 11; 2026
- Issue 10; 2026
- Issue 9; 2026
- Issue 8; 2026
- Volume 16; 2026
- Advance Articles
- Past Issues
- Cover Images
- Cover Suggestion
- Index & Coverage
- Special Issues
Introduction
Results
Conclusions
Materials and Methods
Supplementary Material
Acknowledgements
References
International Journal of Biological Sciences
International Journal of Medical Sciences
 Global reach, higher impact

Theranostics 2017; 7(7):1820-1834. doi:10.7150/thno.18614 This issue Cite
Research Paper
Bright Polymer Dots Tracking Stem Cell Engraftment and Migration to Injured Mouse Liver
Dandan Chen1, Qiong Li1, Zihui Meng2, Lei Guo2, Ying Tang1, Zhihe Liu1, Shengyan Yin1, Weiping Qin1, Zhen Yuan3, Xuanjun Zhang3, Changfeng Wu1 ![]()
1. State Key Laboratory on Integrated Optoelectronics, College of Electronic Science and Engineering, Jilin University, Changchun, Jilin 130012, China;
2. Department of Hepatobiliary-Pancreatic Surgery, China-Japan Union Hospital, Jilin University, Changchun, Jilin 130033, China;
3. Faculty of Health Science, University of Macau, Taipa, Macau SAR China.
Received 2016-12-4; Accepted 2017-1-26; Published 2017-4-10
Abstract

Stem cell therapy holds promise for treatment of intractable diseases and injured organs. For clinical translation, it is pivotal to understand the homing, engraftment, and differentiation processes of stem cells in a living body. Here we report near-infrared (NIR) fluorescent semiconductor polymer dots (Pdots) for bright labeling and tracking of human mesenchymal stem cells (MSCs). The Pdots exhibit narrow-band emission at 775 nm with a quantum yield of 22%, among the highest value for various NIR probes. The Pdots together with a cell penetrating peptide are able to track stem cells over two weeks without disturbing their multipotent properties, as confirmed by the analyses on cell proliferation, differentiation, stem-cell markers, and immunophenotyping. The in vivo cell tracking was demonstrated in a liver-resection mouse model, which indicated that the Pdot-labeled MSCs after tail-vein transplantation were initially trapped in lung, gradually migrated to the injured liver, and then proliferated into cell clusters. Liver-function analysis and histological examination revealed that the inflammation induced by liver resection was apparently decreased after stem cell transplantation. With the bright labeling, superior biocompatibility, and long-term tracking performance, the Pdot probes are promising for stem cell research and regenerative medicine.
Keywords: semiconductor polymer dot, near-infrared fluorescence, stem cells, cell tracking, in vivo imaging.
Introduction
Stem cell therapy has recently attracted tremendous interests in regenerative medicine because of the inherent properties of multipotency and self-renewal of stem cells. The stem cells are able to treat many diseases that are intractable by conventional therapeutic methods [1, 2]. Mesenchymal stem cells (MSCs) are a class of adult stem cells that derive from various tissues, such as bone narrow, umbilical cord and adipose tissue [3]. Under specific in vitro and in vivo conditions, MSCs can differentiate into diverse tissue-specific cells, including chondrocyte, osteoblast, adipocyte, cardiomyocyte, hepatocyte, islet cell and endothelial cell [4]. The multipotent differentiation ability and low immunogenicity of MSCs are promising for repairing damaged tissue and regulation of immune responses [5, 6]. In pre-clinical studies, MSCs have showed excellent therapeutic effect for many intractable diseases, including cardiovascular and cardiac diseases [7], joint disease [8], bone fracture [9], lung injury [10], and liver diseases [11]. For precise evaluation of the therapeutic performance, systematic investigations of MSC behaviors such as migration, proliferation and differentiation in the local microenvironment after in vivo transplantation are highly important. Development of an accurate, sensitive and safe method to label and track stem cells is thus indispensable.
Current cell tracking techniques mainly include positron emission tomography (PET) [12], magnetic resonance imaging (MRI) [13, 14], and fluorescence imaging [15, 16]. Among those, fluorescence methods have been extensively used for cell tracking owing to the high imaging resolution at single-cell or subcellular level [17, 18]. Green fluorescence proteins (GFP) expressed in stem cells by gene transfection can achieve long-term cell tracking capability [19, 20]. However, most methods for GFP expression require selection and clonal expansion that demand prolonged culture and are not suited for cells with limited proliferative potential [21]. The prolonged culture can influence the homing ability of MSCs as they have been shown to lose certain surface markers after a few passages [22]. Moreover, due to safety concerns regarding gene transfection, GFP labeling is unlikely to be adopted for human MSCs used in clinical trials in the near future [23]. In addition, the in vivo tracking by fluorescent proteins suffers from limited penetration depth and strong interference from tissue scattering and auto-fluorescence. These challenges can be tackled by using imaging agents that emit in the near-infrared (NIR) wavelength region. Fluorescent probes such as lipophilic membrane intercalating dyes (e.g., DiR) have been used for stem cell tracking [24]. However, the limited brightness, poor photostability, and small Stocks shift pose difficulties on their applications in high sensitivity imaging and long-term cell tracking studies [25].
Fluorescent nanoparticles are emerging as new fluorescent labels in biology. For example, inorganic quantum dots and lanthanide upconversion nanoparticles have been demonstrated for stem cell labeling and tracking [26-28]. The quantum dots for stem cell tracking are controversial due to the inherent cytotoxicity from heavy metal ions. Low luminescence efficiency of upconversion nanoparticles is a severe limitation for stem cell tracking although NIR excitation possesses deep tissue-penetration depth. Fluorescent semiconductor polymer dots (Pdots) exhibit good biocompatibility and high brightness that are advantageous for biological imaging in living systems [29-32]. Various Pdots have been developed for biological applications such as microbial pathogens detection [33], specific cellular labeling [34], targeted tumor imaging [35], photodynamic cancer therapy [36], chemiluminescence imaging [37], in vivo glucose monitoring [38], and detection of reactive oxygen species [39-41]. A red-emitting Pdot species has recently been used as long-term trackers to understand the contribution of stem cells in skin regeneration [42]. Despite these progresses, the capability for using Pdots in stem-cell therapy and regenerative medicine is largely unexplored. Particularly, it is important yet challenging to track the stem cell engraftment and migration in the large internal organs such as liver. Liver is a vital organ of vertebrates with various complex functions. For malignant liver diseases, hepatectomy is a common treatment method. However, liver regeneration is limited after a liver resection surgery, which may result in a lethal liver failure. MSCs have the ability to differentiate into hepatocyte [43], thus MSCs transplantation can potentially promote liver regeneration and alleviate various complications after hepatectomy.
In this paper, we designed NIR fluorescent Pdots with a high quantum yield for bright labeling and in vivo tracking of MSCs in a liver-resection mouse model. We demonstrated that the Pdots coated with a cell penetrating peptide showed efficient cellular uptake by the MSCs. The impact of the Pdots on the behaviors of MSCs after long-term in vitro tracking was assessed. The results indicate that the proliferation and differentiation ability of MSCs were not affected by the Pdots. The biodistribution of MSCs after transplantation was analyzed by biophotonic imaging, which indicated that the MSCs were predominantly trapped in the lung, gradually migrated to injured liver, and then finally proliferated into cell clusters. This study provides a promising approach for stem cell labeling and tracking in regenerative medicine.
Results
Preparation and Characterizations of NIR Fluorescent Pdots
Semiconductor polymers show multicolor emissions from visible to near infrared region by varying the structures of the polymer backbone [44]. However, the semiconductor polymers with band-gap emission in the NIR region are very rare and their fluorescence quantum yields are typically low [45]. A promising approach is to dope hydrophobic NIR dye into Pdots to amplify the NIR fluorescence by Förster resonance energy transfer (FRET). Among various semiconductor polymers, CN-PPV exhibits a large absorption cross-section and high quantum yield (~ 0.6) [46, 47]. In this study, we choose CN-PPV polymer and NIR775 dye to prepare the NIR fluorescent Pdots by a reprecipitation method (Scheme 1). Due to the rapid change of solvent quality, the polymer chains were folded and collapsed, resulting in the encapsulation of the NIR775 dye into the Pdot matrix. The Pdots were functionalized with poly (styrene maleic anhydride) (PSMA), yielding abundant surface carboxyl group for subsequent modification. The dye-doped Pdots show a hydrodynamic diameter of about 25 nm and a zeta potential of -42 mV as determined by dynamic light scattering (DLS) (Figure 1A). The morphology of Pdots is approximately spherical as observed by transmission electron microscopy (Figure 1A inset).
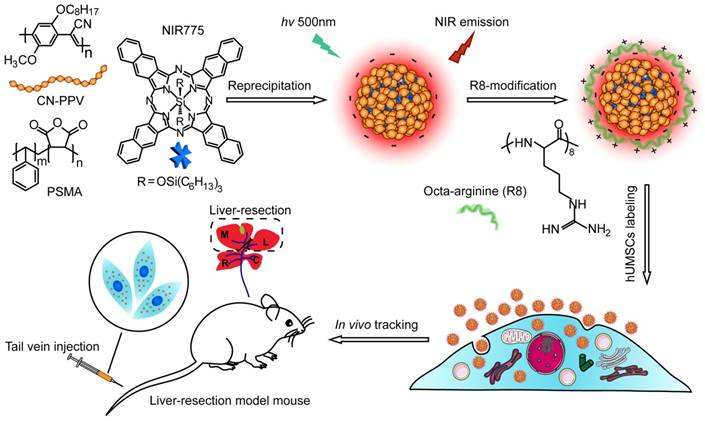
Schematic illustration for preparing NIR fluorescent Pdots and in vivo tracking of MSCs in a liver-resection mouse model. The NIR775 doped CN-PPV Pdots were prepared by using a reprecipitation method. The polymer matrix absorbs and transfers the excitation energy to the NIR dyes that emit strong NIR fluorescence. A cationic cell penetrating peptide R8 was used to modify the Pdot surfaces, yielding rapid and highly bright labeling of MSCs via cellular uptake. The Pdot-labeled MSCs were transplanted into the liver-resected model mice.
Characterizations of NIR775-doped CN-PPV Pdots. A) Hydrodynamic diameter of the Pdots. The inset shows a representative TEM image. B) Spectral overlap between the emission of CN-PPV and the absorption of NIR775. C) Absorption spectra of NIR Pdots at different NIR775 doping concentrations. D) Fluorescence spectra of NIR Pdots at different NIR775 doping concentrations. E) Room-light and fluorescence images of CN-PPV Pdots and the NIR Pdots under the same excitation but different emission channels using 593 nm and 775 nm band-pass filters, respectively. (F) Fluorescence stability of the NIR Pdots in DMEM medium supplemented with 10% FBS during 45 days storage.
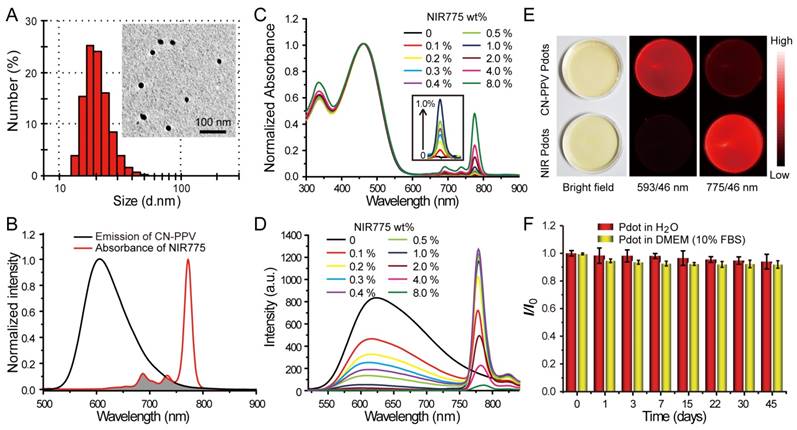
Fluorescence spectroscopy indicates the occurrence of efficient energy transfer inside the Pdots that results in amplified NIR fluorescence. As shown in Figure 1B, CN-PPV polymer possesses broad emission band ranging from 550 to 700 nm, displaying a reasonable spectral overlap with the absorption spectra of NIR775 dye. Because of the large absorption cross-section and high quantum yield, CN-PPV polymer serves as a light absorber that transfers the excitation energy to NIR775 dye. The weight fraction of NIR775 in the Pdots was varied from 0.1~8% to obtain Pdots with high fluorescence quantum yield. As shown by the optical spectroscopy in Figure 1C and Figure 1D, the fluorescence of CN-PPV was quenched as the doping concentration is increased. The emission of NIR775 increased initially, reached a maximum, and then decreased when the doping concentration was higher than 1%. The quantum yield of NIR775-doped Pdots (~1 wt%) was measured to be 22%, which is higher than most organic NIR fluorescent dyes [25]. It is worth noting that the quantum yield of NIR775-doped CN-PPV Pdots is also higher than those of the same dye doped in other conjugated polymers, which are 9% for MEH-PPV and 11% for PFBT, respectively [48, 49]. We further compared the brightness of the NIR Pdots with Qdot 800 by single particle imaging and statistics. As shown in Figure S1, single particle fluorescence images of the NIR Pdots exhibit high signal-to-noise ratio than that of the Qdot 800. The intensity distribution statistics indicated that the NIR Pdots were 2 times brighter than Qdot 800.
The NIR Pdots exhibit a narrow-band emission as compared to the majority of pure Pdot species that usually present broad-band fluorescence. The full width at half maxima (FWHM) of the NIR Pdots was determined to be ~20 nm, which is beneficial for fluorescence detection as band-pass filters are typically used in many imaging systems. Figure 1E showed the fluorescent images of aqueous solutions of pure CN-PPV and NIR775-doped Pdots collected by a small animal imaging system. The two samples at the same concentration were irradiated by the same excitation source, their emissions were collected by using 593/46 nm and 775/46 nm band-pass filters, respectively. Although the pure CN-PPV Pdots showed a high fluorescence quantum yield (~0.6), the fluorescence signal from the NIR channel is higher than the orange channel due to the narrow-band emission of the doped Pdots. The long-term fluorescence stability of the NIR775-doped Pdots in biological environment was investigated by monitoring the fluorescent intensity in cell culture medium (DMEM, 10% FBS) at 37 °C. We found the Pdots retained more than 90% of its initial fluorescence intensity after 45-day storage, and there was no distinct difference with Pdots dispersed in water (Figure 1F). These observations indicate that the NIR775 dye does not leach out from the Pdots, which present stable fluorescence in biological environment. Taken together, the NIR775-doped Pdots with stable and bright NIR fluorescence are suitable for stem cell labeling and long-term tracking.
In Vitro Labeling and Tracking of MSCs with Pdots
We choose human umbilical cord MSCs for cell labeling because their low immunogenicity and pluripotent differentiation ability are promising for stem cell therapy [50]. Stem cells always balance between self-renewal and differentiation, the biocompatibility of exogenous probes is thus a critical factor for stem cell labeling. The cellular toxicity of the Pdots was evaluated by MTT assays. After 24-hour incubation with Pdots at different concentrations (5-50 μg/mL), cell viabilities were determined to be more than 95% as compared to the control without Pdots incubation, confirming the low cytotoxicity of the Pdots (Figure S2A). We then use the carboxyl Pdots at this concentration range for labeling MSCs. For the same incubation time (24 h), MSCs incubated with the Pdots at 30 μg/mL exhibited high labeling brightness as determined by flow cytometry (Figure S2B). At the same Pdots concentration (~30 μg/mL), flow cytometry showed that the cell labeling brightness apparently increased with extending the incubation time from 1 to 24 h (Figure 2A). Fluorescence imaging indicated the time-dependent cellular uptake of the Pdots was consistent with the flow cytometry results (Figure S2C). The carboxyl Pdots are most likely internalized by the MSCs via an endocytosis pathway, as reported for the Pdot uptake in many other cell lines [51, 52].
Labeling brightness of MSCs by NIR775-doped Pdots analyzed by flow cytometry and fluorescent imaging. A) Flow cytometry of MSCs incubated with carboxyl Pdots at 30 μg/mL for different incubation time. B) Flow cytometry of MSCs incubated with R8-Pdots at different R8/Pdot molar ratio for 4 hours. C) Flow cytometry of MSCs incubated with R8-Pdots at R8/Pdot molar ratio of 1000 for different time. D) Brightness comparisons of MSCs labeled with carboxyl Pdots and R8-Pdots. E) Fluorescence imaging of MSCs labeled with carboxyl Pdots and R8-Pdots, respectively. Scale bar represents 100 μm.
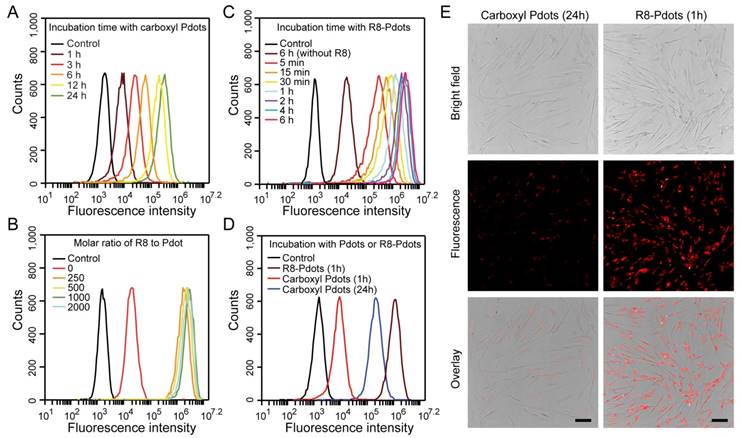
We developed a rapid yet bright labeling approach by using a cell-penetrating peptide. Cell-penetrating peptides are a class of short peptides that facilitate cellular uptake of various cargos from small molecules to nanoparticles [53-55]. The carboxyl Pdots were modified by octa-arginine (R8) through electrostatic interactions. The carboxyl Pdots are negatively charged, and the R8 modification converts the Pdot surface to positive charge. The colloidal stability of the R8-modified Pdots (R8-Pdots) at different R8/Pdot molar ratio was examined by measuring the hydrodynamic diameters and zeta potentials. When the ratio of R8 to Pdot is higher than 500, the R8-Pdots are stable without sign of aggregation for two-week storage (Figure S3). By using the low Pdot concentration (10 μg/mL) but varying the R8 to Pdot ratio, the labeled MSCs were analyzed by flow cytometry and fluorescence imaging, which showed that the brightest labeling was obtained for the R8 to Pdot ratio of ~1000 (Figure 2B and Figure S4). When the molar ratio is higher than 1000, excess R8 molecules in the solution can block the membrane interaction sites and limit the cellular uptake of R8-Pdots. It is worth noting that the R8-Pdots yielded a much brighter labeling in a short time as compared to the carboxyl Pdots. Nearly all the MSCs (~99.9%) were labeled by the R8-Pdots after 5-minute incubation, while the labeling brightness is clearly enhanced as the incubation time is increased (Figure 2C and Figure S5). Flow cytometry showed that the mean fluorescence intensity of MSCs labeled by R8-Pdots after 1-hour incubation was 100 times higher than those labeled with carboxyl Pdots under the same conditions, and even 3 times higher than that labeled with carboxyl Pdots for 24-hour incubation (Figure 2D). The enhanced labeling brightness by R8-Pdots is clearly observed by fluorescence imaging (Figure 2E), which further confirmed that the R8 peptide significantly increased the labeling efficiency of MSCs even at low Pdot concentration and short incubation time. Stem cells are generally sensitive and fragile to external stimuli, thus an ideal fluorescent probe should have minimal perturbation (i.e. labeling time) to the stem cells while generating sufficient fluorescence signal for subsequent fluorescence tracking. Therefore, the high labeling brightness by R8-Pdots is valuable for further stem cells tracking studies.
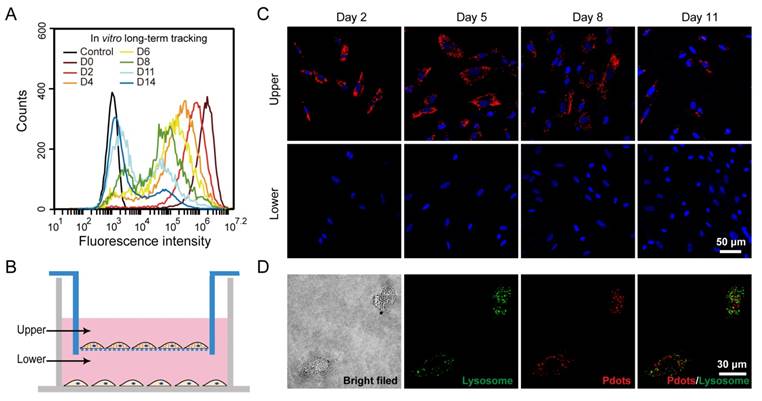
The in vitro cell tracking performance of R8-Pdots was evaluated by flow cytometry. After the MSCs were incubated with R8-Pdots (10 μg/mL, 4 hours), the fluorescence intensity of MSCs were quantified at designated time point. As shown in Figure 3A, the mean fluorescence intensity of the freshly labeled MSCs was 2000-fold higher than that of unlabeled cells. The fluorescence intensity was decreased gradually as the cells were cultured and passaged. However, the labeled MSCs were apparently identified by flow cytometry 14 days after the initial labeling. The time-dependent fluorescence decrease is most likely due to the cell division. A transwell culture system was used to examine the exocytosis of Pdots from the labeled MSCs [56]. As shown in Figure 3B, the Pdot-labeled MSCs were cultured in upper chamber, while the unlabeled MSCs were cultured in the lower chamber. A membrane with pore diameter of 0.4 μm between the upper and lower chambers allows free diffusion of Pdots across the membrane. The fluorescence intensity of MSCs from the upper compartment decreased gradually as cells were divided. However, the cells from lower compartment did not show fluorescence signal during the entire process (Figure 3C). The transwell culture assay indicated the majority of Pdots are retained inside the MSCs and their daughter cells during cell division. The negligible exocytosis allows for the MSCs tracking over a relatively long period without rapid fluorescence loss and false positive signal. The subcellular distribution of the R8-Pdots was investigated by confocal fluorescence imaging. Lysosome staining was performed after MSCs were labeled with R8-Pdots. Fluorescence colocalization indicates that the majority of R8-Pdots were not trapped into lysosome (Figure 3D), which is consistent with previous results that the mechanism of inorganic Qdots delivered by arginine-rich peptides was through a direct membrane transduction and the Qdots stayed in cytosol without significant lysosomal trapping [57].
A) Long-term in vitro tracking performance of MSCs labeled by R8-Pdots at 10 μg/mL for 4-hour incubation. The fluorescence intensity was analyzed by flow cytometry as the labeled MSCs were cultured for designated time intervals. The unlabeled MSCs were used as the control. B) Schematic illustration of the transwell migration system for examining the cell exocytosis of Pdots. The Pdot-labeled and unlabeled MSCs were separately cultured in upper and lower chamber, isolated by porous membrane (pore size 0.4 μm). C) Confocal fluorescence images of the Pdot-labeled MSCs in the upper chamber and the unlabeled MSCs in the lower chamber in 2, 5, 8 and 11 days post labeling. D) Confocal fluorescence images of lysosome staining of the Pdot-labeled MSCs.
Biological Effect of Pdots on Pluripotent Functions of MSCs
After the MSCs were brightly labeled with R8-Pdots, we set out to investigate the functions and behaviors of the MSCs, including their proliferation, differentiation, tumorigenicity, pluripotent genes, and immunophenotyping. First, the in vitro proliferation ability of Pdot-labeled MSCs was assessed by MTT assays [42]. After incubation with R8-Pdots (10 μg/mL, 24 h), the cell viability was more than 95% as compared to the control cells without the Pdot-labeling. The labeled MSCs were cultured in fresh medium for 24 h, 48 h and 72 h, respectively, and then examined by MTT assays. The cell proliferation of Pdot-labeled MSCs showed no significant difference as compared to the unlabeled MSCs (Figure 4A). In addition, the viability of MSCs retained more than 95% after incubated with R8-Pdots for 24 h, 48 h, and 72 h, respectively (Figure S6). The above results indicated that the R8-Pdots do not influence the proliferation ability of MSCs.
Characterizations of the biological functions of the Pdot-labeled MSCs. A) Proliferation profiles of the MSCs incubated with R8-Pdots for 24 hours and further cultured for 24 h, 48 h and 72 h in fresh medium. The unlabeled MSCs were used as control. B) Chondrogenic differentiation of unlabeled MSCs and the Pdot-labeled MSCs characterized by Safranin O staining. Fluorescence imaging and Safranin O staining were performed 30 days after the induced differentiation. Scale bar represents 50 μm. C) Western blot analysis of tumorigenicity of the Pdot-labeled MSCs, by using HeLa cells as a control. D) Stem-cell marker expressions of the Pdot-labeled MSCs. Confocal fluorescence imaging showed that the Pdot-labeled MSCs retained robust expression of the stem cell markers such as OCT-4, NANOG and SSEA-4 three days after the Pdot-labeling. The microtubule labeling was also shown as a positive control for the labeling methods. The green channel showed the marker expression. The red and blue channels represented the fluorescent of Pdots and Hoechst 33258, respectively. Scale bar represents 50 μm.
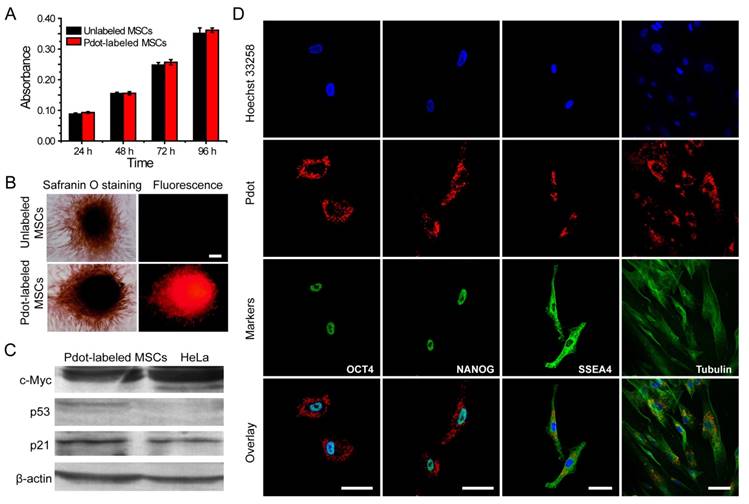
Phenotypic expression and multipotential differentiation ability are two critical factors to characterize stem cells [4]. Immunofluorescence staining was performed to analyze the phenotypes of the MSCs that were labeled with Pdots and further cultured for 15 days. As indicated by flow cytometry (Figure S7), the labeled MSCs retained high expressions of CD29, CD44, CD73, CD105 and CD90, but no expression of CD34, CD45, HLA-DR, and CD79a. These results are consistent with the MSCs without Pdot labeling, indicating little effect of the Pdots on the phenotypic expression of MSCs. Chondrogenic differentiation was performed to investigate whether the Pdots affect cell differentiation ability. Figure 4B showed that both the Pdot-labeled and unlabeled MSCs grew into bunches of large cells mass after the induced differentiation for 30 days. Safranine O was used to stain chondroitin sulfate, which is an indicator of chondrogenic differentiation [58]. After safranine O staining, both the R8-Pdot labeled and unlabeled cells presented red color, indicating that the R8-Pdot labeled MSCs maintained the differentiation ability of MSCs into chondrocyte. In addition, strong fluorescence signal was clearly observed from Pdot-labeled MSCs, which further confirmed the superior biocompatibility of Pdots and their stability in biological environment.
Western blot analysis of c-Myc, p53 and p21 proteins was performed to examine the tumorigenicity, which is a key issue to be addressed for using stem cells in regenerative therapy. C-Myc has a pivotal function in growth control, cell apoptosis and metabolism. High expression of c-Myc oncogene has been observed in many cancer cells [59]. Moreover, it is an important gene that maintains stem cell pluripotency and self-renewal capacity [60]. The p53 is an important tumor suppressor gene in preventing genome mutation [61]. The p21 acts as a potent cyclin-dependent kinase inhibitor that regulates cell cycle [62]. We analyzed the expressions of c-Myc, p53 and p21 proteins by Western blot, in which HeLa cells were used as a control. Our results indicated that HeLa cells showed high expression of c-Myc, low expression of p21 and no expression of p53 proteins (Figure 4C). For the Pdot-labeled MSCs, high expressions of c-Myc and p21, but low expression of p53, were observed. The Western blot analysis revealed that the Pdot-labeled MSCs did not exhibit a tumorigenic phenotype.
RT-PCR assays were further performed to analyze the genes that control the self-renewal capacity and pluripotency of the MSCs. OCT-4, NANOG, SOX-2 are three critical transcription factors in maintaining self-renewal capacity and pluripotency of stem cells, and SSEA-4 is an important marker for identifying undifferentiated stem cells [63, 64]. The expressions of the above four markers were controlled by OCT-4, NANOG, SOX-2 and SSEA-4 genes, respectively. The four genes were clearly detected in the Pdot-labeled MSCs by RT-PCR assays (Figure S8). As further shown by fluorescence staining (Figure 4D), the Pdot-labeled MSCs after 3-day culture showed high expressions of the OCT-4, NANOG, and SSEA-4 markers. The staining results and gene analysis indicated that the Pdot-labeled MSCs retained robust self-renewal capacity and multi-lineage differentiation potential. Taken together, the above characterizations demonstrated that the biological functions of the MSCs, including cell proliferation, differentiation potential, phenotypic expressions, and pluripotent genes, were not affected by the Pdot labeling. These results indicate the good biocompatibility and potential of the bright Pdot probe for stem cell labeling and tracking.
In Vivo Tracking of MSCs in a Liver-resection Mouse Model
Liver is the largest internal organ that plays various complex roles in human. For malignant liver diseases, partial hepatectomy is a common treatment method. A fascinating property of liver is the high regeneration ability. However, liver regeneration is limited after extensive liver resection, which may lead to liver failure. Stem cell transplantation is a promising approach to promote liver regeneration. Previous studies have shown that the transplanted MSCs can differentiate into hepatocyte-like cells, thus stem cell therapy has been used to treat liver diseases, such as liver fibrosis, acute liver failure, and hepatitis [65, 66]. To explore the in vivo tracking of the Pdot-labeled MSCs, we used a liver-resection mouse model (Figure S9), where approximately 70 wt% of the liver was resected to mimic the surgical hepatectomy after serious liver diseases [67]. The R8-Pdot labeled MSCs were transplanted into the mouse to investigate the functions of MSCs in liver regeneration. To enhance the homing efficiency of the MSCs, liver injury was increased by combining ischemia-reperfusion injury with the partial hepatectomy, for which liver was resected while the portal vein was clamped. By this clamping procedure, bleeding was obviously inhibited during parenchymal dissection [68, 69]. The fate of the transplanted MSCs was investigated by tracking the fluorescence signal of the NIR775-doped Pdots.
We explored the engraftment and migration of MSCs in the liver-injured mice after the MSCs were administered via tail vein injection. Twenty-seven ICR mice were randomly divided to three groups, including hepatectomy group (hepatectomy without cell transplantation), cell therapy group (hepatectomy with cell transplantation) and sham group (sham operation with cell transplantation). The Pdot-labeled MSCs (~3.0×10⁵ cells) were transplanted into each mouse in the cell therapy group and sham group 24 hours after the surgery. In the hepatectomy group without MSC transplantation, equal volume of saline was injected via tail vein. At designated times, the mice were sacrificed and the organs including liver, lung, kidney, spleen and heart were excised for biophotonic imaging. As shown by the biophotonic imaging in Figure 5A and Figure 5B, there was strong fluorescence from the lung, weak signal from liver, and nearly no signal from other organs, indicating that most of the injected MSCs were trapped in the lung initially. For both cell-injection groups, the fluorescence signals from the lungs in day 4 and day 7 were apparently decreased as compared to the values in day 1 post injection. However, the fluorescence of the lungs showed distinct decreases for the mice in the sham and the cell therapy group. For the sham group, the fluorescence intensity of the lungs in day 4 was decreased to 60% of the initial value (day 1) after cell transplantation (Figure 5C), while the fluorescence intensity of the liver increased gradually. For the cell therapy group, the fluorescence intensity of the lungs in day 4 was decrease to 40 % of the initial value (day 1) after cell transplantation (Figure 5D). The rapid fluorescence decrease of the lungs in the cell therapy group indicated the MSCs migrated out of the lungs more rapidly as compared to the sham group. In contrast with the sham group where the liver weight remained relatively constant, the fluorescence intensity of the livers in the cell therapy group decreased gradually because the cells were divided and the livers were regenerated at a relatively high rate.
In vivo tracking of MSCs in a liver-resection mouse model. The Pdot-labeled MSCs were intravenously transplanted into the mice with liver-resection surgery. The organs were collected from the mice at designated times, and imaged by a biophotonic imaging system. The images in A and B showed fluorescence signals from the organs under the same excitation and collection conditions. A) Distribution of MSCs in liver, spleen, kidney and heart. B) Distribution of MSCs in lung. C) Quantitative fluorescence analysis of the Pdot-labeled MSCs in liver, lung, spleen, kidney and heart in day 1, day 4, day 7 post cell transplantation into mice from sham group. D) Quantitative fluorescence analysis of the Pdot-labeled MSCs in liver, lung, spleen, kidney and heart in day 1, day 4, day 7 post cell transplantation into mice from cell therapy group. E) Change of the body weight of the mice post hepatectomy. F) Change of the liver to body weight ratio (%) of the mice in day 1, day 4, day 7 post cell transplantation.
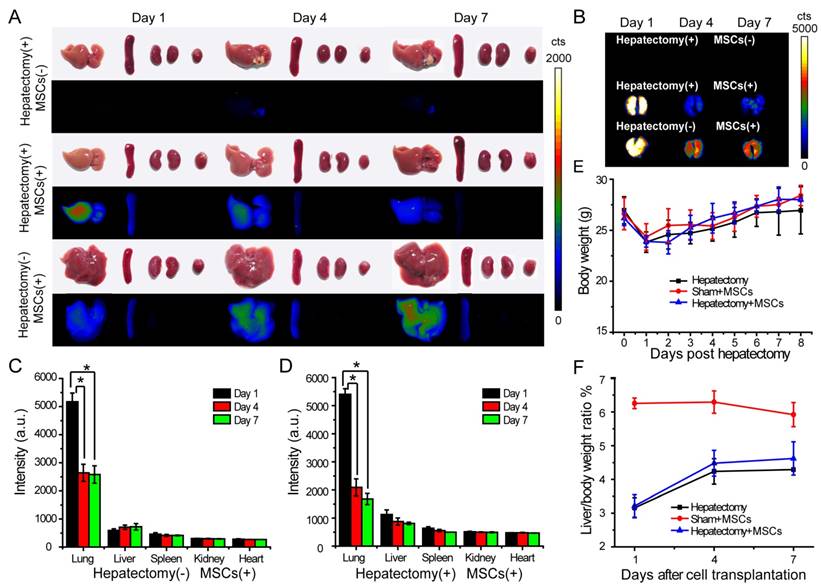
We monitored the body weight and change of the liver to body weight ratio to evaluate liver regeneration by the MSC infusion. The body weight was measured every day and the liver weight was recorded from the sacrificed mice in 1, 4, 7 days post MSCs transplantation. We observed that the body weight of the mice decreased significantly after hepatectomy, and increased gradually in the next 7 days (Figure 5E). In the sham group, the livers of mice were slightly injured, so the liver to body weight ratio also decreased initially. The liver to body weight ratio of both the hepatectomy group and the cell therapy group increased in 4 days post hepatectomy, then increased slowly between 4 to 7 days (Figure 5F). However, the liver to body weight ratio of the mice in the cell therapy group increased more quickly as compared to the hepatectomy group, indicating that the MSC transplantation accelerated the liver regeneration.
Liver functions analysis were performed by measuring alanine aminotransferase (ALT), aspartate aminotransferase (AST), albumin (ALB) and total bilirubin (TBIL) levels in serum. Serum ALT and AST levels were significantly increased after hepatectomy, and then the values were decreased sharply during the four days post hepatectomy (Figure 6A). The ALT and AST values in the hepatectomy group and cell therapy group were decreased to normal levels in 7 days post hepatectomy as compared to those in the sham group. Serum TBIL levels of the mice in each group increased in 4 days post hepatectomy, and then decreased substantially in 7 days post hepatectomy. Compared with sham group, the serum ALB levels of the mice in the other two groups were reduced after the hepatectomy. However, the values increased gradually in day 4 and day 7. The serum ALB levels of the mice in the cell therapy group showed larger increases than those in the hepatectomy group in day 7 post hepatectomy. Taken together, liver was severely injured severely by the hepatectomy, and could be repaired to a certain degree due to liver regeneration. However, the ALT, AST, TBIL levels of the mice in the cell therapy group were lower and ALB level were higher than those in the hepatectomy group without stem cell transplantation during the days after hepatectomy, indicating the MSCs facilitated the recovery of liver functions.
A) Liver function analysis of the mice in day 1, 4, 7 post cell transplantation via tail vein injection. B) Representative fluorescence images of liver sections from the mice with cell transplantation. C) Immunofluorescent staining of Kupffer cells by using fluorescent antibody against F4/80 (Green channel). Red channel represents fluorescence signal of the Pdots. Blue channel represents the nuclear stained by Hoechst 33258. The arrow represents Pdot-labeled MSCs. D) H&E staining of liver sections from different groups in day 1, 4, 7 post cell transplantation. The arrow represnts inflammatory cells infiltration.
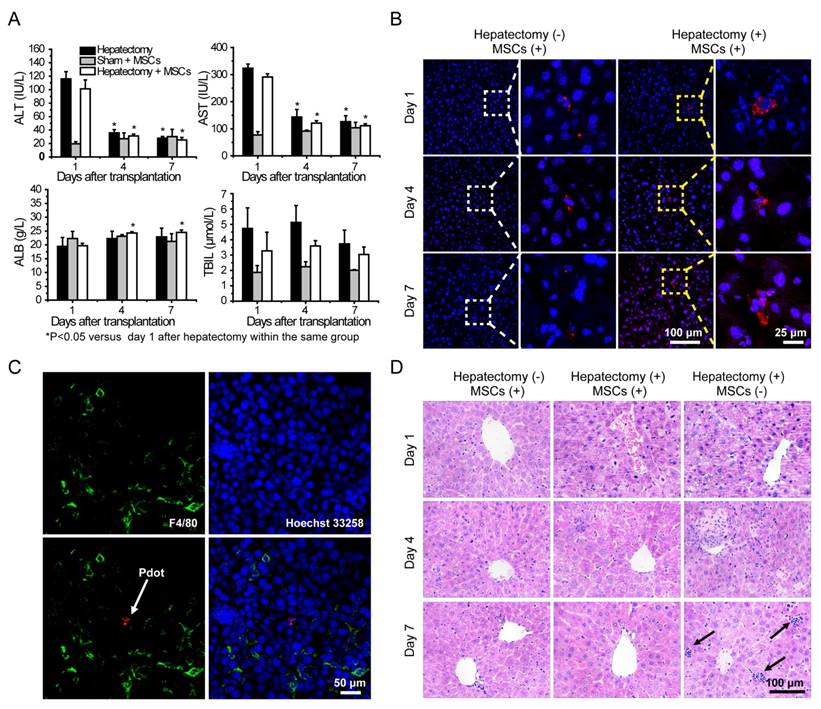
Fluorescence staining was performed to analyze the behaviors of MSCs during liver regeneration. Frozen sections of the organs in different groups were stained by Hoechst 33258, and then characterized by confocal laser scanning microscopy (Figure 6B and Figure S10). After transplantation via tail vein, MSCs were initially trapped in lung, then migrated gradually to liver and scattered through the entire liver, as shown by tracking the fluorescence signal of the Pdots. For the cell therapy group, the MSCs appeared in cluster form in the liver, while similar clustered MSCs were rarely observed in the liver sections of the sham group. To further examine whether the fluorescence signal was not a false signal resulted from the uptake of the Pdots by resident macrophages (Kupffer cells), liver tissue sections were stained with the macrophage-specific antibody F4/80. As shown by the typical observations from immunofluorescence staining (Figure 6C), overlapping of the fluorescence images showed no sign of colocalization of the Pdot-labeled MSCs (Red) with the F4/80-stained macrophages (Green), suggesting that the observed Pdot-labeled MSCs were not phagocytosed after migration into the injured liver.
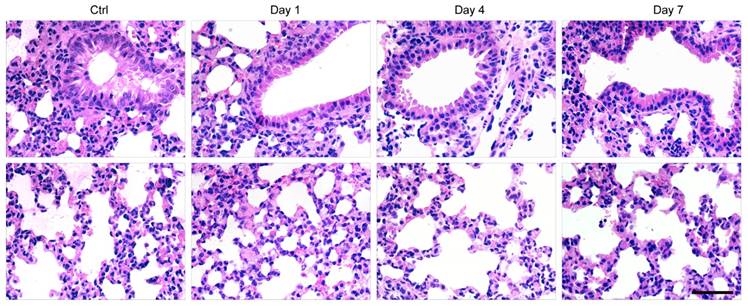
Finally, histological examination of livers was performed to analyze liver pathological process at designated time points. By analyzing the H&E staining results of liver tissues, liver damages such as hepatocyte swelling, ballooning degeneration, sinusoid congestion, hepatic cords disordered, and extensive area of hepatocyte necrosis, were found in day 1 post hepatectomy (Figure 6D). In addition, some hepatocytes showed fatty change on account of hypoxia. For the hepatectomy group, certain levels of inflammatory cell infiltration existed from day 1 to day 7 post hepatecomy. In day 4 post hepatectomy, extensive areas of hepatocyte necrosis disappeared in cell therapy group, while certain cell swelling cases still existed. However, hepatocyte necrosis in hepatectomy group without MSC transplantation was still clearly observed in day 7 post cell transplantation. In addition, there were a large number of inflammatory cells around central vein, portal tract and in blood sinus, which can cause additional inflammatory response. This comparison further confirmed the repairing ability of the MSCs in the liver-resection mouse. Because a large number of Pdot-labeled MSCs were trapped in the lung after tail vein injection, the pathological analysis of lung tissues were performed by H&E staining. By comparing H&E images with and without cell transplantation (Figure 7), we found that the lung structure, including all levels of bronchus and pulmonary alveolus are intact, which demonstrated that the initial trapping of MSCs in lung did not lead to any damage to the lung.
H&E staining of lung sections in day 1, 4, 7 post cell transplantation, with lung sections of healthy mice as controls. Scale bar represents 50 μm.
Conclusions
We have developed NIR fluorescent Pdots for bright labeling and long-term tracking of stem cells in a liver-resection mouse model. The NIR775-doped Pdots exhibited narrow-band fluorescence at 775 nm with a quantum yield of 22%. The Pdots coated with a cell penetrating peptide R8 showed an extraordinary endocytic uptake efficiency that was markedly enhanced by two orders of magnitude as compared to the carboxyl Pdots. Fluorescent signal from the Pdot-labeled MSCs can be tracked over two weeks for in vitro cell tracking studies. The impact of the Pdots on the biological functions of MSCs after long-term tracking was assessed by flow cytometry and fluorescence imaging, which indicate that the Pdots do not disturb the features of MSCs in terms of proliferation, migration, and differentiation functions. The in vivo tracking of the Pdot-labeled MSCs was demonstrated in the liver-resection mouse model. The biodistributions of MSCs after transplantation were analyzed by biophotonic imaging, which indicated that the MSCs were initially trapped in the lung, gradually migrated to the injured liver, and finally proliferated into cell clusters. Both liver function tests and histological examinations showed that the MSCs via tail-vein transplantation could promote the liver regeneration. The high labeling brightness and long-term tracking performance of the Pdots are promising for their applications in stem cell research and regenerative medicine.
Materials and Methods
Materials
The semiconducting polymer poly [2-methoxy-5-(2-ethylhexyloxy)-1,4-(1-cyanovinylene-1,4-phenylene)] (CN-PPV, average molecular weight: 235,000, polydispersity: 8.0) was purchased from American Dye Source, Inc. (Quebec, Canada). The functional polymer poly (styrene-co-maleic anhydride) (PSMA, cumene terminated, average MW≈1700, styrene content 68%), near-infrared organic dye silicon 2, 3-naphthalocyanine bis (trihexylsilyloxide) (NIR775, dye content 95%), tetrahydrofuran (THF, anhydrous, ≥ 99.9%) and HEPES (titration ≥ 99.5%) were purchased from Sigma-Aldrich. Octa-arginine (R8, purity 98.87%) was purchased from Life Tein LLC. Bovine Serum Albumin Fraction (BSA, 98%) was purchased from J&K Chemical Ltd. (Beijing, China).
Preparation and characterizations of Polymer Dots
The NIR775-doped CN-PPV Pdots were prepared by using the re-precipitation method as described previously [70]. Firstly, CN-PPV, amphiphilic polymer PSMA and NIR775 dye were dissolved in THF to prepare stock solutions at a concentration of 1 mg/mL, 1 mg/mL and 0.1 mg/mL, respectively. The solutions containing 50 μg/mL CN-PPV, 10 μg/mL PSMA and a variable fraction of NIR775 (0.1 wt% to 8 wt%) were prepared. The solution mixtures were quickly injected into 10 mL of water under sonication. The solvent THF was removed by nitrogen stripping on an 80 °C hot plate, then the concentrated Pdot solutions were passed through a 0.22 μm cellulose membrane filter to remove large particles.
The particle size and morphology of Pdots were characterized by transmission electron microscopy (H-600, Hitachi, Japan). The average particle size, size distribution and zeta potential of Pdots were measured by Malvern Zetasizer Nano ZS. Optical absorption spectra was recorded by using Shimadzu UV-2550 spectrometer. Fluorescence spectra were obtained by a Hitachi F-4600 fluorescence spectrometer. Fluorescence quantum yields were measured by a spectrometer (QE-2100, Qtsuka, Japan). Fluorescent stability of Pdots in biological environment was monitored for 45 days when the Pdots were incubated at 37 °C in DMEM/F-12 medium supplemented with 10% FBS. The Eppendorf tubes were tightly covered by seal membrane to prevent water evaporation. At designated time points, the emission spectra were measured by a quantum efficiency measurement system (QE-2100, Otsuka, Japan).
Single-particle fluorescence imaging was performed by using a custom built Total Internal Reflection Fluorescence (TIRF) microscope. A 488 nm laser beam was directed into an inverted microscope (Olympus IX71, Japan) using steering optical lenses. The luminescence was collected by a 1.49 NA UAPON 100×TIRF objective (Olympus, Japan). Fluorescence signal passed through a 593 nm long pass filter and directed onto an Andor iXon3 frame transfer EMCCD (Andor Technology, UK). The samples were prepared by diluting NIR Pdots and Qdot 800 in Milli-Q water, then were deposited on a glass cover slide, followed by drying under nitrogen.
In Vitro MSCs Tracking by Pdots
Human umbilical cord mesenchymal stem cells (MSCs) were obtained from SCLNOW (Beijing) Biological Engineering Co., Ltd. MSCs were cultured in DMEM/F-12 medium (Gibco), supplemented with 10% (v/v) fetal bovine serum (FBS, Gibco), 10 ng/mL human fibroblast growth factor-basic (Human FGF-basic, Peprotech), 1% (v/v) MEM Non-essential amino acids (MEM NEAA, Gibco), 1% (v/v) penicillin/streptomycin (10,000 U/mL Penicillin, 10,000 μg/mL Streptomycin, Gibco) and 1‰ (v/v) 2-mercaptoethanol (55 mM in DBPs, Sigma-Aldrich) in a humidified 5% CO2 atmosphere at 37 °C. The culture medium was changed every other day. Cells were detached with 0.25% trypsin-EDTA (Gibco) when cell reached 80% confluence.
MSCs were seeded into 6-well plates (1×10⁵ cells/well) cultured for 12 h. Then the Pdots at a certain concentration in culture medium were added to the wells. At designated time points, the cells were washed with PBS for 3 times to remove free Pdots. Cells were detached by trypsin and resuspended in PBS for flow cytometry analysis or fixed by 4% paraformaldehyde (PFA) for fluorescent imaging. For MSCs labeling with the R8-functionalized Pdots, the Pdots were firstly mixed with R8 peptide for 20 mins, then 2× DMEM/F-12 medium containing 2% FBS, 20 ng/mL Human FGF-basic, 2% (v/v) MEM NEAA, 2% (v/v) penicillin-streptomycin and 2‰ (v/v) 2-mercaptoethanol were added to produce a labeling medium. Cells were incubated with the labeling medium for 4 hours, after which the cells were washed thoroughly with PBS to remove free Pdots for flow cytometry analysis and fluorescent imaging. Fluorescence images of MSCs were acquired on an inverted fluorescence microscope (Olympus IX71, Japan) with a 0.45 NA LUCPLFLN 10×objective. The excitation was generated from a mercury lamp. Fluorescence signal passed through a 593 nm long pass filter and imaged on a CCD.
Cell Viability and Proliferation Assay of MSCs
The cell viability of MSCs labeled by Pdots was evaluated by MTT assays to study the cytotoxicity of Pdots. The MSCs were seeded into 96-well plates with the number of 5,000 cells/well and cultured for 12 h prior to add culture medium containing Pdots (0, 5, 10, 20, 30, 40, 50 μg/mL). Following 24-hour incubation with Pdots, 20 μL MTT (5 mg/mL in PBS) was added into plates. The plate without adding MTT were used as control to substract the absorbance of Pdots. After 4-hour incubation, the culture medium was removed carefully, followed by adding 150 μL DMSO into each well. The plates were rocked gently for 10 mins to fully dissolve formazan, then absorbance of formazan at 570 nm was recorded by using a microplate reader (Cytation3, BioTek). Cell viability was calculated by the ratio of absorbance of the cells incubated with medium containing different concentration of Pdots to that of the cells incubated with culture medium only.
The proliferation ability of Pdot-labeled MSCs was measured by MTT assays. The MSCs were seeded into 96-well plates with number of 2,000 cells/well. The next day, the cells incubated with the labeling medium containing R8-Pdots (molar ratio of R8 to Pdot is 1000) for 24 h, then the cells were further cultured for 24 h, 48 h and 72 h, respectively. At each time point, MTT assays were performed as above to analyze the cell viability, while the unlabeled MSCs were used as controls.
The cell viability of MSCs incubated with R8-Pdots for different time were measured by MTT assay. The MSCs were seeded into 96-well plates with number of 2,000 cells/well. The next day, labeling medium containing R8-Pdots (molar ratio of R8 to Pdot is 1000) were added to the plates. 24 hours later, the old medium were replaced with fresh labeling medium. At each time point, MTT assays were performed as above to analyze the cell viability, while the MSCs incubated with medium without R8-Pdots were used as controls.
Chondrogenic Differentiation
Chondrogenic differentiation of Pdot-labeled MSCs was performed according to the instruction of StemPro® Chondrogenesis Differentiation Kit (A10071-01, Gibco). The induction medium was changed every 2 days. After one month induced differentiation, cells were fixed with 4% PFA for 30 mins, then were stained by 0.1% Safranin O for 2 minutes. Images were obtained by a fluorescent microscopy (Olympus, IX71) and a camera (MshOt, China).
Phenotypic Expressions
For phenotype analysis, the MSCs (Passage 6) labeled by R8-Pdots were cultured for 15 days (fluorescence signal was almost lost). Then the cells were harvested and incubated with FITC or PE-conjugated antibodies for 30 mins at 4 °C in the dark. Cells incubated with isotype-specific IgGs work as negative control. After that the cells were washed in PBS and 10,000 events were collected and analyzed by a flow cytometer. All antibodies were as follows: Mouse Anti-Human CD34-PE (550761), CD45-FITC (555482), HLA-DR-PE (555561), CD79a (563777), CD29-PE (555443), CD44-PE (550989), CD73-PE (550257), CD105-PE (560839), CD90-FITC (555595), Rat Anti-Mouse IgG1-PE (550083) and Anti-Mouse IgG1-FITC (553443). All of the antibodies were purchased from BD Biosciences.
Western Blot Analysis of Oncogenicity
The MSCs (Passage 6) labeled by R8-Pdots were cultured for 15 days (the fluorescence signal was almost lost). The Pdot-labeled MSCs were lysed with 0.5% NP-40 lysis buffer followed by centrifugation (10000×g, 20 mins), and HeLa cells were chosen as control. Total protein concentrations in cell lysates were determined by using BCA Protein Assay kit (P0012S, Beyotime), with BSA as a standard. The expression levels of p53, p21 and c-Myc proteins of specimen were measured by Western blotting analysis according to standard procedures. Equal amount of proteins were loaded on each lines and separated on a 10% SDS-PAGE gel, then protein were transferred to PVDF membrane (Millipore). The membrane was firstly incubated with the following antibodies: anti-p21 (1:200), anti-p53 (1:1000), anti-c-Myc (1:1000), anti-β actin (1:400) overnight at 4 °C, then incubated with horse radish peroxidase (HRP) conjugated Goat anti-mouse IgG. Proteins of interest were detected using the DAB HRP Color Development Kit (P0203, Beyotime).
RT-PCR analysis of Pluripotent Genes
The expressions of pluripotent genes OCT-4, NANOG, SOX-2 and SSEA-4 were analyzed by reverse transcription-polymerase chain reaction (RT-PCR), with β-actin as reference housekeeping gene. Total RNA of 1.5×10⁶ Pdot-labeled MSCs were extracted by using a Total RNA Kit (R6834-01, OMRGA). RT-PCR was performed according to the instructions of the Prime Script™ RT-PCR Kit (RR014A, TAKARA). Briefly, reverse transcription reactions were performed at 42 °C for 30 mins hybridization and 70℃ for 15 min reverse transcription to get complementary DNA. The PCR reactions consisted of 30 cycles of denaturation step (95 °C for 30 s), annealing step (55 °C for 30 s) and primer extension step (72 °C for 30 s), and an extra cycle of elongation was performed at 72 °C for 10 mins. Amplified products were separated on 2% agarose gels containing GoodView dye, then photographs were collected under UV light. The size of the analyzed genes was estimated by the DL500 DNA marker (3590A, TAKARA).
Immunofluorescence Staining
Immunofluorescence staining of the Pdot-labeled MSCs was performed in accordance of manufacturers' instructions. In brief, cells were fixed with 4% PFA for 20 mins at room temperature, permeabilized by using 0.5% TtitonX-100 for 20 mins at room temperature. After blocking with 5% BSA for 1 h at 37 °C, cells were incubated with primary antibodies including OCT-4 (ab19857, Abcam), NANOG (ab109250, Abcam), and SSEA-4 (ab16287, Abcam) at 4 °C overnight, followed by incubation with Alexa Fluor® 488-labeled secondary antibodies for 2 hours at room temperature in dark. Tubulin structure was stained by biotin anti-α-tubulin antibody (627904, Biolegend) and Alexa 488-streptavidin (S11223, Invitrogen).
In Vivo MSC Tracking in a Liver-resection Mouse Model
All animal experiments were performed comply with the Guidelines for the Care and Use of Research Animals established by the Jilin University Institutional Animal Care and Use Committee. Eight-week old ICR male mice were choose to create a 70% hepatectomy model according to the method described by Mitchell and Willenbring [67]. Briefly, the mouse was anaesthetized with isoflurane, then immobilized in a supine position. The abdomen was sterilized by iodophor thoroughly, then a 2 cm incision was cut along medioventral line. The portal vein was clamped for 15 min with a vascular clamp. During the ischemic time, the pedicle of the left lateral and median lobes of the liver were ligated and both lobes were resected successively. After 15 mins, the vascular clip was removed, then the abdomen was sutured. The survival rate of the mice was nearly 100% after the hepatectomy. 24 hours later, the Pdot-labeled MSCs were suspended in PBS with cells density of 3×10⁶ cells/mL, then 100 μL cells suspension were injected into mice of sham group and cell therapy group via tail vein. In the haptatectomy group, equal volume PBS was injected into mice. In 1, 4 or 7 days post cell transplantation, venous blood from each mouse in the three groups was collected. After 30 minutes' standing, the blood were centrifuged at 3000 r/min for 10 mins, then blood serum samples were obtained for further liver-function analysis by standard methods. Then the organs such as liver, lung, spleen, kidney and heart were excised and imaged by a custom-built small-animal imaging system equipped with an Andor iKon-M frame transfer CCD (Andor iKon-M 934, UK) and xenon light source (Asahi Spectra MAX-303, Japan).
Histological Analysis
Liver, lung, spleen, kidney and heart from the mice in the three groups at designated time points were excised and embedded into paraffin or tissue freezing medium (OCT), then cut into 6 µm thick sections. After staining by Hoechst 33258, the frozen sections were imaged by confocal laser scanning microscope (Fluoview FV1000, Olympus) immediately. Frozen sections of liver were stained with Rat anti-F4/80 antibody (ab6640, Abcam) and Alexa Fluor® 488 labeled Goat anti-Rat IgG (ab150157, Abcam). Firstly, liver tissue sections were fixed by cold acetone for 10 mins, then blocked with goat serum for 30 mins at room temperature. Then the tissue sections incubated with Rat anti-F4/80 antibody at 4 °C overnight, followed by incubation with Alexa Fluor® 488-labeled Goat anti-Rat IgG for 30 mins at 37 °C in dark. After nuclear staining with Hoechst 33258 for 20 mins, the sections were observed immediately by confocal laser scanning microscope (Fluoview FV1000, Olympus). Paraffin sections were stained with hematoxylin and eosin (H&E) for pathological analysis.
Statistical Analysis
All statistical analyses were conducted using IBM SPSS statistics. Experimental data were presented as means ± standard deviation. Statistical significance was evaluated by one-way ANOVA statistics. Results were considered statistically significant if *P value <0.05.
Supplementary Material
Supplementary figures.
Acknowledgements
This study was financially supported by the Key Program of National Natural Science Foundation of China (NSFC 61335001, 61222508) and Thousand Young Talents Program. We acknowledge the support from SCLNOW (Beijing) Biological Engineering Co., Ltd.
Competing Interests
The authors have declared that no competing interest exists.
References
1. Uccelli A, Moretta L, Pistoia V. Mesenchymal stem cells in health and disease. Nat Rev Immunol. 2008;8:726-736
2. Kimbrel EA, Lanza R. Current status of pluripotent stem cells: moving the first therapies to the clinic. Nat Rev Drug Discovery. 2015;14:681-692
3. Kern S, Eichler H, Stoeve J, Kluter H, Bieback K. Comparative analysis of mesenchymal stem cells from bone marrow, umbilical cord blood, or adipose tissue. Stem Cells. 2006;24:1294-1301
4. Karp JM, Teo GSL. Mesenchymal stem cell homing: the devil is in the details. Cell Stem Cell. 2009;4:206-216
5. Gebler A, Zabel O, Seliger B. The immunomodulatory capacity of mesenchymal stem cells. Trends Mol Med. 2012;18:128-134
6. Watanabe S, Uchida K, Nakajima H, Matsuo H, Sugita D, Yoshida A. et al. Early transplantation of mesenchymal stem cells after spinal cord injury relieves pain hypersensitivity through suppression of pain-related signaling cascades and reduced inflammatory cell recruitment. Stem Cells. 2015;33:1902-1914
7. Segers VFM, Lee RT. Stem-cell therapy for cardiac disease. Nature. 2008;451:937-942
8. Barry F, Murphy M. Mesenchymal stem cells in joint disease and repair. Nat Rev Rheumatol. 2013;9:584-594
9. Granero-Moltó F, Weis JA, Miga MI, Landis B, Myers TJ, O'Rear L. et al. Regenerative effects of transplanted mesenchymal stem cells in fracture healing. Stem Cells. 2009;27:1887-1898
10. Wu TJ, Tzeng YK, Chang WW, Cheng CA, Kuo Y, Chien CH. et al. Tracking the engraftment and regenerative capabilities of transplanted lung stem cells using fluorescent nanodiamonds. Nat Nanotechnol. 2013;8:682-689
11. Kopp JL, Grompe M, Sander M. Stem cells versus plasticity in liver and pancreas regeneration. Nat Cell Biol. 2016;18:238-245
12. Page MJ, Lourenço AL, David T, LeBeau AM, Cattaruzza F, Castro HC. et al. Non-Invasive imaging and cellular tracking of pulmonary emboli by near-infrared fluorescence and positron-emission tomography. Nat Commun. 2015;6:8448
13. Goodfellow FT, Simchick GA, Mortensen LJ, Stice SL, Zhao Q. Tracking and quantification of magnetically labeled stem cells using magnetic resonance imaging. Adv Funct Mater. 2016;26:3899-3915
14. Ahrens ET, Bulte JWM. Tracking immune cells in vivo using magnetic resonance imaging. Nat Rev Immunol. 2013;13:755-763
15. Zhou L, Zhang X, Wang Q, Lv Y, Mao G, Luo A. et al. Molecular engineering of a TBET-based two-photon fluorescent probe for ratiometric imaging of living cells and tissues. J Am Chem Soc. 2014;136:9838-9841
16. Spillmann CM, Naciri J, Algar WR, Medintz IL, Delehanty JB. Multifunctional liquid crystal nanoparticles for intracellular fluorescent imaging and drug delivery. ACS Nano. 2014;8:6986-6997
17. Xie Y, Yin T, Wiegraebe W, He XC, Miller D, Stark D. et al. Detection of functional haematopoietic stem cell niche using real-time imaging. Nature. 2009;457:97-101
18. Grossi M, Morgunova M, Cheung S, Scholz D, Conroy E, Terrile M. et al. Lysosome triggered near-infrared fluorescence imaging of cellular trafficking processes in real time. Nat Commun. 2016;7:10855
19. Costa M, Dottori M, Ng E, Hawes SM, Sourris K, Jamshidi P. et al. The hESC line Envy expresses high levels of GFP in all differentiated progeny. Nat Methods. 2005;2:259-260
20. Costa M, Dottori M, Sourris K, Jamshidi P, Hatzistavrou T, Davis R. et al. A method for genetic modification of human embryonic stem cells using electroporation. Nat Protoc. 2007;2:792-796
21. Fontes A, Lakshmipathy U. Advances in genetic modification of pluripotent stem cells. Biotechnol Adv. 2013;31:994-1001
22. Rombouts WJC, Ploemacher RE. Primary Murine MSC Show Highly Efficient Homing to the bone marrow but lose homing ability following culture. Leukemia. 2003;17:160-170
23. Fu Y, Kraitchman DL. Stem cell labeling for noninvasive delivery and tracking in cardiovascular regenerative therapy. Expert Rev of Cardiovasc Ther. 2010;8:1149-1160
24. Ruan J, Song H, Li C, Bao C, Fu H, Wang K. et al. DiR-labeled embryonic stem cells for targeted imaging of in vivo gastric cancer cells. Theranostics. 2012;2:618-628
25. Resch-Genger U, Grabolle M, Cavaliere-Jaricot S, Nitschke R, Nann T. Quantum dots versus organic dyes as fluorescent labels. Nat Methods. 2008;5:763-775
26. Cheng L, Wang C, Ma X, Wang Q, Cheng Y, Wang H. et al. Multifunctional Upconversion nanoparticles for dual-modal imaging-guided stem cell therapy under remote magnetic control. Adv Funct Mater. 2013;23:272-280
27. Li J, Lee WY, Wu T, Xu J, Zhang K, Li G. et al. Multifunctional Quantum Dot Nanoparticles for effective differentiation and long-term tracking of human mesenchymal stem cells in vitro and in vivo. Adv Healthcare Mater. 2016;5:1409-1057
28. Li J, Lee WYW, Wu T, Xu J, Zhang K, Wong DSH. et al. Near-infrared light-triggered release of small molecules for controlled differentiation and long-term tracking of stem cells in vivo using upconversion nanoparticles. Biomaterials. 2016;110:1-10
29. Pu KY, Li K, Zhang X, Liu B. Conjugated oligoelectrolyte harnessed polyhedral oligomeric silsesquioxane as light-up hybrid nanodot for two-photon fluorescence imaging of cellular nucleus. Adv Mater. 2010;22:4186-4189
30. Wu C, Chiu DT. Highly fluorescent semiconducting polymer dots for biology and medicine. Angew Chem Int Ed. 2013;52:3086-3109
31. Shi HF, Ma X, Zhao Q, Liu B, Qu QY, An ZF. et al. Ultrasmall phosphorescent Polymer Dots for Ratiometric Oxygen Sensing and Photodynamic Cancer Therapy. Adv Funct Mater. 2014;24:4823-4830
32. Miao Q, Lyu Y, Ding D, Pu KY. Semiconducting oligomer nanoparticles as an activatable photoacoustic probe with amplified brightness for in vivo imaging of pH. Adv Mater. 2016;28:3662-3668
33. Yuan H, Liu Z, Liu L, Lv F, Wang Y, Wang S. Cationic conjugated polymers for discrimination of microbial pathogens. Adv Mater. 2014;26:4333-4338
34. Wu C, Schneider T, Zeigler M, Yu J, Schiro PG, Burnham DR. et al. Bioconjugation of ultrabright semiconducting polymer dots for specific cellular targeting. J Am Chem Soc. 2010;132:15410-15417
35. Wu CF, Hansen SJ, Hou Q, Yu J, Zeigler M, Jin Y. et al. Design of highly emissive polymer dot bioconjugates for in vivo tumor targeting. Angew Chem Int Ed. 2011;50:3430-3434
36. Yuan H, Wang B, Lv F, Liu L, Wang S. Conjugated-polymer-based energy-transfer systems for antimicrobial and anticancer applications. Adv Mater. 2014;26:6978-6982
37. Zhen X, Zhang C, Xie C, Miao Q, Lim KL, Pu K. Intraparticle energy level alignment of semiconducting polymer nanoparticles to amplify chemiluminescence for ultrasensitive in vivo imaging of reactive oxygen species. ACS Nano. 2016;10:6400-6409
38. Sun K, Tang Y, Li Q, Yin S, Qin W, Yu J. et al. In vivo dynamic monitoring of small molecules with implantable polymer-dot transducer. ACS Nano. 2016;10:6769-6781
39. Pu KY, Shuhendler AJ, Rao JH. Semiconducting polymer nanoprobe for in vivo imaging of reactive oxygen and nitrogen species. Angew Chem Int Ed. 2013;52:10325-10329
40. Shuhendler AJ, Pu K, Cui L, Uetrecht JP, Rao J. Real-time imaging of oxidative and nitrosative stress in the liver of live animals for drug-toxicity testing. Nat Biotechnol. 2014;32:373-380
41. Pu K, Shuhendler AJ, Jokerst JV, Mei J, Gambhir SS, Bao Z. et al. Semiconducting polymer nanoparticles as photoacoustic molecular imaging probes in living mice. Nat Nanotechnol. 2014;9:233-239
42. Jin G, Mao D, Cai P, Liu R, Tomczak N, Liu J. et al. Conjugated polymer nanodots as ultrastable long-term trackers to understand mesenchymal stem cell therapy in skin regeneration. Adv Funct Mater. 2015;25:4263-4273
43. Aurich H, Sgodda M, Kaltwasser P, Vetter M, Weise A, Liehr T. et al. Hepatocyte differentiation of mesenchymal stem cells from human adipose tissue in vitro promotes hepatic integration in vivo. Gut. 2009;58:570-581
44. Rong Y, Wu C, Yu J, Zhang X, Ye F, Zeigler M. et al. Multicolor fluorescent semiconducting polymer dots with narrow emissions and high brightness. ACS Nano. 2013;7:376-384
45. Zhu H, Fang Y, Zhen X, Wei N, Gao Y, Luo KQ. et al. Multilayered semiconducting polymer nanoparticles with enhanced NIR fluorescence for molecular imaging in cells, zebrafish and mice. Chem Sci. 2016;7:5118-5125
46. Ye F, Wu C, Jin Y, Wang M, Chan YH, Yu J. et al. A compact and highly fluorescent orange-emitting polymer dot for specific subcellular imaging. Chem Commun. 2012;48:1778-1780
47. Sun K, Chen H, Wang L, Yin S, Wang H, Xu G. et al. Size-dependent property and cell labeling of semiconducting polymer dots. ACS Appl Mater Inter. 2014;6:10802-10812
48. Jin Y, Ye F, Zeigler M, Wu C, Chiu DT. Near-infrared fluorescent dye-doped semiconducting polymer dots. ACS Nano. 2011;5:1468-1475
49. Xiong L, Shuhendler AJ, Rao J. Self-luminescing BRET-FRET near-infrared dots for in vivo lymph-node mapping and tumour imaging. Nat Commun. 2012;3:1193
50. Baksh D, Yao R, Tuan RS. Comparison of Proliferative and Multilineage Differentiation Potential of Human Mesenchymal Stem Cells Derived from Umbilical Cord and Bone Marrow. Stem Cells. 2007;25:1384-1392
51. Wu C, Bull B, Szymanski C, Christensen K, McNeill J. Multicolor conjugated polymer dots for biological fluorescence imaging. ACS Nano. 2008;2:2415-2423
52. Wang B, Song J, Yuan H, Nie C, Lv F, Liu L. et al. Multicellular assembly and light-regulation of cell-cell communication by conjugated polymer materials. Adv Mater. 2014;26:2371-2375
53. Ruan G, Agrawal A, Marcus AI, Nie S. Imaging and tracking of tat peptide-conjugated quantum dots in living cells: new insights into nanoparticle uptake, intracellular transport, and vesicle shedding. J Am Chem Soc. 2007;129:14759-14766
54. Fonseca SB, Pereira MP, Kelley SO. Recent advances in the use of cell-penetrating peptides for medical and biological applications. Adv Drug Deliver Rev. 2009;61:953-964
55. Belnoue E, Di Berardino-Besson W, Gaertner H, Carboni S, Dunand-Sauthier I, Cerini F. et al. Enhancing antitumor immune responses by optimized combinations of cell-penetrating peptide-based vaccines and adjuvants. Mol Ther. 2016;24:1675-1685
56. Wang C, Cheng L, Xu H, Liu Z. Towards whole-body imaging at the single cell level using ultra-sensitive stem cell labeling with oligo-arginine modified upconversion nanoparticles. Biomaterials. 2012;33:4872-4881
57. Liu BR, Huang Y, Winiarz JG, Chiang HJ, Lee HJ. Intracellular delivery of quantum dots mediated by a histidine- and arginine-rich HR9 cell-penetrating peptide through the direct membrane translocation mechanism. Biomaterials. 2011;32:3520-3537
58. Coburn JM, Gibson M, Monagle S, Patterson Z, Elisseeff JH. Bioinspired nanofibers support chondrogenesis for articular cartilage repair. Proc Natl Acad Sci USA. 2012;109:10012-10017
59. Chen Y, Zhou C, Ji W, Mei Z, Hu B, Zhang W. et al. ELL targets c-Myc for proteasomal degradation and suppresses tumour growth. Nat Commun. 2016;7:11057
60. Wilson A, Murphy MJ, Oskarsson T, Kaloulis K, Bettess MD, Oser GM. et al. c-Myc controls the balance between hematopoietic stem cell self-renewal and differentiation. Gene & Dev. 2004;18:2747-2763
61. Muller PAJ, Vousden KH. P53 Mutations in cancer. Nat Cell Biol. 2013;15:2-8
62. Kruiswijk F, Labuschagne CF, Vousden KH. p53 in survival, death and metabolic health: a lifeguard with a licence to kill. Nat rev Mol cell biol. 2015;16:393-405
63. Gang EJ, Bosnakovski D, Figueiredo CA, Visser JW, Perlingeiro RCR. SSEA-4 identifies mesenchymal stem cells from bone marrow. Blood. 2007;109:1743-1751
64. De Los Angeles A, Ferrari F, Xi R, Fujiwara Y, Benvenisty N, Deng H. et al. Hallmarks of pluripotency. Nature. 2015;525:469-478
65. Seki A, Sakai Y, Komura T, Nasti A, Yoshida K, Higashimoto M. et al. Adipose Tissue-derived stem cells as a regenerative therapy for a mouse steatohepatitis-induced cirrhosis model. Hepatology. 2013;58:1133-1142
66. Volarevic V, Nurkovic J, Arsenijevic N, Stojkovic M. Concise Review: Therapeutic potential of mesenchymal stem cells for the treatment of acute liver failure and cirrhosis. Stem Cells. 2014;32:2818-2823
67. Mitchell C, Willenbring H. A Reproducible and well-tolerated method for 2/3 partial hepatectomy in mice. Nat Protoc. 2008;3:1167-1170
68. Mosbah I, Alfany-Fernandez I, Martel C, Zaouali MA, Bintanel-Morcillo M, Rimola A. et al. Endoplasmic reticulum stress inhibition protects steatotic and non-steatotic livers in partial hepatectomy under ischemia-reperfusion. Cell Death Dis. 2010;1:e52
69. Saito Y, Shimada M, Utsunomiya T, Ikemoto T, Yamada S, Morine Y. et al. Homing effect of adipose-derived stem cells to the injured liver: the shift of stromal cell-derived factor 1 expressions. J Hepato-biliary-Pancreat Sci. 2014;21:873-880
70. Wu CF, Szymanski C, McNeill J. Preparation and encapsulation of highly fluorescent conjugated polymer nanoparticles. Langmuir. 2006;22:2956-2960
Author contact
![]() Corresponding author: Changfeng Wu, College of Electronic Science and Engineering, Jilin University, Changchun, Jilin 130012, China. Tel: +86-431-8516-8270; Fax: +86-431-8515-3853; Email: cwuedu.cn.
Corresponding author: Changfeng Wu, College of Electronic Science and Engineering, Jilin University, Changchun, Jilin 130012, China. Tel: +86-431-8516-8270; Fax: +86-431-8515-3853; Email: cwuedu.cn.