Theranostics
13.3
Impact Factor
 Global reach, higher impact
Theranostics 2016; 6(12):2028-2038. doi:10.7150/thno.15718 This issue Cite
Research Paper
Optical Imaging of Mesenchymal Epithelial Transition Factor (MET) for Enhanced Detection and Characterization of Primary and Metastatic Hepatic Tumors
Shadi A. Esfahani1*, Pedram Heidari1*, Sun A. Kim2, Shuji Ogino2,3,4, Umar Mahmood1 ![]()
1. Athinoula A. Martinos Center for Biomedical Imaging, Department of Radiology, Massachusetts General Hospital, Harvard Medical School;
2. Department of Medical Oncology, Dana-Farber Cancer Institute, Harvard Medical School;
3. Department of Pathology, Brigham and Women's Hospital, Harvard Medical School;
4. Department of Epidemiology, Harvard T.H. Chan School of Public Health.
* equal contribution.
Received 2016-4-1; Accepted 2016-7-22; Published 2016-9-9
Citation:
Esfahani SA, Heidari P, Kim SA, Ogino S, Mahmood U. Optical Imaging of Mesenchymal Epithelial Transition Factor (MET) for Enhanced Detection and Characterization of Primary and Metastatic Hepatic Tumors. Theranostics 2016; 6(12):2028-2038. doi:10.7150/thno.15718. https://www.thno.org/v06p2028.htm
Other stylesAbstract

Purpose: To assess optical imaging of Mesenchymal-Epithelial Transition factor (MET) for delineation and characterization of intrahepatic models of human hepatocellular carcinoma (HCC) and metastatic colorectal cancer (CRC), and thereby demonstrate its potential use in precision oncology.
Materials and Methods: MET expression in human CRC and HCC was assessed in tissue microarrays. We used GE-137, a modified cyanine 5-tagged peptide for MET targeting. HepG2 and Huh-7 (HCC) and HT-29 (CRC) cells with MET overexpression, and LNCaP cells (negative control) with minimal MET expression were incubated with the probe. Correlation between the relative fluorescence signal intensity and cellular MET expression level was assessed. Flow cytometry was used to assess probe specific binding and dissociation constant (Kd). Orthotopic xenograft models of human HCC and metastatic CRC were generated in nu/nu mice by subcapsular implantation of cells. Epifluorescence imaging was performed to capture the changes in deferential probe accumulation at different time points after injection. Target-to-liver background ratio (TBR) was calculated and the probe biodistribution within different organs was assessed. Histopathologic analysis of extracted xenografts was performed to correlate the tumors MET expression with probe uptake by cancer cells.
Results: Approximately 91.5% of HCC and 81% of CRC microarray cores showed MET expression. HCC and CRC cells incubated with the probe showed substantial fluorescence compared to control LNCaP, with strong correlation between fluorescence signal and MET expression (R2 = 0.99, p < 0.001). Probe binding affinity to MET (Kd) was measured to be 2.9 ± 0.36 nM. Epifluorescence imaging showed intense uptake in subcapsular tumors with peak TBR of 5.46 ± 0.46 in Huh-7, 3.55 ± 0.38 in HepG2, and 15.93 ± 0.61 in HT-29 orthotopic xenografts at 4 hours post-injection (mean ± standard deviation). We demonstrated that in vivo probe uptake in xenografts is specific and can be blocked when co-injected with unlabeled peptide; for instance the epifluorescence TBR is reduced from 13.5 ± 1.2 to 1.7 ± 0.3 (p < 0.05) in HT-29 and from 5.3 ± 0.8 to 1.4 ± 0.2 (p < 0.05) in Huh-7 xenografts after co-injection with unlabeled peptides. Biodistribution studies showed predominantly renal clearance of the probe.
Conclusion: Optical imaging of MET resulted in high TBR in animal models of primary and metastatic hepatic tumors suggesting its utility for procedural guidance.
Keywords: MET, Liver cancer, Tumor detection, Optical Imaging, Intra-operative interventions, molecularly-targeted therapy.
Introduction
Liver cancer is the sixth most common cancer worldwide, and despite advances in treatment strategies, primary and secondary hepatic neoplasms collectively constitute the third most common cause of cancer related mortality and morbidity [1]. The success of liver cancer therapy depends on the accurate diagnosis and molecular characterization of tumor at the time of biopsy, to guide liver cytoreductive interventions and chemoradiation therapies [2]. Current anatomical imaging strategies are more focused on detection of liver tumors and have limited ability to characterize the tumors and predict prognosis [3].
Optical molecular imaging (OMI) is a useful new technique which allows visualization of key molecular events in tumorigenesis and metastasis [4]. Using exogenously administered fluorescent probes, OMI allows for tumor characterization, refined tumor margin resection as well as minimally invasive procedural guidance [5]. Preclinical and clinical studies have shown that OMI in combination with non-specific organic fluorophores such as indocyanine green (ICG) can be used to localize hepatocellular carcinomas (HCCs) and intrahepatic colorectal cancer (CRC) metastases with high sensitivity and target-to-background ratios (TBRs) [6-8]. However, to our knowledge, there is scarce data on the use of OMI with clinically translatable specific targeting probes for tumor resection, sampling and in-situ characterization of viable tumors.
Mesenchymal-Epithelial Transition Factor (MET), a tyrosine-kinase receptor for hepatocyte growth factor (HGF), has received much attention as a molecular target for management of hepatic neoplasms, given its role in oncogenesis through aberrant MET/HGF signaling [9]. Abnormal MET-HGF pathway has been reported in majority of HCCs [10] and CRCs, the major metastatic tumor to the liver [11, 12]. Studies have shown that highly selective MET inhibitors may have efficacy for blocking local progression and/or metastatic spread of MET-positive tumors in vivo [13]. MET inhibitors may also have a role in management of post-resection and post-radiation up-regulation of MET expression [14-16]. A MET targeting probe could provide a minimally invasive method for diagnostic and therapeutic purposes as well as monitoring the changes after treatment, including radiation, resection, or molecularly targeted therapies [1, 17, 18].
GE-137 is a fluorescently labeled peptide with high affinity for MET, which has undergone phase 1 human safety testing and has demonstrated the potential for early translation [19]. This study assesses the potential of optical imaging of MET using GE-137 to delineate and characterize the intrahepatic tumors in models of primary human HCC and metastatic CRC to the liver, highlighting its possible use in personalized oncology (schematic representation in Figure 1).
Figure 1
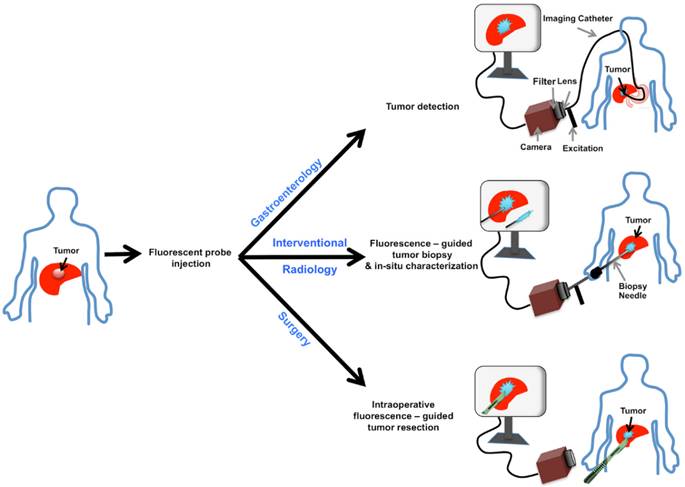
Schematic representation of MET targeting optical imaging in vivo; Dual channel optical imaging systems (with white light anatomic reporting and near infrared fluorescent molecular reporting), following the systemic injection of MET targeting probe, could help in detection of MET overexpressing liver cancers during endoscopy, increasing the accuracy of biopsy results during intra-operative image-guided biopsies, and demarcation of neoplastic tissues with intra-operative image-guided tumor resections.
Materials and methods
Optical imaging probe
GE-137 (AH112543) is a fluorescently labeled peptide for optical imaging, composed of a 26 amino acid cyclic peptide (AH111972) conjugated with a modified cyanine 5 as the fluorescent dye (AH114444). Peptide has high affinity for the extracellular domain of MET (manufacturer reported Kd~3 nM in human), and no competition for binding with HGF, activating survival signaling pathways downstream of MET, or inducing cell proliferation [19] (Figure 2). The fluorophore reporter of GE-137 exhibits optical characteristics similar to that of Cy5, with peak excitation at 653 nm and peak emission at 675 nm [19-23]. This probe has been developed by General Electric Healthcare for evaluation of MET expression in vivo and undergone phase 1 human safety testing and a pilot study in patients suspicious for neoplastic colorectal polyps [19].
Cell culture
We used human HCC cell lines with high MET expression including Huh-7 (Japanese Collection of Research Bioresources Cell Bank, Osaka, Japan) and HepG2 (ATCC), and human CRC cell line, HT-29 (ATCC) [24]. The LNCaP cells (ATCC), with minimal MET expression were used in the in vitro studies as control [25]. Cells were maintained in Dulbecco's modified Eagle's medium (for Huh-7), Eagle's minimal essential medium (for Hep-G2), McCoy's 5a medium modified (for HT-29), and RPMI (for LNCaP) containing 10% fetal bovine serum, and 1% Penicillin-Streptomycin at 37°C in a humid atmosphere containing 5% CO2 and 95% air.
Figure 2
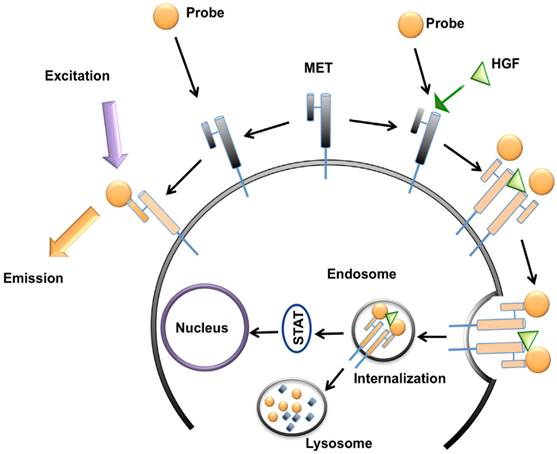
Schematic representation of MET targeting optical imaging in vivo; the probe attaches to the extracellular domain of MET receptor without any competition with hepatocyte growth factor (HGF) and activation of downstream metabolic pathways. This attachment results in fluorescence of the cell surface. In presence of HGF, the receptor gets internalized and addition of MET targeting optical imaging probe results in enhanced fluorescence of both cell surface and cytoplasm.
Western blotting
Western blotting was performed to measure the MET expression level in all cell lines. Cells were incubated in serum free media overnight and washed with cold PBS before being lysed with NP40 buffer supplemented with a protease inhibitor mixture (Complete Mini EDTA-free, Roche) and phosphatase inhibitors II/III (Sigma). 30 μg of purified protein extract from each lysate was loaded onto SDS-PAGE (Bio-Rad Hercules, USA) and electrophoresis was run at 120 V and 14 mA for 1.5 hours [26]. Gels were transferred to a polyvinylidene difluoride (PVDF) membrane (Roche, Germany). The membrane was blocked with Tris-buffered saline (10 mM Tris-HCl, pH 8.0), 150 mM NaCl, 0.05% Tween-20 and 5% non-fat dry milk (Bio-Rad, USA). The blot was incubated overnight at 4°C with mouse anti-human MET monoclonal antibody (Cell Signaling) at 1:1000 dilution and rabbit beta-actin monoclonal antibody (Santa Cruz) with 1:1000 dilution as an internal control. The membrane was incubated with secondary antibodies of goat anti-mouse IgG-HRP (Santa Cruz) with 1:500 dilution for MET and goat anti-rabbit IgG-HRP antibody (Santa Cruz) with 1:1000 for beta-actin for 1 hour at room temperature. Detection of the protein bands was performed using enhanced BM Chemiluminescence Western Blotting Kit (Mouse/Rabbit, Roche), and imaged on Carestream Multispectral FX imaging system (NYC, USA). Quantitation of MET and beta-actin expression was performed by drawing a region of interest over the protein bands on the acquired images using the Carestream analysis software. The measured level of MET expression was normalized to the beta-actin level.
In vitro assessment of probe fluorescence signal
For quantitative and visual assessment of the emitted fluorescence signal from each cell type in presence and absence of MET natural ligand (HGF), the in vitro cell studies were performed using the method developed by Li et al. [27]. Briefly, cells were cultured in 96 well plates (4 wells for each cell line) at a density of 6 × 10⁵ cells/plate and were allowed to reach 80% confluence. Media was replaced by serum-free media for 5 hours at 37°C. To initiate the internalization process, cells were incubated in DMEM containing 100 ng/mL HGF (PeproTech, USA) and MET probe with a concentration of 10 μg/mL at 37°C for 5 minutes. Additionally, each cell type was incubated in DMEM alone and DMEM plus 10 μg/mL MET probe without any HGF, as 2 internal controls. 5 minutes after incubation, the wells were washed with 4°C PBS for three times to pause the receptor internalization process. The mean fluorescent intensity (MFI) was measured using Glomax luminometer (Promega, USA). The MFI of each well was compared to its control wells and the wells containing other cell lines, and it was correlated to the level of MET measured by Western blot. Fluorescence microscopy was also performed on incubated cells for qualitative visual comparison.
Relative cell receptor density measurement and probe specific binding assay
To measure the relative MET receptor density in each cancer cell line, and to validate the specificity of probe in targeting MET receptor Fluorescence-activated cell sorting (FACS) analysis was performed. Cells were cultured in 75 cm2 flasks at 40-70% confluency. After an overnight incubation with serum-free phenol-red free media at 37°C, media was removed and cells were washed with cold (4°C) dPBS. Cells were detached from the flasks using cell dissociation buffer (Thermo Fisher Scientific, USA) for 15-25 minutes in room temperature. The harvested cells were resuspended in cold dPBS containing 1% BSA (bovine serum albumin) at concentration of 105 cells/ml for 30 minutes. They were then centrifuged at 1000 rcf for 1.5 minute and were resuspended in 200 μl of dPBS (1% BSA). The prepared cells were incubated with the probe for three experiments: 1) to compare the relative MET receptor density, each cell type was incubated with similar concentration of GE-137 (50 nM) for 20 minutes in room temperature; 2) to assess the specificity of GE-137 in binding to MET receptor, cells were incubated in a mixture of 50 nM of MET-targeting probe and 5 mM of the non-fluorescent peptide (AH111972) for 20 minutes in room temperature; 3) to measure binding affinity of GE-137, Huh-7 cells were incubated with GE-137 at concentrations of 0.5, 5, 50 and 500 nM for 20 minutes in room temperature.
After incubation, the cells in each sample were centrifuged at 400 rcf for 3 minutes at 4°C. The supernatant was discarded and cells were washed with cold dPBS (1% BSA) for 3 times. Cells were gently resuspended in 300 μl of cold dPBS (1% BSA) at density of 105 per ml, and were stored in dark in BD falcon tubes on ice. FACS was performed using SORP 4-Laser LSR II system (Becton Dickinson and Company, NJ, USA). Data acquisition and analysis were performed by FlowJo analysis software (ver. 10, OR, USA). The MET expression level was presented as the mean fluorescence intensity (arb) for each cell line.
Animal model of hepatic neoplasms
All animal experiments were approved by our Institutional Animal Care and Use Committee. Focal models of hepatic neoplasms and CRC metastasis to the liver were generated by injection of human HCC cells (HepG2 and Huh-7) and human CRC cells (HT-29) in nu/nu mice (Taconic, Germantown, NY; n=16 mice per cell line) under inhalation anesthesia using mask of oxygen and isoflurane (5% for induction and 1.5% for maintenance). After median laparotomy, 1 x 10⁶ cells in 0.1 ml of 1:1 (v/v) mixture of serum-free medium and Matrigel (Becton-Dickinson, USA) were injected into subcapsular space of the liver using 25-gauge needle. Observation of a small bulge in the point of injection was considered as the sign of successful implantation. In addition, we subcutaneously injected HT-29 and Huh-7 cells in nu/nu mice (n=8 for each cell line) to assess the specificity of MET targeting probe in vivo.
In vivo optical imaging
Four weeks after inoculation, hepatic tumors ranging from 8 to 14 mm in size had originated in the subcapsular space [6]. The MET targeting probe was dissolved in sterile distilled water with concentration of 0.18 mg/kg, and injected into the lateral tail vein of tumor bearing mice (< 0.2 ml volume) [19]. Near infrared fluorescence (NIRF) imaging was performed using the Carestream Imaging system (Excitation: 570-650 nm, emission: 700 nm). Uptake in the liver (as background) and tumor, and TBR were assessed at 5 minutes, 30 minutes, 1, 2, 4, 6 and 8 hours post-injection.
To assess the specificity of GE-137 in vivo, the mice with subcutaneous Huh-7 and HT-29 xenografts were divided into 2 groups (n=4 per group). The first group received GE-137 (0.18 mg/kg per animal) and the second group received GE-137 with similar concentration mixed with the unlabeled peptide (18 mg/kg per animal) intravenously. Mice were euthanized 4 hours post-injection and TBR was compared between the two groups.
The MFI was measured by drawing a 3mm circular region of interest (ROI) over the respective brightest fluorescence in the tumors to calculate mean pixel intensity within the images using standard image analysis software package of Carestream. TBR was then computed by dividing MFI of tumor by MFI of adjacent liver parenchyma.
Biodistribution study
Tumor and major organs were harvested at 30, 60, 120 and 240 minutes post-injection. MFI of the excised tissues was measured using Carestream imaging system (Excitation: 570-650 nm, emission: 700 nm).
Histology and Immunohistochemistry
- Human tissue microarray: Expression of MET was determined by immunohistochemistry (IHC) staining in human tissue microarrays (TMA) including 165 HCC, 163 human CRC, 8 cores of normal liver and 8 cores of normal colon tissue (Biomax). Slides were prepared for staining using previously described methods [26]. Specimens were incubated with MET primary antibody (1:30 dilution, rabbit monoclonal, clone D1C2, Cell Signaling) at 4°C for 16 hours. They were incubated with EnVision + System-HRP Labeled Polymer anti-rabbit (Dako) for 30 minutes at room temperature, and treated with liquid DAB plus substrate chromogen (Dako) and counterstained with hematoxylin.
Staining was scored per intensity and percentage of positive tumor cells. Tissues were designated as negative when not stained, low expression when weakly stained in any portion of the cells, or strongly stained in ≤30% of cells, and high expression when strongly stained in >30% of cells [1].
- Mouse hepatic tumors: Upon completion of biodistribution studies, the excised liver tissues were stored at -80°C, and serial cryostat sections with 6µm thickness were prepared for H&E, IHC staining and confocal fluorescence microscopy. Slides were fixed in 100% acetone in -20°C for 10 minutes and left at room temperature for complete evaporation of acetone. The specimens were incubated with anti-human MET primary antibody (1:100 dilution, rabbit monoclonal, clone-D1C2, Cell Signaling) at 4°C for 16 hours. The rest of the protocol was similar to TMA immunostaining.
Fluorescence microscopy
Incubated cells with probe and frozen tumor tissues were evaluated under a laser scanning confocal microscope (LSM-5 PASCAL, Zeiss, Germany) with an emission wavelength of 633nm.
Statistical analysis
Statistical analysis was performed using GraphPad Software (ver. 5.01, CA, USA). Correlation of MET expression level in Western blot and fluorescence signal intensity was assessed using linear regression and the correlation coefficient was calculated. The difference in MET expression among different stages and grades of TMA samples was assessed using Chi-square test. The continuous variables are presented as means ± standard deviation. P-value of less than 0.05 was considered as statistically significant. The mean fluorescence signal intensity measured from different concentrations of the probe resulted in a curve fitted by nonlinear regression to a 1-site receptor-binding model, and the dissociation constant (Kd) was calculated.
Results
MET expression level
Western blot analysis showed high level of MET expression in three human cell lines (HT-29>Huh-7>HepG2), while LNCaP cells showed minimal MET expression (Figure 3A).
In vitro quantitative and visual assessment of probe fluorescence signal
Incubation of human cells with GE-137 in the absence of HGF showed increased fluorescence signal on the surface of MET-expressing cells (Figure 3B). Addition of HGF to the media resulted in internalization of the imaging probe and enhanced emitted fluorescence signal of MET overexpressing cells, while the LNCaP cells showed unchanged minimal fluorescence signal (Figure 3C). There was a strong correlation between the cells fluorescence signal and the level of expressed MET measured by Western blot analysis (R2=0.99, p < 0.0001, Figure 3D).
Relative cell receptor density measurement
FACS study of the cells incubated with similar concentration of MET-targeting probe showed high mean fluorescence signal intensity and therefore high relative MET receptor density on cells in the order of HT-29 > Huh-7 > HepG2 > LNCaP cells (Figure 4A).
Probe specific binding assay
Incubation of the cells with mixture of non-fluorescent peptide and GE-137 resulted in significant decrease of mean fluorescence signal intensity measured by FACS (Figure 4A), confirming the specificity of GE-137 in targeting MET receptor on the cells surface. Direct (saturation) probe binding assay showed that GE-137 bound specifically to the human Huh-7 neoplastic cells. The calculated Kd for the probe was 2.9 ± 0.36 nM (Figure 4B).
Assessment of probe specificity in targeting MET in vivo
NIRF imaging of subcutaneous HT-29 and Huh-7 xenografts showed significant decrease in mean fluorescence intensity of tumors and TBR at 4 hours after injection of the probe and unlabeled peptide mixture compared to the group that only received MET targeting probe; the mean TBR was 1.7 ± 0.3 compared to 13.5 ± 1.2 in HT-29 (p < 0.05) and 1.4 ± 0.2 compared to 5.3 ± 0.8 in Huh-7 xenografts (p < 0.05) after receiving probe and unlabeled peptide mixture as compared to probe alone, respectively (Figure 4C).
In vivo targeting of MET within focal hepatic tumors
NIRF imaging of subcapsular HCC and CRC xenografts showed intense uptake of the probe in all tumors with sharply demarcating borders between the neoplastic and normal adjacent liver tissue (Figure 5). Fluorescence signal intensities in tumors were significantly greater than liver at all the time points; TBR reached a peak of 5.46 ± 0.46 in Huh-7, 3.55 ± 0.38 in HepG2, and 15.93 ± 0.61 in HT-29 tumors 4 hours after injection of the probe (Figure 6A).
Biodistribution studies
Biodistribution study of the excised tumor and mouse organs showed that MET targeting probe was mainly excreted through the kidneys. There was high uptake of GE-137 in human xenografts, with rapid clearance from background tissues especially the liver. Tumor uptake was greater than liver uptake for all MET-expressing tumors studied at all time points. This biodistribution profile allowed the tumor to be clearly visualized by NIRF imaging (Figure 6B).
Microscopic evaluations of xenografts
Microscopic evaluation of frozen liver tumor samples showed high concordance between the area of high MET expression and enhanced fluorescence in the tumors while normal liver tissues showed minimal MET expression and very weak fluorescence (Figure 7).
Figure 3
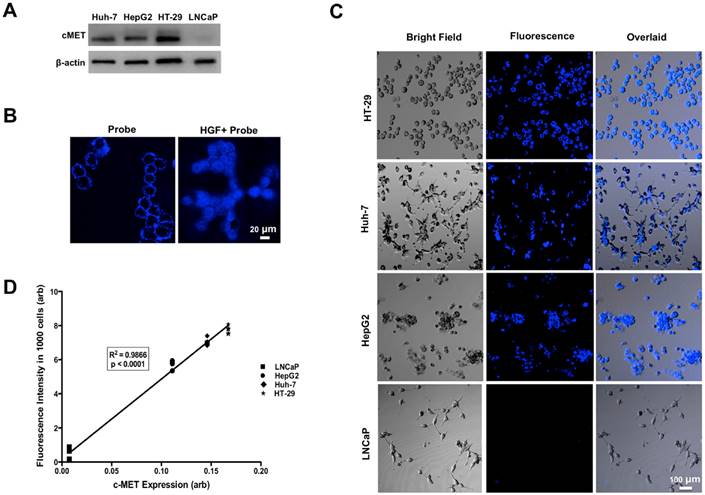
Western blot analysis showed high levels of MET expression in HT-29 > Huh-7 > HepG2 cells and minimal MET expression in LNCaP cells as control (A). Representative confocal microscopic images of in vitro binding assay showed that incubation of the neoplastic cells with MET targeting probe results in enhanced fluorescence signal on the cells surface, confirming its binding to the receptor. Addition of HGF results in internalization of the probe by MET expressing tumor cells (HT-29, Huh-7 and HepG2) and no appreciable fluorescence signal intensity over background in control LNCaP cells (B&C). The level of MET protein expression (MET/beta-actin) measured by Western blot is significantly correlated to the fluorescence signal intensity measured after incubation of the cells with probe (R2=0.99, p < 0.0001) (D).
Figure 4
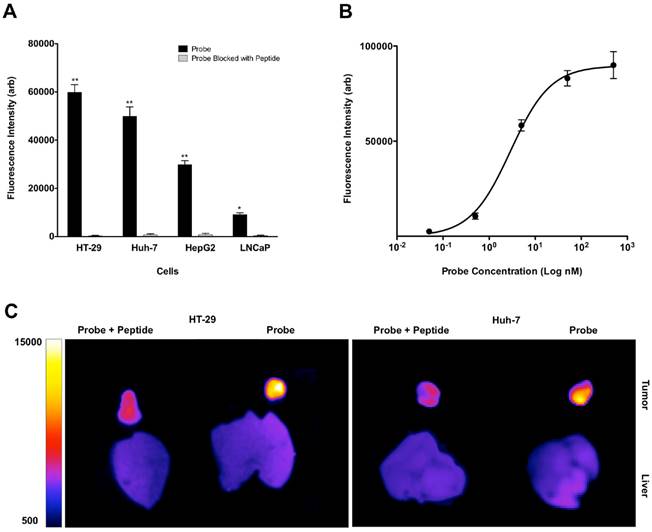
FACS study of the neoplastic cells with similar concentration of GE-137 probe showed high levels of mean fluorescent intensity and therefore high relative receptor density on HT-29 > Huh-7 > HepG2 with minimal signal on the control LNCaP cells. Competitive binding study was performed with addition of blocking peptide, which resulted in significant decrease of mean fluorescence signal intensity in all cell lines. (*: p < 0.05, **: p < 0.001) (A). GE-137 specifically binds MET receptor with Kd value of 2.9 ± 0.36 nM (B). In vivo optical imaging of the mice with subcutaneous tumors showed significant decrease in mean fluorescence signal intensity and target to background ratio 4 hours after injection of the probe and blocking peptide mixture compared to the mice that only received the probe. TBR decreased from 13.5 ± 1.2 to 1.7 ± 0.3 (p < 0.05) in HT-29 and from 5.3 ± 0.8 to 1.4 ± 0.2 (p < 0.05) in Huh-7 xenografts (C).
TMA analysis
In the TMA with 165 cores of HCC in stage 1-3, 151 samples (91.5%) stained positive for MET, including 43 cores with weak and 108 cores with strong expression level (28% vs. 72%), compared to the normal liver tissues (Figure 8A). With advancement of the stage of primary disease, the percentage of samples with high MET expression level increased significantly (66% in stage 1 vs. 68% in stage 2 vs. 85% in stage 3, p < 0.05) Whereas the MET expression level was significantly higher in low grade HCC samples compared to the high grade cores (67% vs. 35 % respectively, p < 0.05, Figure 8B).
IHC staining of the TMA with 163 cores of primary colon adenocarcinoma showed positive MET expression in 132 cores (81%) including 66 cores (50%) with low and 66 cores (50%) with high MET expression compared to the normal colon tissues (Figure 8C). Although the percentage of samples with high MET expression decreased with advancement of the stage of disease, this trend was not statistically significant (p > 0.05). The results showed that MET expression did not significantly vary with grade of CRC (32% in low grade vs. 40% in high grade, p > 0.05) (Figure 8D).
Discussion
We demonstrated that the majority of HCCs and CRCs of the human tissue microarray cores express MET. The high rate of expression allows for specific sampling of the tumors independent of their aggressiveness and clinicopathologic presentations of the patients [20]. The trend we observed for enhanced MET expression in higher stages of HCC is concordant with reports, which have shown that MET overexpression is correlated to poor clinical outcome, aggressive behavior and early portal vein thrombosis in patients with HCC [1]. These results suggest that molecular imaging of MET may not only be used for lesion detection, but also for characterization of the intrahepatic malignant lesions and identifying biologically aggressive tumor foci that can result in more accurate prognostication and improved treatment planning earlier in the course of the disease.
One of the caveats of standard of care tumor biopsy as well as surgical tumor margin resection is lack of ability to precisely distinguish neoplastic tissue from surrounding healthy liver parenchyma [28]. We demonstrated the use of an optically labeled MET targeting probe for in-situ characterization of the neoplastic tissue in real time, that robustly localizes to focal primary and secondary hepatic neoplasms with high TBR. We also showed that the probe is specifically targeting the viable tumor with very low level of uptake in the adjacent normal hepatic tissue. Additionally, the amount of probe uptake and excited fluorescence signal is highly correlated to the level of MET expression in the tumor cells. Given the molecular specificity of this optical imaging probe, assessment of the probe uptake provides an “in-situ histology”, which might allow for differentiation between malignant and benign hepatic lesions. This is a potential advantage over the use of non-specific optical molecular imaging agents such as ICG [29].
Figure 5
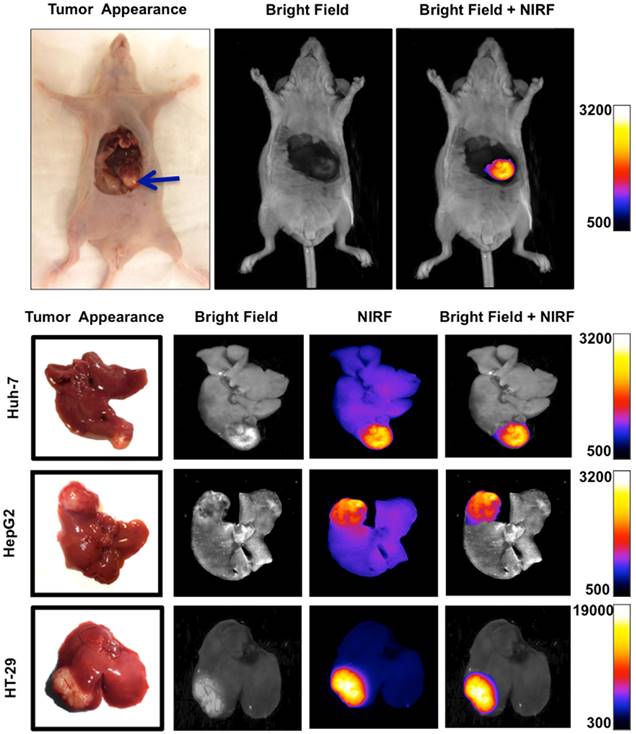
Orthotopic murine model of liver cancer was generated by injection of Huh-7, HepG2 and HT-29 cells in subcapsular space of the liver. Near infrared fluorescence (NIRF) imaging showed significantly increased signal intensity on the tumors relative to the normal adjacent liver tissue, allowing precise delineation of the tumor and demarcation of malignant tissue from adjacent background tissue.
Figure 6
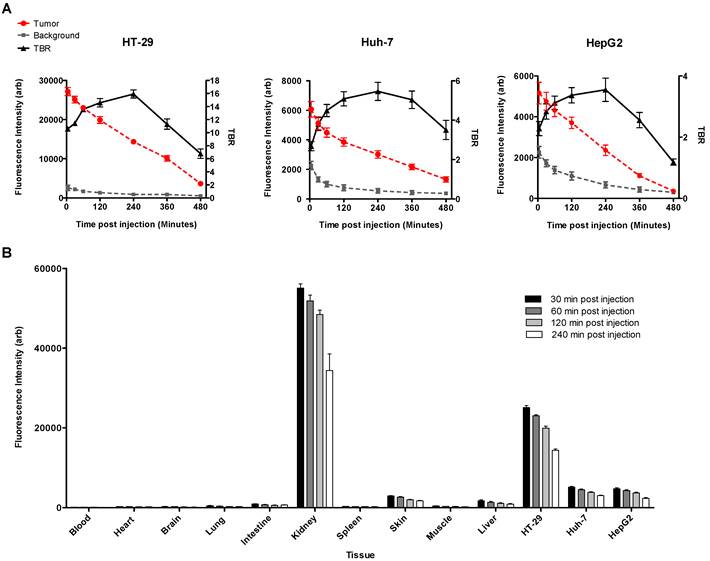
Mean fluorescence signal intensity was measured in the tumors and the adjacent liver tissue as background over 8 hours after intravenous injection of the MET targeting probe. Graphs show that signal intensity in both tumor and normal liver tissue decreased constantly over time. Tumor to background ratio (TBR) reached a maximum of 15.93 ± 0.61, in HT-29, and 5.46 ± 0.46 in Huh-7, and 3.55 ± 0.38 in HepG2, 4 hours after injection of the probe (A). Biodistribution of the probe in various extracted tissues was assessed 4 hours post-injection in mice with HT-29, Huh7, and HepG2 tumors. Results showed high accumulation of the optical probe in the tumors and its clearance from normal liver parenchyma and other non-targeted background (B).
Figure 7
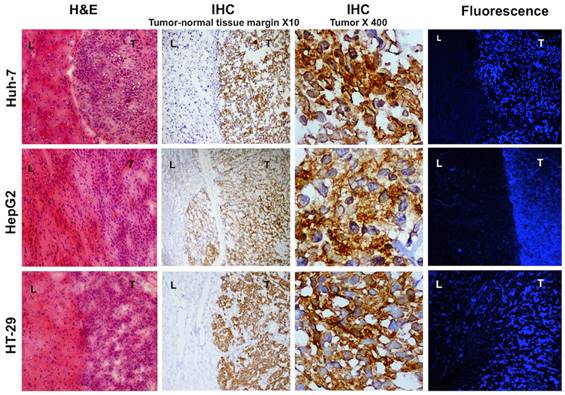
Histology and fluorescence confocal microscopy of tumor bearing liver tissues; H&E staining shows densely packed cells with abnormal nuclei and sharp transition from normal to malignant cells. Immunohistochemistry of the same samples show high MET expression in the tumor and no expression in the normal liver cells, magnification X10. Magnified view of the intrahepatic tumors demonstrates elevated expression of MET in the abnormal cells, magnification X400. Laser confocal imaging of frozen tissues showed a sharp tumor-liver margin with significantly increased MET probe uptake within the tumor compared to the adjacent background.
Figure 8
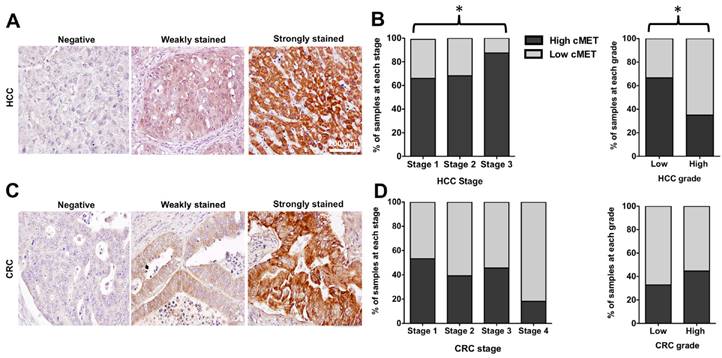
Representative immunohistochemical staining scores for MET expression in tissue microarrays of hepatocellular carcinoma (HCC) and colorectal adenocarcinoma (CRC); Negative membrane staining, weak staining in invasive tumor cells, strong and complete membrane staining in almost all tumor cells (A&C). Scale bar 200 mm. MET expression level significantly increased with advancing the stage of HCC. The level of MET expression was significantly higher in low-grade cores (B). There was a decreasing trend in MET expression with advancing the stage of CRC, although results were not statistically significant. MET level did not significantly vary with the grade of CRC (D).
Safety profile, pharmacokinetics and imaging characteristics of GE-137 have been assessed in healthy volunteers and patients at high risk of colorectal neoplastic changes in a pilot study. Systemic administration of GE-137 at concentration of (0.02-0.18 mg/ kg) was safe and tolerated by subjects (n=31). Dual channel colonoscopy of subjects showed rapid clearance of probe from the normal colon wall and its specific accumulation within all neoplastic polyps and enabled detection of the polyps missed by routine white light colonoscopy [19]. The clinical data supports the rationale behind our study design and its potential utility in clinical care of patient with hepatic neoplasm. We anticipate that this probe when used in combination with a variety of OMI devices would result in improved detection, sampling and removal of neoplastic hepatic tissue in real time [18, 30, 31].
MET-targeting molecular imaging probes have been previously reported for detection of human solid tumors mostly brain and breast cancers [32-35]. The most commonly used probes include HGF, and different analogues of HGF that were labeled with radioisotopes or Cy5.5. However, HGF and its analogues as MET receptor agonists could potentially activate the downstream effects of MET receptor and promote cancer cell proliferation [32]. One of the advantages of GE-137 probe is its lack of receptor activation or internalization, which makes it desirable compared to HGF analogues as an imaging agent [19, 20, 36]. Additionally, the use of anti-MET targeting whole antibody and antibody fragments has been reported, which are known to be immunogenic and are not suited for repeat imaging [37]. Furthermore, antibodies have undesirable biodistribution and protracted clearance, which in turn results in fairly high signal in the background tissues such as liver (major route of antibody excretion), intestine, spleen and pancreas [37, 38] and therefore are likely of limited use for interventional purposes. In a study by Chen et al, a human anti-MET Fab fragment conjugated with Cy5.5 was used and maximal probe accumulation was achieved at 12 hours in subcutaneous HepG2 xenografts. However, biodistribution profile of the probe was not reported [39]. Our biodistribution studies showed favorable pharmacokinetics of GE-137 as a low-molecular weight peptide including minimal uptake of the probe by majority of the background tissues, rapid clearance of the probe from normal background liver parenchyma, robust rapid accumulation in the tumor and slow washout from the tumor, which potentially facilitate its clinical translation. Rapid clearance of the probe from background tissue enables same day NIR-guided biopsies or surgical margin resection and its slow washout from the tumor allows a wide time window for any type of NIR image-guided procedure, with single injection of the probe.
As we showed in our study, one of the advantages of GE-137 is that it attaches to the MET receptor in a non-competitive fashion with HGF and presence of HGF in the tissue can accentuate the probe uptake. This results in a favorable kinetic profile for the usual clinical scenario in which high HGF levels in the environment is expected.
While, we showed the overexpression of MET in HCC, which include more than 75% of the primary liver neoplasms, and CRC as the most common source of secondary liver cancers (with frequency of 50-70%), we did not evaluate the potential of MET targeting probe in detection of other primary or metastatic tumors to the liver. Further pathological evaluations and human imaging studies are required for optimization of real-time detection of those liver lesions.
In summary, the advent of precision medicine approaches highlights the impact of image-guided procedures using probes that specifically target oncogenic molecular signature of tumors. Our results confirmed that MET imaging probe has desirable properties for in-situ characterization of primary and metastatic hepatic cancers. Overexpression of proto-oncogene MET in a high proportion of hepatic neoplasms, and real-time feedback during OMI-guided diagnostic and therapeutic procedures provide valuable information that could guide management decisions.
Acknowledgements
The authors would like to thank GE Healthcare for their generous gift of GE-137, and Mr. Igor Bagayev for his help with acquiring images using Zeiss Confocal Microscopy. This study was supported by NIH grants U01CA084301 and P50CA127003. S.O. was in part supported by NIH grant R35 CA197735.
Competing Interests
The authors declare no competing financial interests.
References
1. Kondo S, Ojima H, Tsuda H. et al. Clinical impact of c-Met expression and its gene amplification in hepatocellular carcinoma. Int J Clin Oncol. 2013;18:207-213
2. de Lope CR, Tremosini S, Forner A. et al. Management of HCC. J Hepatol. 2012;56(Suppl 1):S75-S87
3. Tremosini S, Reig M, de Lope CR. et al. Treatment of early hepatocellular carcinoma: Towards personalized therapy. Dig Liver Dis. 2010;42(Suppl 3):S242-S248
4. Hoffman JM, Gambhir SS. Molecular imaging: the vision and opportunity for radiology in the future. Radiology. 2007;244:39-47
5. Weissleder R, Tung CH, Mahmood U. et al. In vivo imaging of tumors with protease-activated near-infrared fluorescent probes. Nat Biotechnol. 1999;17:375-378
6. Sheth RA, Heidari P, Esfahani SA. et al. Interventional optical molecular imaging guidance during percutaneous biopsy. Radiology. 2014;271:770-777
7. Ishizawa T, Fukushima N, Shibahara J. et al. Real-time identification of liver cancers by using indocyanine green fluorescent imaging. Cancer. 2009;115:2491-2504
8. Sheth RA, Arellano RS, Uppot RN. et al. Prospective trial with optical molecular imaging for percutaneous interventions in focal hepatic lesions. Radiology. 2015;274:917-926
9. Organ SL, Tsao MS. An overview of the c-MET signaling pathway. Ther Adv Med Oncol. 2011;3:7-19
10. Kaposi-Novak P, Lee JS, Gomez-Quiroz L. et al. Met-regulated expression signature defines a subset of human hepatocellular carcinomas with poor prognosis and aggressive phenotype. J Clin Invest. 2006;116:1582-1595
11. Takeuchi H, Bilchik A, Saha S. et al. c-MET expression level in primary colon cancer: a predictor of tumor invasion and lymph node metastases. Clin Cancer Res. 2003;9:1480-1488
12. Ajisaka H, Nishimura G, Tsuneda A. et al. The expression of cMET/hepatocyte growth factor receptor in colorectal cancer. Nihon Shokakibyo Gakkai Zasshi. 1998;95:750-754
13. Goyal L, Muzumdar MD, Zhu AX. Targeting the HGF/c-MET pathway in hepatocellular carcinoma. Clin Cancer Res. 2013;19:2310-2318
14. Harun N, Costa P, Christophi C. Tumour growth stimulation following partial hepatectomy in mice is associated with increased upregulation of c-Met. Clin Exp Metastasis. 2014;31:1-14
15. De Bacco F, Luraghi P, Medico E. et al. Induction of MET by ionizing radiation and its role in radioresistance and invasive growth of cancer. J Natl Cancer Inst. 2011;103:645-661
16. Matsui S, Osada S, Tomita H. et al. Clinical significance of aggressive hepatectomy for colorectal liver metastasis, evaluated from the HGF/c-Met pathway. Int J Oncol. 2010;37:289-297
17. Chu JS, Ge FJ, Zhang B. et al. Expression and prognostic value of VEGFR-2, PDGFR-beta, and c-Met in advanced hepatocellular carcinoma. J Exp Clin Cancer Res. 2013;32:16
18. Choyke PL. Science to practice: percutaneous biopsies in the NIR future-will fluorescence guide the way? Radiology. 2014;271:623-624
19. Burggraaf J, Kamerling IM, Gordon PB. et al. Detection of colorectal polyps in humans using an intravenously administered fluorescent peptide targeted against c-Met. Nat Med. 2015;21:955-961
20. Liu S, Zheng Y, Volpi D. et al. Toward operative in vivo fluorescence imaging of the c-Met proto-oncogene for personalization of therapy in ovarian cancer. Cancer. 2015;121:202-213
21. Evans P, Battle M, Getvoldsen G. et al. Nonclinical tumor efficacy studies of [18F] AH113804, a novel PET imaging agent with high affinity for the human c-Met receptor. Cancer Res. 2012;72(Suppl 8):S357
22. Healey AJ, Bendiksen R, Attramadal T. et al. Imaging efficacy of a targeted imaging agent for fluorescence endoscopy. In: (ed.) Achilefu S, Bornhop DJ, Raghavachari R. Proc SPIE 6867, Molecular Probes for Biomedical Applications II. San Jose, CA: SPIE. 2008:1-12
23. Attramadal T, Bjerke R, Indrevoll B. et al. A targeted molecular probe for colorectal cancer imaging. In: (ed.) Achilefu S, Bornhop DJ, Raghavachari R. Proc SPIE 6867, Molecular Probes for Biomedical Applications II. San Jose, CA: SPIE. 2008:0-10
24. Zeng Z, Weiser MR, D'Alessio M. et al. Immunoblot analysis of c-Met expression in human colorectal cancer: overexpression is associated with advanced stage cancer. Clin Exp Metastasis. 2004;21:409-417
25. Humphrey PA, Zhu X, Zarnegar R. et al. Hepatocyte growth factor and its receptor (c-MET) in prostatic carcinoma. Am J Pathol. 1995;147:386-396
26. Heidari P, Wehrenberg-Klee E, Habibollahi P. et al. Free somatostatin receptor fraction predicts the antiproliferative effect of octreotide in a neuroendocrine tumor model: implications for dose optimization. Cancer Res. 2013;73:6865-6873
27. Li N, Hill KS, Elferink LA. Analysis of receptor tyrosine kinase internalization using flow cytometry. Methods Mol Biol. 2008;457:305-317
28. Ma X, Arellano RS, Gervais DA. et al. Success of image-guided biopsy for small (≤ 3 cm) focal liver lesions in cirrhotic and noncirrhotic individuals. J Vasc Interv Radiol. 2010;21:1539-1547
29. Morita Y, Sakaguchi T, Unno N. et al. Detection of hepatocellular carcinomas with near-infrared fluorescence imaging using indocyanine green: its usefulness and limitation. Int J Clin Oncol. 2013;18:232-241
30. Yang X. Interventional molecular imaging. Radiology. 2010;254:651-654
31. Upadhyay R, Sheth RA, Weissleder R. et al. Quantitative real-time catheter-based fluorescence molecular imaging in mice. Radiology. 2007;245:523-531
32. Luo H, Hong H, Slater MR. et al. PET of c-Met in Cancer with (6)(4)Cu-Labeled Hepatocyte Growth Factor. J Nucl Med. 2015;56:758-763
33. Lee CM, Cheong SJ, Kim EM. et al. Nonpolymeric surface-coated iron oxide nanoparticles for in vivo molecular imaging: biodegradation, biocompatibility, and multiplatform. J Nucl Med. 2013;54:1974-1980
34. Kim EM, Jeong MH, Kim DW. et al. Iodine 125-labeled mesenchymal-epithelial transition factor binding peptide-click-cRGDyk heterodimer for glioma imaging. Cancer Sci. 2011;102:1516-1521
35. Kim EM, Park EH, Cheong SJ. et al. In vivo imaging of mesenchymal-epithelial transition factor (c-Met) expression using an optical imaging system. Bioconjug Chem. 2009;20:1299-1306
36. Arulappu A, Battle M, Eisenblaetter M. et al. c-Met PET Imaging Detects Early Stage Loco-Regional Recurrence of Basal-Like Breast Cancer. J Nucl Med. 2015;57:765-770
37. Wu AM, Olafsen T. Antibodies for molecular imaging of cancer. Cancer J. 2008;14:191-197
38. Jiao Y, Zhao P, Zhu J. et al. Construction of human naive Fab library and characterization of anti-met Fab fragment generated from the library. Mol Biotechnol. 2005;31:41-54
39. Chen X, Ding G, Gao Q. et al. A human anti-c-Met Fab fragment conjugated with doxorubicin as targeted chemotherapy for hepatocellular carcinoma. PLoS One. 2013 [Epub ahead of print]
Author contact
![]() Corresponding author: Umar Mahmood, MD, PhD. Athinoula A. Martinos Center for Biomedical Imaging, Department of Radiology, Massachusetts General Hospital, Charlestown, MA 02129. Office 617-726-6477 Fax 617-726-7422 Email: umahmoodharvard.edu.
Corresponding author: Umar Mahmood, MD, PhD. Athinoula A. Martinos Center for Biomedical Imaging, Department of Radiology, Massachusetts General Hospital, Charlestown, MA 02129. Office 617-726-6477 Fax 617-726-7422 Email: umahmoodharvard.edu.
Citation styles
APA
Esfahani, S.A., Heidari, P., Kim, S.A., Ogino, S., Mahmood, U. (2016). Optical Imaging of Mesenchymal Epithelial Transition Factor (MET) for Enhanced Detection and Characterization of Primary and Metastatic Hepatic Tumors. Theranostics, 6(12), 2028-2038. https://doi.org/10.7150/thno.15718.
ACS
Esfahani, S.A.; Heidari, P.; Kim, S.A.; Ogino, S.; Mahmood, U. Optical Imaging of Mesenchymal Epithelial Transition Factor (MET) for Enhanced Detection and Characterization of Primary and Metastatic Hepatic Tumors. Theranostics 2016, 6 (12), 2028-2038. DOI: 10.7150/thno.15718.
NLM
Esfahani SA, Heidari P, Kim SA, Ogino S, Mahmood U. Optical Imaging of Mesenchymal Epithelial Transition Factor (MET) for Enhanced Detection and Characterization of Primary and Metastatic Hepatic Tumors. Theranostics 2016; 6(12):2028-2038. doi:10.7150/thno.15718. https://www.thno.org/v06p2028.htm
CSE
Esfahani SA, Heidari P, Kim SA, Ogino S, Mahmood U. 2016. Optical Imaging of Mesenchymal Epithelial Transition Factor (MET) for Enhanced Detection and Characterization of Primary and Metastatic Hepatic Tumors. Theranostics. 6(12):2028-2038.
This is an open access article distributed under the terms of the Creative Commons Attribution (CC BY-NC) License. See http://ivyspring.com/terms for full terms and conditions.