Theranostics
13.3
Impact Factor
 Global reach, higher impact
Theranostics 2016; 6(11):1963-1974. doi:10.7150/thno.15922 This issue Cite
Research Paper
Motion Compensated Ultrasound Imaging Allows Thermometry and Image Guided Drug Delivery Monitoring from Echogenic Liposomes
Kalyani Ektate1*, Ankur Kapoor2*, Danny Maples1, Ahmet Tuysuzoglu2, Joshua VanOsdol1, Selvarani Ramasami1, Ashish Ranjan1 ![]()
1. Center for Veterinary Health Sciences, Oklahoma State University, Stillwater, Oklahoma.
2. Medical Imaging Technologies, Siemens Healthcare, Princeton, New Jersey.
* Both authors contributed equally to this study.
Received 2016-4-21; Accepted 2016-7-20; Published 2016-8-14
Citation:
Ektate K, Kapoor A, Maples D, Tuysuzoglu A, VanOsdol J, Ramasami S, Ranjan A. Motion Compensated Ultrasound Imaging Allows Thermometry and Image Guided Drug Delivery Monitoring from Echogenic Liposomes. Theranostics 2016; 6(11):1963-1974. doi:10.7150/thno.15922. https://www.thno.org/v06p1963.htm
Other stylesAbstract

Ultrasound imaging is widely used both for cancer diagnosis and to assess therapeutic success, but due to its weak tissue contrast and the short half-life of commercially available contrast agents, it is currently not practical for assessing motion compensated contrast-enhanced tumor imaging, or for determining time-resolved absolute tumor temperature while simultaneously reporting on drug delivery. The objectives of this study were to: 1) develop echogenic heat sensitive liposomes (E-LTSL) and non-thermosensitive liposomes (E-NTSL) to enhance half-life of contrast agents, and 2) measure motion compensated temperature induced state changes in acoustic impedance and Laplace pressure of liposomes to monitor temperature and doxorubicin (Dox) delivery to tumors. LTSL and NTSL containing Dox were co-loaded with an US contrast agent (perfluoropentane, PFP) using a one-step sonoporation method to create E-LTSL and E-NTSL. To determine temperature induced intensity variation with respect to the state change of E-LTSL and E-NTSL in mouse colon tumors, cine acquisition of 20 frames/second for about 20 min (or until wash out) at temperatures of 42°C, 39.5°C, and 37°C was performed. A rigid rotation and translation was applied to each of the “key frames” to adjust for any gross motion that arose due to motion of the animal or the transducer. To evaluate the correlation between ultrasound (US) intensity variation and Dox release at various temperatures, treatment (5 mg Dox/kg) was administered via a tail vein once tumors reached a size of 300-400 mm3, and mean intensity within regions of interest (ROIs) defined for each sample was computed over the collected frames and normalized in the range of [0,1]. When the motion compensation technique was applied, a > 2-fold drop in standard deviation in mean image intensity of tumor was observed, enabling a more robust estimation of temporal variations in tumor temperatures for 15-20 min. due to state change of E-LTSL and E-NTSL. Consequently, a marked increase in peak intensity at 42°C compared to 37°C that corresponded with enhanced Dox delivery from E-LTSL in tumors was obtained. Our results suggest that echogenic liposomes provide a predictable change in tumor vascular contrast with temperature, and this property could be applicable to nanomonitoring of drug delivery in real time.
Keywords: Ultrasound Imaging
1. Introduction
A major challenge in image guided drug delivery (IGDD) is developing accurate means to implement real-time drug delivery control with motion compensation. In prior research, locally inducible image guided drug release using heat-activated liposomes (low temperature sensitive liposomes; LTSLs) that are sensitive to mild, non-destructive temperature elevations above normal body temperature (40-42 °C) has been investigated [1-4]. LTSLs can achieve significantly improved drug accumulation and distribution in tumors compared to conventional treatment [5-8]. Additionally, imageable LTSLs containing a combined payload of magnetic resonance (MR) contrast agents (e.g., gadolinium, manganese) and doxorubicin (Dox) combined with MR guided high intensity focused ultrasound (MR-HIFU) can provide a real-time estimation of tumor chemotherapy coverage [4, 9-11]. This is achieved by mild heating of imageable LTSLs to release the contrast agent in order to enhance tumor areas in the MR images to allow estimation of the mean amount of anticancer drug (e.g., Doxorubicin or Dox) that has been delivered to the cancerous tissue. Mild hyperthermia (40-45°C) is fundamentally distinct from hyperthermia-based ablative technologies (> 55°C) that are intended to destroy tumor tissue by heating [12]. Thus, to achieve maximal LTSL-mediated drug release, tissue temperatures must be delicately balanced and precisely controlled with feedbacks for real-time monitoring of chemotherapy delivery [13, 14].
The most commonly used method for performing absolute MR-based thermometry is based on temperature-dependent chemical shift changes in proton resonance relative to that of a reference resonance [15]. However, use of MRI is expensive, requires large dedicated facilities, and has technical limitations (e.g., interference by target tissue movement), and the agents that are required to create tumor imageability (e.g., gadolinium) may alter the chemical shift, thereby disrupting the fidelity of temperature measurement and drug delivery [16, 17]. Thus, there is a critical clinical need to develop an alternative, less-constrained technology using a modality such as ultrasound (US) that is low-cost and portable for accurate IGDD. US imaging is widely used both for cancer diagnosis and to assess therapeutic success, but due to its weak tissue contrast and the short half-life of commercially available microbubble (MB)-based contrast agents, it is currently not practical for visualizing localized drug release in real time or for determining chemotherapy distribution.
To address the limitations of the short half-life of MBs, recently we developed an echogenic heat sensitive (E-LTSL) and non-thermosensitive liposomes (E-NTSL) that co-encapsulates the US contrast agent perfluoropentane (PFP) and Dox in a size-controlled manner [18, 19]. PFP is a very hydrophobic, nontoxic, noncarcinogenic fluoroalkane with a boiling point (29 °C) between room and body temperatures [20]. The phase transition temperature for PFP is clinically relevant, as it allows PFP to be injected in the form of liquid droplets dispersed in an aqueous medium that then are converted to echogenic bubbles upon warming to body temperature [21]. Moreover, when stabilized by a lipid shell, the Laplace pressure (i.e., the pressure difference between the inside and the outside of PFP) substantially increases its boiling temperature due to the surface tension at the interface between PFP and bulk liquids [22]. Based on these features, we hypothesized that the predictable boiling point changes of encapsulated PFP with temperature due to Laplace pressure variation can be applied to nanothermometry and nanomonitoring of drug delivery. To achieve this goal, a robust motion compensation technology for tumor imaging is required to translate the contrast intensity variations into quantifiable state changes of nanoparticles.
In this study, we used our long circulating liposomes for motion compensated vascular contrast determination, and we applied this methodology to evaluate the temperature-dependent liposomal state change in combination with US imaging. Finally, we applied the predictable change in tumor vascular contrast of E-LTSL and E-NTSL for nanomonitoring of drug delivery. In vivo data obtained from a mouse tumor model suggest that co-encapsulated PFP in liposomes can be used to determine the temperature-dependent state of nanoparticles, and this property could be applicable to nanomonitoring of IGDD in real time, especially from E-LTSLs.
2. Materials and Methods
2.1 Materials
PFP (99%, Exfluor Research Corporation, TX, USA) was used as the US contrast agent. Monostearoyl-2-hydroxy-sn-glycero-3-phosphocholine (MSPC), 1,2-dipalmitoylsn-glycero-3-phosphocholine (DPPC), and 1,2-distearoyl-sn-glycero-3-phosphoethanolamine-N-[methoxy (polyethylene glycol)2000] (DSPE-mPEG2000) were obtained from Corden Pharma Corporation (CO, USA). Dox was obtained from LC laboratory (MA, USA). Agarose and psyllim fiber were purchased from BDH (PA, USA) and Konsyl Pharmaceuticals, (MD, USA), respectively. Graphite was purchased from Alpha Aesar (Ward Hill, MA, USA). Acetonitrile (HPLC grade) was obtained from Pharmco-AAPER (CT, USA). Ethylene glycol (99%, spectrophotometric grade), phenylboronic acid (98%), and 2,2-dimethoxypropane (98%) were purchased from Alpha Aesar. The PD-10 column was obtained from GE Healthcare Life Sciences (Buckinghamshire, UK). C26 cells were kindly provided by the National Cancer Institute.
2.2 Synthesis of E-LTSLs and E-NTSLs
LTSLs (lipid composition: DPPC, MSPC, and DSPE-mPEG2000 in the molar ratio of 85.3:9.7:5.0) and NTSLs (DPPC, cholesterol, and DSPE-mPEG2000 in the molar ratio of 58.1:36.8:5.07) were prepared by hydration of a lipid film followed by the extrusion method described previously [18, 23]. Briefly, lipid mixtures were dissolved in chloroform. The solvent was evaporated and the resulting lipid film was hydrated in citrate buffer (pH 4.0) mixed with 1,3-propanediol (1,3-PD (0.65 M, for PFP emulsification) at 55 0C for 30 min and extruded five times through double stacked 200 nm polycarbonate filters to yield a final lipid concentration of 50 mg lipid/ml (80.8 mM for LTSLs and 70.3 mM NTSLs) [24]. A PD-10 size-exclusion column equilibrated with 5-10 column volumes of 1x phosphate buffered saline (PBS) was used to remove free 1,3-PD from the outside of the liposomes.
Encapsulation of Dox into the E-LTSLs and E-NTSLs was carried out using the pH gradient loading protocol described by Mayer et al. [21]. The outside of the E-LTSLs was adjusted (by column) to about pH 7.4 using PBS, whereas the inside remained acidic at pH 4. Dox was loaded at 2 mg per 100 mg lipid concentration at 37°C for 1 h. PFP-loaded E-LTSLs and E-NTSLs were prepared using a one-step sonoporation method. Briefly, 2 mL of the liposomal formulations were incubated under continuous sonication (~20 khz) in 3 mL vials along with PFP (boiling point 30°C; 20 μL/100 mg lipid) for 1-2 min. PFP and LTSLs were kept cold prior to being combined, and the sonication bath was kept at 4°C to minimize PFP vaporization. This method was repeated at least in triplicate (n = 3) for evaluation. Free Dox and PFP were removed using a PD-10 column. For all in vitro characterizations, LTSLs were used as a positive control.
2.3 Characterization of E-LTSLs and E-NTSLs
E-LTSLs and E-NTSLs were characterized for size (z-average), polydispersity index and zeta potential using dynamic light scattering (DLS) with a 90 plus PALS Nanobrook device (Brookhaven Instruments, Holtsville, NY, USA). Briefly, 10-20 µl of E-LTSLs or E-NTSLs were added to 2 ml of PBS in a cuvette, and DLS measurements were recorded at room temperature. For each liposomal formulation an average of five measurements were taken, and the mean size and standard deviation were calculated for the E-LTSLs and E-NTSLs samples.
2.4 Dox release from E-LTSLs and E-NTSLs
Stability at body temperature (37°C) was assessed by measuring release of encapsulated Dox from E-LTSLs and E-NTSLs as a function of temperature (25-42°C) in PBS. E-LTSLs (50 mg lipid/ml) and E-NTSLs (50 mg lipid/ml) were diluted 300 fold in PBS, and 3 mL of sample were placed in a quartz cuvette equipped with a stopper and magnetic stirrer. Fluorescence of the released Dox was recorded at an excitation wavelength of 480 nm and fluorescence emission at 590 nm using a Cary Eclipse Fluorescence Spectrometer (Agilent Technologies, Santa Clara, CA, USA) equipped with an inbuilt temperature control system. Fluorescence readings were recorded for every degree ramp in temperature of the sample from 25 to 42 0C.
Drug release based on fluorescence quantification as a function of change in temperature was determined using the equation below:
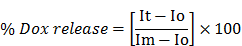
where Io is the initial fluorescence intensity for E-LTSLs and E-NTSLs in suspension at 25°C, It is the intensity of the same sample at a predetermined temperature, and Im is the fluorescence intensity of completely released Dox from E-LTSLs at 45°C or from E-NTSLs post breaking of the liposomes with 10x triton.
2.5 Transmission electron microscopy (TEM) imaging of E-LTSLs and E-NTSLs
TEM with negative staining was used to image E-LTSLs and E-NTSLs at various temperatures. Briefly, E-LTSLs and E-NTSLs were heated at 37°C, 39.5°C, and 42°C in a water bath for 15 min. The heated liposomes were diluted 500-1000X in PBS, and 10 μl of sample were loaded onto a carbon grid (Lacey and Holey grid). The grid was allowed to dry for 30 seconds followed by a 30 second treatment with 9 μl of 2% phosphotungstic acid. All TEM images were captured at 200 kV using a JOEL JEM-2100 TEM (JEOL, Peabody, MA, USA).
2.6 Monitoring of E-LTSL and E-NTSL intensity in an agarose phantom model
For US imaging, the phantom recipe (3% (w/v) agarose and 0.25% (w/v) graphite) was optimized to withstand hyperthermia temperatures up to ~70°C. Prior to imaging, free PFP was removed from E-LTSLs and E-NTSLs using PD-10 columns, and 1 ml of liposomes (~20-30 mg of total lipid) was added to the phantom wells for imaging. The phantom wells were positioned vertically in an Isotemp water bath (Fisher Scientific, Pittsburgh, PA, USA) with the visualsonics ultrasound transducer MS250 (13-24 MHz) positioned obliquely against the wells. Temperatures of the phantom wells were recorded before initiating imaging and during imaging using thermocouples positioned at the top of each well ~1 cm below the sample surface. Each minute the water temperature was increased by 1°C. Unpurified PBS mixtures containing PFP were used as positive controls. Column-purified PBS mixtures containing PFP alone or 1,3-PD plus PFP were used as additional controls.
All US imaging was conducted using a VisualSonics Vevo 2100 ultrasound MS550D transducer (22-55 MHz) (22-33 MHz, Fujifilm, Toronto, ON). To evaluate the correlation between US intensity at various temperatures, a cine acquisition of 100 frames at 20 frames per second was acquired for each temperature point simultaneously for E-LTSLs and E-NTSLs. Mean intensity within regions of interest (ROIs) defined for each sample was computed over the collected frames and normalized in the range of [0,1]. The normalized intensity visualized as a function of temperature allowed determination of general characteristics of the ultrasound intensities for E-LTSL and E-NTSL in phantom.
2.7 In vivo US imaging setup and hyperthermia treatment protocol
All animal-related procedures were approved and carried out under the guidelines of the Oklahoma State University Animal Care and Use Committee. For tumor initiation, C26 colon carcinoma cells were established in athymic nude mice as previously described [18, 19]. Briefly, confluent C26 cells grown as a monolayer in RPMI medium supplemented with 10% v/v fetal bovine serum and 1% v/v streptomycin/penicillin were harvested, washed, and diluted with sterile cold PBS at 0.5x 10⁵ cells/50 μl. Next, 50 μl of cell inoculum were injected subcutaneously in the thigh region of the mouse hind leg with a 25-gauge needle (BD; Franklin Lakes, NJ, USA). Mice were monitored and tumor growth was measured by serial caliper measurements (General Tools Fraction+™, NY, USA). Tumor volumes were calculated using the formula (length X width2)/2, where length is largest dimension and width is the smallest dimension perpendicular to length.
Tumor imaging was initiated once the tumors reached a volume of 300-400 mm3. For imaging, mice were anesthetized with 2-5% isoflurane and then secured on a heating stage maintained at 37°C (Stryker, MI, USA). For imaging, only the tumor bearing leg was isolated in specialized holders and immersed in the water bath, which was maintained at the desired temperatures of 37, 39.5, or 42°C. Tumor temperatures were allowed to equilibrate with the water bath for 10-15 min before injection of E-LTSLs/E-NTSLs. The water bath temperature was set 1°C higher relative to the target temperature, as this had already been calibrated to yield mean tumor temperatures of 37, 39.5, and 42°C.
2.8 Image acquisition procedure
For imaging, the transducer was placed in a stationary position oblique to the tumor with special clamps built in-house. Mice were injected with 100 μl of E-LTSLs or E-NTSLs (~10 mg total lipid) followed by 50 μl of saline flushed through a catheter placed in the tail vein. To assess image intensity over time, a cine acquisition of 100 frames at 20 f/sec was acquired at different time points up to 15-30 min.
2.9 Motion compensation for image intensity determination
To assess motion correction in the in vivo model and determine the variation of image intensity over time, a cine acquisition of 100 frames at 20 f/sec was acquired at different time points up to 15 min in our mouse model (Fig. 8a). A ROI encompassing the tumor was defined in the first frame and tracked in subsequent images by applying a rigid translation and rotation to the ROI to maximize the similarity between ROIs in each successive frame pair. Multiple ROIs were selected to include the region of tumor as well as other areas with high feature variations. In cases in which the tumor region did not have sufficient features to reliably compute similarity measures, alternative feature-rich ROIs were used. The rigid transformation computed using the alternative ROI was then applied to the tumor ROI. Similarity between ROIs was computed using Normalized Cross-Correlation (NCC). Once motion corrected, ROI sequences were analyzed over time as median intensity over the ROI normalized to the range [0,1]. This averaging method provided implicit regularization for noise and allowed determination of general characteristics of the ROI (peak intensity, rise time).
2.10 Validation of temporal vascular intensity variation of liposomes under motion compensation with temperature for drug delivery monitoring
To validate intensity variation with respect to temperature and the state change of the E-LTSLs and E-NTSLs in the mouse tumor, acquisition of 100 frames at temperatures of 37, 39.5, or 42°C (n=5-6 per temperature point) was performed. The temperature was kept constant for about 20 min (until wash out) at 42°C and then lowered to 39.5°C, followed by another injection of E-LTSLs. For each of these datasets, motion compensation was applied to each of the image frames as described in section 2.9. ROI sequences were analyzed to result in one median “key frame” per time period. Subsequently, a rigid rotation and translation was applied to each of these key frames to adjust for any gross motion that arose due to motion of the animal or the transducer by maximizing NCC between consecutive key frames. The normalized intensity visualized as a function of time allowed determination of general characteristics of the peak intensity, wash-in AUC—wiAUC) for each of the temperature points.
2.11 Nanomonitoring of drug delivery and Dox quantification by high performance liquid chromatography (HPLC)
For nanomonitoring, the tumor was kept at fixed temperatures of 37 and 42°C in a water bath. After the baseline ultrasound images of target tumor was obtained, the mice were injected with Dox-loaded E-LTSLs or E-NTSLs, and US images were collected to confirm intensity variation. One hour following treatment, mice were euthanized, and cardiac perfusion was performed. The tumors and other organs were excised, weighed, snap frozen over liquid nitrogen, and then stored at -80°C until HPLC was performed to estimate the amount of drug in the tumor samples (n=3-5/treatment group).
For HPLC, stock solutions of Dox (0.25-100 μg) and internal standard (daunorubicin; 2.5 μg/ml) were prepared in deionized water [1]. For calibration standards, a tumor from a control mouse was spiked with 10 μl of Dox (0.25-100 μg Dox/ml) and daunorubicin (2.5 μg/ml). Tumors were homogenized in aqueous KH2PO4 solution (20 mM, pH 3.8) at a concentration of 100 mg/ml with zirconia beads (2 mm diameter, Biospec Products Inc., OK, USA) with Mini-Beadbeater-16 (Biospec) at 3450 oscillations/min for 3 min. For HPLC analysis, 90 μl (n = 3, 100 mg/ml) of the tumor homogenate were mixed with 50 μL of internal standard solution (2.5 μg daunorubicin /mL) incubated at 37ºC for 15 min. Post-incubation, 250 μl of acetone and 100 μl of ZnSO4 solutions (saturated) were added to the homogenate, and it was re-incubated at 37ºC for another 15 min to precipitate the proteins. Subsequently, the samples were centrifuged in a Microfuge 22R (Beckman Coulter, CA, USA) at 18110 x g at 4ºC for 10 min. Finally, 200 µL of supernatant were transferred to another vial and evaporated using TurboVap® LV (Caliper Life Sciences, MA, USA) at 60ºC under a stream of compressed air. Prior to HPLC, the dried residue was completely dissolved in 100 μl HPLC mobile phase, and 20 µL of this solution were introduced into the shimadzu HPLC system for analysis.
2.12 Statistical analysis
Treatment groups were compared for differences in mean Dox concentration using analysis of variance (ANOVA) followed by Tukey's multiple comparison post-hoc test. All analyses were performed using GraphPad Prism 5.0 (GraphPad Software Inc.). All p-values were two-sided, and a p-value < 0.05 indicated statistical significance. Values are reported as mean ± SEM unless otherwise indicated.
3. Results
3.1 Characterization of E-LTSLs and E-NTSLs
Active loading of Dox by transmembrane pH gradient yielded an encapsulation efficiency of ~95% and ~65% for E-LTSLs and E-NTSLs, respectively. Following PFP loading by one-step sonoporation, E-LTSLs and E-NTSLs retained about 70-80% of the encapsulated drug. Table 1 shows the hydrodynamic diameter, polydispersity index and zeta potential values of E-LTSLs and E-NTSLs at room temperature (25ºC), and these were fairly similar between various groups following PFP loading.
3.2 Dox release from E-LTSLs and E-NTSLs in physiological buffer
Percent Dox release from E-LTSLs and LTSLs was minimal (< 5%) at 25-39°C, more gradual at 40°C (~20%), and rapid and complete (> 95%) near the temperature with the maximum release rate (~41-42°C) (Fig. 1). In contrast to E-LTSLs, Dox release from E-NTSLs and NTSLs was < 5% at all temperature points tested, which confirms their non-thermosensitivity.
Table 1
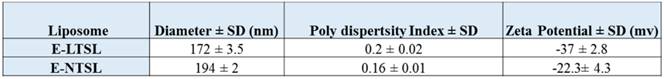
Physicochemical characterization of E-LTSL and E-NTSL.
Figure 1
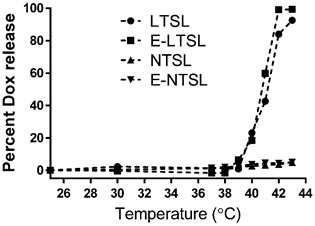
Release of Dox with temperature as the sample (LTSL, E-LTSL, E-NTSL, and NTSL) is heated from 20-43°C at 1°C. Percent release was calculated by assuming 100% release with Triton-X, and 0% release at 25°C.
3.3 TEM analysis of E-LTSLs and E-NTSLs
TEM confirmed the presence of PFP and 1,3-PD emulsion within the liposome aqueous core between 37°C to 42°C for E-LTSLs (2a-c) and E-NTSLs (2d-f). E-LTSLs and E-NTSLs were spherical at 37°C, but the membranes deformed at ~42°C. In general, membrane deformation of E-LTSLs at 39.5°C and 42°C was more prominent compared to E-NTSLs.
3.4. Intensity variation of E-LTSLs and E-NTSLs in tissue mimicking phantom
For E-LTSLs, as the sample was heated from 37 to 42°C, US signal intensity progressively increased (~2 fold from 37 to 39.8 °C; Fig. 3a-b), and at ~42°C, a further 2-3-fold increase occurred. Likewise, E-NTSL contrast also increased from 37-42°C, but the increase was ~1-2 fold lesser compared to E-LTSL (Fig. 3b).
3.5 Kinetics of E-LTSLs and E-NTSLs in mouse tumors in vivo
US images obtained in B mode from time zero to wash out time of liposomes from the tumor (~15-30 min) showed contrast enhancement in the tumors for both E-LTSLs (Fig. 4a-d) and E-NTSLs (Fig. 4e-h). In general, maximum contrast enhancement was observed for 15-20 min post-liposome injection. Additionally, development of contrast with E-NTSLs was more gradual with temperature in comparison to E-LTSLs.
Figure 2
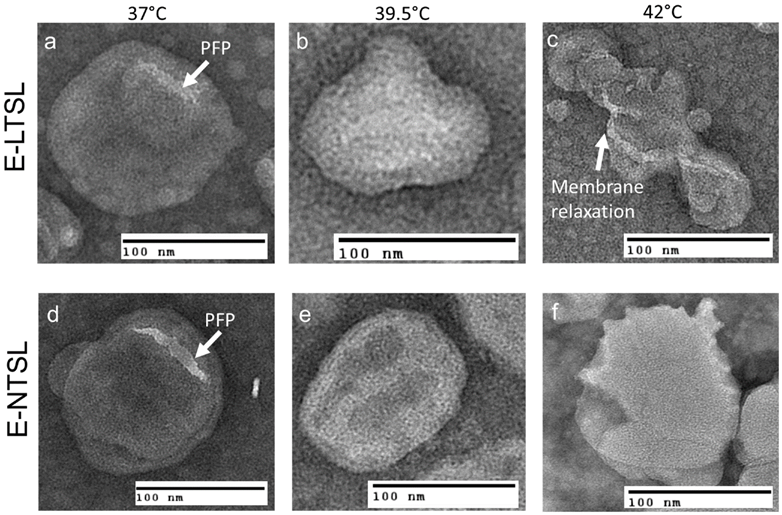
a & d: TEM images of Echogenic thermosensitive (E-LTSL) and non-thermosensitive (E-NTSL) liposomes showing the spherical liposomes containing PFP-PD emulsion; (a-c) Gradual and significant relaxation of the E-LTSL membranes due to hyperthermia from 37 to 420C; (d-f) E-NTSL from 37-420C showing moderate structural changes at 420C.
Figure 3
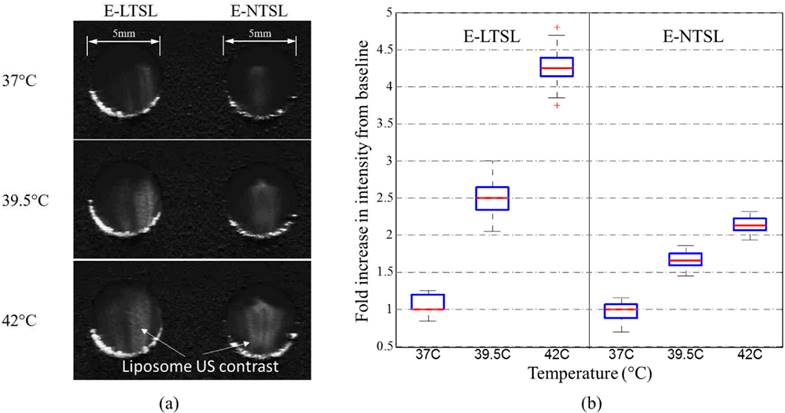
Intensity of observed ultrasound image with respect to baseline in the range of 37-42°C in tissue-mimicking phantoms; b) With an increase in temperature, a corresponding increase in ultrasound intensity of E-LTSL and E-NTSL was noted (n=100).
Figure 4
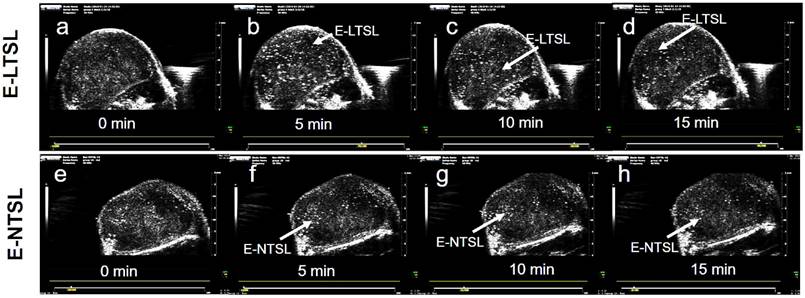
Enhanced tumor contrast (B-mode) following intravenous injection of echogenic liposomes in a mouse model of colon cancer. A sustained increase in tumor contrast for E-LTSL and E-NTSL was noted compared to baseline tumor images at 10-15min. (a)Tumor image prior to E-LTSL injection; (b-d) Enhanced tumor contrast 5, 10, 15 min post E-LTSL injection respectively; (e) Tumor image prior to E-NTSL injection; (f-h) Enhanced tumor contrast at 5, 10, 15 min post E-NTSL injection respectively.
3.6 Fidelity of motion compensation in mouse tumors
In the absence of motion compensation in vivo, as time progressed, the contrast variation of E-LTSL and E-NTSL was obscured and minimized relative to baseline images (Fig. 5a-d). When the motion compensation technique was applied for E-LTSLs, a > 2-fold drop in standard deviation for mean image intensity occurred, enabling a more robust estimate of temporal variations due to state change of liposomes (Fig. 5 e-h, 6a). Furthermore, a 6-fold increase in within-ROI signal intensity occurred after injection (once the liposomes reached a steady-state temperature greater than their transition temperature) vs. background (pre-injection) (Fig. 6b). Similar results were observed for E-NTSLs (data not shown).
3.7 Relationship between motion compensated image intensity and temperature in mouse tumors
Corresponding to our phantom results, following motion compensation, we saw a marked increase in peak intensity at 42°C compared to 37°C, which was 2-fold larger than the increase in peak intensity between 39.5°C and 37°C for both E-LTSLs and E-NTSLs (Fig. 7). These data were consistent across a cohort of six animals. Interestingly, like in vitro tissue mimicking data phantom data, the change in tumor contrast was more prominent (~2-fold greater) for E-LTSLs than for E-NTSLs at 42°C.
Figure 5
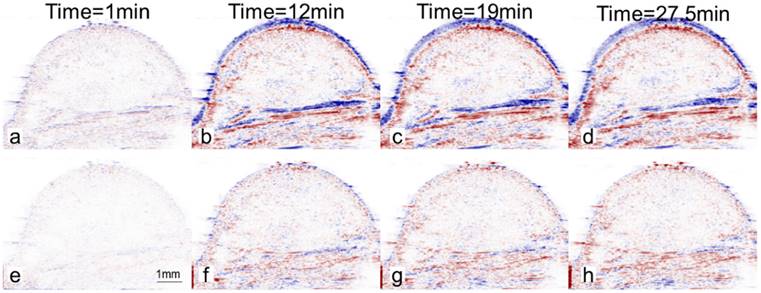
Difference between ultrasound image at a given time and the reference image at time t=0s. Values are blue if difference is positive, values are red if difference is negative. Intensity values are proportional to difference. (a-d) Without motion compensation. As time progresses, difference due to motion obscures difference due to nanoparticles (E-LTSL or E-NTSL). (e-h) With motion compensation. Gross motion is compensated allowing intensity difference due to nanoparticles to be computed.
Figure 6
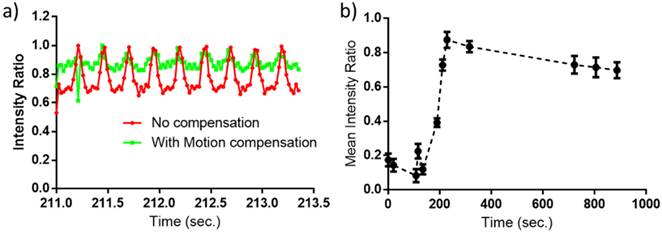
(a) A magnified view of average intensity inside the ROI over 100 frames (2.35s). Motion compensation reduces the standard deviation by a factor of over 2; (b) Mean intensity inside the ROI after motion compensation of observed ultrasound image as a function of time. The error bars indicate the standard deviation in the average intensity over 100 frames (2.35s) at that time point.
Figure 7
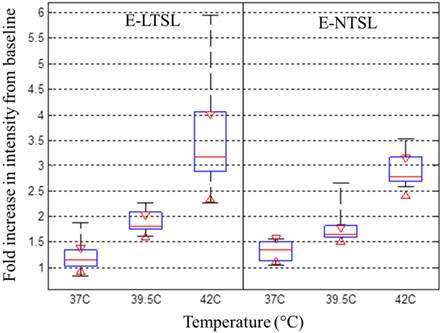
Relationship between tumor vascular contrast and temperature from 37- 42°C in a mouse model of colon cancer. With increase of temperature, a corresponding increase in ultrasound tumor contrast intensity was noted (maximal signal at 42°C).
Figure 8
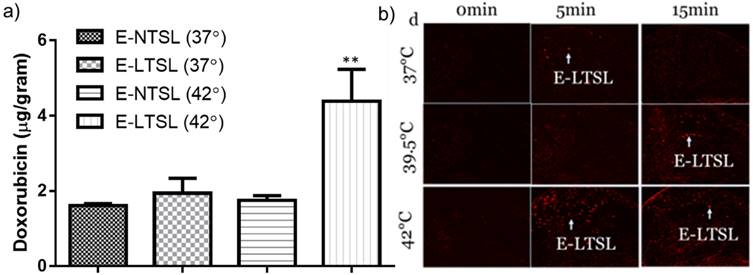
a) Doxorubicin concentration determined in tumors post Dox E-LTSL and Dox E-NTSL injection; b) Motion compensated B-mode tumor contrast at 37 and 42°C contrast from 0-15min. Enhanced regions with heavily populated E-LTSL are shown with an arrow.
3.8. Nanomonitoring of drug delivery in mouse tumors by HPLC
The heated tumor Dox concentrations were 1.6 ± .06, 1.94 ± 0.35, 1.74 ± 0.2 and 4.2± 0.8 μg Dox/g tissue for E-NTSLs (37°C), E-LTSLs (37°C), E-NTSLs (42°C) and E-LTSLs (42°C), respectively (Fig. 8). E-LTSLs + hyperthermia resulted in a ~2.5-fold greater tissue drug delivery compared to E-NTSLs +hyperthermia and E-LTSLs alone (p < 0.05, Tukey's test). Importantly, the level of tumor Dox corresponded to the E-LTSL tumor contrast measure for 15 min at 37, and 42°C, with higher tumor contrast indicating greater drug delivery for E-LTSL samples. Such differences were not noted for E-NTSL due to their non-thermosensitive characteristics.
4. Discussion
MBs can produce up to 15-25 dB in echo intensities of blood flow signals and help better determine tortuous angiogenic vasculature than conventional US imaging [25]. This is a significant advantage, but the degree of contrast enhancement following MB injection is rapid and complete, and systemically MBs are degraded quickly after injection [26]. To circumvent these problems, in this study we encapsulated the US contrast agent PFP in a size-controlled manner within liposomes to create long circulating E-LTSLs and E-NTSLs. The feasibility of incorporating PFP into stealth liposomes in a size-controlled manner has been reported previously using lipid-based surfactants (1,2-dihexadecanoyl-sn-glycero-3-phosphocholine and 1,2-dipalmitoyl-sn-glycero-3-phosphate) to emulsify perfluorohexane (PFC6) for loading into liposomes [27, 28]. Negatively stained liposomes synthesized using these surfactants suggested that PFC6 emulsions were effectively loaded. Recently, we adapted a method proposed by Ibsen et al. that involves incorporation of the water-soluble surfactant 1,3-PD into the aqueous core of the liposome to entrap PFP and induce emulsion formation in the liposome [19, 24, 29]. TEM conducted following PFP encapsulation suggested that nanoemulsified PFP can be successfully encapsulated within the aqueous core at body temperature independent of liposome composition and without impacting the size (~150-200 nm for both E-LTSLs and E-NTSLs, Table 1). Interestingly, TEM imaging revealed that at higher temperatures (> 40°C), E-LTSLs demonstrate relatively greater membrane relaxation compared to E-NTSLs (Fig. 2c&f). This is likely due to the presence of lysolipids in the E-LTSLs that induce formation of thermodynamically favored micelle-like conformation and lateral lipid domains [30]. Additionally, the presence of lysolipid impacted the Dox release, with > 95% drug release for E-LTSLs and < 5% release from E-NTSLs in physiological buffer (Fig.1). Importantly, the 1,3-PD method of PFP emulsification in the liposome aqueous core provided excellent thermal stability of encapsulated PFP when they transitioned to the bubble state at higher temperature, as evidenced by sustained vascular imaging (~15-20 min) with longer clearance kinetics versus that seen with relevant controls (Fig.4). This result is promising, but it is not clear whether the PFP vapors transition back to the liquid state when the mouse tumors are cooled down. Additionally, whether the tumor accumulated E-LTSLs and E-NTSLs can be used to longitudinally track tumor growth needs more investigation in future studies.
A major challenge of hyperthermia mediated IGDD is the motion of the target (solid tumor), particularly in the abdominal region, due to respiration or patient movement. Movement impairs precise triggered release of drugs, especially from LTSLs under US guidance. In recent years, a variety of techniques to compensate for target motion, including increasing the transducer angle increment and using a dual-mode combination of the tissue and contrast-MB responses to perform alignment of both tissue and vascular structures, have been proposed [31-33]. These are promising findings, but the short half-life of currently available MBs still prevents their use for IGDD guidance. To assess motion correction in an in vivo model and determine the variation of image intensity over time, we applied a rigid transformation to the ROIs using our long circulating theranostic echogenic liposomes. This procedure maximized the similarity between the ROI in each successive frame pair, resulting in a significantly enhanced estimation of temporal variation in tumor vascular intensity (Fig 5&6). Thus, we believe that this property hypothetically can be used to provide a precise spatiotemporal control of drug release from thermosensitive liposomes [34].
Clinically, hyperthermia is achieved by using a variety of applicators (e.g., microwave applicators, radiofrequency applicators, HIFU) [35]. However, these devices and methods have drawbacks, including lack of spatial precision and temperature accuracy (e.g., hot or cool spots) and inability to achieve controlled mild hyperthermic temperatures (40-45°C). Previously, we and others showed that MR-thermometry provides high spatial and temporal resolution for IGDD of tumors [5, 36, 37], but MR technology is sensitive to tissue motion and to external perturbation of the magnetic field [38]. Like MRI, US imaging can also determine temperature-based changes in the speed of sound or thermal expansion within the mildly heated tissue region by comparing US images frame-by-frame over time, but temperature mapping is still problematic due to tissue motion and effects of non-thermal and unintended thermal effects on the US signal [39]. In the current, we took an alternative approach to directly estimate the state of the nanoparticles and thus monitor hyperthermia-responsive drug delivery. We mapped the relative intensity variations to the temperature-dependent changes in the state of E-LTSLs and E-NTSLs. To do this, we relied on changes in acoustic impedance between tissues, fluids, and their surrounding microenvironments at various temperatures and transformed these changes into a surrogate of relative tissue temperature. Our data show that the motion-corrected US intensity of E-LTSLs changes with temperature (Fig. 3a-b). When PFP vaporization within E-LTSLs is complete, contrast intensity stabilizes to a fixed level (~37-39°C) and then increases at the transition temperature of liposomes (~39.5°C) as the interface between liposome and surrounding medium is replaced by multiple interfaces between nanobubbles and surrounding fluids. Interestingly, the change in vaporization and US intensity was more prominent for E-LTSLs than for E-NTSLs (Fig. 7a-b). We speculate that the relative echo obtained for liposomes is a function of PFP vaporization, membrane state at higher temperature, and the concentration and agglomeration status of the liposomes in blood vessels. E-LTSLs have relatively higher membrane relaxation, and this fundamental property may provide stronger echo signals during US imaging at relatively greater vascular concentration compared to E-NTSLs at temperatures > 40°C. It may be noted that the ultrasound intensity increase showed similar patterns in our phantom and animal models. However, in the animal model the boundary conditions are different from a static phantom as there is continuous flow of blood and hence continuous supply of liposomes to transform depending on the temperature they encounter. This results in dependence on both time and temperature (Fig.7). The animal model thus shows the classical wash-in & wash-out change of intensity (a gamma distribution) but with a much larger time horizon. Thus to focus on variation due to temperature alone, either peak intensity of this distribution or the area under the wash-in curve are considered. For this work we have considered peak intensity of this distribution as this would be indicative of the maximum amount of transformed liposomes at a given time. As shown in figure 6 & 7, this peak intensity shows temperature dependence., An important utility of such a phenomenon could be in nanomonitoring of drug delivery from E-LTSL. As shown in Fig. 8, in the mild hyperthermia ranged (~40-42°C), estimations of tumor contrast could reliably predict drug delivery. This discreet prediction and control of drug delivery will likely be negated at temperatures> 45°C due to perfusion shutdown, and thus our state-changing echogenic liposomes can serve as an excellent surrogate marker of mild hyperthermia in tumors (especially in the absence of MR-thermometry).
Our study has several addressable limitations. First, hyperthermia treatment of tumors was performed using the traditional water bath methodology. This method of hyperthermia achieves spatially homogeneous heating of selected tissue and controlled tumor vascular enhancement, but is not feasible to use clinically for deep seated tumors [7]. Also, for deep seated tumors this homogeneity may not exist with other types of hyperthermia applicators (e.g., HIFU), especially if the treatment cell area (focal spot) is smaller than the tumor volume. This has been addressed to some extent through the recent development of phased array transducers with appropriate driving electronics that enable the creation of a desired focal pattern by making fast temporal displacements of multiple foci, thereby significantly enhancing the treatment volume [36]. In addition, Bing et al. successfully created 3D-printed sector-vortex lenses with annular focal regions that enabled customization of the heating volume in rodent models [40]. Studies are currently underway to investigate the contrast variations using sector-vortex lenses with various types of animal tumor models to demonstrate this idea in our laboratory. The second limitation of this study was reliance on vascular contrast of E-LTSLs and E-NTSLs. Given the relatively small size of the liposomes, they may passively accumulate in the tumor by the enhanced permeation and retention effect and influence the contrast assessment in real time. Our liposomes demonstrate the highest rate of vaporization at higher temperature (> 40°C), and a passive accumulation is not expected to dramatically alter the imaging feedback at body temperature; in fact, it would help provide a stronger signal that may have diagnostic value. Despite this, if tests of the current formulations do not meet the proposed criteria, we will adjust the PFP level in the liposomes prior to translation into human studies to reduce background artifacts. Third, the temperature monitoring by PFP phase-shift in liposomes may not be as precise as the PRFS method currently in clinical trials for MRI thermometry. This could impact targeted IGDD, as temperatures > 45°C have been shown to shut down tumor vascular perfusion [41]. The theranostic liposomes proposed in this study is not intended to replace the MR-thermometry technology, which has merits for clinical use. We believe that the phase-changing liposomes may have utility for hyperthermia devices where PRFS cannot be applied easily (e.g., Radiofrequency applicators, microwave, ultrasound guided HIFU) or for nanomonitoring of drug delivery in tumors with US imaging feedback that is currently not possible to achieve with MBs with short-half lives.
In summary, this work provides important evidence that robust estimation of the state of theranostic liposomes and vascular contrast can be obtained from motion compensated US images in both tissue mimicking phantom and mouse models of colon cancers using temperature induced variations of Laplace pressure. Such elevations in relative image contrast correspond to drug delivery. This theranostic technology has the potential to guide non-invasive IGDD for tumors that require accurate temporal and spatial monitoring of drug treatments.
Acknowledgements
Research reported in this publication was supported by the Center for Veterinary Health Sciences Seed Support, National Cancer Institute of the National Institutes of Health under Award Number R15CA179369; the Oklahoma Center for Advancement in Science and Technology (OCAST), and the Oklahoma State University (OSU) Kerr Endowed chair support and Technology Business Development Program grant. SEM imaging was carried out in the Microscopy Laboratory at OSU, which received funds for purchasing the equipment from the NSF MRI program. The content is solely the responsibility of the authors and does not necessarily represent the official views of the National Institutes of Health or OCAST. The feature (mentioned herein) is based on research and is not commercially available. Its future availability cannot be guaranteed due to regulatory issues.
Competing Interests
The authors have declared that no competing interest exists.
References
1. Ranjan A, Jacobs GC, Woods DL, Negussie AH, Partanen A, Yarmolenko PS. et al. Image-guided drug delivery with magnetic resonance guided high intensity focused ultrasound and temperature sensitive liposomes in a rabbit Vx2 tumor model. Journal of Controlled Release. 2012;158:487-94
2. de Smet M, Heijman E, Langereis S, Hijnen NM, Grull H. Magnetic resonance imaging of high intensity focused ultrasound mediated drug delivery from temperature-sensitive liposomes: an in vivo proof-of-concept study. Journal of controlled release: official journal of the Controlled Release Society. 2010;150:102-10
3. Needham D, Anyarambhatla G, Kong G, Dewhirst MW. A new temperature-sensitive liposome for use with mild hyperthermia: characterization and testing in a human tumor xenograft model. Cancer research. 2000;60:1197-201
4. Negussie AH, Yarmolenko PS, Partanen A, Ranjan A, Jacobs G, Woods D. et al. Formulation and characterisation of magnetic resonance imageable thermally sensitive liposomes for use with magnetic resonance-guided high intensity focused ultrasound. Int J Hyperthermia. 2010;27:140-55
5. Ranjan A, Jacobs GC, Woods DL, Negussie AH, Partanen A, Yarmolenko PS. et al. Image-guided drug delivery with magnetic resonance guided high intensity focused ultrasound and temperature sensitive liposomes in a rabbit Vx2 tumor model. Journal of controlled release: official journal of the Controlled Release Society. 2012;158:487-94
6. de Smet M, Hijnen NM, Langereis S, Elevelt A, Heijman E, Dubois L. et al. Magnetic resonance guided high-intensity focused ultrasound mediated hyperthermia improves the intratumoral distribution of temperature-sensitive liposomal doxorubicin. Investigative radiology. 2013;48:395-405
7. Kong G, Anyarambhatla G, Petros WP, Braun RD, Colvin OM, Needham D. et al. Efficacy of liposomes and hyperthermia in a human tumor xenograft model: importance of triggered drug release. Cancer research. 2000;60:6950-7
8. Tashjian JA, Dewhirst MW, Needham D, Viglianti BL. Rationale for and measurement of liposomal drug delivery with hyperthermia using non-invasive imaging techniques. Int J Hyperther. 2008;24:79-90
9. Viglianti BL, Ponce AM, Michelich CR, Yu D, Abraham SA, Sanders L. et al. Chemodosimetry of in vivo tumor liposomal drug concentration using MRI. Magnetic resonance in medicine: official journal of the Society of Magnetic Resonance in Medicine / Society of Magnetic Resonance in Medicine. 2006;56:1011-8
10. Viglianti BL, Abraham SA, Michelich CR, Yarmolenko PS, MacFall JR, Bally MB. et al. In vivo monitoring of tissue pharmacokinetics of liposome/drug using MRI: illustration of targeted delivery. Magnetic resonance in medicine: official journal of the Society of Magnetic Resonance in Medicine / Society of Magnetic Resonance in Medicine. 2004;51:1153-62
11. Davis RM, Viglianti BL, Yarmolenko P, Park JY, Stauffer P, Needham D. et al. A method to convert MRI images of temperature change into images of absolute temperature in solid tumours. Int J Hyperther. 2013;29:569-81
12. Grull H, Langereis S. Hyperthermia-triggered drug delivery from temperature-sensitive liposomes using MRI-guided high intensity focused ultrasound. Journal of controlled release: official journal of the Controlled Release Society. 2012;161:317-27
13. Kircher MF, Willmann JK. Molecular body imaging: MR imaging, CT, and US. Part II. Applications. Radiology. 2012;264:349-68
14. Kircher MF, Willmann JK. Molecular body imaging: MR imaging, CT, and US. part I. principles. Radiology. 2012;263:633-43
15. Fernando R, Downs J, Maples D, Ranjan A. MRI-Guided Monitoring of Thermal Dose and Targeted Drug Delivery for Cancer Therapy. Pharmaceutical research. 2013
16. Deckers R, Sprinkhuizen SM, Crielaard BJ, Ippel JH, Boelens R, Bakker CJG. et al. Absolute MR thermometry using nanocarriers. Contrast Media Mol I. 2014;9:283-90
17. Hijnen NM, Elevelt A, Pikkemaat J, Bos C, Bartels LW, Grull H. The magnetic susceptibility effect of gadolinium-based contrast agents on PRFS-based MR thermometry during thermal interventions. Journal of therapeutic ultrasound. 2013;1:8
18. Maples D, McLean K, Sahoo K, Newhardt R, Venkatesan P, Wood B. et al. Synthesis and characterisation of ultrasound imageable heat-sensitive liposomes for HIFU therapy. Int J Hyperthermia. 2015;31:674-85
19. Maples DN. et al. Novel ultrasound imageable low temperature sensitive liposomes for use with ultrasound-guided high intensity focused ultrasound. Society for Thermal Medicine Annual Meeting. 2014;31:153
20. Rapoport N, Nam KH, Gupta R, Gao Z, Mohan P, Payne A. et al. Ultrasound-mediated tumor imaging and nanotherapy using drug loaded, block copolymer stabilized perfluorocarbon nanoemulsions. Journal of controlled release: official journal of the Controlled Release Society. 2011;153:4-15
21. Kandadai MA, Mohan P, Lin G, Butterfield A, Skliar M, Magda JJ. Comparison of surfactants used to prepare aqueous perfluoropentane emulsions for pharmaceutical applications. Langmuir: the ACS journal of surfaces and colloids. 2010;26:4655-60
22. Rapoport N. Phase-shift, stimuli-responsive perfluorocarbon nanodroplets for drug delivery to cancer. Wiley interdisciplinary reviews Nanomedicine and nanobiotechnology. 2012;4:492-510
23. Senavirathna LK, Fernando R, Maples D, Zheng Y, Polf JC, Ranjan A. Tumor Spheroids as an In Vitro Model for Determining the Therapeutic Response to Proton Beam Radiotherapy and Thermally Sensitive Nanocarriers. Theranostics. 2013;3:687-91
24. Ibsen S, Benchimol M, Simberg D, Schutt C, Steiner J, Esener S. A novel nested liposome drug delivery vehicle capable of ultrasound triggered release of its payload. Journal of controlled release: official journal of the Controlled Release Society. 2011;155:358-66
25. Brodersen J, Siersma VD. Long-term psychosocial consequences of false-positive screening mammography. Annals of family medicine. 2013;11:106-15
26. Larsen LP. Role of contrast enhanced ultrasonography in the assessment of hepatic metastases: A review. World journal of hepatology. 2010;2:8-15
27. Rapoport N, Gao ZG, Kennedy A. Multifunctional nanoparticles for combining ultrasonic tumor imaging and targeted chemotherapy. J Natl Cancer I. 2007;99:1095-106
28. Javadi M, Pitt WG, Belnap DM, Tsosie NH, Hartley JM. Encapsulating Nanoemulsions Inside eLiposomes for Ultrasonic Drug Delivery. Langmuir: the ACS journal of surfaces and colloids. 2012;28:14720-9
29. Chen CC, Borden MA. The role of poly (ethylene glycol) brush architecture in complement activation on targeted microbubble surfaces. Biomaterials. 2011;32:6579-87
30. Ickenstein LM, Arfvidsson MC, Needham D, Mayer LD, Edwards K. Disc formation in cholesterol-free liposomes during phase transition. Biochimica et biophysica acta. 2003;1614:135-8
31. Denarie B, Tangen TA, Ekroll IK, Rolim N, Torp H, Bjastad T. et al. Coherent plane wave compounding for very high frame rate ultrasonography of rapidly moving targets. IEEE transactions on medical imaging. 2013;32:1265-76
32. van den Oord SC, Akkus Z, Bosch JG, Hoogi A, ten Kate GL, Renaud G. et al. Quantitative contrast-enhanced ultrasound of intraplaque neovascularization in patients with carotid atherosclerosis. Ultraschall in der Medizin. 2015;36:154-61
33. Bouhlel N, Coron A, Barrois G, Lucidarme O, Bridal SL. Dual-mode registration of dynamic contrast-enhanced ultrasound combining tissue and contrast sequences. Ultrasonics. 2014;54:1289-99
34. Pysz MA, Guracar I, Foygel K, Tian L, Willmann JK. Quantitative assessment of tumor angiogenesis using real-time motion-compensated contrast-enhanced ultrasound imaging. Angiogenesis. 2012;15:433-42
35. Hinshaw JL, Lubner MG, Ziemlewicz TJ, Lee FT Jr, Brace CL. Percutaneous tumor ablation tools: microwave, radiofrequency, or cryoablation-what should you use and why? Radiographics: a review publication of the Radiological Society of North America, Inc. 2014;34:1344-62
36. Partanen A, Yarmolenko PS, Viitala A, Appanaboyina S, Haemmerich D, Ranjan A. et al. Mild hyperthermia with magnetic resonance-guided high-intensity focused ultrasound for applications in drug delivery. Int J Hyperthermia. 2012;28:320-36
37. Staruch RM, Ganguly M, Tannock IF, Hynynen K, Chopra R. Enhanced drug delivery in rabbit VX2 tumours using thermosensitive liposomes and MRI-controlled focused ultrasound hyperthermia. International journal of hyperthermia: the official journal of European Society for Hyperthermic Oncology, North American Hyperthermia Group. 2012;28:776-87
38. Salomir R, Viallon M, Kickhefel A, Roland J, Morel DR, Petrusca L. et al. Reference-free PRFS MR-thermometry using near-harmonic 2-D reconstruction of the background phase. IEEE transactions on medical imaging. 2012;31:287-301
39. Lai CY, Kruse DE, Caskey CF, Stephens DN, Sutcliffe PL, Ferrara KW. Noninvasive thermometry assisted by a dual-function ultrasound transducer for mild hyperthermia. IEEE transactions on ultrasonics, ferroelectrics, and frequency control. 2010;57:2671-84
40. Bing C, Nofiele J, Staruch R, Ladouceur-Wodzak M, Chatzinoff Y, Ranjan A. et al. Localised hyperthermia in rodent models using an MRI-compatible high-intensity focused ultrasound system. Int J Hyperthermia. 2015:1-10
41. Bicher HI, Hetzel FW, Sandhu TS, Frinak S, Vaupel P, O'Hara MD. et al. Effects of hyperthermia on normal and tumor microenvironment. Radiology. 1980;137:523-30
Author contact
![]() Corresponding author: Dr. Ashish Ranjan, B.V.Sc., Ph.D. Associate Professor, 169 McElroy Hall, Center for Veterinary Health Sciences, Oklahoma State University, Stillwater, Oklahoma-74074. Phone: 4057446292 Fax: 4057448263 Email: ashish.ranjanedu.
Corresponding author: Dr. Ashish Ranjan, B.V.Sc., Ph.D. Associate Professor, 169 McElroy Hall, Center for Veterinary Health Sciences, Oklahoma State University, Stillwater, Oklahoma-74074. Phone: 4057446292 Fax: 4057448263 Email: ashish.ranjanedu.
Citation styles
APA
Ektate, K., Kapoor, A., Maples, D., Tuysuzoglu, A., VanOsdol, J., Ramasami, S., Ranjan, A. (2016). Motion Compensated Ultrasound Imaging Allows Thermometry and Image Guided Drug Delivery Monitoring from Echogenic Liposomes. Theranostics, 6(11), 1963-1974. https://doi.org/10.7150/thno.15922.
ACS
Ektate, K.; Kapoor, A.; Maples, D.; Tuysuzoglu, A.; VanOsdol, J.; Ramasami, S.; Ranjan, A. Motion Compensated Ultrasound Imaging Allows Thermometry and Image Guided Drug Delivery Monitoring from Echogenic Liposomes. Theranostics 2016, 6 (11), 1963-1974. DOI: 10.7150/thno.15922.
NLM
Ektate K, Kapoor A, Maples D, Tuysuzoglu A, VanOsdol J, Ramasami S, Ranjan A. Motion Compensated Ultrasound Imaging Allows Thermometry and Image Guided Drug Delivery Monitoring from Echogenic Liposomes. Theranostics 2016; 6(11):1963-1974. doi:10.7150/thno.15922. https://www.thno.org/v06p1963.htm
CSE
Ektate K, Kapoor A, Maples D, Tuysuzoglu A, VanOsdol J, Ramasami S, Ranjan A. 2016. Motion Compensated Ultrasound Imaging Allows Thermometry and Image Guided Drug Delivery Monitoring from Echogenic Liposomes. Theranostics. 6(11):1963-1974.
This is an open access article distributed under the terms of the Creative Commons Attribution (CC BY-NC) License. See http://ivyspring.com/terms for full terms and conditions.