Impact Factor
 Global reach, higher impact
Theranostics 2015; 5(5):443-455. doi:10.7150/thno.11107 This issue Cite
Research Paper
CFD Modeling and Image Analysis of Exhaled Aerosols due to a Growing Bronchial Tumor: towards Non-Invasive Diagnosis and Treatment of Respiratory Obstructive Diseases
Jinxiang Xi1, ![]() , JongWon Kim1, Xiuhua A. Si2, Richard A. Corley3, Senthil Kabilan3, Shengyu Wang4,5
, JongWon Kim1, Xiuhua A. Si2, Richard A. Corley3, Senthil Kabilan3, Shengyu Wang4,5
1. School of Engineering and Technology, Central Michigan University, Mt Pleasant, MI, 48858, USA.
2. Department of Mechanical Engineering, California Baptist University, Riverside, CA, 92504, USA.
3. Systems Toxicology & Exposure Science, Pacific Northwest National Laboratory, Richland, WA 99352, USA.
4. Department of Pulmonary & Critical Care Medicine, First Affiliated Hospital of Xi'an Medical University, Shaanxi, China 710077.
5. Department of Anesthesiology, Mayo Clinic, Rochester, MN, 55905, USA.
Received 2014-11-18; Accepted 2015-1-9; Published 2015-2-6
Abstract

Diagnosis and prognosis of tumorigenesis are generally performed with CT, PET, or biopsy. Such methods are accurate, but have the limitations of high cost and posing additional health risks to patients. In this study, we introduce an alternative computer aided diagnostic tool that can locate malignant sites caused by tumorigenesis in a non-invasive and low-cost way. Our hypothesis is that exhaled aerosol distribution is unique to lung structure and is sensitive to airway structure variations. With appropriate approaches, it is possible to locate the disease site, determine the disease severity, and subsequently formulate a targeted drug delivery plan to treat the disease. This study numerically evaluated the feasibility of the proposed breath test in an image-based lung model with varying pathological stages of a bronchial squamous tumor. Large eddy simulations and a Lagrangian tracking approach were used to model respiratory airflows and aerosol dynamics. Respirations of tracer aerosols of 1 µm at a flow rate of 20 L/min were simulated, with the distributions of exhaled aerosols recorded on a filter at the mouth exit. Aerosol patterns were quantified with multiple analytical techniques such as concentration disparity, spatial scanning and fractal analysis. We demonstrated that a growing bronchial tumor induced notable variations in both the airflow and exhaled aerosol distribution. These variations became more apparent with increasing tumor severity. The exhaled aerosols exhibited distinctive pattern parameters such as spatial probability, fractal dimension, and multifractal spectrum. Results of this study show that morphometric measures of the exhaled aerosol pattern can be used to detect and monitor the pathological states of respiratory diseases in the upper airway. The proposed breath test also has the potential to locate the site of the disease, which is critical in developing a personalized, site-specific drug delivery protocol.
Keywords: Aerosol breath test, computer aided diagnosis, theranostics, aerosol fingerprint, fractal dimension, obstructive respiratory diseases.
Introduction
Lung cancer is the leading cause of cancer-related mortality worldwide, which exceeds the combined number of deaths from breast cancer, colon cancer, and prostate cancer [1]. Approximately six out of ten people with lung cancers die within one year of diagnosis, due in large part to the current inability to detect and treat the cancers at their early stages. The inaccessibility of deep lung to conventional therapy also complicates the treatment process. Current methods of diagnosing lung diseases include chest X-ray, sputum cytology, CT/PET/SPET, and lung tissue biopsy [2]. These procedures are accurate, but are costly and require professional operations. In addition, these procedures are either invasive in nature or having radiation risks. Recently, an alternative diagnostic method using a patient's exhaled breath has been under active studies. The rationale of this method is that exhaled breath contains unique volatile organic compounds (VOCs) if a carcinogenesis exists in the lung [3]. These unique VOCs can be considered as the “fingerprint” of the disease and used to determine the presence and type of the disease. For examples, non-small cell lung cancer is associated with a high production of isoprene [4], while asthma is associated with nitric oxide [5], cystic fibrosis with chemokines [6], and chronic obstructive pulmonary disease (COPD) with antioxidants [7]. Recent developments on the VOC breath tests and breath devices for lung cancer diagnosis were review in [8,9]. These VOC-based breath tests are promising to reliably detect lung carcinogenesis and are non-invasive in nature. However, such tests only measure the presence of certain VOCs, not the location these VOCs are generated (carcinogenesis site), nor the level of airway remodeling. The site and degree of airway remodeling can be substantially different depending on the type of lung cancers. Therefore, any alternative method of diagnosis that can locate the site and gage the severity of the disease in a non-invasive and low-cost way will be highly desirable.
A number of studies have explored the use of aerosols as a lung diagnostic tool, such as the aerosol bolus dispersion (ABD) method [10,11,12]. However, the ABD method provides no new information than traditional pulmonary function tests [12]. More recently, Xi et al. [13] proposed a new aerosol breath test that holds the potential to detect lung diseases and their locations. This method arises from consistent observations of unique exhaled aerosol patterns in relation to lung structures [14,15,16]. We hypothesize that each lung has a signature aerosol fingerprint (AFP) pattern, as opposed to the gas fingerprint for VOC-based breath tests. Accordingly, a deviation from the AFP pattern of healthy lungs will suggest an airway remodeling or tumorigeneisis in the tested lungs. For tumors that are large in size or in the upper airways, such deviations are largely differentiable by visual analysis; however, the process can be tedious if there are many images to analyze. Furthermore, when the tumor is small or located deeper in the lung, visual analysis may not be feasible and computer-aided image differentiation is needed.
In order to develop an automated pipeline to quantify exhaled AFP profiles, Xi et al. [17] explored multiple analytical approaches that yield a more compact measure of the particle distributions. It was shown that fractal analysis could effectively distinguish the AFP patterns of diseased lung models from healthy models [17]. The monofractal dimension represents the complexity of an image by quantifying how much space is filled by the particles, while the multifractal spectrum measures both the complexity and heterogeneity (e.g., the distribution of empty spaces surrounding the particles) [18]. Fractal analysis has been demonstrated to be a robust tool to measure subtle changes in biological morphology [19], vasculature [20], neural networks [21], metal structures [22], landscapes [23], and even the stock market [24]. It provides a simple model to describe complex systems with a minimal number of parameters (e.g., fractal dimension specifying the degree of irregularity or complexity). Human lungs are “space filling” fractal structures [25,26] with a fractal dimension of 1.57 [27,28]. Considering that tracer particles sequentially fill and empty the fractal lung, it is expected that exhaled aerosol profiles also exhibit fractal characteristics and are thus amenable to fractal analysis. Compared to monofractal dimensions, a multifractal spectrum reveals more information regarding the space filling properties of the image pixels at different scales and is more appropriate to differentiate exhaled aerosol profiles [29].
The methods of lung tumor diagnosis and treatment vary depending on the tumor's location. Such methods include surgery, radiation therapy, chemotherapy, etc. Knowing the location and size of a tumor will be highly advantageous for treatment planning. Additionally, precise drug delivery to a diseased region will enhance the therapeutic outcome and minimize the unwanted side-effects in other regions. Currently, such information (tumor location and size) can only be acquired using CT, PET, or MRI.
In this study, the feasibility of the newly developed CFD-Fractal approach to measure the presence and progress of lung diseases will be evaluated. We will do this by applying the CFD-Fractal approach in a lung model with a growing bronchial squamous tumor. The exhaled aerosol patterns will be acquired via physiology-based modeling, and will be further characterized using statistical and fractal analysis. Multiple features of the aerosol pattern will be examined in their relationship to the tumor growth, which includes particle concentration shifting, spatial distribution probability, mono-fractal dimension, and multifractal spectrum. These factors could be implemented to pinpoint the site a lung disease, gage the disease severity, and subsequently devise a treatment plan with targeted drug delivery and a severity-pertinent dosage. The proposed approach will set the stage for the development of a theranostic (therapeutic-diagnostic) system to diagnose and treat lung diseases.
Methods
Mouth-throat airway model with growing bronchial tumor
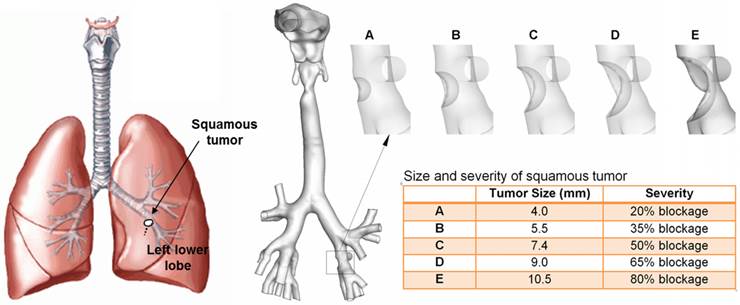
An anatomically accurate mouth-throat airway model developed by Xi and Longest [14] was used to study the tumor-AFP relationship. The airway model had a circular mouth opening with a diameter of 21 mm. The lung bifurcations extended up to G6 (Fig. 1). This model was originally based on MRI scans of a healthy adult male. Detailed dimensions of the airway geometry and procedures to develop this model was provided in Xi and Longest [14,30]. This model was designated as a healthy airway, and was further modified to generate diseased lung models with a growing squamous tumor. Squamous tumors grows from round cells, which replace damaged cells in the lung epithelium [31]. They may grow to large sizes and form cavities in the lungs. Squamous Tumors are often found in the conducting airways, either in major lobes or the main airway branches [31]. In this study, the squamous tumor is located at the left segmental branch and has five varying stages (Fig. 1). Detailed information regarding the location, size, and airway blockage rate of the squamous tumor is listed in Fig. 1.
Respiratory airway models with a squamous tumor on a left segmental bronchus. The bronchial tumor grows from a mild condition (stage A, 20% bronchial airway blockage) to a severe condition (stage E, 80% bronchial airway blockage).
Numerical breath test protocol
This study consisted of two steps: image acquisition via physiology-based simulation, and image analysis via statistical and fractal analysis. In order to acquire images of the exhaled aerosol fingerprints (AFPs), both inhalation and exhalation were simulated, with a bolus of tracer particles being inhaled first and then exhaled. A blunt profile was used for the inlet airflow velocity, which provided a smooth core-flow-wall transition [32]. The inlet particle profiles were generated using a stochastic algorithm and had the same initial velocity profile as the airflow [33]. For each airway-tumor model, five particle inlet profiles were tested for later statistical analysis. To model the inhalation process, zero pressure was specified at the mouth opening and negative pressure was specified at branch exits. Tracer particles entered the mouth and were then recorded on the surfaces of the branch exists. During exhalations, the recorded particle profiles at the branch exits were reversed in direction and the particles were tracked in the expiratory flows. The exhaled particles were deposited on a filter at the mouth opening.
In the second step, the collected aerosol profiles (or AFPs) were analyzed to determine any correlation with their perspective pathological conditions. The numerically predicted results were first visualized in terms of particle location distribution, particle concentration distribution, and relative concentration to the control case. The resulting images were then quantified using (1) statistical distribution in translational, radial, and circumferential directions to describe the spatial pattern of the AFPs, (2) regional and localized fractal analysis, and (3) multifractal analysis. The extracted features from the images will be used to classify the disease at different stages. The involved algorithms will be explained below.
Computational fluid-particle transport models
Isothermal and incompressible airflows were assumed for all simulations with steady breathing conditions. A large eddy simulation approach LES-WALE model was implemented to resolve the flow field; this model had been shown to be able to model laminar-to-turbulent transitions [34]. The transport and deposition of particles with a diameter (dp) were computed using the Lagrangian tracking approach [14]:
(1)
where ui is the fluid velocity, and vi is the particle velocity. The particle residence time τp is defined as ρp dp2/18μ, with μ being the air viscosity and dp being the particle diameter. The drag factor f was calculated following Morsi and Alexander [35], and the Cunningham factor Cc was calculated following Allen and Raabe [36]. In-house user-defined modules were implemented to consider the near-wall damping effect [30] and the finite particle inertial effect [37].
ANSYS ICEM CFD (Ansys, Inc) was used to generate the computational mesh. A grid independent study was undertaken using four different grid densities (i.e., 600k, 1.2 million, 2.0 million and 3.2 million elements); the height of the first-layer cells near the wall remain constant at 0.05 mm. The final mesh adopted contained 2 million cells.
Fractal analysis
One approach to fractal analysis is to calculate the fractal dimension using the Box-counting method. The Box-counting fractal dimension (DB) is a measure of increasing details with decreasing resolution scales. It is calculated as the slope of the log-log plot between the box size (or scale, ɛ) and box count Nɛ, which is the number of grid boxes containing pixels.
(2)
Besides DB, the multifractal spectrum is another powerful tool to study complex systems. The multifractal spectrum analysis relies on the fact that natural systems often possess a variety of scaling properties. To calculate the multifractal dimensions, a normalized measure µi(q, ɛ) was constructed with a family of scaling exponents, q, to explore different regions of the singularity measure [19],
(3)
Here Pi(ε) is the probability of pixels at the ith box with a size of ε, and Pi(ε)q raises the probability by an exponent q. The singularity strength α(q) and multifractal spectrum function f(α) with respect to µi(q,ε) were given by
(4)
(5)
The plot of α(q)~f(q) gave the multifractal spectrum of the image. An open source code ImageJ with FracLac plugin was used to calculate the multifractal parameters α(q) and f(q) [38].
Statistical analysis
Exhaled aerosol data were presented as mean ± standard deviation (SD) based on the five breath tests for each model. Data analysis was performed using the SAS statistical package (SAS Institute, Inc.). Analysis of variance (ANOVA) test was used to compare the difference in exhaled aerosol patterns of different models in terms of their fractal dimensions. A difference was considered statistically significant if p was < 0.05.
Results
Airflow field
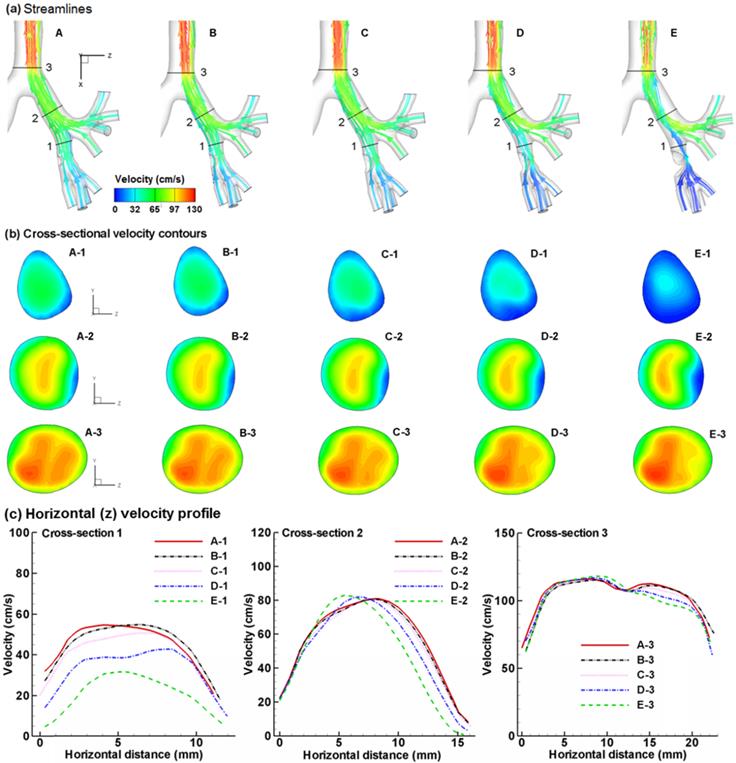
Figure 2 compares the expiratory airflows among the five cases in terms of streamlines, cross-sectional contours, and 2-D velocity plots. The presence of an airway obstruction substantially distorts the streamlines near the diseased site (Fig. 2a) as well as the velocity distributions (Fig. 2b). This flow disturbance will be conveyed further downstream by the expiratory flow. As the tumor grows from case A to E, higher flow resistance is expected due to reduced flow area, which leads to a lower respiratory flow rate under the same breathing effort. Furthermore, the airway obstruction prevents respiratory aerosols from being inhaled and exhaled smoothly, and thus will noticeably alter the distribution of exhaled aerosols. Fig. 2c shows the velocity distributions at Slice 1-1' among the five models in two different directions (a-a' and b-b'). As expected, flow velocity decreases progressively as the tumor size increases. The difference in airflows gradually diminishes as the air moves toward the mouth, with confluent flows from neighboring branches. It is noted that particle profiles depend on both local flows and upstream histories. The downstream airflows may appear similar; however, the particle profiles could still be different due to their time-integrative properties.
Comparison of expiratory flows among the five models with a growing bronchial tumor in terms of (a) streamlines, (b) cross-sectional velocity contours, and (c) horizontal velocity profile. The presence of a bronchial tumor disturbs the characteristics of the expiratory flows, with Case E having the most prominent effect. The flow disturbances propagate downstream and are still noticeable after the carina ridge (Slice 3). Different exhaled aerosol profiles are expected due to these flow disturbances.
Patterns of exhaled aerosol-fingerprints (AFPs)
The exhaled particles collect into a pattern that is unique to the lung structure and can be considered as the “fingerprint” of the lung. The first row of Fig. 3 displays particle distributions collected at the mouth for an aerosol size of 1 µm and a flow rate of 20 L/min. Considering the overall particle patterns, there are both similarities and disparities among these five cases, the latter of which is presumably attributed to the growth of the tumor. Among many pattern disparities, two observations in Fig. 3 (particle distribution, upper panel) are noteworthy. First, a vortex in the left lower part persists for all the five cases, while a weaker vortex in the right part progressively diminishes from Case A to E (upper panel Fig. 3). These two vortexes are asymmetric along the central line of the circle, which may result from the asymmetry of the right and left lungs. Second, there are noticeable variations of particle distributions in the two delineated regions (i.e., dashed red circle and box), as shown in Fig. 3. In both regions, the amount of particles decreases as the tumor size increases from case A to case E. Furthermore, the distribution of particles in the right-middle region (dashed red box) becomes increasingly dispersed from A to E.
Visual and quantitative comparison of exhaled aerosol fingerprints (AFPs) among the lung models with a growing bronchial tumor. The first row shows particle distributions collected at the mouth. The second row shows the particle concentration distributions, and the third shows the concentration differences relative to Case A.
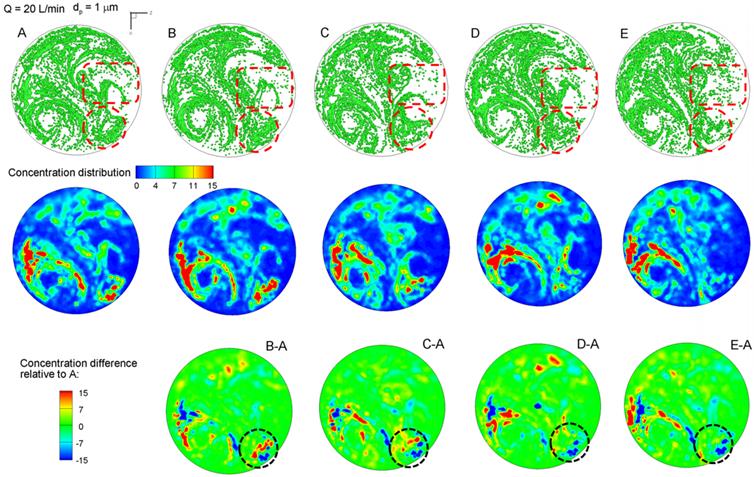
Particle distributions may not accurately represent their concentration due to particle overlapping. The relative concentrations of particles (i.e., the ratio of local particle concentration to the overall concentration) are shown in the second row of Fig. 3. Blue represents zero particle concentration and red represents high particle concentrations. For a given model, the particle (first row) and concentration (second row) distributions resemble each other in terms of the overall pattern. However, the concentration image is able to identify the peak particle accumulations (red color), which is otherwise unidentifiable in the particle distribution image. In this study, both the left vortex and the lower-right corner (red dashed circle) have high concentrations of particles. The left vortex is observed to remain consistent in its intensity for the five cases; however, the concentrations at lower-right corner decrease progressively from case A to case E. A similar decrease is also noted in the right-middle region, as indicated in the red dashed rectangle in Fig. 3a. These variations can be used as indicators for the growth of the bronchial tumor and will be analyzed in the following sections.
To highlight the variation of the aerosol fingerprints with increasing tumor size, concentrations relative to the baseline condition (Model A) are plotted in the third row of Fig. 3 by subtracting the concentration of Case A from Case B through E. In doing so, image A-A should have zero concentrations everywhere (not shown). The other four images (B-A, C-A, D-A, E-A) exhibit both positive (red) and negative values (blue), with blue representing the peak concentration of the control case and red representing the peak concentration of the tested case (Fig. 3). Therefore, if there are two adjacent spots having a similar pattern but opposite colors (blue vs. red), the migration between the two spots should be caused by the progression of the tumor. In turn, this migration could be used to either diagnose that disease or to monitor the variation/growth of the tumor. Considering the lower-right corner (dotted circle), the tumor growth caused the blue spots in the control case to shift upward and become less concentrated (lower panel in Fig. 3).
Spatial scanning of aerosol profiles
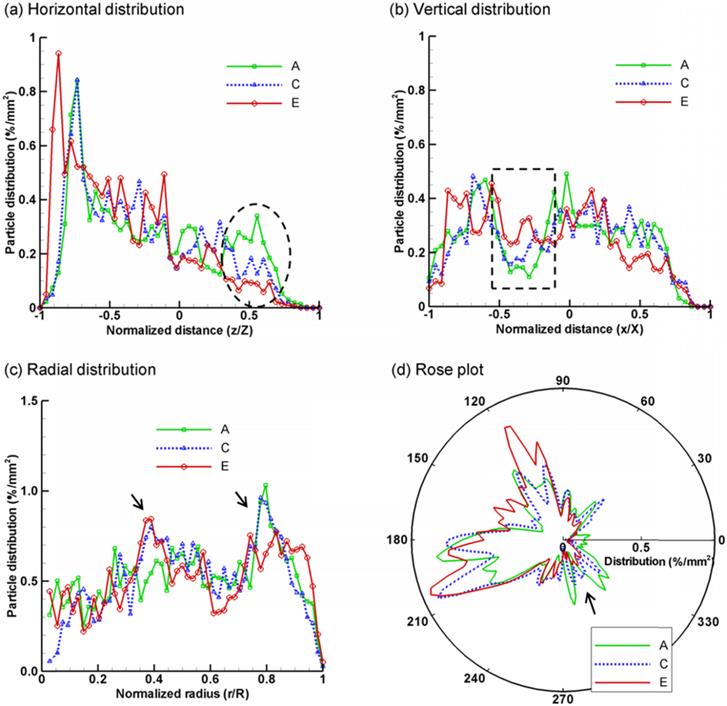
The exhaled aerosol profiles of the five cases were further compared using a variety of methods, including spatial scanning, fractal dimension, and multifractal analysis. Figure 4 shows the results of spatial scanning of AFP images in different directions (i.e., distribution probability). For example, the AFP image in Fig. 4a was evenly divided into 50 bins along the horizontal direction. The number of particles in each bin was counted and normalized by the total number of exhaled particles and the area of the bin, yielding a probability of particle distribution (%/mm2) at x/X. This approach was equivalent to scanning the AFP image in the x direction with a resolution of D/50, with D being the diameter of the image. In order to quantify the spatial characteristics of the exhaled particle patterns, the images were scanned in four directions: horizontal, vertical, radial, and circumferential (rose plot). To avoid figure overcrowding, only three (A, C, E) out of the five cases were presented in Fig. 4. Generally, each case exhibits a unique profile of spatial distributions and, therefore, is applicable to supplement the classification of airway anomalies. Furthermore, the profile variation among groups is more pronounced in certain areas than others; these more pronounced areas can be selected as regions of interest (ROI) for further analysis. Considering Figs. 4a and 4b, the profiles in the selected ranges (ellipse in Fig. 4a, and rectangle in Fig. 4b) appear to shift in an orderly manner with respect to the tumor size. These two ranges (i.e., z/Z and x/X) collectively identify an ROI in the image in the Cartesian coordinate system, which corresponds to the right-middle corner. As discussed in Fig. 3, the right-middle zone is one of the two ROIs identified with noticeable aerosol variations. Similar orderly variations at selected ranges are also noted in Figs. 4c and 4d, for instance, at r/R ≈ 0.4 and 0.8, and at θ ≈ 300o. These values correspond to the right-middle and lower-right regions in the polar coordinate system, respectively. Therefore, the spatial scanning of particle distributions appears to be an adequate index to compare the AFP images among different groups and identify possible ROIs in two mutually orthogonal directions.
Statistical analysis of exhaled particle distributions at different directions: (a) horizontal, (b) vertical, (c) radial, and (d) circumferential (rose plot). The patterns of exhaled particles among the lung models with a growing tumor can be distinguished by comparing the spatial distributions of particles in two mutually orthogonal directions.
Box-counting fractal and multifractal analysis
Box-counting fractal analysis of exhaled aerosols was conducted in both the entire sample image and the selected regions of interest (ROI). The FD standard deviation for each case was calculated from five test cases with stochastically generated inlet particle profiles (n = 5). Significance was indicated by * (p < 0.05) and ** (p < 0.01). Considering the entire image in Fig. 5a, the FD values change erratically, and a consistent variation of the FD with growing tumor sizes has not been found. In contrast, there is a consistent decline in FD with increasing tumor sizes for the two selected regions of interest (ROI_1 and ROI_2). This observation corroborates the prior report that diseased lungs have decreased FD values compared to FD values in healthy controls [39]. In contrast to the insignificant variations of FD for the entire area, the FD values vary significantly among the five cases in the two selected ROIs. Specifically, the FD variation of Case E differs most significantly (P < 0.01) from the control case (Case A). As a result, the ROI-based FD appears to be a sensitive index to measure tumor severity and monitor tumor progression. In order to further characterize these APF images, each image was divided into a 6×6 lattice, and the FD value on each grid was calculated and displayed in Fig. 5b. For each grid, the color code was based on the FD magnitude. Again, the color patterns for the five models are different from each other, and are unique to each tumor stage.
Box-counting fractal analysis of exhaled particle distributions at different scales. FDs (±SD, n = 5) for the five lung models with a growing tumor are shown in (a) for the entire image and selected region of interest (ROI). (b) shows the local FD distribution on a 6×6 lattice. The color code is based on the magnitude of the lattice fractal dimension. The color pattern is unique for each stage.
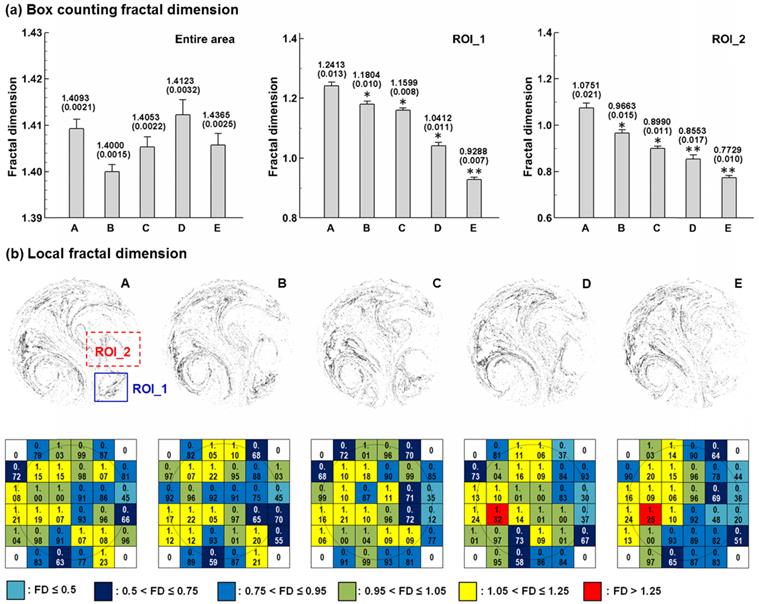
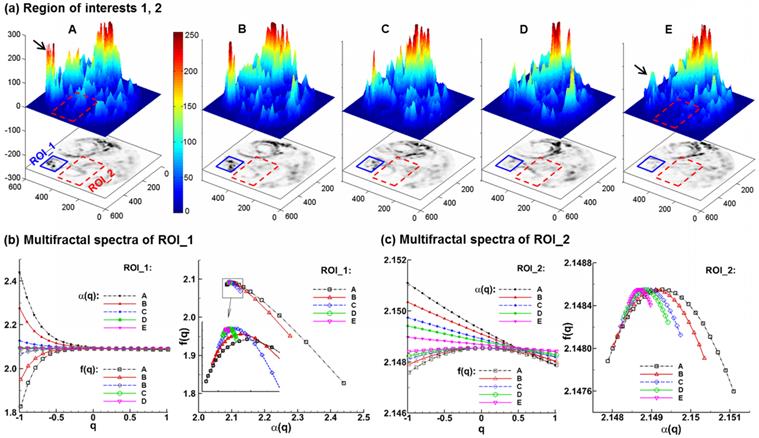
Figure 6 shows the 3-D plots and the multifractal spectra for the exhaled AFP images from the five lung models considered. The 3-D plots of exhaled aerosol concentrations exhibit distinct patterns among the five models (Fig. 6a), and have two interesting observations. First, the peaks in the left corner (solid black arrow) progressively decrease in height as the tumor size increases from case A to E. Second, the left-middle portion (red rectangle) becomes less condensed and more homogenous from Case A to E. These two regions were selected as the regions of interest in this study for both box-counting and multifractal analysis (Figs. 5 &. 6). A range of (-1,1) of the exponent q was used to scale the probability of particle distributions. Overall, the multifractal spectra among the five cases show distinctly different shape and symmetry in both ROIs considered (Figs. 6b & 6c), lending further evidence that multifractal spectra can be used to classify the structure-induced aerosol variations. However, the multifractal spectra are quite different between these two ROIs. As shown in Figs. 6b vs. 6c, the f(α)-spectra of ROI_1 converge to a single point (q= 0), while the f(α)-spectra of ROI_2 are more symmetric. In this case, the ROI_2 is considered to be multifractal, while the ROI_1 is mono- or non-fractal. Furthermore, the difference (αmax - αmin) indicates the heterogeneity of the image pattern. As the tumor grows from size A to E, this difference persistently decreases for both ROIs considered, suggesting a reduction of heterogeneity with disease. This observation coincides with findings in previous studies [20,40] that a pattern with a narrower range of α generally has lower lacunarity, which is another index of the pattern heterogeneity. Examples of such patterns include soils with low porosity [40] and vascular beds with lower emptiness [20].
Multifractal analysis of exhaled particle concentrations. The 3-D plots of particle concentrations are shown in (a). Comparison of the multifractal spectra among the five models are shown in (b) for the first region of interest (ROI_1) and (c) for the second region of interest (ROI_2).
Discussion
This study described an alternative method for diagnosis of obstructive lung diseases based on exhaled aerosols. The performance of this method was numerically evaluated using a coupled CFD-fractal approach for a growing bronchial tumor, whose exhaled aerosols exhibited distinctive patterns. The extracted features of the exhaled aerosol patterns in this study could be further used for automated classification of obstructive lung diseases.
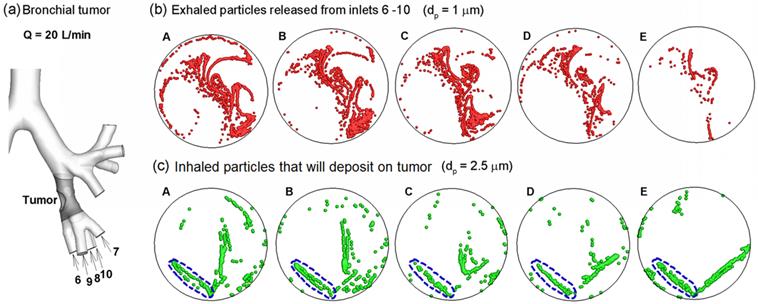
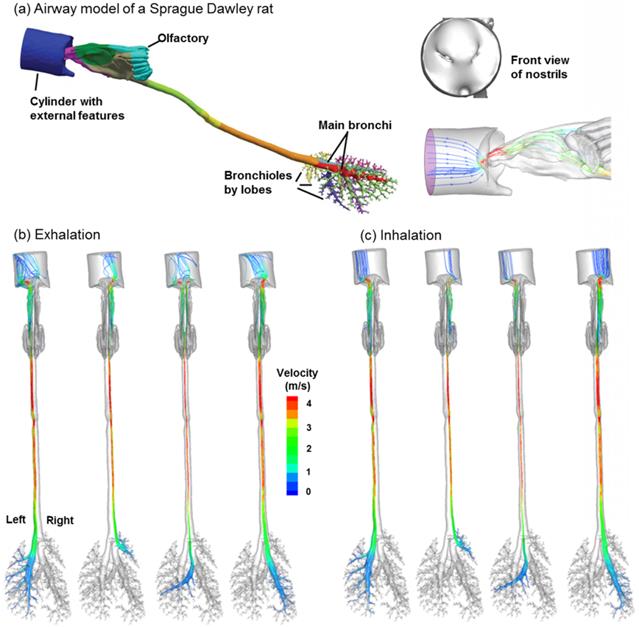
One highly desirable advantage of the proposed methodology in this study is its potential to identify the location of a lung tumor. This methodology has two steps: (a) disease detection, and (b) disease localization with selectively released aerosols. The AFP pattern varies at different disease stages. Hence, one can compare two AFP patterns acquired at different times and determine whether any airway structure change is present or not. After such a change is detected, aerosols will be selectively released that target only the suspected region to probe its condition [41]. Such aerosols (we term them as detective aerosols) can be chemical-sensitive, which change color when coming into contact with the signature VOCs of the disease. Due to selective particle releasing, a much higher concentration of detective aerosols reaches the disease site and is expected to collect sufficient clues to determine the presence and satge of small airway diseases. Furthermore, if there are high concentrations of detective aerosols that have changed color, it is considered that these aerosols have been delegated to the correct location, and the suspected disease location is verified. To demonstrate this method, we release particles only from the tumor-affected bronchioles (bronchioles 5-9 in Fig. 7a) and plot the exhaled particle profiles in Fig. 7b. It is observed that these profiles are distinct from one other, and at the same time, share certain common features. The differences indicate the stage of the tumor, while the common features reveal the location and type of the tumor. With increasing airway obstruction, the amount of red particles exhaled decreases dramatically from Case A to E. In the extremely obstructive scenario (Case E, 80% constriction), very few particles were exhaled. Since the amount of exhaled particles reflected the airway constriction level, they could be used to monitor the growth or metastasis of the tumor by comparing exhaled fingerprints collected at different periods. On the other hand, particles from the tumor-affected region deposit primarily in one specific region (the diagonal of the circle) even for different tumor sizes. This specific region (a common feature among groups) can be regarded as the signature of the lower-left lobe region and used to locate the tumor. This principle is exemplified in a nose-lung model of a Sprague Dawley rat [42] that retains up to 28 bifurcation generations and 1,272 outlets (Fig. 8a). The respiratory flow rate is 434 ml/min. For both inhalations and exhalations, ventilations to different lobes (i.e., left, right caudal, accessory, and right upper lobes) are associated with specific zones at the cylinder inlet (Figs. 8b and 8c). Furthermore, these zones are apparently different among the four lobes, indicating that a strong correlation exists between lobar ventilations and inlet airflow zones. From Fig. 8b, airflows from the left lobe (first panel) are exhaled to the environment at the left side of the cylinder; in contrast, airflows from the right upper lobe (second panel) exits at the right side of the cylinder, and airflows from the accessory lobe (third panel) exits at the middle of the cylinder. If aerosols are also exhaled, the distributions of collected particles at the cylinder can be used to find which lobe these particles come from; in addition, variations of the exhaled aerosol distributions from one lobe at different times can be used to monitor the health condition of that lobe.
Aerosol-fingerprint concept for non-invasive diagnosis and target-treatment of respiratory obstructive diseases. (a) shows the location of the bronchial tumor and affected bronchioles (6 - 10). (b): the exhaled particles from the affected bronchioles (6 - 10) collect into a unique pattern at the mouth for each of the five cases considered, and can be used to locate the position and evaluate the severity of lung disease. (c) shows the initial release positions of the particles that deposit around the tumor (gray region in (a)). Releasing therapeutic particles from these positions (blue dashed ellipse) will deliver them directly to the tumor, thereby realizing target drug delivery.
Ventilation to each lobe is correlated with airflow from specific locations at the inlet in a (a) Sprague Dawley rat model for both (b) exhalation and (c) inhalation breathing conditions. The respiratory flow rate is 434 ml/min. The lobes considered, from the left to right, are the left, right caudal, accessory, and right upper lobes, respectively.
Once the tumor location and severity were diagnosed, a personalized treatment plan can be developed that target drug particles at the tumor with a dosage pertinnet to the type and severity of the tumor. To show this clinical potential, we plot the release positions of inhaled particles that will deposit onto the tumor located at the left segmental bronchus (Fig. 7a). The particle size considered here is 2.5 µm, which is typical of pulmonary medicines. These release positions are obtained by first releasing particles non-selectively into the entire mouth, identifying all particles that deposit on the ROI, and then finding the release locations of these particles at the mouth inlet. In this example, we delineate one drug release zone (dashed blue ellipse) that potentially delivers all administrated drugs to the tumor for the five cases (Figs. 7c). In principle, if therapeutic agents are released only from this zone, all particles should deposit onto the disease site, thereby realizing precise drug delivery [33,41,43]. This principle is also supported by our numerical experiments in the rat model, where inhaled air from a pre-specified region at the inlet will be ventilated to a different lobe (Fig. 8c). If the principle were proved feasible, a combined theronostic device could be developed with functions of both lung diagnosis and targeted pulmonary drug delivery.
Other advantages of the proposed breath test include non-invasiveness, real-time diagnosis feedback, easy-of-use, and low cost for lung disease patients. This breath test is particularly suitable for screening respiratory diseases in those with high levels of occupational exposures, such as coal-mine workers. Considering the advantages of being low-cost and easy-to-perform, the risk-prone population can conduct the test more frequently to reduce the risk of respiratory diseases. Regular tests will develop a record of the patient's lung health. Disease localization with the selective aerosol release approach will help to pinpoint a disease site and develop a patient-specific treatment plan, such as targeted pulmonary drug delivery.
We anticipate that this new breath test will work best for lung abnormalities where the airway obstruction is not small, and will be suitable for diagnosis and treatment of diseases such as COPD, asthma, and non-small-cell lung cancer. The bronchial squamous tumor considered in this study obstructs the air inhalation to the lower-left lobe in a wide range from 20% to 80%, and could be a representative case of acute or chronical obstructive respiratory diseases. The magnitude of structural variations considered in this study (Fig. 1) was also typical and represented a fitting assessment of the performance of the proposed AFP-based breath test. In some COPD or asthmatic patients, airway constrictions could be much more severe than the scenarios considered in this study. Fatal asthma, for instance, can have 44% closure of the entire airway [39]. In this sense, a more pronounced variation of fractal measures is expected in clinical practices, which should be more feasible for diagnostic purposes using the proposed methodology.
From Figs. 3-6, the exhaled AFPs and their morphometric measures vary remarkably with the size of the growing bronchial tumor. Moreover, the ROI-based mono-fractal dimensions and multifractal spectra are found to significantly correlate with the growing tumor. It is noted, however, that these correlations are highly nonlinear and ROI-dependent (Figs. 5 and 6). For a given exhaled aerosol pattern, it is not sufficient by itself to tell the tumor size or trace back to the tumor site. The eventual breath test must consist of two steps: (1) extraction of AFP image features, as presented in this study, and (2) classification of diseases based on the AFP images. To stage or localize a suspected lung disease, a database of image-diseases is required; a classification method (e.g., support vector machine classifier) will be trained to correlate the images with their respective diseases. In future studies, such a database and classifier will be developed and their diagnosis reliability will be tested.
Ideal breathing conditions have been assumed in assessing the proposed methodology feasibility, e.g.: same flow rates for all pathological lung models. A patient with respiratory distresses typically breathes differently. To reliably detect an airway abnormality, it is desirable that the exhaled AFP patterns remain similar over a certain range of breathing conditions. In practice, the respiration bias can be minimized by activating the exhalation sampling only when the patient breathes within the acceptable range. Future studies of respiration influences are needed, which will help to determine the detection sensitivity, the tolerance of breathing deviations, and the optimal breathing maneuvers for the breath test [44]. Other limitations include constant breathing, no hygroscopic growth, zero particle charges, non-compliant walls, and a small sample size. Previous studies have emphasized the influences of tidal breathing [45], hygroscopic growth [46,47], particle charge effects [48,49], dynamic glottis [50], and intersubjective variability [51,52] on the dynamics of respiratory aerosols. Each factor above affect the physical realism of the simulation results and should be considered in future studies. Concerning the sample size, tumor models considered hereof are from one healthy lung; a large cohort of lung models is needed to consider inter-subject variability. Future studies with more realistic physiological parameters, as well as complimentary in vitro and in vivo tests, are necessary to establish the clinical feasibility of this new theranostic protocol for respiratory obstructive diseases.
In summary, we numerically demonstrated the feasibility of a new breath test to diagnose obstructive lung diseases based on a coupled CFD-fractal analysis of exhaled aerosols. For an airway with a growing bronchial tumor, the proposed CFD-fractal method was shown to adequately quantify and differentiate the exhaled aerosol patterns. The CFD-fractal analysis provided a useful method in deciphering the complexity of exhaled fingerprints, and thus could be used to detect the presence of a disease, monitor its pathogenesis, or track the therapeutic outcomes of an intervention protocol.
Acknowledgements
Drs. Ernie Yoder of Medicine, Harold Bell of Respiratory Physiology, MingAn Yang of Mathematics, and Qi Liao of Computer Sciences, all at Central Michigan University, are gratefully acknowledged for their insightful suggestions to this study. Our thanks are also due to James Hasbany, Alexander Grabinski, and Zachary Firlit who helped review the manuscript.
Competing Interests
The authors have declared that no competing interest exists.
References
1. Jemal A, Bray F, Center MM, Ferlay J, Ward E. et al. Global cancer statistics. CA Cancer J Clin. 2011;61:69-90
2. Krause A. Diagnosis of interstitial Lung diseases. Z Rheumatol. 2012;71:542-543
3. Miekisch W, Schubert JK, Noeldge-Schomburg GFE. Diagnostic potential of breath analysis - focus on volatile organic compounds. Clin Chim Acta. 2004;347:25-39
4. Chan HP, Tran V, Lewis C, Thomas PS. Elevated Levels of Oxidative Stress Markers in Exhaled Breath Condensate. J Thorac Oncol. 2009;4:172-178
5. Kostikas K, Koutsokera A, Papiris S, Gourgoulianis KI, Loukides S. Exhaled breath condensate in patients with asthma: implications for application in clinical practice. Clin Exp Allergy. 2008;38:557-565
6. Colombo C, Faelli N, Tirelli AS, Fortunato F, Biffi A. et al. Analysis of inflammatory and immune response biomarkers in sputum and exhaled breath condensate by a multi-parametric biochip array in cystic fibrosis. Int J Immunopathol Pharmacol. 2011;24:423-432
7. Loukides S, Bakakos P, Kostikas K. Oxidative Stress in Patients with COPD. Curr Drug Targets. 2011;12:469-477
8. Horvath I, Lazar Z, Gyulai N, Kollai M, Losonczy G. Exhaled biomarkers in lung cancer. Eur Respir J. 2009;34:261-275
9. Phillips M, Cataneo RN, Cummin ARC, Gagliardi AJ, Gleeson K. et al. Detection of lung cancer with volatile markers in the breath. Chest. 2003;123:2115-2123
10. Blanchard JD. Aerosol bolus dispersion and aerosol-derived airway morphometry: Assessment of lung pathology and response to therapy 1. J Aerosol Med. 1996;9:183-205
11. Blanchard JD. Aerosol bolus dispersion and aerosol-derived airway morphometry: Assessment of lung pathology and response to therapy 2. J Aerosol Med. 1996;9:453-476
12. Anderson PJ, Dolovich MB. Aerosols as diagnostic tools. J Aerosol Med. 1994;7:77-88
13. Xi J, Kim J, Si XA, Zhou Y. Diagnosing obstructive respiratory diseases using exhaled aerosol fingerprints: A feasibility study. J Aerosol Sci. 2013;64:24-36
14. Xi J, Longest PW. Transport and deposition of micro-aerosols in realistic and simplified models of the oral airway. Ann Biomed Eng. 2007;35:560-581
15. Xi J, Longest PW. Characterization of Submicrometer Aerosol Deposition in Extrathoracic Airways during Nasal Exhalation. Aerosol Sci Technol. 2009;43:808-827
16. Xi J, Longest PW, Martonen TB. Effects of the laryngeal jet on nano- and microparticle transport and deposition in an approximate model of the upper tracheobronchial airways. J Appl Physiol. 2008;104:1761-1777
17. Xi J, Si XA, Kim J, Mckee E, Lin E-B. Exhaled Aerosol Pattern Discloses Lung Structural Abnormality: A Sensitivity Study Using Computational Modeling and Fractal Analysis. PLoS ONE. 2014;9:e104682
18. Fratini M, Poccia N, Ricci A, Campi G, Burghammer M. et al. Scale-free structural organization of oxygen interstitials in La2CuO4+y. Nature. 2010;466:841-844
19. Karperien A, Ahammer H, Jelinek HF. Quantitating the subtleties of microglial morphology with fractal analysis. Frontiers in Cellular Neuroscience. 2013;7:1-18
20. Gould DJ, Vadakkan TJ, PochÉ RA, Dickinson ME. Multifractal and Lacunarity Analysis of Microvascular Morphology and Remodeling. Microcirculation. 2011;18:136-151
21. Bassett DS, Greenfield DL, Meyer-Lindenberg A, Weinberger DR, Moore SW. et al. Efficient Physical Embedding of Topologically Complex Information Processing Networks in Brains and Computer Circuits. PLoS Comput Biol. 2010;6:e1000748
22. Xu Y, Qian C, Pan L, Wang B, Lou C. Comparing Monofractal and Multifractal Analysis of Corrosion Damage Evolution in Reinforcing Bars. PLoS ONE. 2012;7:e29956
23. Krummel JR, Gardner RH, Sugihara G, Oneill RV, Coleman PR. Landscape patterns in a disturbed nnvironment. Oikos. 1987;48:321-324
24. Grönlund A, Yi IG, Kim BJ. Fractal Profit Landscape of the Stock Market. PLoS ONE. 2012;7:e33960
25. Weibel ER, Gomez DM. Architecture of the human lung. Science. 1962;137:577-585
26. Wilson TA. Design of the Bronchial Tree. Nature. 1967;213:668-669
27. Horsfiled K. Diameters, generations, and orders of branches in the bronchial tree. J Appl Physiol. 1990;68:457-461
28. Canals M, Olivares R, Labra F, Novoa FF. Ontogenetic changes in the fractal geometry of the bronchial tree in Rattus norvegicus. Biol Res. 2000;33:31-35
29. Lopes R, Betrouni N. Fractal and multifractal analysis: A review. Med Image Anal. 2009;13:634-649
30. Xi J, Longest PW. Evaluation of a drift flux model for simulating submicrometer aerosol dynamics in human upper tracheobronchial airways. Ann Biomed Eng. 2008;36:1714-1734
31. Daisne JF, Duprez T, Weynand B, Lonneux M, Hamoir M. et al. Tumor volume in pharyngolaryngeal squamous cell carcinoma: Comparison at CT, MR imaging, and FDG PET and validation with surgical specimen. Radiology. 2004;233:93-100
32. Kim JW, Xi J, Si XA. Dynamic growth and deposition of hygroscopic aerosols in the nasal airway of a 5-year-old child. International Journal for Numerical Methods in Biomedical Engineering. 2013;29:17-39
33. Si XA, Xi J, Kim J, Zhou Y, Zhong H. Modeling of release position and ventilation effects on olfactory aerosol drug delivery. Respir Physiol Neurobiol. 2013;186:22-32
34. Nicoud F, Ducros F. Subgrid-scale stress modelling based on the square of the velocity gradient tensor. Flow Turbul Combust. 1999;62:183-200
35. Morsi SA, Alexander AJ. An investigation of particle trajectories in two-phase flow systems. J Fluid Mechanics. 1972;55(2):193-208
36. Allen MD, Raabe OG. Slip correction measurements of spherical solid aerosol particles in an improved Millikan apparatus. Aerosol Sci Technol. 1985;4:269-286
37. Longest PW, Xi J. Effectiveness of direct Lagrangian tracking models for simulating nanoparticle deposition in the upper airways. Aerosol Sci Technol. 2007;41:380-397
38. Fractal Dimension and Lacunarity. Karperien A. http://rsbweb.nih.gov/ij/plugins/fraclac/fraclac.html
39. Boser SR, Park H, Perry SF, Ménache MG, Green FHY. Fractal geometry of airway remodeling in human asthma. Am J Respir Crit Care Med. 2005;172:817-823
40. Posadas AND, Giménez D, Quiroz R, Protz R. Multifractal Characterization of Soil Pore Systems. Soil Sci Soc Am J. 2003;67:1361-1369
41. Kleinstreuer C, Zhang Z. Targeted drug aerosol deposition analysis for a four-generation lung airway model with hemispherical tumors. Journal Of Biomechanical Engineering-Transactions Of The Asme. 2003;125:197-206
42. Corley RA, Kabilan S, Kuprat AP, Carson JP, Minard KR. et al. Comparative Computational Modeling of Airflows and Vapor Dosimetry in the Respiratory Tracts of Rat, Monkey, and Human. Toxicol Sci. 2012;128:500-516
43. Xi J, Si X, Kim JW, Berlinski A. Simulation of airflow and aerosol deposition in the nasal cavity of a 5-year-old child. J Aerosol Sci. 2011;42:156-173
44. Li Z. Particle deposition in oral-tracheal airway models with very low inhalation profiles. J Bionic Eng. 2012;9:252-261
45. McRobbie DW, Pritchard SE. Studies of the human oropharyngeal airspaces using magnetic resonance imaging. III. The effects of device resistance with forced maneuver and tidal breathing on upper airway geometry. J Aerosol Med. 2005;18:325-336
46. Xi J, Kim J, Si XA, Zhou Y. Hygroscopic aerosol deposition in the human upper respiratory tract under various thermo-humidity conditions. J Environ Sci Heal A. 2013;48:1790-1805
47. Kim JW, Xi J, Si XA. Dynamic growth and deposition of hygroscopic aerosols in the nasal airway of a 5-year-old child. International journal for numerical methods in biomedical engineering. 2013;29:17-39
48. Xi J, Si XA, Gaide R. Electrophoretic Particle Guidance Significantly Enhances Olfactory Drug Delivery: A Feasibility Study. PLoS ONE. 2014;9:e86593
49. Xi J, Si X, Longest W. Electrostatic Charge Effects on Pharmaceutical Aerosol Deposition in Human Nasal-Laryngeal Airways. Pharmaceutics. 2014;6:26-35
50. Scheinherr A, Bailly L, Boiron O, Legou T, Giovanni A. et al. Glottal motion and its impact on the respiratory flow. Comput Methods Biomech Biomed Eng. 2012;15(Suppl 1):69-71
51. Xi J, Berlinski A, Zhou Y, Greenberg B, Ou X. Breathing resistance and ultrafine particle deposition in nasal-laryngeal airways of a newborn, an infant, a child, and an adult. Ann Biomed Eng. 2012;40:2579-2595
52. Choi J, Tawhai MH, Hoffman EA, Lin C-L. On intra- and intersubject variabilities of airflow in the human lungs. Phys Fluids. 2009;21:101901
Author contact
![]() Corresponding author: Dr. Jinxiang Xi, School of Engineering and Technology, Central Michigan University, 1200 South Franklin Street, Mount Pleasant, MI 48858. Phone: (989) 774-2456; Fax: (989) 774-4900; Email: xi1jedu
Corresponding author: Dr. Jinxiang Xi, School of Engineering and Technology, Central Michigan University, 1200 South Franklin Street, Mount Pleasant, MI 48858. Phone: (989) 774-2456; Fax: (989) 774-4900; Email: xi1jedu