Impact Factor
- Issue 12; 2026
- Issue 11; 2026
- Issue 10; 2026
- Issue 9; 2026
- Issue 8; 2026
- Volume 16; 2026
- Advance Articles
- Past Issues
- Cover Images
- Cover Suggestion
- Index & Coverage
- Special Issues
Introduction
Results and Discussion
Conclusions
Methods
Abbreviations
Supplementary Material
Acknowledgements
References
International Journal of Biological Sciences
International Journal of Medical Sciences
 Global reach, higher impact

Theranostics 2019; 9(21):6314-6333. doi:10.7150/thno.36252 This issue Cite
Research Paper
Biomineralization-inspired Crystallization of Manganese Oxide on Silk Fibroin Nanoparticles for in vivo MR/fluorescence Imaging-assisted Tri-modal Therapy of Cancer
Ruihao Yang1,2, Mengmeng Hou1,2, Ya Gao1,2, Shiyu Lu1, Lei Zhang3, Zhigang Xu1,2, Chang Ming Li1, Yuejun Kang1,2, ![]() , Peng Xue1,2,
, Peng Xue1,2, ![]()
1. Key Laboratory of Luminescent and Real-Time Analytical Chemistry (Southwest University), Ministry of Education, School of Materials and Energy, Southwest University, Chongqing 400715, China.
2. Chongqing Engineering Research Center for Micro-Nano Biomedical Materials and Devices, Southwest University, Chongqing 400715, China.
3. Institute of Sericulture and Systems Biology, Southwest University, Chongqing 400716, China.
Received 2019-5-2; Accepted 2019-7-25; Published 2019-8-14
Abstract

Regenerated silk fibroin (SF) is a type of natural biomacromolecules with outstanding biocompatibility and biodegradability. However, stimulus-responsive SF-based nanocomplex has seldom been reported for application in tumor diagnosis and therapy.
Methods: As a proof-of-concept study, a multifunctional SF@MnO2 nanoparticle-based platform was strategically synthesized using SF as a reductant and a template via a biomineralization-inspired crystallization process in an extremely facile way. Because of their mesoporous structure and abundant amino and carboxyl terminal residues, SF@MnO2 nanoparticles were co-loaded with a photodynamic agent indocyanine green (ICG) and a chemotherapeutic drug doxorubicin (DOX) to form a SF@MnO2/ICG/DOX (SMID) nanocomplex.
Results: The obtained product was highly reactive with endogenous hydrogen peroxide (H2O2) in tumor microenvironment, which was decomposed into O2 to enhance tumor-specific photodynamic therapy (PDT). Moreover, SMID nanocomplex produced a strong and stable photothermal effect upon near-infrared (NIR) irradiation for photothermal therapy (PTT) owing to the distinct photothermal response of SF@MnO2 and stably conjugated ICG. The concurrent NIR fluorescence and magnetic resonance (MR) imaging in vivo both indicated effective tumor-specific enrichment of SMID nanoparticles via enhanced permeability and retention (EPR) effect. Animal studies further verified that SMID nanoparticles remarkably improved tumor inhibitive efficacy through combination PTT/PDT/chemotherapy with minimal systemic toxicity or adverse effect.
Conclusion: This study demonstrated the promising potential of SF-based nanomaterial to address some of the key challenges in cancer therapy due to unfavorable tumor microenvironment for drug delivery.
Keywords: Silk fibroin, Tumor microenvironment, Combination therapy, MR/fluorescence imaging, Manganese Oxide.
Introduction
Nanoscale drug delivery systems (NDDS), aiming to deliver diagnostic or therapeutic agents into site of lesion while reducing systemic toxicity, have received increasing attention in the field of nanomedicine during the past few decades [1-4]. Particularly, imaging-guided theranostic platforms for simultaneous detection and eradication of tumors have become tremendously attractive owing to their efficacy, controllability and spatial selectivity [5-7]. As a typical carrier material, inorganic nanoparticles have been extensively exploited for imaging-guided therapy, including metal (Au), metal chalcogenide (Bi2Se3, WO2.9, CuS), semiconductor nanocrystals (quantum dots) and lanthanide-doped upconversion nanoparticles (UCNPs) [8-12]. However, it is very difficult to incorporate functional therapeutic molecules into these inorganic nanocarriers owing to the weak binding affinity or lack of active chemical ligands on the surface of carrier materials [13, 14], which is usually mitigated by sophisticated and costly synthetic procedures. Moreover, multiple stimuli-responsive drug-loaded nanoparticles are demanded to realize spatiotemporal control of drug release with higher tumor-targeting performance and ameliorated adverse effects to normal tissues [15, 16]. Therefore, a rapid and economical synthetic strategy is of great importance to develop drug-loaded inorganic nanoparticles as novel imaging contrast agents and multifunctional therapeutic drugs for cancer treatment, taking advantage of various exogenous or endogenous stimuli.
Regenerated silk fibroin (SF) is a natural protein originated from the cocoon of silkworm Bombyx mori, which contains both hydrophilic and hydrophobic domains with a large amount of reactive amino and carboxyl groups in SF peptide [17, 18]. Many biological and chemical modifications can be facilely implemented to conjugate functional components with the peptide, thereby introducing unique properties to the SF-based nanomaterials. Given the remarkable mechanical strength, biocompatibility, biodegradability and flexibility of peptide modification, SF-derived biomaterials have been widely applied in biomedical and pharmaceutical fields in forms of nanoparticles, films, scaffolds, hydrogels, fibers, et al [19-21]. In particular, SF-based nanoparticles have extremely low toxicity and definite metabolic pathways [22, 23]. Moreover, SF nanoparticles have a large specific surface area and can be homogeneously dispersed in aqueous media, acting as a template or a reducing agent for surface functionalization or catalytic reactions [24, 25]. Previous reports indicated that biomacromolecules were closely related to bioinspired mineralization process. For instance, the mineralization of CaCO3 can be induced and regulated by SF-based nanostructures through an oriented crystallization process [26, 27]. Therefore, controllable growth of inorganic substances on the skeleton of SF could be achieved by biomineralization-inspired metal reduction, rendering new possibilities of therapeutic-related functionalization of SF matrix. These characteristics are particularly attractive in drug delivery applications that are aimed to achieve efficient loading of multiple theranostic agents, controlled drug release responsive to disease-specific endogenous or exogenous stimuli, and combination multimodal therapeutics.
Tumor hypoxia is caused by the rapidly proliferating cancer cells enclosed in the distorted tumor vasculatures, which severely hinders the treatment efficacy of photodynamic therapy (PDT) owing to the insufficient oxygen supply in tumor microenvironment [28-30]. To date, various supplementary strategies have been applied to relieve tumor hypoxia and facilitate conventional PDT, such as by promoting intratumoral blood flow, delivering oxygen locally via tumor-targeted gas shuttles, or producing oxygen in situ from endogenous H2O2 that are catalyzed by natural or nano-enzymes [31-36]. Notably, MnO2 nanoparticles can induce enzymatic decomposition of H2O2 into water and oxygen, and thus may work as a critical mediator to reduce tumor hypoxia [34, 35]. Moreover, MnO2 can decompose in response to other tumor-specific environmental cues, such as glutathione (GSH) or local acidity, and the produced Mn2+ is an excellent contrast agent for T1-magnetic resonance (MR) imaging of tumoral tissues [37, 38]. In addition to tumor hypoxia, there are other challenges that restrain the efficacy of conventional PDT, such as inefficient accumulation or heterogeneous distribution of systemically injected photosensitizers in tumoral tissues [39]. Fortunately, based on the passive or active tumor-targeting property of nanocarriers, photosensitizers can be delivered on-target with enhanced permeation and bioavailability at tumor sites by regulating the size and surface charge of carriers [40-42]. Therefore, it is of significant interest to develop photosensitizer-loaded functional nanostructures responsive to tumor-specific microenvironment, aiming to realize highly efficient tumor accumulation and relieve tumor hypoxia for an enhanced PDT.
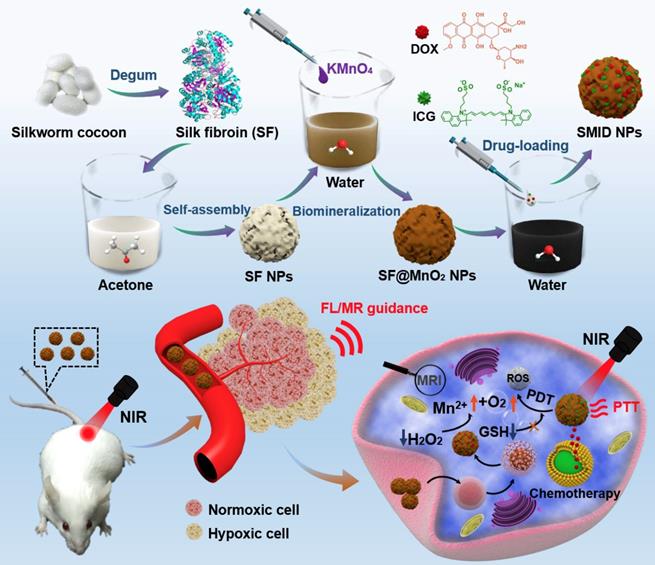
In this study, clinically approved photosensitizer indocyanine green (ICG) and chemotherapeutic drug doxorubicin (DOX) were co-immobilized into SF nanoparticles, where the particle surface was mineralized by MnO2 through a bioinspired crystallization process (Figure 1). As a proof-of-concept, we developed a novel strategy to engineer the SF@MnO2 nanoparticles in an extremely facile means based on one-pot fabrication technique, mimicking the disinfection process of KMnO4. SF nanoparticles served as a template as well as a reducing agent during the reduction process. Then, ICG was encapsulated into SF@MnO2 nanoparticles under the interaction between the pigment and side chains of amino acid residues in SF [43]. Meanwhile, DOX was loaded into SF@MnO2 nanoparticles through the active carboxyl group residues on SF to realize stimuli-responsive drug delivery [44]. Hypothetically, the obtained SF@MnO2/ICG/DOX (SMID) nanoparticles are able to accumulate in tumor region via the enhanced permeability and retention (EPR) effect after intravenous injection. After cell internalization through endocytosis, the MnO2 component can react with the prevalent cancer cell metabolite H2O2 and produce abundant O2 for PDT. The reaction product Mn2+ is a contrast agent for concurrent high performance T1-weighted MRI. The encapsulated ICG plays a dual role as a potent photosensitizer and a photothermal adjuvant to SF@MnO2-mediated hyperthermia in situ. Additionally, the highly fluorescent ICG molecules make it possible for fluorescence visualization of tumors in vivo [45, 46]. Finally, SMID-mediated DOX release is pH-dependent, which is favorable in the acidic tumor microenvironment. In this way, the multifunctional SMID nanoparticles may realize MR/fluorescence dual-modal imaging-guided combination PDT/PTT/chemotherapy. The physicochemical properties and anti-tumor performance of this theranostic nanoplatform was characterized and verified systematically in vitro using tumor cell lines and in vivo based on tumor-bearing mouse models.
Schematic of the synthetic procedure of SF@MnO2/ICG/DOX (SMID) nanoparticles as a multifunctional drug delivery platform for in vivo MR/fluorescence imaging-assisted tri-modal therapy of cancer.
Results and Discussion
Preparation and characterizations of SMID nanoparticles
The synthetic procedure of SMID nanoparticles is illustrated in Figure 1. Silk fibers (bave) comprise two individual SF filaments (brins) that are covered by a glue-like protein silk sericin. Silk sericin is believed to cause many problems, such as poor biocompatibility, hypersensitivity and inflammatory reactions, which is unacceptable for biomedical applications [47]. Therefore, flocculent SF proteins was usually isolated from natural bombyx mori cocoons by hydrolyzing the intermediate bonds of sericin in a standard degumming process (Figure S1). Subsequently, SF nanoparticles were prepared by organic solvent-induced self-assembly of SF chains. The attenuation of non-covalent interactions and cleavage of disulfide bonds usually result in unfolding of SF chains into a random coil/helix structure. In the presence of acetone, the conformation of SF chain changed from a linear structure to β-sheets, resulting in the self-assembly of SF into nanoparticles. SF@MnO2 nanoparticles were synthesized based on one-step bioinspired crystallization, mimicking the disinfection process using KMnO4. During this process, SF served as a reductant as well as a template, and the reduction product MnO2 was mineralized in situ following the redox reaction between KMnO4 and SF. Afterwards, ICG/DOX complex were conjugated with SF@MnO2 nanostructure through the interaction between the drug molecules and the active amino residuals on SF.
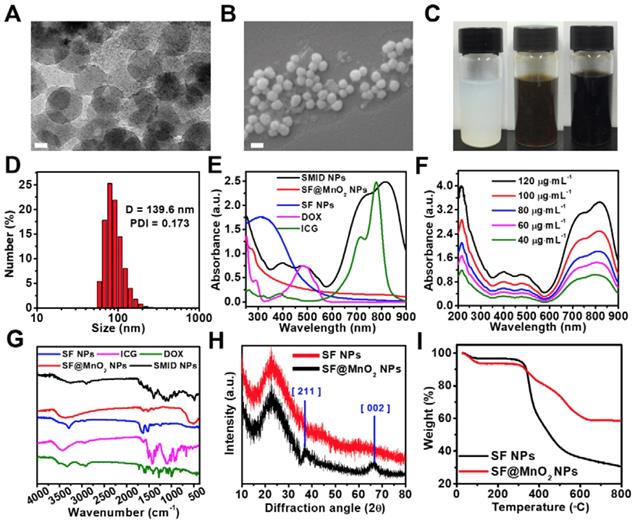
The morphology of as-prepared SF, SF@MnO2 and SMID nanoparticles was characterized by TEM and SEM. As shown in Figure S2A and S2c, the obtained SF nanoparticles exhibited a well-defined spheroid structure with an average size of 42.46 ± 7.91 nm. After in situ growth of MnO2, the diameter of nanoparticles increased to 61.9 ± 1.5 nm (Figure S2B and S2D). The final SMID nanoparticles exhibited a similar sphere-like shape with a diameter of 60.1 ± 2.8 nm (Figure 2A-B). Meanwhile, the hydrodynamic sizes and polydispersity index (PDI) of SF, SF@MnO2 and SMID nanoparticles were measured as 140.3 nm (PDI = 0.166), 201 nm (PDI = 0.207) and 139.6 nm (PDI = 0.173), respectively (Figure 2D, S3). Compared to the dehydrated size measured by TEM, a much greater hydrodynamic diameter as measured by DLS was attributed to the swelling of SF and potential clustering effect of nanoparticles in aqueous suspension [48, 49]. It was interesting that the hydrodynamic size of SMID nanoparticles became considerably smaller than that of bare carrier SF@MnO2 after drug loading. As reported previously, the cross-linking density of SF scaffold is inversely correlated to its degree of swelling [23]. Therefore, we speculate that the active carboxyl groups and side chains of amino acid residues in SF may interact with the primary amine and sulfonate groups in drug molecules during drug loading, resulting in a higher cross-linking density of SF matrix and hence the smaller hydrodynamic size of SMID nanoparticles. The decreased zeta potential of SMID nanoparticles after drug loading implied an enhanced colloidal stability, which could be attributed to the effective conjugation of positive charged ICG/DOX complex (Figure S4). The SMID nanoparticles showed negligible size variation for 7 days in PBS, DMEM or FBS (10%) solutions, indicating their long-term stability (Figure S5). Compared to the milk white color of SF nanoparticle dispersion, the vivid dark brown color of SF@MnO2 nanoparticle dispersion suggested the successful reduction of KMnO4 in situ (Figure 2C). Notably, the aqueous dispersion of SMID nanoparticles exhibited an aterrimus color.
Physicochemical characterizations of SMID nanoparticles: (A) TEM image of SMID nanoparticles (scale bar: 20 nm); (B) FESEM image of SMID nanoparticles (scale bar: 100 nm); (C) images of the aqueous dispersions of SF, SF@MnO2 and SMID nanoparticles (from left to right); (D) hydrodynamic size distribution of SMID nanoparticles measured by DLS; (E) UV-vis-NIR absorption spectra of ICG, DOX and the dispersions of SF, SF@MnO2 and SMID nanoparticles; (F) UV-vis-NIR absorption spectra of SMID nanoparticles under various concentrations; (G) FT-IR spectra of ICG, DOX and the dispersions of SF, SF@MnO2 and SMID nanoparticles; (H) XRD patterns of SF and SF@MnO2 nanoparticles; (I) TGA curves of SF and SF@MnO2 nanoparticles.
The Raman spectra of SF and SF@MnO2 were recorded to analyze their chemical compositions (Figure S6). Raman scattering bands at 1600-1700 cm-1 and 1200-1300 cm-1 respectively assigned to amide I and amide III were found in both SF and SF@MnO2 nanoparticles, indicating the existence of SF molecular structure [50]. However, SF@MnO2 also showed a characteristic broad peak in the range of 550-650 cm-1, corresponding to the symmetric (Mn-O) stretching vibration of MnO6 octahedra [51]. These results suggested that SF nanoparticles were partially oxidized during preparation of SF@MnO2 nanoparticles and crystalline MnO2 was formed on the SF substrate. To understand the underlying mechanism of the bioinspired mineralization of MnO2 on SF, the reaction time was extended to 1 h. The spherical structure of SF@MnO2 nanoparticles started to collapse or deform as compared to the products obtained previously after 15 min of reaction (Figure S7). After the reaction was further extended to 24 h, SF nanoparticles completely vanished while only single-crystal nanosheets of MnO2 could be observed (Figure S8). These findings suggested that SF was gradually consumed as a reductant when the reaction continued. In other words, higher amount of mineralized MnO2 in situ could unavoidably alter the sphere-like morphology of SF nanoparticles.
The UV-vis-NIR absorption spectrum of SMID nanoparticles was measured to analyze their formation (Figure 2E). Three characteristic peaks at ~488 nm, ~730 nm and ~820 nm indicated the successful loading of DOX and ICG into the SF@MnO2 matrix. In comparison with the characteristic absorbance peaks of free ICG at 710 nm and 785 nm, these redshifted peaks of ICG after drug loading could be ascribed to the formation of ICG dimers and oligomers, also reported as J-aggregates [52]. The resultant SMID nanoparticles exhibited strong light absorbing capability in NIR region with an absorbance intensity positively correlated to the sample concentration, implying a good potential as a PTT agent (Figure 2F). FT-IR spectrometry of the key components (DOX, ICG, SF and SF@MnO2 nanoparticles) were applied to confirm the composition of SMID nanoparticles. The peaks at 1651 cm-1 and 1511 cm-1 of SF were attributed to the amide I band and amide II band of protein, and the peak at 3289 cm-1 revealed the presence of abundant hydroxyl groups [53]. The peak at ~490 cm-1 of SF@MnO2 indicated a typical Mn-O bond vibrations in MnO2 [54]. Meanwhile, the broad peaks at 900-1100 cm-1 and 1400-1500 cm-1 of ICG molecules were ascribed to the vinyl stretches and C=C stretches, respectively [55]. Typical peaks of DOX were present at 3450 cm-1 and 3325 cm-1 owing to the stretching vibrations of N-H and O-H groups, respectively [56]. Therefore, the FT-IR spectrum of SMID nanoparticles included the characteristic peaks of all the building blocks, verifying the successful synthesis of final products. In contrast to SF nanoparticles, the XRD pattern of SF@MnO2 (Figure 2H) displayed two distinct peaks at 2θ = 36.64° and 65.52°, corresponding to the characteristic peaks of α-MnO2 (JCPDS card 44-0141). Additionally, high resolution TEM images of SF@MnO2 nanoparticles showed a lattice spacing of 0.24 nm, which agreed well with the (2 1 1) crystal planes of tetragonal MnO2 (Figure S9) [57]. Such interplanar spacing was in accordance with that measured from XRD pattern. The less weight loss of SF@MnO2 than SF nanoparticles at a terminal temperature of 800oC further demonstrated an effective MnO2 mineralization on the SF matrix (Figure 2I).
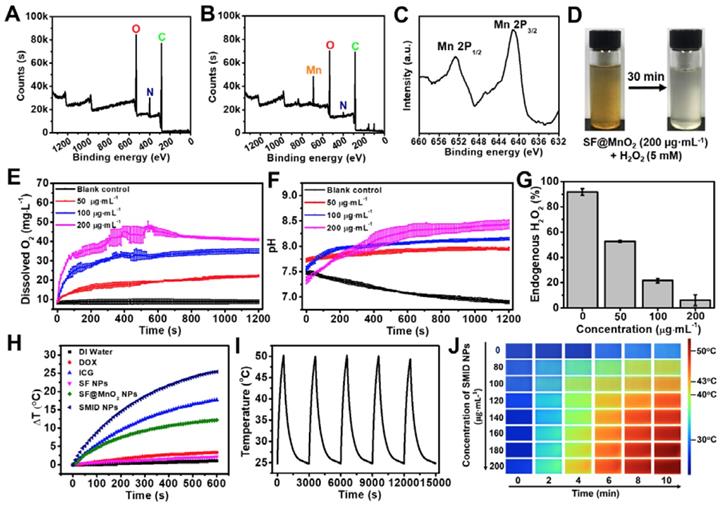
The valence states and chemical composition of SMID nanoparticles were further analyzed by XPS. Compared to the XPS spectrum of SF nanoparticles, a typical peak of Mn emerged and the signal intensity of N element decreased after bioinspired mineralization, clearly indicating a redox reaction between the oxidizing KMnO4 and the reducing amidogen group of protein (Figure 3A-B). More specifically, two peaks centered at 641.8 and 652.9 eV in the core level XPS spectrum could be assigned to Mn2p3/2 and Mn2p1/2 of MnO2, respectively (Figure 3C). There were several other minor peaks in the spectrum of SF@MnO2 at ~100 eV (Si2p), ~160 eV (S2p) and ~830 eV (unknown), which could be attributed to other externally introduced elements during sampling or reaction process. In contrast, these minor peaks were absent in SF spectrum probably due to the shielding effect of SF molecular structure, similar to the findings reported previously by Sim et al [58]. Moreover, energy dispersive spectroscopy (EDS) spectrum of SF@MnO2 nanoparticles further confirmed the existence of Mn element, demonstrating the successful deposition of MnO2 on SF (Figure S10) [59]. The BET surface area of SF@MnO2 nanoparticles was measured as 66.213 m2·g-1 with an average pore size of 2.054 nm (Figure S11). The highly porous structure of the obtained SF@MnO2 is highly advantageous for high-dosage drug loading.
XPS characterizations including full survey spectra of (A) SF and (B) SF@MnO2 nanoparticles, and a core level spectrum of (C) Mn2p; (D) images of the mixture of SF@MnO2 (200 µg·mL-1) and H2O2 (5 mM) before and after 30 min of incubation; (E) simultaneous O2 generation and (F) pH variation of H2O2 solution (1 mM) after adding SF@MnO2 nanoparticles with different concentrations; (G) quenching of endogenous level of H2O2 (1 mM) by SF@MnO2 nanoparticles with different concentrations for 20 min; (H) temperature elevation of the aqueous dispersions of various agents (equivalent ICG concentrations: 16 µg·mL-1); (I) temperature change of SMID nanoparticle dispersion (equivalent ICG concentrations: 16 µg·mL-1) under on/off laser irradiations for 5 cycles (laser on for 10 min per cycle); (J) thermographic images of the cuvettes containing SMID nanoparticle dispersion with various concentrations subject to laser irradiation for up to 10 min.
In vitro H2O2 decomposition capacity
MnO2 is known as an excellent inorganic catalyst that can trigger the decomposition of H2O2 into H2O and O2 to ameliorate the hypoxia and improve the treatment efficacy of PDT. The catalysis includes the following reactions.
2MnO2 + H2O2 = 2MnOOH + O2 (1)
2MnOOH + 4H+ + H2O2 = 2Mn2+ + 4H2O + O2 (2)
2MnOOH + 2H+ = MnO2 + Mn2+ + 2H2O (3)
We firstly evaluated the feasibility of whether SF@MnO2 nanoparticles could render O2 generation in vitro by reacting with H2O2. As shown in Figure 3D, a large number of tiny bubbles were clearly observed immediately after mixing of SF@MnO2 (200 µg·mL-1) and H2O2 (5 mM). Meanwhile, the color fading from brown to white implied the consumption of MnO2 during 30 min of catalytic reactions. Additionally, more rapid generation of O2 could be triggered by higher concentration of SF@MnO2 nanoparticles, and the amount of dissolved O2 also increased with longer reaction time (Figure 3E). It was noted that the dissolved O2 level reached saturation after about 10 min of reaction under the SMID concentration of 200 µg·mL-1. The pH values in various reaction systems were concurrently monitored (Figure 3F). The decreasing pH in the blank control group could be due to the electrolytic dissociation of H2O2. In contrast, pH value slightly increased in the groups treated with SMID nanoparticles, owing to the consumption of H+ ions and the production of the intermediate product MnOOH during the catalytic reactions [60]. In a quantitative study, SMID nanoparticles (200 µg·mL-1) were found to quench 85.7% of endogenous H2O2 (1 mM) in 20 min (Figure 3G). Alternatively, DCFH-DA assay also revealed a remarkable intracellular H2O2 consumption owing to the catalase-like activity of SF@MnO2 (SM) and SMI nanoparticles (Figure S12).
Photothermal effect and stability
The photothermal properties of SMID nanoparticles were evaluated by exposing the sample-laden cuvette (equivalent ICG concentration: 16 µg·mL-1) to an NIR laser (808 nm, 2 W·cm-2), and the temperature variation was monitored using a digital thermometer (Figure 3H). SF@MnO2 and ICG showed a temperature increase of 12.2oC and 17.7oC during 10 min of irradiation, respectively, which were considerably higher than the control groups of DI water, DOX and SF. The remarkable photothermal response of SF@MnO2 carrier suggested that it could serve as a novel PTT agent for tumor therapy. Meanwhile, the temperature elevation of SMID nanoparticles was 25.4oC, attributed to the additive photothermal effect of SF@MnO2 carrier and the photosensitizer ICG. Moreover, the temperature increase of the SMID dispersion was dependent on both agent concentration and laser output power density (Figure S13A-B), implying a good opportunity to modulate the photothermal performance of this nanoplatform by adjusting these two parameters accordingly. Under repetitive NIR irradiations, SMID nanoparticle dispersion showed a notable photostability with only 3.15% decrease in the peak temperature after five cycles of irradiation, which was much better than that of free ICG with 17.15% reduction in the peak temperature (Figure 3I, S13C). As reported in the literature, silk fibroin or serum albumin prevented the interaction between encapsulated ICG and the surrounding environment, thereby decreasing the decomposition while improving the photothermal and colloidal stability of ICG [43, 61]. Similarly, the SF@MnO2 carrier in the present study provided an effective shield to stabilize the encapsulated ICG molecules and also contributed to the strong photothermal response itself, resulting in a considerably high photothermal conversion efficiency (η) of 35.65% (Figure S14).
Stimuli-responsive drug release in vitro
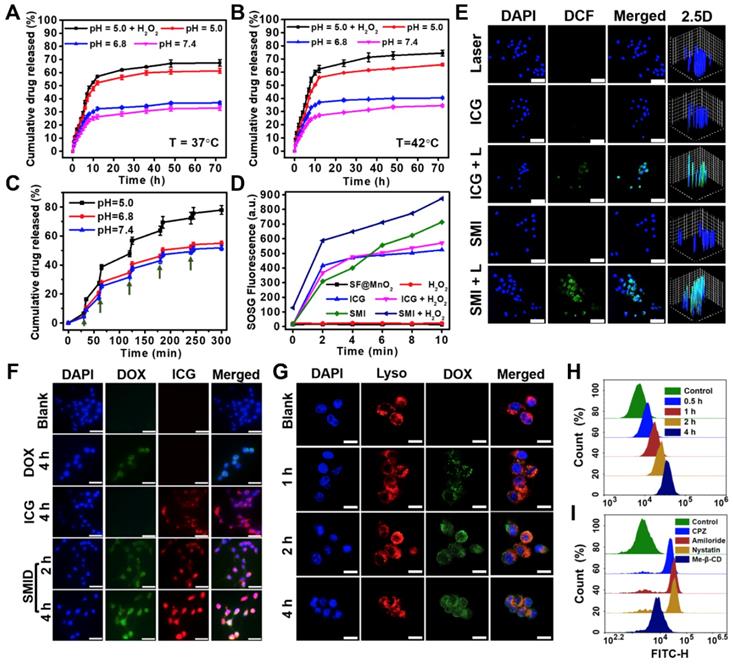
The drug loading performance of SF for DOX and ICG were investigated by mixing the SF nanoparticles and drug solutions at room temperature. A stable and homogeneously colored dispersion were obtained after centrifugation and washing for three times, suggesting the good affinity between the carrier and drugs (Figure S15). As revealed in a previous study, the coupling of DOX with ICG originates from the weak electrostatic interaction between the primary amine group in DOX and the sulfonate group in ICG during immobilization, which favors the high loading content on drug carriers [62]. To optimize the drug loading content (DLC) and encapsulation efficiency (EE) for both drugs, different mass ratios (2:1, 1:1 and 1:2) of DOX to ICG were assessed in the co-loading process. The highest EE for DOX and ICG were achieved as 96.13% and 90.75%, respectively, under the mass ratio of DOX: ICG = 1:1. The optimal DLC for DOX and ICG was obtained as 16.69% and 8.13%, respectively, under the same drug feeding ratio (Figure S16). DOX release kinetics of SMID nanoparticles was studied under the effects of different endogenous and exogenous stimuli, including pH, temperature and NIR laser irradiation. During 72 h of incubation at pH 7.4, only 32.9% and 34.6% of DOX were released from SMID nanoparticles at 37oC and 42oC, respectively, indicating a decent stability of drug encapsulation under the mimic physiological condition (Figure 4A-B). In contrast, accelerated DOX release occurred in acidic solution (pH = 6.8 and 5) at both temperatures, owing to the acid-triggered decomposition of MnO2 and protonation of amino group in DOX. Moreover, higher concentration of H2O2 induced a greater amount of DOX release from SMID nanoparticles, which could be due to the consumption of MnO2 and further exposure of more DOX molecules to the surrounding medium (Figure S17). Notably, the presence of H2O2 significantly accelerated drug release at pH 5.0, which could be ascribed to the expedited decomposition of MnO2 in the catalytic reactions as shown in formula (1)-(3). In addition, the drug release rate was slightly higher under 42oC than in 37oC, which was in accordance with a previous finding that temperature increase could induce the disruption of ICG/DOX complex and thus enhance the solubility of DOX [62]. Furthermore, the drug release showed a highly responsive behavior to NIR light exposures, which tremendously accelerated drug release in each of the pulsatile irradiation cycles (Figure 4C). These findings provided solid evidence that drug release from SMID nanoparticles could be precisely regulated by NIR irradiation and environmental acidity.
Release kinetics of DOX from SMID nanoparticles under various pH conditions at (A) 37oC, (B) 42oC or (C) 37oC with periodic laser irradiations (green arrows indicate the initiation of laser irradiation for 5 min; H2O2 concentration: 100 µM); (D) generation of 1O2 determined by SOSG fluorescence probe under NIR laser irradiation (808 nm, 2 W·cm-2) for 10 min (H2O2 concentration: 100 µM); (E) detection of intracellular ROS generation using DCFH-DA probe (FITC channel) after various treatments, where “L” stands for NIR irradiation for 10 min (scale bars: 50 µm); (F) fluorescence imaging of 4T1 cells after treatment with DOX (green), ICG (red) and SMID (equivalent ICG concentration: 10 μg·mL-1) for various period of time (scale bars: 25 µm); (G) confocal images showing the subcellular localization of SMID nanoparticles after various incubation time (red and green colors denote the fluorescence of lysosomes and DOX, respectively; scale bars: 25 µm); flow cytometry analysis of cellular uptake of SMID nanoparticles in 4T1 cells (H) after various co-incubation time or (I) treated with different endocytosis inhibitors for 4 h.
Enhanced ROS production
PDT depends on photosensitizers that convert oxygen from ground state (triplet state) to cytotoxic singlet oxygen (1O2) under light activation and thus induce apoptosis of cancer cells. Considering the capability of SF@MnO2 nanoparticles in producing O2 in the presence of H2O2 as shown above, we speculated that ICG-conjugated SF@MnO2 (SMI) could mediate an enhanced photodynamic yield of 1O2 in a tumor-specific H2O2-rich environment. Therefore, we measured the production of 1O2 mediated by SF@MnO2, ICG or SMI under laser irradiation (808 nm, 2 W·cm-2, 10 min) based on the recovered fluorescence of SOSG probe in the presence of 1O2 (Figure 4D). As expected, SMI nanoparticles exhibited much higher rate of 1O2 yield than free ICG, which could be due to the enhanced stability of ICG in form of J-aggregates after conjugation with nanocarriers. More importantly, significantly increased 1O2 production by SMI nanoparticles was observed in the presence of H2O2, following the MnO2-catalyzed O2 supply after H2O2 decomposition. SMI-mediated 1O2 yield was also evaluated using a DPBF probe, and the obtained results were similar to those using SOSG probe (Figure S18). Furthermore, intracellular 1O2 yield in situ induced by photosensitizers was analyzed using a DCFH-DA probe, which can be oxidized by ROS to generate DCF with green fluorescence (Figure 4E). There was no DCF fluorescence observed in the groups free from laser irradiation, indicating negligible ROS levels in their cytoplasm. Meanwhile, ICG- or SMI-treated groups showed clear fluorescence in DCF channel after NIR laser irradiation. Compared to the cells treated with free ICG, treatment with SMI nanoparticles induced a substantially higher ROS level, which agreed well with the above findings of 1O2 yield in solution (Figure 4D). Moreover, we demonstrated the intracellular yield of 1O2 using SOSG. As expected, the most outstanding 1O2 yield was found in the group of “SMI + H2O2” upon laser irradiation as proved by the strongest green fluorescence among all groups, which was due to the amelioration of hypoxia after SMI-mediated decomposition of H2O2 into O2 (Figure S19).
On the other hand, the higher GSH level in tumor cells relative to normal cells may result in partly consumption of ROS, compromising the treatment efficacy of PDT [38]. Meanwhile, the level of intracellular GSH can be reduced by MnO2 through a redox reaction [63], in which GSH is oxidized into glutathione disulfide (GSSG) via thiol-disulfide exchange while MnO2 is reduced to Mn2+ as specified in the following reaction.
MnO2 + 2 GSH + 2 H+ → Mn2+ + GSSG + 2 H2O (4)
As expected, SF@MnO2 nanoparticles exhibited a GSH depletion effect depending on the nanoparticle concentrations (Figure S20A). Further experiments on tumor cells also showed a similar capability of SF@MnO2 in depleting intracellular GSH (Figure S20B). Therefore, the GSH-induced consumption of ROS could be minimized by the SF@MnO2 carrier, while more ROS could be reserved to facilitate SMID-mediated PDT.
Cellular uptake
Cellular uptake of SMID nanoparticles was studied in vitro using fluorescence microscopy (Figure 4F). Firstly, 4T1 cells were incubated with DOX, ICG and SMID nanoparticles (equivalent ICG concentration: 10 μg·mL-1) for different periods of time. The cells incubated with SMID nanoparticles showed quite strong fluorescence signals from both DOX and ICG channels, whereas those treated with free drugs showed much lower fluorescence intensity most probably due to the limited cellular uptake efficiency. Cell internalization of SMID nanoparticles was visualized after staining with LysoTracker Red (Figure 4G). Initially, increasing DOX fluorescence in 4T1 cells showed gradual overlap with the signals of LysoTracker over the incubation time up to 2 h, suggesting the endocytosis of these nanoparticles transported by lysosomes. However, such fluorescence overlap became weakened after 4 h, implying that DOX was released and diffused from lysosomes to cytoplasm. Because lysosomes are membrane-bound acidic vesicles (pH: 4.5-5.0), DOX release could be accelerated in this acidic environment as demonstrated above in vitro (Figure 4A). Meanwhile, local H+ were consumed in the reactions with MnO2, which prevented further acidification of lysosomal vesicles while triggered ATPase-mediated influx of protons and counter ions, resulting in the osmotic swelling and rupture of lysosome membrane, or previously reported “proton-sponge” effect [64]. We used flow cytometry analysis to evaluate the nanoparticle uptake efficiency based on large cell populations. The increasing peak intensity of DOX fluorescence over time in single cells indicated the time-dependent cellular uptake of nanoparticles, which reached a remarkable cellular uptaking rate of 99.77% in 4 h (Figure 4H, S21). To further understand the specific endocytotic mechanism, 4T1 cells were subject to various endocytosis inhibitors during incubation with SMID nanoparticles. As displayed in Figure 4I, the cells pretreated with Me-β-CD (lipid-raft-mediated) exhibited the most significant suppression on the peak fluorescence intensity compared to those treated with other endocytosis inhibitors, including CPZ (clathrin-mediated), amiloride (macropinocytosis-mediated) and nystatin (caveolar-mediated). Moreover, cellular uptake of SMID nanoparticles was obviously suppressed at 4oC or in the presence of NaN3 (inhibitor of ATP hydrolase) as shown in Figure S22. Therefore, it could be inferred that cell internalization of SMID nanoparticles was an energy-dependent process via the lipid-raft-mediated endocytosis pathway.
In vitro cytotoxicity
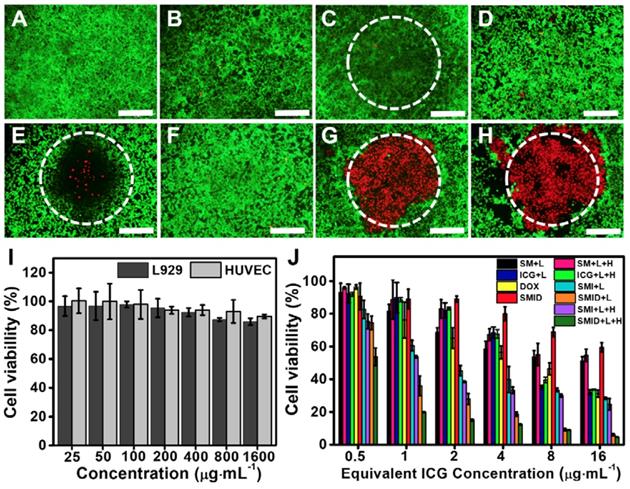
The biocompatibility of SF@MnO2 nanocarrier was investigated using human umbilical vein endothelial cells (HUVECs) and L929 mouse fibroblasts by standard MTT assays. The cell viability was found to remain above 80% after 24 h even under the carrier concentration as high as 1600 µg·mL-1, indicating the extremely low cytotoxicity of the material (Figure 5I). Next, we studied the anti-tumor effect in vitro under various treatment formulations using Live/Dead cell staining (Figure 5A-H). Compared to control groups, 4T1 cells treated with SMID nanoparticles followed by NIR irradiation effectively destructed the majority of tumor cells within the laser irradiation spot, showing a remarkable combination photo-/chemotherapeutic effect (Figure 5G). Addition of H2O2 as an adjuvant therapeutic further enhanced the tumor ablation effect, owing to the local production of O2 and subsequently higher photodynamic yield of cytotoxic 1O2 (Figure 5H). MTT assays revealed similar findings quantitatively, showing the impressive anti-tumor effect under the photo-induced treatment using SMID nanoparticles supplemented with H2O2 (Figure 5J). Additionally, reduction of cell viability was positively correlated to the applied drug dosage, with 95.2% of tumor cell death achieved at an equivalent ICG concentration of 16 µg·mL-1.
Fluorescence images of 4T1 cells stained by a Live/Dead viability/cytotoxicity kit after various treatments, including (A) blank control, (B) H2O2, (C) NIR laser, (D) DOX; (E) ICG plus laser, (F) SMID, (G) SMID plus laser, (H) SMID plus laser and H2O2 (equivalent ICG concentration: 16 µg·mL-1; H2O2: 100 µM; laser irradiation: 5 min). The dashed circles denote the laser irradiation spots (scale bars: 200 µm). The green and red dots represent live and dead cells, respectively. (I) Viability of HUVECs and L929 cells after treatment with SF@MnO2 nanoparticles at various concentrations for 24 h. (J) Viability of 4T1 cells after various treatments (“L” indicates the NIR laser irradiation for 5 min, “H” denotes H2O2 at 100 µM).
In vivo biodistribution
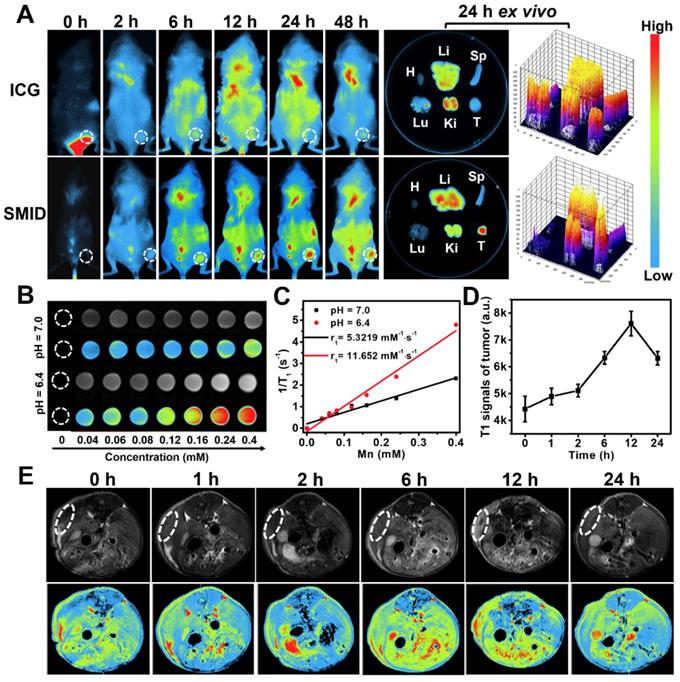
Biodistribution of therapeutics in vivo is important to evaluate the bioavailability of drugs at target lesion as well as the potential toxicity to normal tissues or organs. We traced the biodistributions of SMID nanoparticles after injection in tumor-bearing mice by NIR fluorescence imaging (Figure 6A). The fluorescence of ICG was widely distributed throughout the mouse body shortly after injection (<12 h). Then, the fluorescence intensity in tumor region gradually intensified (6-24 h) and peaked at 24 h in the SMID-treated group, implying the higher enrichment of nanoparticles in tumor via an EPR effect (Figure S23A). Meanwhile, free ICG did not show obvious accumulation at tumors in 48 h after injection. The ex vivo biodistribution of drugs was also examined by recording the fluorescence intensity of tumors and major organs dissected from euthanized mice at 24 h post-injection, which further verified the preferential enrichment of ICG at tumor site mediated by SMID nanoparticles. Moreover, strong fluorescence signals from mouse kidneys after injection of free ICG suggested a rapid renal excretion of this small molecule drug. More precisely, the quantitative biodistribution of Mn in mouse body was assessed using inductively coupled plasma atomic emission spectroscopy (ICP-AES) at 2, 8, 12, 24 and 48 h post-injection of SMID nanoparticles (Figure S23B). There was relatively higher accumulation of Mn in reticuloendothelial system, particularly in liver, and in renal system, suggesting the corresponding metabolic pathway for Mn excretion. It was worth noting that the highest Mn level in tumor region was detected as 11.9 % ID/g at 24 h post-injection, which was synchronous with the accumulation of ICG as revealed by fluorescence imaging.
(A) Biodistribution of SMID nanoparticles in vivo: fluorescence images of 4T1 tumor-bearing mice taken at different time points after intravenous injection of ICG or SMID nanoparticles (equivalent ICG concentration: 3 mg·kg-1), and ex vivo fluorescence images and corresponding optical intensity of tumor and major organs (T, Li, Sp, Ki, H, and Lu denote tumor, liver, spleen, kidney, heart, and lung, respectively) dissected at 24 h post-injection; (B) T1-weighted greyscale and pseudo-color MR images of SMID nanoparticle dispersions incubated for 12 h under different pH values (6.4 and 7.0); (C) T1 relaxation rates as a function of SMID nanoparticle concentration (transverse relativities r1 were 11.652 and 5.322 mM·s-1 for SMID nanoparticles at pH 6.4 and 7.0, respectively); (D) quantified MR signals in tumor region after intravenous injection of SMID nanoparticles corresponding to images in (E); (E) T1-weighted greyscale and pseudo-color MR images of 4T1 tumor-bearing mice (transverse plane sections) before and after intravenous injection of SMID nanoparticles (equivalent ICG concentration: 3 mg·kg-1). White dashed circles denote tumor locations.
MR/fluorescence bimodal imaging
It is well-known that Mn atoms in MnO2 nanoparticles are coordinated in octahedral geometry to six oxygen atoms and shielded from aqueous environment, while only ionic state of Mn2+ can easily access the surrounding water molecules to enhance water proton relaxation and improve MR imaging contrast. MnO2 nanoparticles are quite stable in physiological environment, while they decompose into Mn2+ and O2 under acidic pH condition. As discussed previously, MnO2 can also catalyze the decomposition of cancer cell metabolite H2O2, producing even more Mn2+. With five unpaired 3d electrons, Mn2+ is a popular T1-shorting agent for MR imaging. Therefore, we investigated the MR imaging performance of SMID nanoparticles dispersed in PBS solutions with different pH values (Figure 6B). A notable concentration-dependent brightening effect was found in the T1-weighed MR images of SMID nanoparticles under pH 6.4, whereas the MR signals under pH 7.0 appeared to be obviously weaker. Specifically, the r1 value of SMID nanoparticles under pH 6.4 was 11.652 mM·s-1, significantly higher than that of 5.322 mM·s-1 measured at pH 7.0 (Figure 6C). This r1 value was consistent with those reported in the literature for other Mn2+-doped nanoprobes.34 Furthermore, MR imaging on 4T1 tumor-bearing mice injected with SMID nanoparticles demonstrated enhanced imaging contrast at tumor site over 12 h (Figure 6D-E), which implied the tumor-specific accumulation of SMID nanoparticles and was generally consistent with the findings by fluorescence imaging in vivo (Figure 6A). On the other hand, the peaking of fluorescence intensity (at 24 h) and T1-MR signals (at 12 h) at tumor site were asynchronous, which could be due to the faster metabolism of Mn2+ than ICG. Nevertheless, these results verified our earlier hypothesis that SMID nanoparticles could be used as a self-traceable agent for fluorescence or MR imaging and detection of tumors, which may effectively aid the imaging-guided evaluation of therapeutic outcome and disease prognosis.
Anti-tumor effect in vivo
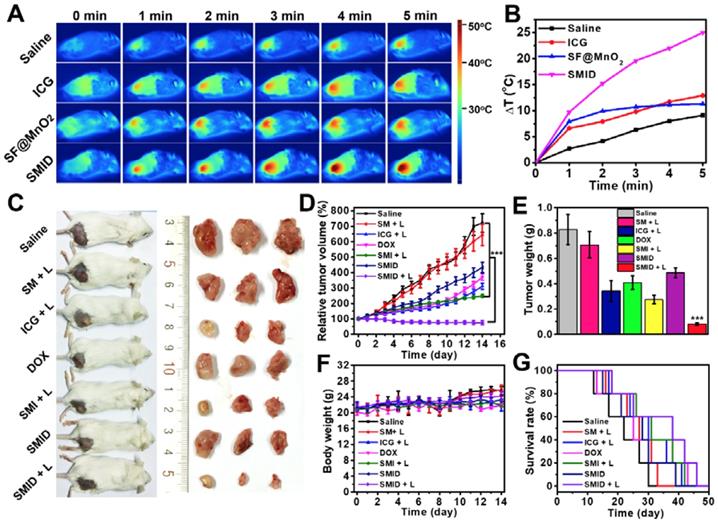
The efficacy of SMID nanoparticles for combination PTT/PDT/chemotherapy was evaluated in vivo using BALB/c mice bearing 4T1 tumors. At 24 h post-injection, the hyperthermic effect at tumor site was activated by a NIR laser and the temperature of mouse body shell was continuously monitored for 5 min during irradiation (Figure 7A-B). Although the injected SF@MnO2 or ICG produced some photothermal effect, the SMID-treated group exhibited the highest temperature elevation at tumor site (25oC) in the mice. This remarkable photothermal response in vivo was not only attributed to the combination effects of ICG and SF@MnO2, but also owing to the higher bioavailability of drug at tumor site as evidenced by MR/fluorescence bimodal imaging (Figure 6). Then, the tumor bearing mice were randomly assigned into six groups that were subject to different treatments, after which the tumor volumes in live mice were measured every day using a caliper (Figure 7D). Compared to the saline group with fast growing tumors, single-modal treatment with chemotherapeutics (DOX, SMID) or photodynamic therapeutics (ICG+L, SMI+L) showed a moderate tumor inhibition effect in 14 days. In contrast, SMID-mediated tri-modal combination therapy (SMID+L) achieved the most significant tumor suppression with a TGI of 89.6%, which was further verified by the smallest anatomical size and weight of the excised tumors among all groups at day 14 (Figure 7C and 7e). Additionally, there was no dramatic weight loss of mice in all treatment groups during 2 weeks of study, suggesting the low systemic toxicity or minimal side effects of the drug formulations (Figure 7F). The median life span of the mice subject to SMID-mediated tri-modal therapy reached 39 days, which was much longer than those in other treatment groups (Figure 7G).
In vivo anti-tumor effect in BALB/c mice bearing 4T1 tumors: (A) thermographic images of mouse body during NIR laser irradiation at tumor site for 5 min; (B) change of peak temperature at tumor site over time during NIR irradiation; (C) photographs of treated mice and the corresponding tumors excised at day 14 post-injection; (D) variation of relative tumor volume within 14 days after various treatments (***p<0.001 compared to any other group); (E) average weights of dissected tumors at day 14 (***p<0.001 compared to any other group); (F) variation of mouse body weight within 14 days after various treatments; (G) survival rates of mice subject to various treatments.
Histological analysis
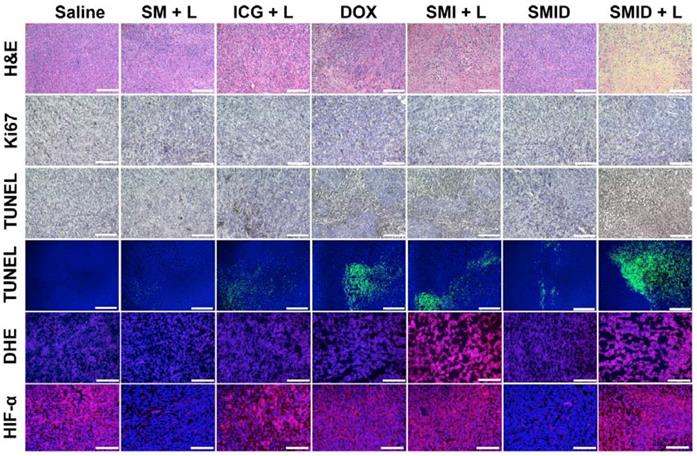
H&E staining, TUNEL assays, Ki67, DHE and HIF-α immunofluorescence staining of the excised tumor sections were subsequently performed to evaluate the tumor tissue destruction (Figure 8). The most severe tumor cell damages with predominant pyknosis, karyorrhexis and karyolysis was observed in the H&E stained slices of “SMID+L” group, whereas the tumor cells in other treatment groups generally retained their regular morphology with integrative membranes and nuclei. Similarly, the level of proliferating Ki67-positive tumor cells significantly decreased while the apoptotic TUNEL-positive tumor cells dramatically increased in the group of “SMID+L”, indicating a strong anti-tumor effect by induction of cell apoptosis and necrosis. Local ROS generation was verified by DHE staining, which can be oxidized into ethidium under oxidative stress. Then, ethidium can enter the cell nucleus and irreversibly bind with nucleic acids, exhibiting vivid red fluorescence. DHE immunofluorescence staining revealed a distinctly high level of local ROS produced by the ICG-mediated photodynamic process in the groups of “SMI+L” and “SMID+L”. To further confirm the capability of SMID nanoparticles to ameliorate hypoxia inside tumoral tissues, a hypoxyprobe (HIF-α) immunofluorescence assay was performed on tumor slices. Compared to other groups, the Nile red fluorescence was almost absent from the tumor slices in “SM+L” and “SMID” groups, indicating the improved local oxygenation level owing to MnO2-catalyzed conversion of endogenous H2O2 into oxygen. On the other hand, the produced oxygen was consumed during photodynamic therapy in laser-irradiated groups that contains ICG (SMI+L, SMID+L). Such critical change of oxygenation level in tumor microenvironment is particularly beneficial in decreasing the hypoxia‐associated photodynamic resistance during PDT. These histopathological studies verified the strong therapeutic efficacy of SMID-mediated combination PTT/PDT/chemotherapy against 4T1 solid tumors in vivo.
Histopathological analyses of excised tumor sections, including H&E staining, Ki67 staining, colorimetric TUNEL assays (bright field), fluorometric TUNEL assays (fluorescence field), DHE immunofluorescence staining and HIF-α immunofluorescence staining (scale bars: 100 µm).
Biosafety evaluation
To study the biosafety of NIR laser irradiation, mice bearing 4T1 tumors were randomly divided into two groups: (1) blank (without any treatment); (2) laser (subject to NIR laser irradiation on tumor region for 5 min). As shown in Figure S24A and S24F, no specific damage such as inflammation, necrosis or ulceration was observed in either tumor region or surrounding normal tissues after laser exposure. The histological sections of major organs did not show any abnormality and there was no irregular change in mouse body weight (Figure S24E-F), indicating acceptable biosafety of the applied NIR laser power (2 W·cm-2) for antitumor applications. Moreover, there was no significant difference in tumor growth rate between these two groups during 14 days post-administration, suggesting that exposure to NIR laser alone induced no obvious tumor suppression effect (Figure S24B-D). The potential toxicity of SMID nanoparticles was assessed in terms of hemocompatibility and histocompatibility. The percentage of hemolytic erythrocytes were generally less than 5% after 6 h of incubation with SMID nanoparticles under the concentration from 50 to 400 µg·mL-1 (Figure S25). Furthermore, the complete counts of key blood components and other principle hematology parameters of the treated mice were all within the reference ranges of healthy mice in two weeks after injection (Figure S26). For histological analysis, the major organs of treated mice were excised at day 14 and processed by H&E staining. The stained sections from the mice subject to different treatment formulations showed no obvious inflammation or lesions at cellular or tissue levels (Figure S27). These characterizations suggested that SMID nanoparticles posed minimal systemic toxicity or adverse effect for in vivo applications.
Conclusions
In summary, MnO2 was mineralized onto silk fibroin (SF) nanoparticles through a bioinspired crystallization process in an extremely facile way, taking advantage of the unique properties of SF as both a template and a reductant. The present study also demonstrated the strong and stable photothermal response of SF@MnO2 composite nanocarrier, which was loaded with ICG/DOX as a multifunctional theranostic platform (SMID) and realized potent combination PTT/PDT/chemotherapy under the guidance of fluorescence/MR imaging. This nanotherapeutic exhibited enhanced bioavailability at tumor site after intravenous administration and was responsive to various tumor-specific endogenous and exogenous stimuli. Particularly, MnO2-catalyzed decomposition of endogenous H2O2 into O2 relieved the hypoxia in tumor microenvironment and thus significantly enhanced the efficacy of PDT. Meanwhile, the produced Mn2+ considerably improved the T1-MR contrast of tumoral tissues, allowing the MRI-guided theranostics. Animal studies based on tumor-bearing mice confirmed the remarkable anti-tumor effect and biocompatibility of SMID nanoparticles in vivo. This SF@MnO2-based nanocarrier demonstrated a promising potential for integrating multi-modal theranostic agents for cancer therapy. For instance, targeting ligands such as antibodies, peptides, and small molecules (e.g. folate and iRGD) could be conjugated onto SF@MnO2 nanocarrier for targeted drug delivery in clinical applications. Of course, as many other nanotherapeutics, systematic pre-clinical and clinical investigations are necessary to fully understand the biosafety of SMID nanoparticles in large animals and human body. In addition, this strategy may also be generally extended to dope other metallic compounds on SF for various applications in the fields of biomedicine, catalysis and energy.
Methods
Materials
Bombyx mori cocoons were provided by the Institute of Sericulture and Systems Biology, Southwest University (China). Potassium Permanganate (KMnO4) was obtained from Chongqing Chuandong Chemical (group) Co., LTD (China). Fluorescein diacetate (FDA), formalin solution (neutral buffered, 10%), 1, 3-diphenyl-isobenzofuran (DPBF) were obtained from Sigma-Aldrich (USA). Doxorubicin (DOX) was purchased from Beijing Hvsf United Chemical materials Co., LTD (China). Hydrogen peroxide (H2O2, 30%), calcium chloride dehydrate (CaCl2·2H2O, >99%), hydrochloric acid (HCl, 37%), sodium hydroxide (NaOH, >97.0%), indocyanine green (ICG), thiazolyl blue tetrazolium bromide (MTT, 98%), glutathione (GSH), trichloroacetic acid (TCA), chlorpromazine (CPZ), nystatin, amiloride, methyl-beta-cyclodextrin (Me-β-CD) and dimethyl sulfoxide (DMSO) were obtained from Shanghai Aladdin Bio-Chem Technology Co., Ltd. (China). H2O2 quantitative assay kit was purchased from Sangon Biotech (Shanghai) Co., LTD (China). Dulbecco's modified eagle's medium (DMEM), TrypLETM Express enzyme, 4',6-Diamidino-2-Phenylindole (DAPI), fetal bovine serum (FBS), penicillin (10000 unit·mL-1)/streptomycin (10000 μg·mL-1), LIVE/DEAD® viability/cytotoxicity kit, LysoTracker Red DND-99, singlet oxygen sensor green (SOSG), 5,5'-dithiobis (2-nitrobenzoic acid) (DTNB) and phosphate buffered saline (PBS) were acquired from Thermo Fisher Scientific, Inc. (USA). 2', 7'-Dichlorofluorescein diacetate (DCFH-DA) was obtained from GEN-VIEW Scientific Inc. (USA). Rabbit Anti-HIF-1 Alpha antibody was purchased from Beijing Biosynthesis Biotechnology, LTD (China). TUNEL Apoptosis Assay Kit, Ki67 Cell Proliferation Kit and Proteinase K were purchased from Beyotime Biotechnology (China). KM mice and BALB/c mice models were purchased from Chongqing Teng Xin Bill Experimental Animal Sales Co. Ltd (China). Deionized (DI) water (18.2 MΩ·cm) was collected from a Milli-Q Synthesis A10 purification system (Molsheim, France).
Preparation of SF solution from Bombyx mori cocoons
SF solution was prepared according to a standard method as previously reported with further optimization [65, 66]. Briefly, Bombyx mori cocoons were stripped from the silkworm chrysalis and were subsequently sliced into thin pieces with 1~2 cm2 in size. Then, the cocoon slices were incubated with 0.5% Na2CO3 solution under the boiling state for 30 min to remove the gum-like silk sericin protein. The flocculent precipitation were thoroughly rinsed with DI water and dried in a drying cabinet at 35oC overnight. After degumming, the silk fibers were immersed in Ajisawa's reagent containing CaCl2, ethanol, and DI water (molar ratio at 1:2:8) for 2 h at 90oC. The impurities including small molecules and salts were eliminated from the silk solution by standard dialysis using Slide-a-Lyzer dialysis cassette (MWCO 3500, Pierce) for 3 days. The obtained regenerated SF solution was stored at 4 °C for further use.
Synthesis of SMID nanoparticles
The preparation of SF nanoparticles was based on a previously reported method with slight modifications [67, 68]. Briefly, regenerated SF solution (2.0 wt%) was rapidly introduced into acetone (1:9, v/v) under vigorous stirring at room temperature to obtain water-miscible acetone. The milk-like mixture was stirred for at least 8 h at room temperature to remove acetone, and the resulting SF nanoparticles were harvested after a desolvation process. The products were stored at 4oC and ready for use.
For bioinspired crystallization of MnO2 on the surface of SF nanoparticles, 1 mL of KMnO4 solution (5 mg·mL-1) was dropwise added into 20 mL of SF nanoparticle dispersion (500 μg·mL-1). Then, the mixed solution was stirred at room temperature for 15 min, followed by removing the unreacted KMnO4 by centrifugation. The precipitates were re-suspended in DI water, and SF@MnO2 nanoparticles were finally obtained after washing twice. For drug loading, ICG (6 mg) and DOX (6 mg) were firstly dissolved in 10 mL of DI water, which was stirred for 30 min under absolutely dark condition [68]. Afterwards, 20 mL of SF@MnO2 suspension (400 μg·mL-1) was introduced into the as-prepared drug mixture under stirring for 6 h. After high-speed centrifugation at 8,000 rpm for 5 min and washing for three times, SMID nanoparticles were obtained and re-dispersed in DI water before use.
Characterizations of SMID nanoparticles
The morphology of SMID nanoparticles and intermediate products of each synthetic step was recorded by both transmission electron microscopy (TEM, JEM-2100, JEOL, Japan) and field emission scanning electron microscopy (FESEM, JSM-7800F, JEOL, Japan). The hydrodynamic diameter and surface potential of various products were measured by dynamic light scattering (DLS) using Zetasizer (Nano ZS90, Malvern Instruments, UK). The UV-vis-NIR absorbance spectra were analyzed using a spectrometer (UV-1800, Shimadzu, Japan) and the fluorescence emission spectra were detected by a fluorescence spectrophotometer (RF-530l, Shimadzu, Japan). The Fourier transform infrared (FT-IR) spectra were measured using a FT-IR spectrophotometer (Nicolet 6700, Thermo Scientific, USA). The crystalline form and purity of the products were characterized using an X-ray diffractometer (XRD-7000, Shimadzu, Japan) with CuKα radiation (λ=1.5406 Å). The Raman spectra were recorded using LabRAM HR Evolution (HORIBA, Japan). The surface chemistry of SF nanoparticles before and after bioinspired mineralization was determined by X-ray photoelectron spectroscopy (XPS) using an X-ray photoelectron spectrometer (ESCALAB 250Xi, Thermo Fisher Scientific, USA). The amount of mineralized MnO2 was quantified based on thermogravimetric analysis (TGA) using a thermogravimetric analyzer (WRNK-529, Shanghai Automation Instrumentation, Co. Ltd, China). Nitrogen adsorption-desorption isotherms were measured to determine the Brunauer-Emmett-Teller (BET) surface areas and pore volumes using a Quantachrome Nova 1200e analyzer.
Drug loading efficiency and in vitro drug release
To determine the drug loading content (DLC) and encapsulation efficiency (EE), the optical spectra of supernatants collected after each washing step were measured using a Shimadzu UV-1800 spectrophotometer. The amount of ICG and DOX in the supernatants were determined according to the corresponding calibration curves (absorbance intensity vs. concentration) at 488 nm and 780 nm, respectively. Then, the DLC and EE for both drugs were calculated according to formulas (4) and (5), respectively.
(4)
(5)
where WFed drug is the initial amount of fed drug, WDrug in supernatant is the amount of drug in the supernatants after centrifugation, and WSMID NPs is the amount of as-synthesized SMID nanoparticles.
Drug release from SMID nanoparticles was evaluated under different pH or H2O2 conditions based on a traditional dialysis method in vitro [69]. Specifically, 2 mL of SMID nanoparticle dispersion (1.5 mg·mL-1) was loaded into each dialysis bag (MWCO = 3500) and then submerged into 78 mL of 1×PBS as releasing medium under different pH conditions (pH = 7.4, 6.8 or 5.0). H2O2 concentration was set as 100 μM to reflect the condition of tumor microenvironment in the H2O2 positive groups. The setup was placed in a shaker at a constant temperature of 37 °C or 43 °C under the dark condition. To monitor the release kinetics, 3 mL of releasing medium was sampled at predesigned time points, and fresh medium of equivalent volume was supplemented to the releasing system. To analyze the photothermal response of drug release, the dialysis bag was exposed to an NIR laser (808 nm, 2 W·cm-2) for several on/off cycles (5 min of irradiation per cycle). The amount of released drug was quantified according to a calibration curve measured by florescence spectroscopy (λex: 488 nm, λem: 560 nm).
Reactivity of SF@MnO2 nanoparticles to H2O2 in vitro
O2 generation from H2O2 catalyzed by SF@MnO2 nanoparticles was measured in a sealed chamber integrated with an oxygen probe using a portable digital LCD dissolved oxygen meter (JPB-607A, Shanghai INESA Scientific Instrument, Co. Ltd, China). Specifically, H2O2 (30 wt%) was diluted by deoxygenated water to 1 mM, and 2 mg of dried SF@MnO2 nanoparticles were redispersed in 1 mL of deoxygenated water. Then, SF@MnO2 nanoparticle dispersion were rapidly added into 20 mL of H2O2 diluent under stirring at room temperature. The dissolved O2 in H2O2 solution was recorded at the interval of 10 sec. To monitor the pH variation, a pH electrode was incorporated during the measurement using a pH meter (PHSJ-5, Shanghai INESA Scientific Instrument, Co. Ltd, China) while maintaining the same testing conditions as in the dissolved oxygen assay. To investigate the consumption of H2O2 solution, 1 mL of SF@MnO2 nanoparticle dispersion at various concentrations were incubated with 20 mL of H2O2 solution (1 mM) for 30 min. The percentage of unreacted H2O2 was quantified using a H2O2 quantitative assay kit (water-compatible) following the manufacturer's protocol.
Photothermal property of SMID nanoparticles in vitro
To investigate the NIR-light induced temperature elevation, 3 mL of sample solution was loaded in a transparent quartz vial and irradiated by a fiber-coupled semiconductor diode NIR laser (808 nm) at various output power density for 10 min. The temperature probe of a digital thermometer was immersed into the sample to record the local temperature at the time interval of 10 sec. The photothermal stability of SMID nanoparticles was analyzed through periodical on/off laser irradiation for 5 cycles. Briefly, the sample-laden cuvette was exposed to an NIR laser for 10 min, followed by cooling under room temperature prior to the next irradiation cycle. The NIR-light induced temperature variation of SMID nanoparticle dispersions at gradient concentrations was also imaged by color mapping using a thermal imaging camera (Fluke, TiS55).
Reactive oxygen species (ROS) yield of SMID nanoparticles
A fluorescence probe, DPBF, was used to detect reactive oxygen species (ROS) produced in photodynamic reaction in vitro. Briefly, 45 μL of DPBF (59.5 µM) acetonitrile dispersion was added into 3 mL of aqueous dispersion of ICG, SF@MnO2 nanoparticles or SMID nanoparticles (equivalent ICG concentration: 10 μg·mL-1) upon rigorous mixing. Then, the mixture was transferred into a cuvette (optical path: 1 cm), which was further irradiated by a NIR laser (808 nm, 2 W·cm-2) for 10 min. Thereafter, UV-vis absorption spectra of each sample was measured at different time points during laser exposure. The amount of ROS generation was positively correlated to the decreasing rate of optical absorbance intensity at 417 nm. Moreover, the ROS generation under laser irradiation with or without H2O2 solution (100 µM) was measured using an SOSG probe. Briefly, 3 µL of SOSG methanol solution (5 mM) was introduced into 3 mL of aqueous dispersion, which was further irradiated by an NIR laser for 10 min. After that, SOSG fluorescence (λex: 494 nm, λem: 532 nm) was measured to determine the generated 1O2.
Intracellular ROS generation was detected using DCFH-DA or SOSG probe following a standard protocol. Briefly, 4T1 tumor cells were seeded in a 12-well plate (1×10⁵ cells per well) and incubated for 12 h. Then, the cells were incubated with various agents for 4 h, followed by NIR laser irradiation (808 nm, 2 W·cm-2) for 10 min with or without H2O2 solution (100 µM). Next, the cells were stained with DCFH-DA (5 μg·mL-1) or SOSG (5 μg·mL-1) for 30 min and DAPI (1 µg·mL-1) for 10 min. After rinsing with 1×PBS for three times, fluorescence images of the cells were acquired by confocal laser scanning microscopy (CLSM, LSM800, Zeiss, Germany). DCFH-DA probe was also utilized to monitor the intracellular H2O2 consumption. Briefly, 4T1 cells were seeded in a 12-well plate (1×10⁵ cells per well) and incubated for 12 h. Then, the culture medium was replaced by DMEM containing 1mM H2O2, followed by another incubation for 4 h. Afterwards, cells were further treated by various agents (equivalent ICG concentration: 10 μg·mL-1) for 4 h, and were stained by DCFH-DA and DAPI for CLSM.
GSH consumption efficiency in vitro
GSH consumption efficiency was analyzed using standard Ellman reagent. Briefly, 40 mg DTNB were dissolved in 10 mL PBS (0.1 M) buffer solution containing 1 mM EDTA (pH = 8.0). 1 mL of SF@MnO2 nanoparticles at gradient concentration was allowed to react with 1 mL of GSH dispersion (0.2 mg·mL-1) at room temperature for 4 h. Then, 400 µL of the as-prepared DTNB solution was introduced into the above system. After incubation for 30 min, all the samples were added into a 96-well plate and the optical absorbance at 412 nm was measured using a microplate reader (Infinite M200 PRO, TECAN). To measure the SF@MnO2 activated intracellular GSH consumption, 4T1 tumor cells were firstly seeded in a 96-well plate (1×10⁴ cells per well) and incubated for 12 h. Then, the cells were incubated with gradient concentrations of SF@MnO2 nanoparticles for 4 h. Then, the cells were treated by 50 µL of 6.5% TCA solution at 4oC for 30 min. Finally, 250 µL of the Ellman reagent was introduced into each well. After the reaction under gent shaking for 10 min, optical absorbance of each well was similarly measured at 412 nm.
Biocompatibility evaluation of SMID nanoparticles in vitro
To assess the biocompatibility of SF@MnO2 nanocarriers, typical MTT cell viability assay was conducted on both humanized umbilical vein endothelial cells (HUVECs) and murine L929 fibrosarcoma cells (L929 cells) in vitro. Specifically, HUVECs and L929 cells at an initial seeding density of 1×10⁴ per well were cultured in a 96-well cell culture plate at 37oC overnight. Then, the cells were incubated with 200 μL of SF@MnO2 nanoparticles with gradient concentrations (25~1600 μg·mL-1) for 24 h. Afterwards, the supernatant was discarded, followed by adding 200 μL of MTT solution (250 μg·mL-1) into each well. After 6 h of incubation, 150 μL of DMSO was introduced to replace the previous supernatant, followed by gently shaking for 15 min. Finally, the optical absorbance intensity at 490 nm and 630 nm was measured using a microplate reader (SPARK 10M). The cell viability was calculated according to formula (6):
(6)
The hemolytic potential of SMID nanoparticles was assessed using the peripheral blood sampled from orbital venous plexus of KM mice. The whole blood was centrifuged at 3000 rpm for 5 min, and the precipitate of erythrocytes was rinsed with 1×PBS four times. Then, 0.5 mL of erythrocytes (4% v/v) was mixed with 0.5 mL of SMID nanoparticles dispersed in 1×PBS at gradient concentrations (50, 100, 200 and 400 µg·mL-1), followed by incubation at 37 °C for 6 h. Finally, all the specimens were centrifuged at 10,000 rpm for 10 min, and the absorbance intensity of supernatant at 570 nm was recorded using a UV-vis spectrophotometer (Shimadzu UV-1800, Japan).
Cellular uptake and internalization
Cellular uptake of SMID nanoparticles was investigated using flow cytometry. Briefly, 4T1 tumor cells with an initial seeding density of 7.5×10⁴ cells per well were incubated in a 24-well plate at 37 °C for 12 h. Then, fresh culture medium containing SMID nanoparticles (equivalent ICG concentration: 10 μg·mL-1) was introduced to replace the old medium, followed by further incubation for 0.5 h, 1 h, 2 h and 4 h. The untreated cells were cultured in parallel as blank control. Afterwards, the 4T1 cells were digested with TrypLE Express enzyme and resuspended in 400 µL of 1×PBS containing Ca2+ and Mg2+, and were analyzed using a flow cytometer (NovoCyte TM 2060R, ACEA Biosciences, USA). To explore the underlying mechanism of cellular uptake of SMID nanoparticles, 4T1 cells were pretreated by NaN3 (0.1%, w/v), Nystatin (50 μg·mL-1), amiloride (2 mM), CPZ (20 μg·mL-1) and Me-β-CD (0.5 mM), followed by incubation with SMID nanoparticles (equivalent ICG concentration: 10 μg·mL-1) at 37oC for 4 h. The cellular uptake efficiency under various conditions was analyzed similarly using flow cytometry.
For fluorescence imaging, 4T1 cells were treated with DOX, ICG and SMID nanoparticles (equivalent ICG concentration: 10 μg·mL-1) for various periods of time. Then, the cells were rinsed with 1×PBS for three times and stained with DAPI (1 µg·mL-1) for 5 min. After that, fluorescence images of the treated cells were captured using a fluorescence microscope (IX73, Olympus, Japan). To investigate the lysosomal co-localization and escape, 4T1 cells were seeded on a 35-mm Petri dish at a density of 3×10⁴ cells and incubated at 37oC. Upon reaching a culture confluency of 50%-70%, cells were further incubated with SMID nanoparticles (equivalent ICG concentration: 10 μg·mL-1) for various periods of time. Then, the cells were stained with DAPI (1 µg·mL-1) for 5 min and Lyso Tracker Red DND-99 (50 nM) for 45 min. Finally, fluorescence images of stained cells were captured using CLSM.
In vitro cytotoxicity
Photo-induced cytotoxicity of SMID nanoparticles was evaluated by fluorescence staining. Briefly, cells with initial seeding density of 1×10⁵ cells per well were incubated in a 12-well plate for 12 h. Then, the cells were incubated with 800 µL of DOX, ICG and SMID nanoparticles (equivalent ICG concentration: 16 μg·mL-1) for another 4 h, followed by exposure to an NIR laser (808 nm, 2 W·cm-2) for 5 min. After incubation for another hour, the cells were stained with LIVE/DEAD® viability/cytotoxicity kit following the manufacturer's protocol. The fluorescence images of stained cells were recorded under a fluorescence microscope (IX73, Olympus, Japan). To evaluate the therapeutic effect of SMID nanoparticles against tumor cells in vitro, 4T1 cells with an initial seeding density of 1×10⁴ per well were cultured in a 96-well plate for 12 h. Then, the cells were incubated with 200 µL of various agents (equivalent ICG concentration: 16 μg·mL-1) for 4 h, and were irradiated by an 808 nm laser (2 W·cm -2) where applicable. After culturing for 12 h, cell viability was determined based on standard MTT cell viability assay.
Establishment of 4T1 tumor bearing BLAB/c mouse model
All animal experiments were performed under the supervision of Institutional Animal Care and Use Committee (IACUC) of Southwest University and in compliance with the National Guide for Care and Use of Laboratory Animals. 4T1 tumors was established in female BALB/c mice [70]. Briefly, the mice (6 weeks, ~25 g each) were subcutaneously inoculated with 4T1 cells (1×10⁶ in saline) on dorsal side. After about 10 days, mice with a tumor grown to ~200 mm3 were grouped for antitumor treatments. The tumor volume was continuously monitored thereafter and calculated according to formula (7).
Tumor volume = (Tumor length) × (Tumor width)2 × 0.5 (7)
where length represents the longest dimension and width denotes the shortest dimension of a tumor.
Biodistribution in vivo
Biodistribution of SMID nanoparticles was investigated by quantifying the content of Mn element in mouse body. Briefly, 4T1 tumor-bearing BALB/c mice were intravenously injected with 200 µL of SMID (equivalent ICG dosage: 3 mg·kg-1) through the tail vein. Then, the mice were sacrificed to harvest the tumor and major organs at predesignated time points (2, 8, 12, 24 and 48 h) post-injection. The samples were lysed using chloroazotic acid, and the Mn content was analyzed using inductively coupled plasma atomic emission spectroscopy (ICP-AES).
MR/fluorescence dual-modal imaging in vivo
To determine the biodistribution of SMID nanoparticles by fluorescence imaging in vivo, tumor bearing BALB/c mice were intravenously injected with free ICG or SMID nanoparticles (equivalent ICG concentration: 3 mg·kg-1). At 2, 6, 12, 24 and 48 h after injection, infrared fluorescence images of mice were acquired using a fluorescence imaging system (λex = 780 nm, λem = 830 nm, Fusion FX7 Spectra, VILBER, France). At 24 h post-injection, mice were sacrificed to harvest the major organs and tumors for ex vivo imaging to determine the biodistribution of SMID nanoparticles semi-quantitatively using the same luminescence imaging system. MRI was carried out using Siemens MAGNETOM Prisma 3.0 T MRI scanner (Erlangen, Germany) with gradient strength up to 80 mT/m (TR = 800 ms, TE = 12 ms). T1-weighted MR signal intensity of each sample was measured from the MR images in the region of interest (ROI). The relaxation rate r1 (1/T1) was then calculated from T1 values under different Mn2+ concentrations. For MRI in vivo, T1-weighted MR images of tumors were taken at 1, 2, 6, 12, 24 h after intravenous injection of SMID nanoparticles (equivalent ICG concentration: 2 mg·kg-1).
Therapeutic efficacy of SMID nanoparticles in vivo
The 4T1 tumor bearing mice was randomly divided into 7 groups (n = 5 for each group): (1) saline, (2) SF@MnO2 plus laser irradiation, (3) free ICG plus laser irradiation, (4) free DOX, (5) SF@MnO2/ICG plus laser irradiation, (6) SMID, (7) SMID plus laser irradiation. The equivalent dose of ICG for all groups was fixed at 3 mg·kg-1. At 24 h post-injection, NIR laser irradiation (808 nm, 2 W·cm-2) was conducted at the tumor region for group (2), (3), (5) and (7) for 5 min. To monitor the temperature change, an infrared thermal camera (TiS55, Fluke, USA) was used to capture the thermal images of mice at predetermined time points. After the treatments, tumor volume and mouse body weight were continuously monitored for 14 days. The tumor growth inhibition (TGI) rate was indexed according to formula (8).
TGI = (VC-VT)/Vc × 100% (8)
where VC stands for the tumor volume of the saline group, and VT denotes the tumor volume in treatment groups.
Histological analysis
At day 14 after various treatments, the mice were euthanized to excise tumor and major organs, including hearts, livers, spleens, lungs and kidneys. The tumors were weighed and all the excised tissues were sliced into sections (5 µm) for histological analysis. The histological sections of tumor were formalin-fixed and paraffin-embedded, followed by staining with hematoxylin & eosin (H&E), Ki67, terminal deoxynucleotidyl transferase dUTP nick end labeling (TUNEL) and HIF1-α following the manufacturer's protocol. In addition, the tumor sections were alternatively embedded in OCT medium and snap frozen, followed by staining with dihydroethidine (DHE). All stained sections were histologically examined under a fluorescence microscope (IX73, Olympus, Japan).
Statistical analysis
Data were presented as mean ± SD according to one-way analysis of variance (ANOVA) using OriginPro 8.5 software (OriginLab, MA, USA). A p-value less than 0.05 (*p<0.05, n = 4) was considered as statistically significant.
Abbreviations
DLS: dynamic light scattering; DOX: doxorubicin; DLC: drug loading content; DLS: dynamic light scattering; EE: encapsulation efficiency; EPR: enhanced permeability and retention; FBS: fetal bovine serum; ICG: indocyanine green; GSH: glutathione; H&E: hematoxylin and eosin; MR: magnetic resonance; NDDS: nanoscale drug delivery systems; PBS: phosphate buffer saline; PDT: photodynamic therapy; PTT: photothermal therapy; SF: silk fibroin; SEM: scanning electronic microscopy; SOSG: singlet oxygen sensor green; TUNEL: terminal deoxynucleotidyl transferase dUTP nick end labeling; XRD: X-ray powder diffraction; XPS: X-ray photoelectron spectroscopy.
Supplementary Material
Supplementary figures and methods.
Acknowledgements
P. X. and Y.K. are grateful to the Technology Innovation and Application Demonstration Grant of Chongqing (cstc2018jscx-msybX0078) and National Natural Science Foundation of China (51703186, 31671037).
Competing Interests
The authors have declared that no competing interest exists.
References
1. Jain V, Jain S, Mahajan SC. Nanomedicines based drug delivery systems for anti-cancer targeting and treatment. Curr Drug Deliv. 2015;12:177-91
2. Wilczewska AZ, Niemirowicz K, Markiewicz KH, Car H. Nanoparticles as drug delivery systems. Pharmacol Rep. 2012;64:1020-37
3. Yu X, Trase I, Ren M, Duval K, Guo X, Chen Z, Design of nanoparticle-based carriers for targeted drug delivery. J Nanomater. 2016. 2016:1087250
4. Chow EKH, Ho D, Cancer nanomedicine. from drug delivery to imaging. Sci Transl Med. 2013;5:216rv4
5. Zhong J, Wen L, Yang S, Xiang L, Chen Q, Xing D. Imaging-guided high-efficient photoacoustic tumor therapy with targeting gold nanorods. Nanomedicine. 2015;11:1499-509
6. Li L, Fu S, Chen C, Wang X, Fu C, Wang S. et al. Microenvironment-driven bioelimination of magnetoplasmonic nanoassemblies and their multimodal imaging-guided tumor photothermal therapy. ACS Nano. 2016;10:7094-105
7. Huang Y, He S, Cao W, Cai K, Liang XJ. Biomedical nanomaterials for imaging-guided cancer therapy. Nanoscale. 2012;4:6135-49
8. Jain S, Hirst DG, O'Sullivan JM. Gold nanoparticles as novel agents for cancer therapy. Br J Radiol. 2012;85:101-13
9. Li Z, Liu J, Hu Y, Howard KA, Li Z, Fan X. et al. Multimodal imaging-guided antitumor photothermal therapy and drug delivery using bismuth selenide spherical sponge. ACS Nano. 2016;10:9646-58
10. Shi H, Yan R, Wu L, Sun Y, Liu S, Zhou Z. et al. Tumor-targeting CuS nanoparticles for multimodal imaging and guided photothermal therapy of lymph node metastasis. Acta Biomater. 2018;72:256-65
11. Li Y, Li Z, Wang X, Liu F, Cheng Y, Zhang B. et al. In vivo cancer targeting and imaging-guided surgery with near infrared-emitting quantum dot bioconjugates. Theranostics. 2012;2:769-76
12. Wang D, Liu B, Quan Z, Li C, Hou Z, Xing B. et al. New advances on the marrying of UCNPs and photothermal agents for imaging-guided diagnosis and the therapy of tumors. J Mater Chem B. 2017;5:2209-30
13. Xue P, Yang R, Sun L, Li Q, Zhang L, Xu Z, Kang Y. Indocyanine green-conjugated magnetic Prussian blue nanoparticles for synchronous photothermal/photodynamic tumor therapy. Nanomicro Lett. 2018;10:74
14. Vahrmeijer AL, Hutteman M, van der Vorst JR, van de Velde CJH, Frangioni JV. Image-guided cancer surgery using near-infrared fluorescence. Nat Rev Clin Oncol. 2013;10:507-18
15. Mura S, Nicolas J, Couvreur P. Stimuli-responsive nanocarriers for drug delivery. Nat Mater. 2013;12:991-1003
16. Liu M, Du H, Zhang W, Zhai G. Internal stimuli-responsive nanocarriers for drug delivery: Design strategies and applications. Mater Sci Eng C Mater Biol Appl. 2017;71:1267-80
17. Hardy JG, Römer LM, Scheibel TR. Polymeric materials based on silk proteins. Polymer (Guildf). 2008;49:4309-27
18. Qi Y, Wang H, Wei K, Yang Y, Zheng RY, Kim IS. et al. A review of structure construction of silk fibroin biomaterials from single structures to multi-level structures. Int J Mol Sci. 2017:18 237
19. Koh LD, Cheng Y, Teng CP, Khin YW, Loh XJ, Tee SY. et al. Structures, mechanical properties and applications of silk fibroin materials. Prog Polym Sci. 2015;46:86-110
20. Wang Q, Han G, Yan S, Zhang Q. 3D Printing of silk fibroin for biomedical applications. Materials (Basel). 2019;12:504
21. Kundu B, Rajkhowa R, Kundu SC, Wang X. Silk fibroin biomaterials for tissue regenerations. Adv Drug Deliv Rev. 2013;65:457-70
22. Din Wani SU, Veerabhadrappa GH. Silk fibroin based drug delivery applications: promises and challenges. Curr Drug Targets. 2018;19:1177-90
23. Wenk E, Merkle HP, Meinel L. Silk fibroin as a vehicle for drug delivery applications. J Control Release. 2011;150:128-41
24. Wongkrongsak S, Tangthong T, Pasanphan W. Electron beam induced water-soluble silk fibroin nanoparticles as a natural antioxidant and reducing agent for a green synthesis of gold nanocolloid. Radiat Phys Chem. 2016;118:27-34
25. Fei X, Jia M, Du X, Yang Y, Zhang R, Shao Z. et al. Green synthesis of silk fibroin-silver nanoparticle composites with effective antibacterial and biofilm-disrupting properties. Biomacromolecules. 2013;14:4483-8
26. Ming J, Zuo B. Crystal growth of calcium carbonate in silk fibroin/sodium alginate hydrogel. J Cryst Growth. 2014;386:154-61
27. Chen T, Shi P, Li Y, Duan T, Yu Y, Li X. et al. Biomineralization of varied calcium carbonate crystals by the synergistic effect of silk fibroin/magnesium ions in a microbial system. CrystEngComm. 2018;20:2366-73
28. Brown JM. Tumor hypoxia in cancer therapy. Methods Enzymol. 2007;435:297-321
29. Muz B, de la Puente P, Azab F, Azab AK. The role of hypoxia in cancer progression, angiogenesis, metastasis, and resistance to therapy. Hypoxia (Auckl). 2015;3:83-92
30. Li X, Kwon N, Guo T, Liu Z, Yoon J. Innovative strategies for hypoxic-tumor photodynamic therapy. Angew Chem Int Ed Engl. 2018;57:11522-31
31. Xu S, Zhu X, Zhang C, Huang W, Zhou Y, Yan D. Oxygen and Pt(II) self-generating conjugate for synergistic photo-chemo therapy of hypoxic tumor. Nat Commun. 2018;9:2053
32. Song X, Feng L, Liang C, Yang K, Liu Z. Ultrasound triggered tumor oxygenation with oxygen-shuttle nanoperfluorocarbon to overcome hypoxia-associated resistance in cancer therapies. Nano Lett. 2016;16:6145-53
33. Tao D, Feng L, Chao Y, Liang C, Song X, Wang H. et al. Covalent organic polymers based on fluorinated porphyrin as oxygen nanoshuttles for tumor hypoxia relief and enhanced photodynamic therapy. Adv Funct Mater. 2018;28:1804901
34. Zhu W, Dong Z, Fu T, Liu J, Chen Q, Li Y. et al. Modulation of hypoxia in solid tumor microenvironment with MnO2 nanoparticles to enhance photodynamic therapy. Adv Funct Mater. 2016;26:5490-8
35. Yang G, Xu L, Chao Y, Xu J, Sun X, Wu Y. et al. Hollow MnO2 as a tumor-microenvironment-responsive biodegradable nano-platform for combination therapy favoring antitumor immune responses. Nat Commun. 2017;8:902
36. Wang H, Chao Y, Liu J, Zhu W, Wang G, Xu L. et al. Photosensitizer-crosslinked in-situ polymerization on catalase for tumor hypoxia modulation & enhanced photodynamic therapy. Biomaterials. 2018;181:310-7
37. Yi X, Chen L, Zhong X, Gao R, Qian Y, Wu F. et al. Core-shell Au@MnO2 nanoparticles for enhanced radiotherapy via improving the tumor oxygenation. Nano Res. 2016;9:3267-78
38. Di W, Zhang X, Qin W. Single-layer MnO2 nanosheets for sensitive and selective detection of glutathione by a colorimetric method. Appl Surf Sci. 2017;400:200-5
39. Liu Y, Ma K, Jiao T, Xing R, Shen G, Yan X. Water-insoluble photosensitizer nanocolloids stabilized by supramolecular interfacial assembly towards photodynamic therapy. Sci Rep. 2017;7:42978
40. Mokwena MG, Kruger CA, Ivan MT, Heidi A. A review of nanoparticle photosensitizer drug delivery uptake systems for photodynamic treatment of lung cancer. Photodiagnosis Photodyn Ther. 2018;22:147-54
41. Wieder ME, Hone DC, Cook MJ, Handsley MM, Gavrilovic J, Russell DA. Intracellular photodynamic therapy with photosensitizer-nanoparticle conjugates: cancer therapy using a 'Trojan horse'. Photochem Photobiol Sci. 2006;5:727-34
42. Bechet D, Couleaud P, Frochot C, Viriot ML, Guillemin F, Barberi-Heyob M. Nanoparticles as vehicles for delivery of photodynamic therapy agents. Trends Biotechnol. 2008;26:612-21
43. Xu HL, ZhuGe DL, Chen PP, Tong MQ, Lin MT, Jiang X. et al. Silk fibroin nanoparticles dyeing indocyanine green for imaging-guided photo-thermal therapy of glioblastoma. Drug Deliv. 2018;25:364-75
44. Seib FP, Jones GT, Rnjak-Kovacina J, Lin Y, Kaplan DL. pH-dependent anticancer drug release from silk nanoparticles. Adv Healthc Mater. 2013;2:1606-11
45. Sheng Z, Hu D, Xue M, He M, Gong P, Cai L. Indocyanine green nanoparticles for theranostic applications. Nanomicro Lett. 2013;5:145-50
46. Yang R, Hou M, Gao Y, Zhang L, Xu Z, Kang Y. et al. Indocyanine green-modified hollow mesoporous Prussian blue nanoparticles loading doxorubicin for fluorescence-guided tri-modal combination therapy of cancer. Nanoscale. 2019:11 5717-31
47. Kunz RI, Brancalhao RM, Ribeiro LF, Natali MR. Silkworm sericin: properties and biomedical applications. Biomed Res Int. 2016;2016:8175701
48. Qu J, Liu Y, Yu Y, Li J, Luo J, Li M. Silk fibroin nanoparticles prepared by electrospray as controlled release carriers of cisplatin. Mater Sci Eng C Mater Biol Appl. 2014;44:166-74
49. Zhu H, Zhang C, Liu S, Tang Y, Yin Y. Effects of nanoparticle clustering and alignment on thermal conductivities of Fe3O4 aqueous nanofluids. Appl Phys Lett. 2006;89:023123
50. Sirichaisit J, Brookes VL, Young RJ, Vollrath F. Analysis of structure/property relationships in silkworm (Bombyx mori) and spider dragline (Nephila edulis) silks using raman spectroscopy. Biomacromolecules. 2003;4:387-94
51. Yang H, Jiang J, Zhou W, Lai L, Xi L, Lam YM. et al. Influences of graphene oxide support on the electrochemical performances of graphene oxide-MnO2 nanocomposites. Nanoscale Res Lett. 2011;6:531
52. Shakiba M, Ng KK, Huynh E, Chan H, Charron DM, Chen J. et al. Stable J-aggregation enabled dual photoacoustic and fluorescence nanoparticles for intraoperative cancer imaging. Nanoscale. 2016;8:12618-25
53. Subia B, Chandra S, Talukdar S, Kundu SC. Folate conjugated silk fibroin nanocarriers for targeted drug delivery. Integr Biol-Uk. 2014;6:203-14
54. Deng SX, Sun D, Wu CH, Wang H, Liu JB, Sun YX. et al. Synthesis and electrochemical properties of MnO2 nanorods/graphene composites for supercapacitor applications. Electrochim Acta. 2013;111:707-12
55. Pisoni DS, Todeschini L, Borges ACA, Petzhold CL, Rodembusch FS, Campo LF. Symmetrical and asymmetrical cyanine dyes. synthesis, spectral properties, and BSA association study. J Org Chem. 2014;79:5511-20
56. Kayal S, Ramanujan RV. Doxorubicin loaded PVA coated iron oxide nanoparticles for targeted drug delivery. Mater Sci Eng C Mater Biol Appl. 2010;30:484-90
57. Tang W, Shan X, Li S, Liu H, Wu X, Chen Y. Sol-gel process for the synthesis of ultrafine MnO2 nanowires and nanorods. Mater Lett. 2014;132:317-21
58. Sim HB, Lee JY, Park B, Kim SJ, Kang S, Ryu WH. et al. High-concentration dispersions of exfoliated MoS2 sheets stabilized by freeze-dried silk fibroin powder. Nano Res. 2016;9:1709-22
59. Li Z, Wang J, Liu S, Liu X, Yang S. Synthesis of hydrothermally reduced graphene/MnO2 composites and their electrochemical properties as supercapacitors. J Power Sources. 2011;196:8160-5
60. Prasad P, Gordijo CR, Abbasi AZ, Maeda A, Ip A, Rauth AM. et al. Multifunctional albumin-MnO2 nanoparticles modulate solid tumor microenvironment by attenuating hypoxia, acidosis, vascular endothelial growth factor and enhance radiation response. ACS Nano. 2014;8:3202-12
61. Sheng Z, Hu D, Zheng M, Zhao P, Liu H, Gao D. et al. Smart human serum albumin-indocyanine green nanoparticles generated by programmed assembly for dual-modal imaging-guided cancer synergistic phototherapy. ACS Nano. 2014;8:12310-22
62. Peng L, Mei X, He J, Xu J, Zhang W, Liang R. et al. Monolayer nanosheets with an extremely high drug loading toward controlled delivery and cancer theranostics. Adv Mater. 2018;30:e1707389
63. Deng R, Xie X, Vendrell M, Chang YT, Liu X. Intracellular glutathione detection using MnO2-nanosheet-modified upconversion nanoparticles. J Am Chem Soc. 2011;133:20168-71
64. Akinc A, Thomas M, Klibanov AM, Langer R. Exploring polyethylenimine-mediated DNA transfection and the proton sponge hypothesis. J Gene Med. 2005;7:657-63
65. Wang Q, Chen Q, Yang Y, Shao Z. Effect of various dissolution systems on the molecular weight of regenerated silk fibroin. Biomacromolecules. 2013;14:285-9
66. Rockwood DN, Preda RC, Yucel T, Wang X, Lovett ML, Kaplan DL. Materials fabrication from Bombyx mori silk fibroin. Nat Protoc. 2011;6:1612-31
67. Zhang YQ, Shen WD, Xiang RL, Zhuge LJ, Gao WJ, Wang WB. Formation of silk fibroin nanoparticles in water-miscible organic solvent and their characterization. J Nanopart Res. 2007;9:885-900
68. Wang S, Xu T, Yang Y, Shao Z. Colloidal stability of silk fibroin nanoparticles coated with cationic polymer for effective drug delivery. ACS Appl Mater Interfaces. 2015;7:21254-62
69. D'Souza S. A review of in vitro drug release test methods for nano-sized dosage forms. Advances in Pharmaceutics. 2014;2014:304757
70. Zhang Y, Zhang GL, Sun X, Cao KX, Ma C, Nan N. et al. Establishment of a murine breast tumor model by subcutaneous or orthotopic implantation. Oncol Lett. 2018;15:6233-40
Author contact
![]() Corresponding authors: E-mail: xuepengedu.cn (P. Xue); yjkangedu.cn (Y. Kang)
Corresponding authors: E-mail: xuepengedu.cn (P. Xue); yjkangedu.cn (Y. Kang)