Theranostics
13.3
Impact Factor
- Current Issue
- Advance Articles
- Volume 16; 2026
- Volume 15; 2025
- Volume 14; 2024
- Volume 13; 2023
- Volume 12; 2022
- Archive
- Cover Images
- Cover Suggestion
- Special Issues
Top
Introduction
Methods
Results and Discussion
Abbreviations
Acknowledgements
Supplementary Material
References
Introduction
Methods
Results and Discussion
Abbreviations
Acknowledgements
Supplementary Material
References
International Journal of Biological Sciences
International Journal of Medical Sciences
 Global reach, higher impact

Theranostics 2019; 9(16):4567-4579. doi:10.7150/thno.31502 This issue Cite
Research Paper
A Comprehensive Study of Vesicular and Non-Vesicular miRNAs from a Volume of Cerebrospinal Fluid Compatible with Clinical Practice
Endika Prieto-Fernández1 ![]() , Ana María Aransay2,3, Félix Royo4, Esperanza González4, Juan José Lozano5, Borja Santos-Zorrozua1, Nuria Macias-Camara2, Monika González2, Raquel Pérez Garay6, Javier Benito7,8, Africa Garcia-Orad1,9
, Ana María Aransay2,3, Félix Royo4, Esperanza González4, Juan José Lozano5, Borja Santos-Zorrozua1, Nuria Macias-Camara2, Monika González2, Raquel Pérez Garay6, Javier Benito7,8, Africa Garcia-Orad1,9 ![]() , Juan Manuel Falcón-Pérez3,4,10
, Juan Manuel Falcón-Pérez3,4,10 ![]()
1. Department of Genetics, Physical Anthropology and Animal Physiology, Faculty of Medicine and Nursing, University of The Basque Country (UPV/EHU), Leioa, Bizkaia, 48940, Spain.
2. Genome Analysis Platform, CIC bioGUNE, Derio, Bizkaia, 48980, Spain.
3. Centro de Investigación Biomédica en Red de Enfermedades Hepáticas y Digestivas (CIBERehd), Instituto de Salud Carlos III, Madrid, 28029, Spain.
4. Exosomes Lab, CIC bioGUNE, CIBERehd, Derio, Bizkaia, 48980, Spain.
5. Bioinformatics Unit, Centre Esther Koplovitz (CEK), CIBERehd, Barcelona, 08036, Spain.
6. Biochemistry Service, Cruces University Hospital, Barakaldo, Bizkaia, 48903, Spain.
7. Department of Pediatric Emergency, Cruces University Hospital, Barakaldo, Bizkaia, 48903, Spain.
8. Department of Pediatrics, University of The Basque Country (UPV/EHU), Leioa, Bizkaia, 48940, Spain.
9. BioCruces Health Research Institute, Barakaldo, Bizkaia, 48903, Spain.
10. IKERBASQUE, Basque Foundation for Science, Bilbao, Bizkaia, 48015, Spain.
Received 2018-11-14; Accepted 2019-3-20; Published 2019-6-19
Citation:
Prieto-Fernández E, Aransay AM, Royo F, González E, Lozano JJ, Santos-Zorrozua B, Macias-Camara N, González M, Garay RP, Benito J, Garcia-Orad A, Falcón-Pérez JM. A Comprehensive Study of Vesicular and Non-Vesicular miRNAs from a Volume of Cerebrospinal Fluid Compatible with Clinical Practice. Theranostics 2019; 9(16):4567-4579. doi:10.7150/thno.31502. https://www.thno.org/v09p4567.htm
Other stylesAbstract

Cerebrospinal fluid (CSF) microRNAs (miRNAs) have emerged as potential biomarkers for minimally invasive diagnosis of central nervous system malignancies. However, despite significant advances in recent years, this field still suffers from poor data reproducibility. This is especially true in cases of infants, considered a new subject group. Implementing efficient methods to study miRNAs from clinically realistic CSF volumes is necessary for the identification of new biomarkers.
Methods: We compared six protocols for characterizing miRNAs, using 200-µL CSF from infants (aged 0-7). Four of the methods employed extracellular vesicle (EV) enrichment step and the other two obtained the miRNAs directly from cleared CSF. The efficiency of each method was assessed using real-time PCR and small RNA sequencing. We also determined the distribution of miRNAs among different CSF shuttles, using size-exclusion chromatography.
Results: We identified 281 CSF miRNAs from infants. We demonstrated that the miRNAs could be efficiently detected using only 200 µL of biofluid in case of at least two of the six methods. In the exosomal fraction, we found 12 miRNAs that might be involved in neurodevelopment.
Conclusion: The Norgen and Invitrogen protocols appear suitable for the analysis of a large number of miRNAs using small CSF samples.
Keywords: CSF miRNAs, CSF exosomes, microRNA profiling, infants, clinical samples
Introduction
Cerebrospinal fluid (CSF) is a potential source for minimally invasive diagnostic analysis of neurological disorders, including viral infections [1], Alzheimer's disease [2, 3], traumatic brain injury [4], and brain tumors [5-7]. The CSF contains cells, extracellular vesicles (EVs), and biomolecules such as proteins, nucleic acids, and metabolites. These biomolecules can be either associated with the cells or EVs [3, 4] or circulate freely within the fluid [8]. Among these components, the microRNAs (miRNAs) have been attracting increasing attention in recent years [8, 9]. miRNAs are short (∼22 nucleotides) non-coding RNAs that modulate gene expression at the post-transcriptional level [10]. They regulate more than 50% of human genes, including many that are related to cancer [11, 12]. Some changes in the levels of certain miRNAs have already been associated with various pathologies [8]. Teplyuk et al. have found high levels of miR-10b and miR-21 in the CSF of patients with glioblastoma (GBM). Interestingly, the increased levels of these two miRNAs are also associated with the metastasis to the brain in patients with primary breast and lung cancers [13]. Baraniskin et al. have reported that miR-21 and miR-15b are upregulated in CSF samples from patients with glioma [14].
However, these studies analyzed CSF miRNAs without examining their transport in the fluid. The distribution of miRNAs among miRNA shuttles in the CSF, i.e., proteins, lipoproteins, and EVs (exosomes, microvesicles, and apoptotic bodies), can differ between normal and pathological conditions [8]. Yagi et al. have recently observed that the CSF miRNAs can vary between the vesicular and non-vesicular fractions. They have shown that the miRNAs associated with EVs are different from those found in free circulation. miR-1911-5p, miR-1264, and miR-34b, among others, are abundant in CSF EVs and not in the EV-depleted CSF [15]. EVs are released by all types of cells and can enter the bodily fluids [16]. Cancer cells also actively release EVs carrying miRNAs, which communicate with near and distal cells in the tumor microenvironment and affect tumor progression [17, 18], contributing to the final vesicular composition of biofluids. Therefore, miRNAs carried by CSF EVs might constitute a good source of biomarkers for minimally invasive diagnosis and prognosis of brain cancer. Although the CSF is often obtained for diagnosis in the clinical practice, the EVs that this fluid contains are not routinely examined, neglecting most of its biomarker potential. Only one study has currently reported a robust CSF EV-associated miRNA signature (nine-miRNA catalog) for minimally invasive diagnosis of GBM [19].
Despite significant advances in recent years, this field suffers from poor data reproducibility [20, 21]. The main reason for this persistent problem is the complexity of CSF miRNA detection procedures, with many unresolved technical issues [8]. First, it is crucial to preserve the integrity of CSF specimens between their collection and laboratory processing and storage. The samples should be processed within 2 hours of collection, and freeze-thaw cycles should be avoided [20]. Second, various existing miRNA isolation protocols have different yields. To date, various methods and kits have been used to isolate EVs from CSF samples [15, 19, 22-28] and to extract miRNAs from CSF EVs [15, 19, 22-27, 29] and from cleared CSF [9, 13, 14, 30-39]. However, it is difficult to compare the data obtained using such a varying array of techniques, kits, and samples. Third, different miRNA profiling platforms and data normalization approaches can result in distinct miRNA catalogs [20, 36]. In view of the above, the unresolved technical issues in the analysis and standardization of protocols are still the obstacles to be overcome. Another important problem to be considered is the limited amount of CSF that can be obtained for the diagnosis. In the case of pediatric patients, this problem is even more acute since the amount of CSF routinely withdrawn for clinical tests is smaller than from the adults. For this reason, these patients constitute a largely unexplored subject group for which new biomarkers are desperately needed [21]. In addition, very little is known of the biological variability of the CSF microRNAome; it might be affected by the diet, health status, age, and development. Establishing a standardized, efficient protocol for miRNA detection in small CSF samples would facilitate the necessary large studies with statistically sufficient numbers of subjects. The availability of such methods might also help to clarify other issues and identify new biomarkers, especially in infants, where they are desperately needed [21].
Thus, it is necessary to adapt the existing protocols to small CSF sample volumes and find the most appropriate method for miRNA analysis. Here, we performed a comprehensive comparative analysis of six existing protocols to establish a simple and effective method for detecting miRNAs from a minimum CSF volume of clinical specimens. We placed particular emphasis on identifying miRNAs associated with EVs. We believe that our study contributes some valuable data to the search of new low-invasive biomarkers for pediatric brain cancers and to their implementation in clinical practice.
Methods
Experimental design
In this study, we performed a comprehensive comparative analysis of six existing methods to define a simple and effective strategy for detecting miRNAs from 200-µL samples of CSF. Four of the protocols included an initial EVs enrichment step. The other two were designed to extract miRNAs directly from cleared CSF. First, the efficiency of each method was assessed using the real-time PCR (RT-qPCR). Eight miRNAs previously detected in the CSF by Yagi et al. were selected as reference [15]. We used small RNA sequencing (smallRNAseq) data from Yagi et al. as a reference throughout our study since they isolated miRNAs from a large volume of CSF (7 mL). The eight miRNAs had variable concentrations in the exosomal fractions of Yagi et al. (Figure S1A) [15]. Our aim was to establish the detection limit of each of the methods for small CSF volumes (200 µL). Then, the methods capable of identifying the majority of the eight miRNAs (using RT-qPCR) were examined employing the smallRNAseq to find the technique detecting the largest number of miRNAs.
Moreover, the CSF samples were fractionated using an in-house size-exclusion chromatography (SEC) method. Two fractions representing the exosomal and supernatant fractions were sequenced to identify enriched miRNAs in the exosomal fraction of CSF of infants. Each procedure was carried out in triplicate (Figure 1).
Figure 1
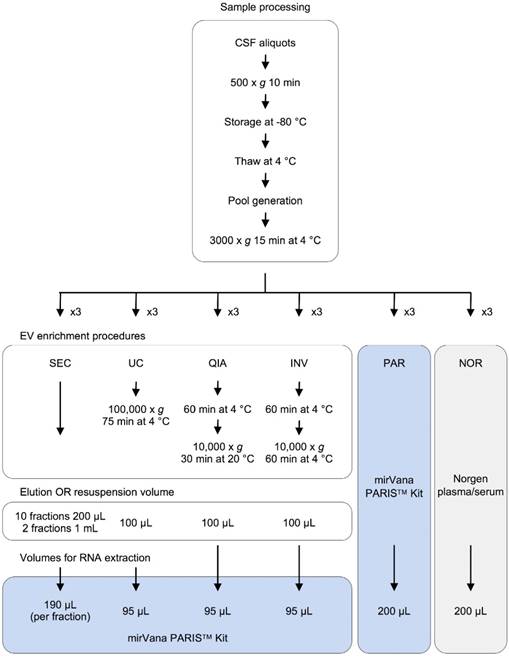
Experimental design for comparison of six methods of analyzing miRNAs in bodily fluids. Aliquots of 200 µL of CSF were used to test each of the six methods in triplicate (overall, 18 aliquots were processed). The pellets obtained in each EV enrichment procedure were resuspended in 100 µL of 1X DPBS. Then, total RNA was extracted to perform the downstream analyses (TaqMan RT-qPCR and smallRNAseq). Abbreviations: size-exclusion chromatography (SEC), ultracentrifugation (UC), miRCURY Exosome Isolation Kit from Qiagen (QIA), Total Exosome Isolation Reagent from Invitrogen (INV), mirVana PARIS Kit from Ambion (PAR), and Plasma/Serum RNA Purification Kit from Norgen (NOR).
Human CSF samples
Samples and data from patients included in this study were provided by the Basque Biobank (www.biobancovasco.org) and were processed following standard operation procedures with appropriate approval of the Ethical and Scientific Committees (code CEIC E17/40). Nineteen non-hemorrhagic samples from children (aged 0-7) were acquired. The CSF samples were obtained via lumbar puncture, centrifuged to remove contaminant cells (500 x g for 10 minutes), aliquoted, and immediately stored at -80 °C until processing. To perform the main experiment and the analyses of reproducibility and RNase protection, three independent pools of samples were generated. To achieve that, the CSF samples were thawed at 4 °C, mixed together, centrifuged at 3,000 x g for 15 minutes at 4 °C, divided into 200 µL-aliquots (cleared CSF), and kept on ice until processing.
EVs enrichment procedures
Four different EV enrichment methods were evaluated in triplicate: ultracentrifugation (UC), miRCURY Exosome Isolation Kit - Cells, Urine and CSF (Qiagen #76743) (QIA), Total Exosome Isolation Reagent (Invitrogen #4484453) (INV), and an in-house SEC. UC was carried out in a single step (100,000 x g for 75 minutes at 4 °C) using a Beckman-Coulter TLA 120.2 rotor. The QIA kit was used following the manufacturer's instructions. The INV method was slightly modified; the CSF triplicates were not initially centrifuged at 10,000 x g, as recommended, but at 3000 x g like in the rest of the protocols. The UC and QIA methods required an adjustment of the sample volume from 200 µL to 1.0 mL using 1X DPBS (Gibco #14190-094). In all cases, the EV pellets were resuspended in 100 µL of 1X DPBS. Finally, the cleared CSF was fractionated using the in-house SEC. This was performed as follows: The Poly-prep Chromatography Column (BioRad #731-1550) was filled with 2.5 mL of Sepharose CL-2B cross-linked resin (Sigma #CL2B300-100ML) and left packing overnight at 4 °C. Then, the column was washed twice with 2.5 ml of 1X DPBS. Once the sample (200 µL of CSF) was applied onto the column, 4.0 mL of 1X DPBS was added; 10 fractions of 200 µL and two final fractions of 1.0 mL were collected. The RNA was extracted from the isolated EVs and the SEC fractions using the mirVana PARIS Kit (Ambion #AM1556) (PAR), following the manufacturer's instructions for total RNA isolation. To account for the differences in the efficiency of the extraction, the samples were spiked with cel-miR-39 (2x10⁻⁴ nmoles added) (Invitrogen) after mixing the cleared CSF with the cell disruption buffer (Figure 1).
RNA extraction directly from cleared CSF
Total RNA was extracted from 200 µL of cleared CSF using PAR and the Plasma/Serum RNA Purification Kit (Norgen #55000) (NOR). The isolated RNA was eluted in 100 µL of nuclease‑free water (Ambion #AM9930). Before each RNA extraction, the samples were spiked with cel-miR-39 (2x10⁻⁴ nmoles added) (Invitrogen) (Figure 1).
cDNA synthesis
The cDNA was synthesized from 2 µL of the isolated RNA using the TaqMan Advanced miRNA cDNA Synthesis Kit (Applied Biosystems #A28007), following the manufacturer's recommendations. To account for differences in the retrotranscription reaction and for the calculation of relative quantities of each miRNA, 2x10⁻⁸ nmoles of ath-miR-159a (Invitrogen) were added to each reaction.
Real-Time qPCR assay
The reaction mix consisted of 5 µL of TaqMan Fast Advanced Master Mix (Applied Biosystems #4444557), 0.5 µL of TaqMan Advanced miRNA Assays (Applied Biosystems #A25576), 1.5 µL of nuclease-free water (Ambion #AM9930), and 3 µL of cDNA diluted at 1:3 ratio. The following assays were performed: ath-miR-159a (478411_mir) and cel-miR-39-3p (478293_mir) for detecting the spike-ins, as well as hsa-miR-21-5p (477975_mir), hsa-miR-451a (478107_mir), hsa-miR-92a-3p (477827_mir), hsa-miR-22-3p (477985_mir), hsa-miR-1911-5p (479583_mir), has-miR-1264 (478670_mir), hsa-miR-30c-5p (478008_mir), and hsa-miR-34b-3p (478049_mir) (Applied Biosystems) to detect the eight miRNAs selected. The RT-qPCR reactions were conducted in duplicate on a ViiA 7 Real-Time PCR System (Applied Biosystems). The data were analyzed using the QuantStudio Real-Time PCR System, software version 1.3 (Applied Biosystems).
Western blot analysis of SEC fractions
First, 200 µL-aliquot of CSF was fractionated using SEC as previously described. Then, 150 µL of each fraction was concentrated using 99.5% acetone (Panreac #161007) and resuspended in 20 µL of 1X DPBS. Fifteen µL of the suspension was mixed with 5 µL of NuPAGE LDS Sample Buffer 4X (Invitrogen #NP0007) and heated for 5 minutes at 37 °C, 10 minutes at 65 °C, and 15 minutes at 95 °C. Each preparation was separated in a 4-12% Bis-Tris gel (Invitrogen #NP0336BOX) with MOPS SDS Running Buffer 20X (Invitrogen #NP0001). Precision Plus Protein Dual Color Standard (BioRad #161-0374) was used to calculate the molecular weights of the proteins. The proteins were transferred to an Immobilon-P Transfer membrane (Merck Millipore #IPVH00010) using the NuPAGE Transfer Buffer 20X (Invitrogen #NP0006-1) and blocked for 1 hour in 5% Blotting-Grade Blocker (BioRad #170-6404) and 0.2% Tween-20 (Sigma Aldrich #P2287) diluted in 1X DPBS. Then, the primary antibodies (1:500) were added and incubated overnight, followed by three washes with 1X DPBS and the application of secondary HRP-conjugated antibodies (1:6000). Primary antibodies against exosomal markers, i.e., Mo αCD63 clone H5C6 (Developmental Studies Hybridoma Bank ID AB_528158) and Mo αCD9 (R&D systems #MAB1880), as well as antibodies to detect the neuron-specific enolase (NSE) and albumin, i.e., Rb αNSE clone EPR3377 (Abcam #Ab79757) and Sh αHSA (Abcam #ab8940), were used. HRP-conjugated anti-Mo, anti-Rb, and anti-Sh antibodies were obtained from Jackson ImmunoResearch. Chemiluminescence detection of bands was performed using Pierce ECL Plus Western Blotting Substrate (Thermo Scientific #32132). Finally, the antigens were detected on high-performance films (GE Healthcare #28906844) using the AGFA Curix-60 automatic processor (Agfa, Cologne, Germany).
RNase protection assay
To detect each miRNA of interest within the EVs, we treated the cleared CSF with proteinase K (Sigma Aldrich #03115879001) or Triton X-100 (TX-100) (Sigma Aldrich #T8787) plus RNase A (Sigma Aldrich # 10109142001), as described in Shelke et al. [40, 41]. The proteinase K degrades the protein-miRNA complexes and, therefore, facilitates the degradation of the free-circulating miRNAs by the RNase [41]. After this treatment, all the miRNAs that are not protected inside the EVs should be degraded. However, the TX-100 permeabilizes the membrane of the EVs and allows the RNase to degrade the miRNAs contained in the vesicles. This assay, in combination with the proteinase K experiment, should show which miRNAs are associated with vesicles or other CSF components. Each procedure was carried out in triplicate. Briefly, a CSF pool of 1.8 mL was divided into nine aliquots of 200 µL. Three of these were incubated with proteinase K (the final concentration, 0.05 mg/mL) at 37 °C for 10 minutes. The reaction was stopped by adding phenylmethylsulfonyl fluoride (the final concentration, 5 mM) (Sigma Aldrich #10837091001) followed by additional heat inactivation (90 °C for 5 minutes). Another three aliquots were treated with 0.1% TX-100. Then, the samples treated with Proteinase K or TX-100 were incubated with RNase A (the final concentration, 0.5 mg/mL) at 37 °C for 20 minutes. The remaining aliquots constituted positive controls; they were not treated and kept at 4 °C until the RNA extraction step. Afterward, total RNA was extracted using NOR, and the levels of the eight miRNAs selected from Yagi et al. were determined by RT-qPCR.
Small RNA sequencing
The quantity and profiles of obtained RNAs were examined using Agilent RNA 6000 Pico Chips (Agilent Technologies #5067-1513). Then, sequencing libraries were prepared using NEXTflex™ Small RNA-Seq Kit v3 (Bioo Scientific Corp. #5132-05) following the protocol for NEXTflex™ Small RNA-Seq Kit v3 V16.06. Briefly, using 70 of 100 µL of each extraction, the total RNA samples were incubated for 2 minutes at 70 °C, then 3′ 4N adenylated adapter and ligase enzyme were added, and ligation was conducted overnight at 20 °C. After removal of excess of 3′-adapter, 5′-adapter was added with ligase enzyme and the mix was incubated at 20°C for 1 hour. The ligation product was used for the reverse transcription with the M-MuLV Reverse Transcriptase in a thermocycler for 30 minutes at 42 °C and 10 minutes at 90 °C. Next, the enrichment of the cDNA was performed using PCR cycling: 2 min at 95 °C; 22-25 cycles of 20 sec at 95 °C, 30 sec at 60 °C, and 15 sec at 72 °C; the final elongation for 2 min at 72 °C and the reaction was stopped at 4 °C. PCR products were resolved on 6% Novex TBE PAGE gels (Thermo Fisher Scientific #EC6265BOX), and the band between 150 bp and 300 bp was cut out from the gel. Small RNAs were extracted from polyacrylamide gel using an adapted protocol, in which the DNA from gel slices was diffused in ddH2O. Afterward, the quantitative and qualitative analyses of the libraries were performed on an Agilent 2100 Bioanalyzer using Agilent High Sensitivity DNA Kit (Agilent Technologies, # 5067-4626) and Qubit dsDNA HS DNA Kit (Thermo Fisher Scientific, # Q32854). The libraries were single-read sequenced for 51 nucleotides in a HiSeq2500 System (Illumina).
Data analyses
Real-Time qPCR assay
The relative quantity of each analyzed miRNA was calculated using the ath-miR-159a spike-in as the reference miRNA and the following formula: ∆Ct=2^ - (Ct miRNA - Ct ath-miR-159a).
Small RNA sequencing
FASTQs were trimmed for the adapters following the recommendations of the NEXTflex™ Small RNA-Seq Kit manufacturers. We used Bowtie [42] to align the reads against the human genome with the corresponding annotations (GRCh38/GENCODE-v26), with a mismatch 0, to avoid false positives. GENCODE contains a full set of annotations including all protein-coding loci with alternatively transcribed variants, non-coding loci with transcript evidence, and pseudogenes [43]. Quantification of the transcriptome was performed using Partek expectation maximization, employing Partek Flow application, software version 7.0. Only the miRNAs with 10 or more reads in the three replicas were considered. To estimate the relative miRNA levels from smallRNAseq data, the trimmed mean of M-values normalization method (TMM) was used [44]. To visualize the miRNAs identified by each method and their relative abundance, normalized data were represented using the pheatmap package v1.0.10 (default settings) in R 3.4.1 program (2014-04-10, R Foundation for Statistical Computing, Vienna, Austria). UpSet plot showing the total size and overlaps between the miRNAs sets isolated by each method and SEC fractionation was obtained using UpSetR [45] (available online in https:// gehlenborglab.shinyapps.io/upsetr/). We used the smallRNAseq data from Yagi et al. as a reference [15]. Data were obtained from the NBDC Human Database (dataset ID: JGAS00000000064) (https://humandbs. biosciencedbc.jp/en/) and analyzed in the same way as our data, to be able to compare the two datasets.
Correlation analysis
Correlation coefficients between RT-qPCR and smallRNAseq data were calculated using the cor function in R 3.4.1 software (2014-04-10, R Foundation for Statistical Computing).
Gene target prediction and pathway enrichment analysis
Predicted target genes for each miRNA were obtained using miRWalk 2.0 database [46]. The target genes were only selected if they were predicted by at least eight of the twelve miRNA-target prediction programs hosted in the miRWalk 2.0. Pathway enrichment analyses were performed using the over-representation analysis module of the ConsensusPathDB web tool (CPDB) [47]. The default collections of Kyoto Encyclopedia of Genes and Genomes (KEGG) [48], Reactome [49], and BioCarta (http:// cgap.nci.nih.gov/Pathways/BioCarta_Pathways) databases were utilized to analyze the predicted target gene lists.
Results and Discussion
In this study, we compared several existing methods used to enrich the EVs and to analyze their miRNA cargo. We attempted to establish the most suitable technique for detecting CSF miRNAs in 200-µL samples. This volume was chosen considering the realistic amount of CSF that could be obtained from each patient to conduct such studies (200-300 µL).
Assessing the efficiency of the protocols using Real-Time qPCR
First, the efficiency of the six tested protocols was evaluated using RT-qPCR. Eight miRNAs previously detected by Yagi et al. that had variable concentrations in the exosomal fraction (using 7-mL CSF samples) were selected as a reference of the biofluid (Figure S1A), including three EV-associated miRNAs (miR-1911-5p, miR-1264, and miR-34b-3p) and five additional miRNAs identified in both the exosomal and non-exosomal fractions (miR-21-5p, miR-451a, miR-92a-3p, miR-22-3p, and miR-30c-5p) [15]. Among these, miR-21-5p, miR-1911-5p, miR-30c- 5p, and miR-34b-3p have also been found in the brain and cerebellum by Meunier et al. (GEO accession number: GSE40499) [50]. Here, we found that, of the eight evaluated miRNAs in our pool of samples, the four most abundant miRNAs were miR-21-5p, miR-451a, miR-92a-3p, and miR-22-3p. By contrast, miR-1911-5p, miR-1264, miR-34b-3p, and miR-30c-5p, were the least abundant miRNAs in our study (Figure 2). Yagi et al. have found the miR-1911-5p in the exosomal fraction and, to a much lesser extent, in the supernatant (Figure S1A). Here, this miRNA was detected by RT-qPCR in the transcriptome obtained by all the protocols, with and without the enrichment step. Similarly, miR-1264, miR-30c-5p, and miR-34b- 3p, detected by Yagi et al. only in the exosomal fraction (Figure S1A), were also found using the NOR and INV protocols (Figure 2A). This demonstrated that we could harvest miRNAs of different abundances in the CSF by analyzing as little as 200 µL of fluid. However, these results should be interpreted with caution since Yagi et al. have used the CSF from healthy adults [15], not from infants. Additional studies of healthy infants are needed to corroborate our results.
Figure 2
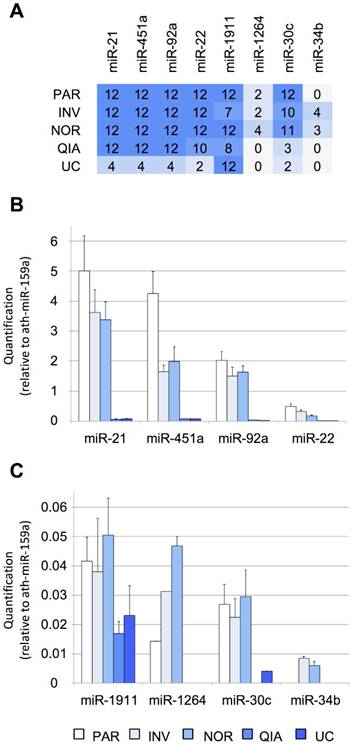
Performance of different protocols measured using RT-qPCR. A, the number of TaqMan RT-qPCR replicates (from a total of 12) in which the studied miRNAs were detected. Twelve RT-qPCR reactions were performed for each method (3 EV isolations and miRNA extractions x 2 cDNA synthesis reactions x 2 technical duplicates of each cDNA reaction). B, relative quantification (in comparison with ath-miR-159a) of miR-21-5p, miR-451a, miR-92a-3p, and miR-22-3p and C, of miR-1911-5p, miR-1264, miR-30c-5p, and miR-34b-3p. Abbreviations: ultracentrifugation (UC), miRCURY Exosome Isolation Kit from Qiagen (QIA), Total Exosome Isolation Reagent from Invitrogen (INV), mirVana PARIS Kit from Ambion (PAR), and Plasma/Serum RNA Purification Kit from Norgen (NOR).
Four of the assessed methods, NOR, INV, PAR, and QIA, detected the more abundant miRNAs in all replicas (12/12), except for miR-22-3p detection by QIA (10/12). The methods using total RNA from the cleared CSF (PAR and NOR) performed slightly better based on our eight reference miRNAs. PAR was the most efficient method for the most abundant miRNAs tested by RT-qPCR (Figure 2B). However, it did not detect the miR-34b-3p, the least abundant miRNA evaluated (Figure S1A). In contrast, NOR was the most effective method when dealing with low copy number, based on the smallRNAseq data of Yagi et al. (miR-1911-5p, miR-1264, miR-30c-5p, miR-34b-3p), suggesting superior sensitivity (Figure 2C). Among the methods employing the EV enrichment step, INV obtained the lower Ct values. QIA and UC did not perform well with small CSF samples. However, we cannot rule out that this difference in performance is due to a modification in the INV procedure. INV protocol recommends two consecutive centrifugation steps before adding the exosome isolation reagent (2,000 x g for 30 minutes and 10,000 x g for 30 minutes). In this study, all the samples were centrifuged at 3,000 x g for 15 minutes. Therefore, the INV procedure might have obtained both small (mainly exosomes) and large EVs, while QIA and UC might have achieved more precise exosome separation. This is supported by the fact that the exosomal miR-1911-5p was the most abundant species detected by QIA and UC. In any case, the other methods (NOR, INV, and PAR) performed better in the detection of the reference miRNAs when analyzed by RT-qPCR.
Figure 3
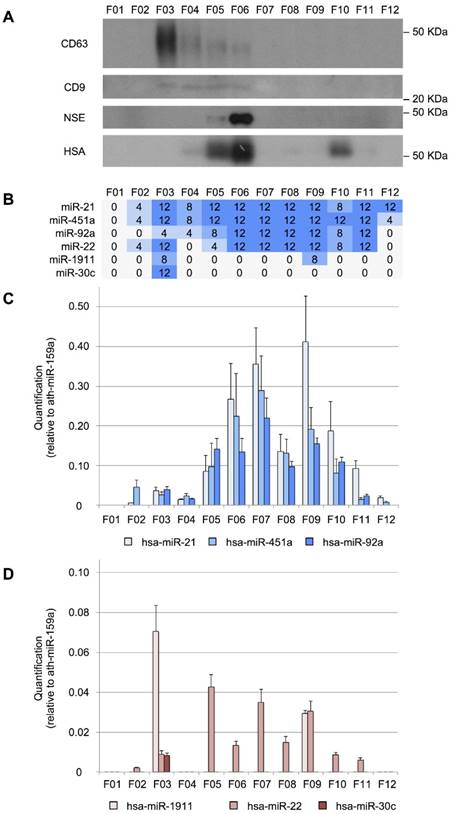
Size-exclusion chromatography analysis of CSF. A, Western blot analysis of CD63, CD9, neuron-specific enolase (NSE), and human serum albumin (HSA) proteins. Molecular weights are shown in KDa. B, the number of TaqMan RT-qPCR replicates (from a total of 12) in which the studied miRNAs were detected. C, quantification (relative to ath-miR-159a) of miR-21-5p, miR-451a, and miR-92a-3p and D, of miR-1911-5p, miR-22-3p, and miR-30c-5p.
Interestingly, INV and NOR were the only techniques capable of detecting all the miRNAs studied here by RT-qPCR, including CSF miRNAs associated with the vesicular fraction (miR-1911-5p, miR-1264, and miR-34b-3p) (Figure 2A) [15]. This suggests that these two are the most proficient methods for the analysis of low copy number. Overall, these results show that each protocol isolates a slightly different group of vesicles and miRNAs.
Characterization of protein and miRNA subpopulations in CSF using SEC
The miRNAs can have different distributions among the CSF shuttles, such as different populations of EVs, RNA-binding proteins and lipoproteins. To study the distribution of miRNAs among the different CSF structures in infants, we fractionated 200 µL of CSF using an in-house SEC protocol. First, the performance of the method was evaluated by Western blotting (Figure 3A). CD63 and CD9 exosomal markers were predominantly detected in fractions 3 (F03) and fractions 3 to 6 (F03-F06), respectively. These markers were found in earlier fractions than in most of the published reports for SEC [51-53]. However, in our SEC method, the sample is separated into fewer fractions than usual, which might explain this discrepancy. The albumin (mostly in F05, F06, and F10) and the NSE (in F05 and mainly in F06) were also detected. Albumin is the most abundant protein in the CSF (245 mg/L) and accounts for 35-80% of the total protein content of this biofluid [54]. NSE is a valuable biomarker of brain tumors, used for assessing neuronal damage and formulating the prognosis of brain injury [55]. It is upregulated in the biopsies of GBM patients [56]. Here, we demonstrated that the level of NSE (found at 8 mg/L in the CSF of healthy individuals [54] could be measured in 200 µL-samples of this fluid. Thus, we showed that our in-house SEC method could be used for fractionating small volumes of CSF.
We performed a RT-qPCR assay to examine the distribution of our eight reference miRNAs among the fractions (Figure 3B). We found that miR-21-5p, miR-451a, and miR-92a-3p were the most abundant in fractions F06, F07, and F09 (Figure 3C). In the case of miR-22-3p, relatively large amounts were obtained in F05, F07, and F09 (Figure 3D). Overall, these miRNAs showed a similar distribution pattern in 12 fractions, where the two main miRNA subpopulations were observed. The first subpopulation, from F05 to F08, co-fractioned with NSE and albumin while the second one (from F09 to F12) co-fractioned with the albumin. Interestingly, the miR-30c-5p was only detected in the fraction F03 (Figure 3D), co-fractionating with the exosomal markers. This is in agreement with the results of Yagi et al. who have found that this miRNA is 3 to 5 times more abundant in the vesicular CSF fraction than in the EV-depleted CSF [15]. miR-1911-5p, the exosome-associated miRNA, was highly expressed in the exosomal fraction (F03) and to a lesser extent in F09, also in accord with the enrichment in the vesicular fraction reported by Yagi et al. [15]. By contrast, miR-1264 and miR-34b-3p were not detected using the SEC when analyzing 200-µL CSF samples. These miRNAs were the least abundant references in our study and were detected with fewer than 10 counts by Yagi et al. (Figure S1A). Thus, the SEC seems less sensitive than the other methods tested here (PAR, INV, and NOR).
RNase protection assay
To further analyze the association of miRNAs with vesicles and their exact location (inside or on the surface of the vesicles), we performed an RNase protection assay. The cleared CSF was treated with Proteinase K or TX-100, and RNase A. We found that most of the miRNAs studied by RT-qPCR (i.e., miR-21-5p, miR-451a, miR-92a-3p, and miR-22-3p) were degraded after proteinase K and RNase A treatment (Figure 4). Therefore, their levels should be higher in the supernatant than inside the EVs. Although the miR-30c was degraded in the absence of TX-100 (Figure 4), this miRNA was associated with the vesicular fraction containing CD63 (F03) in our SEC experiment (Figures 3A and 3D). The degradation observed after the treatment with proteinase K might be explained by the association of this miRNA with the outer surface of the vesicles. The treatment with TX-100 permeabilizes the membranes, allowing the RNase degradation of miRNAs inside the EVs. It resulted in complete degradation of miR-1264 and of almost all the miR-1911-5p. By contrast, after proteinase K treatment no more than half of these miRNAs were degraded, suggesting that a large proportion of miR-1264 and miR-1911-5p is protected within EVs. This agrees with the results of Yagi et al. [15] and our miR-1911-5p data (Figure 4). In summary, our results show that miRNAs in CSF are both free-floating and associated with EVs, on the surface of these vesicles or inside them.
Figure 4
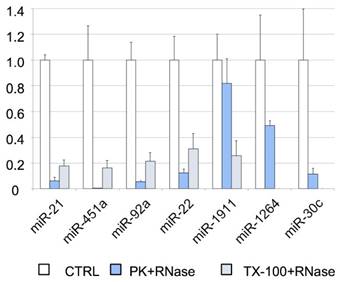
RNase protection assay. Relative quantification (with respect to ath-miR-159a) of each miRNA evaluated by RT-qPCR. The positive control (CTRL) shows the total abundance of each miRNA in this pool of samples. The samples were also treated with proteinase K and RNase A (PK+RNase) or Triton X-100 and RNase A (TX-100+RNase) to examine the association of miRNAs with the vesicles (and their location inside the vesicles or on their surface). The three conditions were assessed in triplicate.
CSF miRNA profiling using smallRNAseq
The methods identifying the majority of the eight reference miRNAs, using RT-qPCR (Figure 2), were further analyzed. We employed smallRNAseq to establish which of these techniques could detect the largest number of miRNAs (NOR, INV, or PAR). The fractions F03 and the F09 of the SEC were also sequenced. We selected the F03 since it contained the largest CD63 exosome population as shown by the Western blot analysis (Figure 3A), to identify miRNAs enriched in the exosomal fraction. F09 was also sequenced as a non-vesicular fraction for the comparison with F03. As expected, our results showed that different protocols yielded a different number of reads (Table S1).
The smallRNAseq data normalization remains a hot topic that still needs to be addressed. Several approaches have been evaluated. For example, adding a synthetic oligonucleotide during RNA extraction might serve as an indicator of technical variability. Here we spiked with the cel-miR-39 after CSF denaturing process; however, the amounts of the cel-miR-39 oligonucleotide recovered after smallRNAseq were highly variable (in raw reads, NOR= 1,421-2,914; INV= 1,450-3,083; PAR= 676-933; F03= 285,077-1,502,484; and F09= 249-647). Another normalization approach employs non-variable small RNAs as endogenous controls. To date, several such miRNAs have been proposed to normalize data in RT-qPCR experiments involving CSF (let-7c, miR-21, miR-24, miR-99b, miR-125, miR-328, miR-1274, RNU6B, and RNU44) [8]. Sorensen et al. found the best normalizer as the average Ct value of the 9 miRNAs detected in all samples [31]. However, none of the small RNAs has shown stable levels in all pathological conditions and CSF components [19]. Sorensen et al. used the trimmed mean of M-values normalization (TMM) for NGS data normalization [31, 44]. Yagi et al. have presented their data in counts per million after applying a normalization factor based on the relative log expression method [15]. In other words, there is no standard normalization strategy [20]. Establishing a common approach is crucial if we are to make unbiased comparisons between studies [8].
Overall, 281 different miRNAs were identified (the sum of all unique miRNAs detected in our study), and the FASTQ data were made available in GEO (accession number GSE122068). Our comparisons showed that NOR and INV methods identified the largest number of miRNAs (238 and 234, respecttively). Of these, 198 were detected by both methods. However, NOR identified a subpopulation of miRNAs that were not detectable by INV and vice versa (35 and 30 miRNAs, respectively) (Figure 5 and Figure S2). Interestingly, one of the EV-enriched methods, the INV, revealed a 30‑miRNAs subpopulation not detectable by the other methods (Table S2). PAR identified 170 miRNAs, and only 7 of them were exclusively detected by this method. In the SEC fractions F03 and F09, 60 and 67 miRNAs were detected, respectively (Figure 5). Of these, 48 miRNAs were common for the two fractions (Figure 5 and Table S3). However, we identified a subset of 12 miRNAs in the vesicular fraction (F03) not found in the supernatant (F09) that could be considered vesicle-associated miRNAs (Figure 6).
It is remarkable that all the miRNAs detected in the SEC fractions were also found using the NOR and INV protocols (Figure S2). We can conclude that both the NOR and INV protocols are suitable for analyzing large catalogs of vesicular and non-vesicular miRNAs in small CSF samples from infants.
We compared our smallRNAseq data with the data of Yagi et al. (Figure S1B). We identified 86 out of the 92 miRNAs found by these authors after applying our cut-off criterion (10 or more counts) (Figures S1B and S1C). For the detection of exosomal miRNAs, NOR and INV were the methods that best harvested the Yagi's exosome-associated miRNAs from only 200 µL of fluid (78/85 and 77/85, respectively). However, we failed to detect several miRNAs found by Yagi (NOR = 7/85 and INV = 8/85) (Figure S1C). These miRNAs were detected at low levels in the study of Yagi et al. even though they used 7-mL samples of the fluid (all of them obtained less than 65 raw reads). Their low abundance is the most likely reason for missing these molecules in small-volume samples. By contrast, we identified a large number of miRNAs that Yagi et al. have not detected, using NOR and INV (160 and 157, respectively). This suggests that these protocols perform better than the UC method used by Yagi. However, our results should be interpreted with caution since those authors have analyzed samples from healthy adults (aged 37-79) rather than from infants. Therefore, the discrepancies between the two sets of data might be due to biological variability among subjects, apart from the differences between the protocols. Thus, further studies using samples from healthy infants are needed to confirm our results.
Reproducibility assessment
To test the reproducibility of the RT-qPCR assays, the coefficient of variation (CV, %) was calculated for each of the eight reference miRNA and method (standard deviation/mean of quantification, relative to ath-miR-159a)*100. Only the miRNAs detected in all the replicas were considered. NOR had the lowest coefficient of variation (25.6%), followed by INV and PAR (33.0 and 40.5%, respectively). The results for spiked-in cel-miR-39 showed the variability of 15.3% when using NOR. By contrast, in this case, INV showed the highest variability (69.5%) and PAR method was not considered since it only detected this miRNA in 6 out of 10 replicas (Table 1).
Figure 5
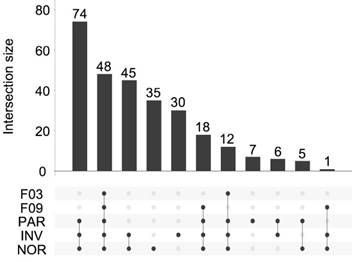
UpSet plot showing the total set size and overlaps between the 281 unique miRNAs and those isolated by each method (PAR, INV, and NOR) or found in the F03 and F09 fractions of the SEC. The number of common miRNAs detected by each method is indicated on the y-axis. The shaded circles connected by solid lines in the lower panel show the intersecting miRNA datasets.
Figure 6
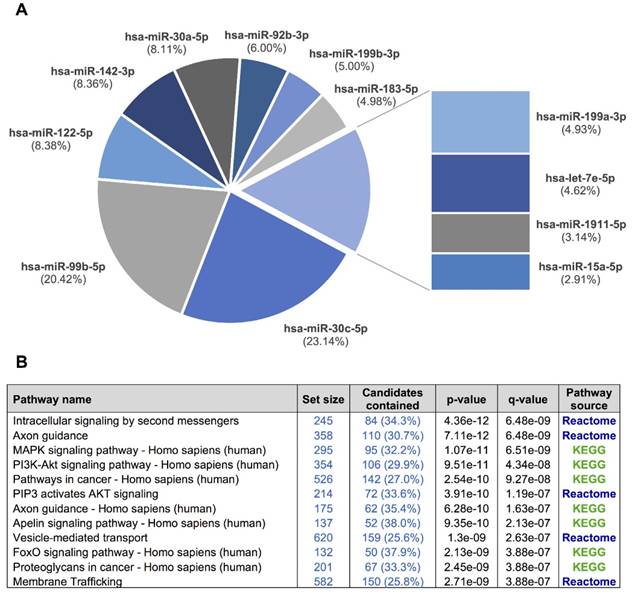
A, a pie chart showing the 12 miRNAs detected in the exosomal fraction but not in the F09 fraction of the size-exclusion chromatography. B, the most representative pathways predicted by ConsensusPathDB considering the 3,638 target genes of these 12 miRNAs.
Table 1
Coefficients of variation (CV, %) for each miRNA and method evaluated.
| miRNA | PAR | INV | NOR | |||||
|---|---|---|---|---|---|---|---|---|
| N | CV (%) | N | CV (%) | N | CV (%) | |||
| cel-miR-39 | 10 | 69.5 | 10 | 15.3 | ||||
| hsa-miR-21-5p | 10 | 39.1 | 10 | 22.2 | 10 | 30.5 | ||
| hsa-miR-451a | 10 | 35.4 | 10 | 24.0 | 10 | 24.2 | ||
| hsa-miR-92a-3p | 10 | 36.6 | 10 | 27.4 | 10 | 30.8 | ||
| hsa-miR-22-3p | 10 | 52.7 | 10 | 21.9 | 10 | 13.9 | ||
| hsa-miR-1911-5p | ||||||||
| hsa-miR-1264 | ||||||||
| hsa-miR-30c-5p | 10 | 38.7 | 10 | 39.1 | ||||
| hsa-miR-34b-3p | ||||||||
| Mean CV (%) | 40.5 ± 7.0 | 33.0 ± 20.5 | 25.6 ± 9.8 | |||||
NOR had the lowest coefficient of variation, followed by the INV and PAR methods. Only the cases in which the miRNAs were detected in all 10 replicates were considered. Abbreviations: number of replicates analyzed (N), mirVana PARIS Kit from Ambion (PAR), Total Exosome Isolation Reagent from Invitrogen (INV), and Plasma/Serum RNA Purification Kit from Norgen (NOR).
The differences between RT-qPCR and smallRNAseq data were also examined. Although most of the miRNAs found using RT-qPCR were also identified by smallRNAseq, miR‑34b-3p was detected by INV and NOR only in 2/3 of the replicates. Similarly, in F03, miR-1264 was found in only 2/3 of the replicates. After applying our detection criterion (10 or more counts), miR-1264 and miR-34b-3p were treated as non-detected. However, these two miRNAs were identified by RT-qPCR when the samples were processed using PAR, INV, and NOR protocols (Figure 2). This confirmed the opinion that RT-qPCR is suitable for low copy number RNA samples and samples with undefined normalizer molecules, such as the CSF [8]. The correlation coefficients for the six miRNAs were 0.81 for PAR, 0.84 for NOR, and 0.92 for INV, showing good agreement between both strategies (Figure 7). Our results are in accord with the report of Yagi et al. who also evaluated the consistency of these techniques [15].
Gene target prediction and pathway enrichment analysis
We used our smallRNAseq data to predict the target genes and the related pathways in which they might be involved. We identified 9,952 target genes for the 281 miRNAs detected in our CSF study by smallRNAseq, which were then used to perform pathway enrichment analyses employing the default collections of KEGG, Reactome, and BioCarta. The three most significant pathways were axon guidance (p = 2.83e-23), membrane trafficking (p = 5.05e-22), and vesicle-mediated transport (p = 7.36e-21). A complete list of predicted pathways is shown in Table S4. The membrane trafficking and vesicle-mediated transport pathways are involved in the release and internalization of various components from the extracellular space by the EVs. The axon guidance pathway was also overrepresented. The axon guidance process is an important event in neurodevelopment; it is related to neuron maturation and the formation of neuronal connections in the first years of life [57]. We repeated this analysis using the 3,638 target genes of the 12 miRNAs detected in the exosomal fraction (F03) but not in the F09 (Figure 6). Overall, the identified pathways are consistent with the source of samples for our study, in which the EV-associated miRNAs were analyzed in a cohort of infants from 0 to 7 years old. Our results indicate that the analysis of miRNAs in CSF fluid might become a useful, minimally invasive tool to examine the physiological and pathological processes affecting brain performance.
NOR as a potential tool in CSF diagnosis
Overall, the NOR and INV methods obtained the best results in the two analyses performed (RT-qPCR and smallRNAseq). The main difference between NOR and INV is the miRNA isolation procedure. Two important aims of standardization should be the simplicity and reproducibility of the protocol. Among the methods tested here, NOR used the easiest and shortest protocol (as can be seen in Figure S3). It also was the most reproducible method when tested with RT-qPCR, and showed a good correlation between RT-qPCR and smallRNAseq techniques. Moreover, this protocol detected more miRNAs than the INV. Therefore, this might be the best method to analyze small-volume samples of CSF.
Abbreviations
CSF: cerebrospinal fluid; CPDB: ConsensusPathDB web tool; EVs: extracellular vesicles; F01-F12: fractions 1 to 12 of the size-exclusion chromatography; GBM: glioblastoma; GEO: Gene Expression Omnibus; INV: Total exosome isolation reagent; KEGG: Kyoto Encyclopedia of Genes and Genomes; miRNA: microRNA; NOR: Plasma/Serum RNA Purification Kit; NSE: neuron-specific enolase; PAR: mirVana PARIS Kit; QIA: miRCURY Exosome Isolation Kit - Cells, Urine and CSF; RT-qPCR: real-time PCR; SEC: size-exclusion chromatography; smallRNAseq: small RNA sequencing; TX-100: Triton X-100; UC: ultracentrifugation.
Figure 7
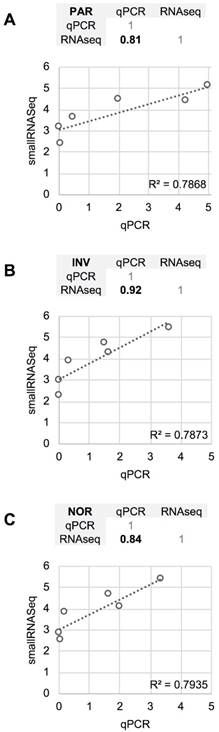
Comparison between the quantification (relative to ath-miR-159a) obtained using RT-qPCR and the normalized smallRNAseq counts (represented on a logarithmic scale) for six reference miRNAs considered and method compared. A, mirVana PARIS Kit from Ambion. B, Total Exosome Isolation Reagent from Invitrogen. C, Plasma/Serum RNA Purification Kit from Norgen. The miR-1264 and miR-34b-3p were not considered. The correlation coefficients between RT-qPCR and smallRNAseq data for each method are also shown (upper panel for each method).
Acknowledgements
We extend special thanks to the Department of Pediatric Emergency team at Cruces University Hospital for their collaboration in obtaining clinical samples: Yordana Acedo, Pilar Alonso, Beatriz Azkunaga, Yolanda Ballestero, Elena Daghoum, Ana Fernandez, Iker Gangoiti, Silvia Garcia, Borja Gomez, María Gonzalez, Edurne Lopez, Roser Martinez, Santiago Mintegi, Ohiane Morientes, Mikel Olabarri, Natalia Paniagua, and María Angeles Ruiz.
Funding
This work was supported by the Basque Government [IT989-16], the Spanish Ministry of Economy and Competitiveness MINECO [SAF2015-66312], and the Ramon Areces Foundation [FRA-17-JMF]. We thank MINECO for the REDIEX (Spanish Excellence Network in Exosomes) and the Severo Ochoa Excellence Accreditation (SEV-2016-0644). Funding for open access charge: Severo Ochoa Excellence Accreditation (SEV-2016-0644).
Supplementary Material
Supplementary figures and tables.
Competing Interests
The authors have declared that no competing interest exists.
References
1. Cunha BA. Cerebrospinal fluid (CSF) lactic acid levels: A rapid and reliable way to differentiate viral from bacterial meningitis or concurrent viral/bacterial meningitis. J Clin Microbiol. 2012;50:211
2. El Kadmiri N, Said N, Slassi I. et al. Biomarkers for alzheimer disease: Classical and novel candidates' review. Neuroscience. 2018;370:181-90
3. Saman S, Kim W, Raya M. et al. Exosome-associated tau is secreted in tauopathy models and is selectively phosphorylated in cerebrospinal fluid in early alzheimer disease. J Biol Chem. 2012;287:3842-49
4. Manek R, Moghieb A, Yang Z. et al. Protein biomarkers and neuroproteomics characterization of microvesicles/exosomes from human cerebrospinal fluid following traumatic brain injury. Mol Neurobiol. 2018;55:6112-28
5. Nevel KS, Wilcox JA, Robell LJ. et al. The utility of liquid biopsy in central nervous system malignancies. Curr Oncol Rep. 2018;20:60
6. Siravegna G, Marsoni S, Siena S. et al. Integrating liquid biopsies into the management of cancer. Nat Rev Clin Oncol. 2017;14:531-48
7. Wang Y, Springer S, Zhang M. et al. Detection of tumor-derived DNA in cerebrospinal fluid of patients with primary tumors of the brain and spinal cord. Proc Natl Acad Sci USA. 2015;112:9704-09
8. Kopkova A, Sana J, Fadrus P. et al. Cerebrospinal fluid microRNAs as diagnostic biomarkers in brain tumors. Clin Chem Lab Med. 2018;56:869-79
9. Drusco A, Bottoni A, Lagana A. et al. A differentially expressed set of microRNAs in cerebro-spinal fluid (CSF) can diagnose CNS malignancies. Oncotarget. 2015;6:20829-39
10. Bartel DP. MicroRNAs: Genomics, biogenesis, mechanism, and function. Cell. 2004;116:281-97
11. Johanson TM, Skinner JP, Kumar A. et al. The role of microRNAs in lymphopoiesis. Int J Hematol. 2014;100:246-53
12. Calin GA, Sevignani C, Dumitru CD. et al. Human microRNA genes are frequently located at fragile sites and genomic regions involved in cancers. Proc Natl Acad Sci U S A. 2004;101:2999-3004
13. Teplyuk NM, Mollenhauer B, Gabriely G. et al. MicroRNAs in cerebrospinal fluid identify glioblastoma and metastatic brain cancers and reflect disease activity. Neuro Oncol. 2012;14:689-700
14. Baraniskin A, Kuhnhenn J, Schlegel U. et al. Identification of microRNAs in the cerebrospinal fluid as biomarker for the diagnosis of glioma. Neuro Oncol. 2012;14:29-33
15. Yagi Y, Ohkubo T, Kawaji H. et al. Next-generation sequencing-based small RNA profiling of cerebrospinal fluid exosomes. Neurosci Lett. 2017;636:48-57
16. Yanez-Mo M, Siljander PR, Andreu Z. et al. Biological properties of extracellular vesicles and their physiological functions. J Extracell Vesicles. 2015;4:27066
17. Lobb RJ, Lima LG, Moller A. Exosomes: Key mediators of metastasis and pre-metastatic niche formation. Semin Cell Dev Biol. 2017;67:3-10
18. Jung KO, Youn H, Lee CH. et al. Visualization of exosome-mediated miR-210 transfer from hypoxic tumor cells. Oncotarget. 2017;8:9899-910
19. Akers JC, Hua W, Li H. et al. A cerebrospinal fluid microRNA signature as biomarker for glioblastoma. Oncotarget. 2017;8:68769-779
20. Nagaraj S, Zoltowska KM, Laskowska-Kaszub K. et al. microRNA diagnostic panel for alzheimer's disease and epigenetic trade-off between neurodegeneration and cancer. Ageing Res Rev. 2019;49:125-43
21. Verheul C, Kleijn A, Lamfers MLM. Cerebrospinal fluid biomarkers of malignancies located in the central nervous system. Handb Clin Neurol. 2017;146:139-69
22. Akers JC, Ramakrishnan V, Kim R. et al. miRNA contents of cerebrospinal fluid extracellular vesicles in glioblastoma patients. J Neurooncol. 2015;123:205-16
23. Shi R, Wang PY, Li XY. et al. Exosomal levels of miRNA-21 from cerebrospinal fluids associated with poor prognosis and tumor recurrence of glioma patients. Oncotarget. 2015;6:26971-81
24. Tietje A, Maron KN, Wei Y. et al. Cerebrospinal fluid extracellular vesicles undergo age dependent declines and contain known and novel non-coding RNAs. PLoS One. 2014;9:e113116
25. Liu CG, Song J, Zhang YQ. et al. MicroRNA-193b is a regulator of amyloid precursor protein in the blood and cerebrospinal fluid derived exosomal microRNA-193b is a biomarker of alzheimer's disease. Mol Med Rep. 2014;10:2395-400
26. Riancho J, Vazquez-Higuera JL, Pozueta A. et al. MicroRNA profile in patients with alzheimer's disease: Analysis of miR-9-5p and miR-598 in raw and exosome enriched cerebrospinal fluid samples. J Alzheimers Dis. 2017;57:483-91
27. Goswami S, Banerjee A, Kumari B. et al. Differential expression and significance of circulating microRNAs in cerebrospinal fluid of acute encephalitis patients infected with japanese encephalitis virus. Mol Neurobiol. 2017;54:1541-51
28. Welton JL, Loveless S, Stone T. et al. Cerebrospinal fluid extracellular vesicle enrichment for protein biomarker discovery in neurological disease; multiple sclerosis. J Extracell Vesicles. 2017;6:1369805
29. Gui Y, Liu H, Zhang L. et al. Altered microRNA profiles in cerebrospinal fluid exosome in parkinson disease and alzheimer disease. Oncotarget. 2015;6:37043-53
30. Bache S, Rasmussen R, Rossing M. et al. MicroRNA changes in cerebrospinal fluid after subarachnoid hemorrhage. Stroke. 2017;48:2391-8
31. Sorensen SS, Nygaard AB, Carlsen AL. et al. Elevation of brain-enriched miRNAs in cerebrospinal fluid of patients with acute ischemic stroke. Biomark Res. 2017;5:24
32. You WD, Tang QL, Wang L. et al. Alteration of microRNA expression in cerebrospinal fluid of unconscious patients after traumatic brain injury and a bioinformatic analysis of related single nucleotide polymorphisms. Chin J Traumatol. 2016;19:11-5
33. Denk J, Boelmans K, Siegismund C. et al. MicroRNA profiling of CSF reveals potential biomarkers to detect alzheimer`s disease. PLoS One. 2015;10:e0126423
34. van Harten AC, Mulders J, Scheltens P. et al. Differential expression of microRNA in cerebrospinal fluid as a potential novel biomarker for alzheimer's disease. J Alzheimers Dis. 2015;47:243-52
35. Quintana E, Ortega FJ, Robles-Cedeno R. et al. miRNAs in cerebrospinal fluid identify patients with MS and specifically those with lipid-specific oligoclonal IgM bands. Mult Scler. 2017;23:1716-26
36. Burgos K, Malenica I, Metpally R. et al. Profiles of extracellular miRNA in cerebrospinal fluid and serum from patients with alzheimer's and parkinson's diseases correlate with disease status and features of pathology. PLoS One. 2014;9:e94839
37. Baraniskin A, Kuhnhenn J, Schlegel U. et al. Identification of microRNAs in the cerebrospinal fluid as marker for primary diffuse large B-cell lymphoma of the central nervous system. Blood. 2011;117:3140-6
38. Bhomia M, Balakathiresan NS, Wang KK. et al. A panel of serum MiRNA biomarkers for the diagnosis of severe to mild traumatic brain injury in humans. Sci Rep. 2016;6:28148
39. Bergman P, Piket E, Khademi M. et al. Circulating miR-150 in CSF is a novel candidate biomarker for multiple sclerosis. Neurol Neuroimmunol Neuroinflamm. 2016;3:e219
40. Royo F, Schlangen K, Palomo L. et al. Transcriptome of extracellular vesicles released by hepatocytes. PLoS One. 2013;8:e68693
41. Shelke GV, Lasser C, Gho YS. et al. Importance of exosome depletion protocols to eliminate functional and RNA-containing extracellular vesicles from fetal bovine serum. J Extracell Vesicles. 2014;3:10.3402 /jev.v3.24783
42. Langmead B, Trapnell C, Pop M. et al. Ultrafast and memory-efficient alignment of short DNA sequences to the human genome. Genome Biol. 2009;10:R25-2009 -10-3-r25
43. Harrow J, Frankish A, Gonzalez JM. et al. GENCODE: The reference human genome annotation for the ENCODE project. Genome Res. 2012;22:1760-74
44. Robinson MD, Oshlack A. A scaling normalization method for differential expression analysis of RNA-seq data. Genome Biol. 2010;11:R25-2010 -11-3-r25
45. Lex A, Gehlenborg N, Strobelt H. et al. UpSet: Visualization of intersecting sets. IEEE Trans Vis Comput Graph. 2014;20:1983-92
46. Dweep H, Gretz N. miRWalk2.0: A comprehensive atlas of microRNA-target interactions. Nat Methods. 2015;12:697
47. Kamburov A, Stelzl U, Lehrach H. et al. The ConsensusPathDB interaction database: 2013 update. Nucleic Acids Res. 2013;41:D793-800
48. Kanehisa M, Furumichi M, Tanabe M. et al. KEGG: New perspectives on genomes, pathways, diseases and drugs. Nucleic Acids Res. 2017;45:D353-61
49. Fabregat A, Jupe S, Matthews L. et al. The reactome pathway knowledgebase. Nucleic Acids Res. 2018;46:D649-55
50. Meunier J, Lemoine F, Soumillon M. et al. Birth and expression evolution of mammalian microRNA genes. Genome Res. 2013;23:34-45
51. Monguio-Tortajada M, Roura S, Galvez-Monton C. et al. Nanosized UCMSC-derived extracellular vesicles but not conditioned medium exclusively inhibit the inflammatory response of stimulated T cells: Implications for nanomedicine. Theranostics. 2017;7:270-84
52. Gamez-Valero A, Monguio-Tortajada M, Carreras-Planella L. et al. Size-exclusion chromatography-based isolation minimally alters extracellular vesicles' characteristics compared to precipitating agents. Sci Rep. 2016;6:33641
53. Boing AN, van der Pol E, Grootemaat AE. et al. Single-step isolation of extracellular vesicles by size-exclusion chromatography. J Extracell Vesicles. 2014;3:10.3402 /jev.v3.23430
54. Reiber H. Dynamics of brain-derived proteins in cerebrospinal fluid. Clin Chim Acta. 2001;310:173-86
55. Haque A, Polcyn R, Matzelle D. et al. New insights into the role of neuron-specific enolase in neuro-inflammation, neurodegeneration, and neuroprotection. Brain Sci. 2018;8:10.3390 /brainsci8020033
56. Yan T, Skaftnesmo KO, Leiss L. et al. Neuronal markers are expressed in human gliomas and NSE knockdown sensitizes glioblastoma cells to radiotherapy and temozolomide. BMC Cancer. 2011;11:524
57. Anckar J, Bonni A. Regulation of neuronal morphogenesis and positioning by ubiquitin-specific proteases in the cerebellum. PLoS One. 2015;10:e0117076
Author contact
![]() Corresponding authors: Juan Manuel Falcón-Pérez, Phone: 0034944061319; email: jfalcones or Endika Prieto-Fernández, phone: 0034946012951; email: endika.prietoeus or Africa Garcia-Orad, phone: 0034946012909; email: africa.garciaoradeus.
Corresponding authors: Juan Manuel Falcón-Pérez, Phone: 0034944061319; email: jfalcones or Endika Prieto-Fernández, phone: 0034946012951; email: endika.prietoeus or Africa Garcia-Orad, phone: 0034946012909; email: africa.garciaoradeus.
Citation styles
APA
Prieto-Fernández, E., Aransay, A.M., Royo, F., González, E., Lozano, J.J., Santos-Zorrozua, B., Macias-Camara, N., González, M., Garay, R.P., Benito, J., Garcia-Orad, A., Falcón-Pérez, J.M. (2019). A Comprehensive Study of Vesicular and Non-Vesicular miRNAs from a Volume of Cerebrospinal Fluid Compatible with Clinical Practice. Theranostics, 9(16), 4567-4579. https://doi.org/10.7150/thno.31502.
ACS
Prieto-Fernández, E.; Aransay, A.M.; Royo, F.; González, E.; Lozano, J.J.; Santos-Zorrozua, B.; Macias-Camara, N.; González, M.; Garay, R.P.; Benito, J.; Garcia-Orad, A.; Falcón-Pérez, J.M. A Comprehensive Study of Vesicular and Non-Vesicular miRNAs from a Volume of Cerebrospinal Fluid Compatible with Clinical Practice. Theranostics 2019, 9 (16), 4567-4579. DOI: 10.7150/thno.31502.
NLM
Prieto-Fernández E, Aransay AM, Royo F, González E, Lozano JJ, Santos-Zorrozua B, Macias-Camara N, González M, Garay RP, Benito J, Garcia-Orad A, Falcón-Pérez JM. A Comprehensive Study of Vesicular and Non-Vesicular miRNAs from a Volume of Cerebrospinal Fluid Compatible with Clinical Practice. Theranostics 2019; 9(16):4567-4579. doi:10.7150/thno.31502. https://www.thno.org/v09p4567.htm
CSE
Prieto-Fernández E, Aransay AM, Royo F, González E, Lozano JJ, Santos-Zorrozua B, Macias-Camara N, González M, Garay RP, Benito J, Garcia-Orad A, Falcón-Pérez JM. 2019. A Comprehensive Study of Vesicular and Non-Vesicular miRNAs from a Volume of Cerebrospinal Fluid Compatible with Clinical Practice. Theranostics. 9(16):4567-4579.
This is an open access article distributed under the terms of the Creative Commons Attribution License (https://creativecommons.org/licenses/by/4.0/). See http://ivyspring.com/terms for full terms and conditions.